|
|
市場調査レポート
商品コード
1669753
スマート商業ビルにおけるIoTデバイス(2025年~2030年)- デバイス予測、普及、メタ動向分析IoT Devices in Smart Commercial Buildings 2025 to 2030 - Device Projections, Adoption & Meta-Trends Analysis |
||||||
|
|||||||
|
|||||||

| スマート商業ビルにおけるIoTデバイス(2025年~2030年)- デバイス予測、普及、メタ動向分析 |
|
出版日: 2025年03月05日
発行: Memoori
ページ情報: 英文 243 Pages, 15 Charts and Tables, Spreadsheet, Presentation Slides
納期: 即日から翌営業日
|

全表示
- 概要
- 図表
- 目次
商業ビルセクターは、2030年までにIoTの導入が2倍以上の41億2,000万件に達すると予測され、技術的な変曲点に立っています。
AIとIoTシステムの統合は、これまでにない機能を生み出しつつあり、スマートビルにおけるAIソリューションの市場は、CAGR25.5%で成長し、2028年には65億米ドルに達すると予測されています。セキュリティの脆弱性は強固なフレームワークを必要とします。最近大きな話題となった事件は、統合セキュリティ戦略の重要性を浮き彫りにし、次のようなセキュリティ戦略の採用を後押ししています。
当レポートでは、スマート商業ビルにおけるIoTデバイス市場について調査し、オフィス、小売、ホスピタリティ、データセンターなど、商業用不動産の各分野におけるデバイスの普及、テクノロジーの採用パターン、実装フレームワークなどについて提供しています。
サンプルビュー
本レポートの詳細なセグメンテーション分析とテクノロジー・ロードマップは、複雑なスマートビルディングの状況をナビゲートし、当面のビジネスチャンスを見極めると同時に、以下のような長期的なシフトに備えるための重要なガイダンスを提供します。
サンプルビュー
目次
序文
エグゼクティブサマリー
第1章 IoTエコシステム
- IoTの定義
- IoTテクノロジースタック
- モノのインターネットの構築
第2章 IoTの構築におけるAIの役割
- IoTセンサーネットワークにおけるAIの進化
- AIとIoTの融合
- AI投資と導入の動向
- AIハードウェアと処理
- エッジAI
- 実装の課題と戦略的推奨事項
第3章 IoTテクノロジーの情勢
- IoTデバイスの予測
- アプリケーション別IoTデバイス
- IoTセンサー接続
- 商業ビル業界別のIoTデバイス
- 地域別IoTデバイス
- センサー技術の準備と成熟度
- IoTデバイスのイノベーションと新たな機会
第4章 実装の課題と解決策
- システム統合と相互運用性
- セキュリティ、プライバシー、データの所有権
- コストの正当化とビジネスケース
- デバイス管理と可視性
- 従来の建築システムの改修
第5章 メタトレンド分析
- 市場投資と採用動向
- マクロ経済見通し
- 地政学的動向
- 不動産動向
- CRE建設の見通し
- 環境・社会・ガバナンスの動向(ESG)
- IoTスキルと求人市場
第6章 標準とプロトコル
- オープンスタンダードの重要性
- ビルディングオートメーションプロトコル
- アプリケーション層プロトコル
- IoTセキュリティ標準
- データモデルとフレームワーク
- 標準の統合と相互運用性の取り組み
List of Charts and Figures
- Fig 1.1: The IoT Technology Stack
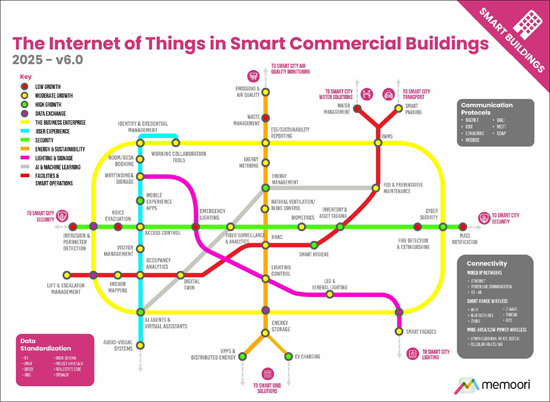
- Fig 1.2: The Internet of Things in Smart Commercial Buildings 2025 v6.0
- Fig 2.1: AI & Machine Learning Techniques and their Smart Building Applications
- Fig 3.1: Global IoT Device Projections. Installed Base of Connected Devices (Bn) 2023 to 2030
- Fig 3.2: Installed Base of IoT Devices in Commercial Smart Buildings 2022 to 2030 (Mn)
- Fig 3.3: Commercial Building IoT Devices by Application 2024 to 2030 (Mn)
- Fig 3.4: Commercial Smart Building IoT Devices by Connectivity Type 2024 to 2030 (Mn)
- Fig 3.5: Commercial Smart Building IoT Devices by Vertical 2024 to 2030 (Mn)
- Fig 3.6: Commercial Smart Building IoT Devices by Region 2024 to 2030 (Mn)
- Fig 3.7: Smart Building IoT Research Trends 2016 to 2023, Number of Publications per Year
- Fig 3.8: Smart Building IoT Patents Trends 2016 to 2024, Number of Patents per Year
- Fig 5.1: IoT Deployment Plans
- Fig 5.2: Quarterly Gross Leasing Volumes for Offices by Region
- A1 Comparative Analysis of IoT Sensing Technologies by Application
The Definitive Market Report on IoT Devices & Connectivity Transforming Commercial Real Estate through 2030
The commercial building sector stands at a technological inflection point, with IoT deployments projected to more than double to 4.12 billion by 2030. Our new market assessment provides unprecedented insights into device proliferation, technology adoption patterns, and implementation frameworks across commercial real estate verticals including offices, retail, hospitality, and data centers.
Based on primary research and rigorous data analysis, this report delivers the market intelligence needed to navigate the rapidly evolving smart building landscape. It examines the convergence of IT and OT systems, emerging connectivity protocols, AI integration, and critical security considerations that are fundamentally reshaping how commercial buildings operate and interact with occupants.
The research includes a spreadsheet with all the data tables AND a presentation file with high-resolution versions of the charts.
SAMPLE VIEW
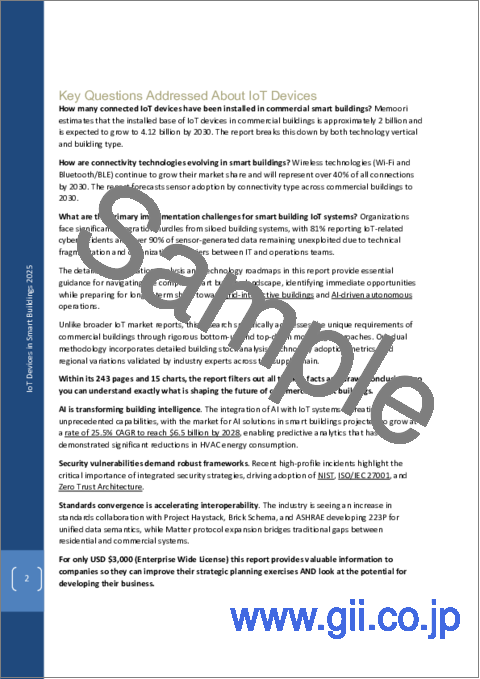
KEY QUESTIONS ADDRESSED ABOUT IOT DEVICES
- How many connected IoT devices have been installed in commercial smart buildings? Memoori estimates that the installed base of IoT devices in commercial buildings is approximately 2 billion and is expected to grow to 4.12 billion by 2030. The report breaks this down by both technology vertical and building type.
- How are connectivity technologies evolving in smart buildings? Wireless technologies (Wi-Fi and Bluetooth/BLE) continue to grow their market share and will represent over 40% of all connections by 2030. The report forecasts sensor adoption by connectivity type across commercial buildings to 2030.
- What are the primary implementation challenges for smart building IoT systems? Organizations face significant integration hurdles from siloed building systems, with 81% reporting IoT-related cyber incidents and over 90% of sensor-generated data remaining unexploited due to technical fragmentation and organizational barriers between IT and operations teams.
The detailed segmentation analysis and technology roadmaps in this report provide essential guidance for navigating the complex smart building landscape, identifying immediate opportunities while preparing for longer-term shifts toward grid-interactive buildings and AI-driven autonomous operations.
Unlike broader IoT market reports, this research specifically addresses the unique requirements of commercial buildings through rigorous bottom-up and top-down modeling approaches. Our dual methodology incorporates detailed building stock analysis, technology adoption metrics, and regional variations validated by industry experts across the supply chain.
WITHIN ITS 243 PAGES AND 15 CHARTS AND TABLES, THE REPORT FILTERS OUT ALL THE KEY FACTS AND DRAWS CONCLUSIONS, SO YOU CAN UNDERSTAND EXACTLY WHAT IS SHAPING THE FUTURE OF COMMERCIAL SMART BUILDINGS.
- AI is transforming building intelligence. The integration of AI with IoT systems is creating unprecedented capabilities, with the market for AI solutions in smart buildings projected to grow at a rate of 25.5% CAGR to reach $6.5 billion by 2028, enabling predictive analytics that has demonstrated significant reductions in HVAC energy consumption.
- Security vulnerabilities demand robust frameworks. Recent high-profile incidents highlight the critical importance of integrated security strategies, driving adoption of NIST, ISO/IEC 27001, and Zero Trust Architecture.
- Standards convergence is accelerating interoperability. The industry is seeing an increase in standards collaboration with Project Haystack, Brick Schema, and ASHRAE developing 223P for unified data semantics, while Matter protocol expansion bridges traditional gaps between residential and commercial systems.
This report provides valuable information to companies so they can improve their strategic planning exercises AND look at the potential for developing their business.
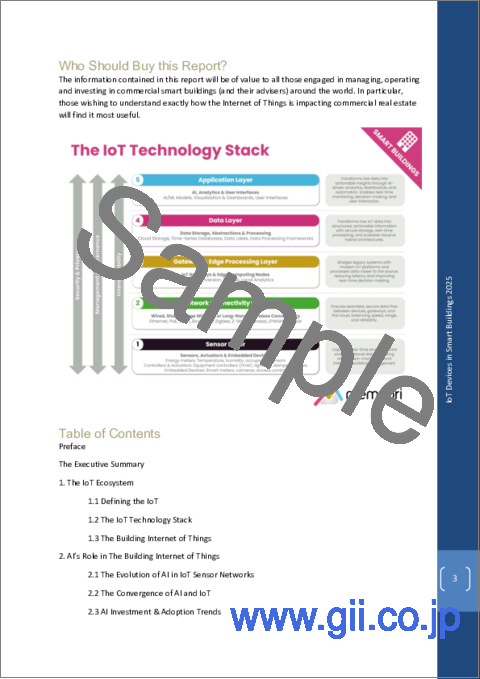
WHO SHOULD BUY THIS REPORT?
The information contained in this report will be of value to all those engaged in managing, operating, and investing in commercial smart buildings (and their advisers) around the world. In particular, those wishing to understand exactly how the Internet of Things is impacting commercial real estate will find it most useful.
SAMPLE VIEW
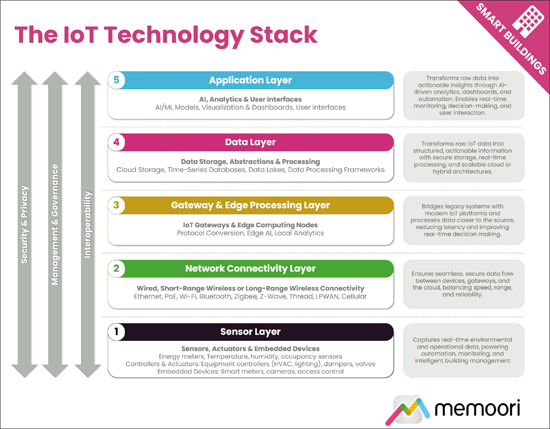
The model above illustrates the core components of the IoT technology stack, showing the five main layers together with three cross-cutting considerations, Security & Privacy, Management & Governance, and Interoperability.
Table of Contents
Preface
The Executive Summary
1. The IoT Ecosystem
- 1.1. Defining the IoT
- 1.2. The IoT Technology Stack
- 1.3. The Building Internet of Things
2. AI's Role in The Building Internet of Things
- 2.1. The Evolution of AI in IoT Sensor Networks
- 2.2. The Convergence of AI and IoT
- 2.3. AI Investment & Adoption Trends
- 2.4. AI Hardware & Processing
- 2.5. Edge AI
- 2.6. Implementation Challenges & Strategic Recommendations
3. The IoT Technology Landscape
- 3.1. IoT Device Projections
- 3.2. IoT Devices by Application
- 3.3. IoT Sensor Connectivity
- 3.4. IoT Devices by Commercial Building Vertical
- 3.5. IoT Devices by Region
- 3.6. Sensor Technology Readiness & Maturity
- 3.7. IoT Device Innovations & Emerging Opportunities
4. Implementation Challenges & Solutions
- 4.1. System Integration & Interoperability
- 4.2. Security, Privacy & Data Ownership
- 4.3. Cost Justifications & Business Case
- 4.4. Device Management & Visibility
- 4.5. Retrofitting Legacy Building Systems
5. Meta Trend Analysis
- 5.1. Market Investment & Adoption Trends
- 5.2. Macro Economic Outlook
- 5.3. Geopolitical Trends
- 5.4. Real Estate Trends
- 5.5. CRE Construction Outlook
- 5.6. Environmental, Social & Governance Trends (ESG)
- 5.7. IoT Skills & Job Markets
6. Standards & Protocols
- 6.1. The Importance of Open Standards
- 6.2. Building Automation Protocols
- 6.3. Application Layer Protocols
- 6.4. IoT Security Standards
- 6.5. Data Models & Frameworks
- 6.6. Standards Convergence & Interoperability Initiatives
