
製油所・石油化学ろ過の世界市場:フィルタータイプ別、用途別、エンドユーザー別、地域別 - 予測(~2030年)
Refinery and Petrochemical Filtration Market by Filter Type (Coalescer Filter, Cartridge Filter, Electrostatic Precipitator, Filter Press, Bag Filters, and Others) Application, End User, and Region - Global Forecast to 2030- 発行日
- ページ情報
- 英文 258 Pages
- 納期
-
即納可能
営業時間内にお支払方法などの確認が取れ次第、Eメールにて納品となります。営業時間: 9:00am - 6:00pm (土日祝除く)。

- 商品コード
- 1804851
- カスタマイズ可能 お客様のご希望に応じて、既存データの加工や未掲載情報(例:国別セグメント)の追加などの対応が可能です。詳細はお問い合わせください。
- 翻訳ツール提供対象 PDF対応AI翻訳ツールの無料貸し出しサービスのご利用が可能です
概要
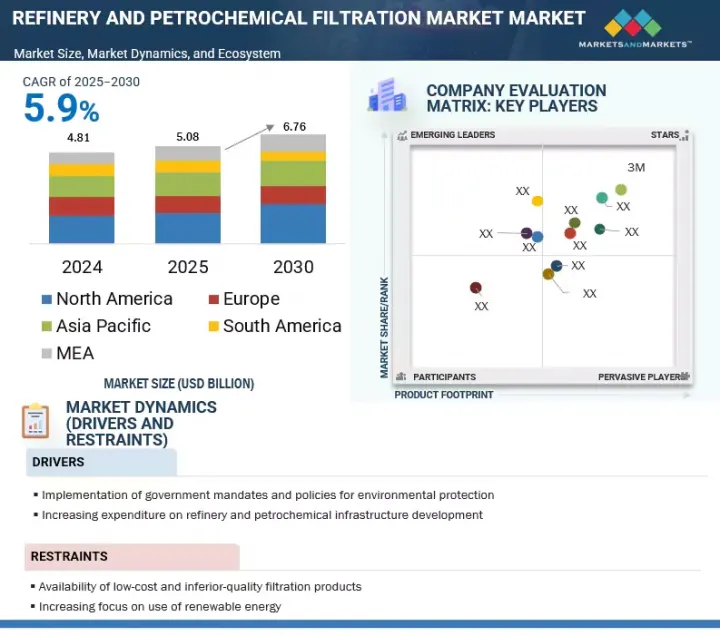
世界の製油所・石油化学ろ過の市場規模は、2025年の50億8,000万米ドルから2030年までに67億6,000万米ドルに達すると予測され、CAGRで5.9%の成長が見込まれます。
| 調査範囲 | |
|---|---|
| 調査対象年 | 2021年~2030年 |
| 基準年 | 2024年 |
| 予測期間 | 2025年~2030年 |
| 単位 | 100万米ドル/10億米ドル |
| セグメント | フィルタータイプ、用途、エンドユーザー |
| 対象地域 | アジア太平洋、北米、欧州、南米、中東・アフリカ |
エネルギー需要の高まりが下流投資の増加を促し、市場成長を後押ししています。しかし、フィルターの頻繁な交換と廃棄が大きな障害となり、経営コストに影響を与え、産業の持続可能性と廃棄物管理に課題をもたらしています。
「石油化学産業が予測期間にもっとも急成長するエンドユーザーとして浮上する見込みです。」
エンドユーザー別では、製油所・石油化学ろ過市場は製油所、石油化学産業に区分されています。石油化学産業におけるインフラ投資の増加は、石油化学ろ過の需要を促進すると予測されています。石油化学プラントへの投資の増加は、経済の発展や人口増加に伴うプラスチック、合成繊維、肥料、化学品などの製品需要の増加によるものです。石油化学プラントの作業員は、原料や最終製品から不純物、汚染物質、粒子を除去するために、バッグフィルター、カートリッジフィルター、メンブレンフィルター、コアレッサーを使用しています。
「液液セグメントが第2位の用途になると推定されます。」
用途別では、石油・ガスの下流部門で重要な役割を果たすため、液液分離セグメントが製油所・石油化学ろ過市場で第2位のシェアを占めています。これはガソリン、ディーゼル、灯油、ジェット燃料から水分を除去し、製品の品質仕様を満たし、腐食を防ぐために不可欠です。この分離プロセスは、触媒や吸着剤を水質汚染から保護し、処理プロセス由来の腐食性物質やアミンのキャリーオーバーを排除し、塩乾燥機やクレータワーなどの機器を保護するのに役立ちます。液液セグメントの高いシェアは、世界的な精製能力の増加、燃料のクリーン化に向けた厳しい規制、効果的な水と不純物の除去による運転効率、製品純度、機器寿命の強化の必要性によってもたらされています。
「アジア太平洋が第2位の製油所・石油化学ろ過市場になると推定されます。」
アジア太平洋は2025年~2030年に第2位の製油所・石油化学ろ過市場になると予測されます。この地域では、石油化学製品の需要の増加により下流部門が成長しています。さらに、この地域の国々は、中東などの地域からの原油供給へのアクセスを可能にする、製油所にとっての戦略的立地を有しています。さらに、この地域の各国政府は、下流部門への外国投資を誘致するための政策やインセンティブを実施しています。これらがアジア太平洋における製油所・石油化学ろ過市場の主な成長促進要因です。
当レポートでは、世界の製油所・石油化学ろ過市場について調査分析し、主な促進要因と抑制要因、競合情勢、将来の動向などの情報を提供しています。
目次
第1章 イントロダクション
第2章 調査手法
第3章 エグゼクティブサマリー
第4章 重要な知見
- 製油所・石油化学ろ過市場の企業にとって魅力的な機会
- 製油所・石油化学ろ過市場:地域別
- 北米の製油所・石油化学ろ過市場:用途別、国別
- 製油所・石油化学ろ過市場:フィルタータイプ別
- 製油所・石油化学ろ過市場:用途別
- 製油所・石油化学ろ過市場:エンドユーザー別
第5章 市場の概要
- イントロダクション
- 市場力学
- 促進要因
- 抑制要因
- 機会
- 課題
- カスタマービジネスに影響を与える動向/混乱
- エコシステム分析
- バリューチェーン分析
- 原材料プロバイダー/サプライヤー
- 製油所・石油化学ろ過システムメーカー
- 販売業者・エンドユーザー
- アフターサービスプロバイダー
- 価格設定の分析
- 置換率
- 技術分析
- 関税と規制の情勢
- 製油所・石油化学ろ過装置に関連する関税
- 規制機関、政府機関、その他の組織
- 製油所・石油化学ろ過に関する規制
- 特許分析
- 貿易分析
- 輸出シナリオ
- 輸入シナリオ
- 主な会議とイベント(2025年~2026年)
- ケーススタディ分析
- JONELL SYSTEMS、欧州の製油所におけるコアレッシングコストを削減
- JONELL SYSTEMSの製油所向け前ろ過ソリューションにより、米国の製油所で200万米ドルのコスト削減を実現
- ポーターのファイブフォース分析
- 主なステークホルダーと購入基準
- 製油所・石油化学ろ過市場に対する生成AI/AIの影響
- 製油所・石油化学ろ過市場における生成AI/AIの採用
- 生成AI/AIの影響:エンドユーザー別
- 製油所・石油化学ろ過市場に対する生成AI/AIの影響:地域別
- 世界のマクロ経済の見通し
- イントロダクション
- GDPの動向と予測
- 製油所・石油化学ろ過市場に対するインフレの影響
- 2025年の米国関税の影響 - 概要
- イントロダクション
- 主な関税率
- 地域に対する影響
第6章 製油所・石油化学ろ過市場:フィルタータイプ別
- イントロダクション
- コアレッサーフィルター
- カートリッジフィルター
- 電気集塵機
- フィルタープレス
- バッグフィルター
- その他のフィルタータイプ
第7章 製油所・石油化学ろ過市場:用途別
- イントロダクション
- 液液分離
- 気液分離
- その他の用途
第8章 製油所・石油化学ろ過市場:エンドユーザー別
- イントロダクション
- 製油所
- 石油化学産業
第9章 製油所・石油化学ろ過市場:地域別
- イントロダクション
- アジア太平洋
- フィルタータイプ別
- 用途別
- エンドユーザー別
- 国別
- 北米
- フィルタータイプ別
- 用途別
- エンドユーザー別
- 国別
- 欧州
- フィルタータイプ別
- 用途別
- エンドユーザー別
- 国別
- 中東・アフリカ
- フィルタータイプ別
- 用途別
- エンドユーザー別
- 国別
- 南米
- フィルタータイプ別
- 用途別
- エンドユーザー別
- 国別
第10章 競合情勢
- 主要企業が採用した戦略
- 主要参入企業の戦略/強み(2020年1月~2025年7月)
- 上位5社の市場シェア分析
- 収益分析
- 企業の評価と財務指標
- ブランド/製品の比較
- 企業の評価マトリクス:主要企業(2024年)
- 企業の評価マトリクス:スタートアップ企業/中小企業(2024年)
- 競合シナリオ
第11章 企業プロファイル
- 主要企業
- 3M
- EATON
- PARKER HANNIFIN CORP.
- PENTAIR
- CAMFIL
- W.L. GORE & ASSOCIATES, INC.
- PALL CORPORATION
- FILTRATION GROUP
- FILTCARE TECHNOLOGY PVT. LTD.
- FTC
- PORVAIR FILTRATION GROUP
- LENNTECH B.V.
- AMAZON FILTERS LTD.
- NORMAN FILTER COMPANY
- SUNGOV ENGINEERING
- その他の企業
- FILSONFILTER
- BROTHER FILTRATION
- COMPOSITECH PRODUCTS MANUFACTURING, INC.
- KEL INDIA FILTERS
- YIXING HUADING MACHINERY CO., LTD.
第12章 付録
図表
List of Tables
- TABLE 1 REFINERY AND PETROCHEMICAL FILTRATION MARKET SNAPSHOT
- TABLE 2 ENVIRONMENTAL PROTECTION MANDATES AND POLICIES
- TABLE 3 LIST OF REFINERY AND PETROCHEMICAL INFRASTRUCTURE PROJECTS
- TABLE 4 REFINERY AND PETROCHEMICAL FILTRATION MARKET: ECOSYSTEM ANALYSIS
- TABLE 5 AVERAGE SELLING PRICE OF REFINERY AND PETROCHEMICAL FILTRATION UNITS, BY FILTER TYPE
- TABLE 6 AVERAGE SELLING PRICE TREND ANALYSIS, BY REGION (2022-2024)
- TABLE 7 AVERAGE REPLACEMENT RATE OF REFINERY AND PETROCHEMICAL FILTRATION UNITS, BY END USER (NUMBER OF MONTHS)
- TABLE 8 NORTH AMERICA: LIST OF REGULATORY BODIES, GOVERNMENT AGENCIES, AND OTHER ORGANIZATIONS
- TABLE 9 EUROPE: LIST OF REGULATORY BODIES, GOVERNMENT AGENCIES, AND OTHER ORGANIZATIONS
- TABLE 10 ASIA PACIFIC: LIST OF REGULATORY BODIES, GOVERNMENT AGENCIES, AND OTHER ORGANIZATIONS
- TABLE 11 ROW: LIST OF REGULATORY BODIES, GOVERNMENT AGENCIES, AND OTHER ORGANIZATIONS
- TABLE 12 NORTH AMERICA: CODES AND REGULATIONS
- TABLE 13 ASIA PACIFIC: CODES AND REGULATIONS
- TABLE 14 GLOBAL: CODES AND REGULATIONS
- TABLE 15 REFINERY AND PETROCHEMICAL FILTRATION MARKET: INNOVATIONS AND PATENT REGISTRATIONS, 2021-2025
- TABLE 16 EXPORT DATA FOR HS CODE 842199-COMPLIANT PRODUCTS, BY COUNTRY, 2022-2024 (USD THOUSAND)
- TABLE 17 IMPORT DATA FOR HS CODE 842199-COMPLIANT PRODUCTS, BY COUNTRY, 2022-2024 (USD THOUSAND)
- TABLE 18 REFINERY AND PETROCHEMICAL FILTRATION MARKET: CONFERENCES AND EVENTS
- TABLE 19 REFINERY AND PETROCHEMICAL FILTRATION MARKET: PORTER'S FIVE FORCES ANALYSIS
- TABLE 20 INFLUENCE OF STAKEHOLDERS ON BUYING PROCESS, BY END USER (%)
- TABLE 21 KEY BUYING CRITERIA, BY END USER
- TABLE 23 INFLATION RATE (ANNUAL PERCENT CHANGE), 2024
- TABLE 24 US-ADJUSTED RECIPROCAL TARIFF RATES, 2024 (USD BILLION)
- TABLE 25 REFINERY AND PETROCHEMICAL FILTRATION MARKET, BY FILTER TYPE, 2021-2024 (USD MILLION)
- TABLE 26 REFINERY AND PETROCHEMICAL FILTRATION MARKET, BY FILTER TYPE, 2025-2030 (USD MILLION)
- TABLE 27 COALESCER FILTER: REFINERY AND PETROCHEMICAL FILTRATION MARKET, BY FILTER TYPE, 2021-2024 (USD MILLION)
- TABLE 28 COALESCER FILTER: REFINERY AND PETROCHEMICAL FILTRATION MARKET, BY FILTER TYPE, 2025-2030 (USD MILLION)
- TABLE 29 CARTRIDGE FILTER: REFINERY AND PETROCHEMICAL FILTRATION MARKET, BY FILTER TYPE, 2021-2024 (USD MILLION)
- TABLE 30 CARTRIDGE FILTER: REFINERY AND PETROCHEMICAL FILTRATION MARKET, BY FILTER TYPE, 2025-2030 (USD MILLION)
- TABLE 31 COALESCER FILTER: REFINERY AND PETROCHEMICAL FILTRATION MARKET, BY REGION, 2021-2024 (USD MILLION)
- TABLE 32 COALESCER FILTER: REFINERY AND PETROCHEMICAL FILTRATION MARKET, BY REGION, 2025-2030 (USD MILLION)
- TABLE 33 COALESCER FILTER: REFINERY AND PETROCHEMICAL FILTRATION MARKET, BY FILTER TYPE, 2021-2024 (USD MILLION)
- TABLE 34 COALESCER FILTER: REFINERY AND PETROCHEMICAL FILTRATION MARKET, BY FILTER TYPE, 2025-2030 (USD MILLION)
- TABLE 35 LIQUID-LIQUID COALESCER: REFINERY AND PETROCHEMICAL FILTRATION MARKET, BY REGION, 2021-2024 (USD MILLION)
- TABLE 36 LIQUID-LIQUID COALESCER: REFINERY AND PETROCHEMICAL FILTRATION MARKET, BY REGION, 2025-2030 (USD MILLION)
- TABLE 37 LIQUID-GAS COALESCER: REFINERY AND PETROCHEMICAL FILTRATION MARKET, BY REGION, 2021-2024 (USD MILLION)
- TABLE 38 LIQUID-GAS COALESCER: REFINERY AND PETROCHEMICAL FILTRATION MARKET, BY REGION, 2025-2030 (USD MILLION)
- TABLE 39 COALESCER FILTER: REFINERY AND PETROCHEMICAL FILTRATION MARKET, BY APPLICATION, 2021-2024 (USD MILLION)
- TABLE 40 COALESCER FILTER: REFINERY AND PETROCHEMICAL FILTRATION MARKET, BY APPLICATION, 2025-2030 (USD MILLION)
- TABLE 41 CARTRIDGE FILTER: REFINERY AND PETROCHEMICAL FILTRATION MARKET, BY REGION, 2021-2024 (USD MILLION)
- TABLE 42 CARTRIDGE FILTER: REFINERY AND PETROCHEMICAL FILTRATION MARKET, BY REGION, 2025-2030 (USD MILLION)
- TABLE 43 CARTRIDGE FILTER: REFINERY AND PETROCHEMICAL FILTRATION MARKET, BY FILTER TYPE, 2021-2024 (USD MILLION)
- TABLE 44 CARTRIDGE FILTER: REFINERY AND PETROCHEMICAL FILTRATION MARKET, BY FILTER TYPE, 2025-2030 (USD MILLION)
- TABLE 45 PLEATED CARTRIDGE FILTER: REFINERY AND PETROCHEMICAL FILTRATION MARKET, BY REGION, 2021-2024 (USD MILLION)
- TABLE 46 PLEATED CARTRIDGE FILTER: REFINERY AND PETROCHEMICAL FILTRATION MARKET, BY REGION, 2025-2030 (USD MILLION)
- TABLE 47 DEPTH CARTRIDGE FILTER: REFINERY AND PETROCHEMICAL FILTRATION MARKET, BY REGION, 2021-2024 (USD MILLION)
- TABLE 48 DEPTH CARTRIDGE FILTER: REFINERY AND PETROCHEMICAL FILTRATION MARKET, BY REGION, 2025-2030 (USD MILLION)
- TABLE 49 HIGH FLOW CARTRIDGE FILTER: REFINERY AND PETROCHEMICAL FILTRATION MARKET, BY REGION, 2021-2024 (USD MILLION)
- TABLE 50 HIGH FLOW CARTRIDGE FILTER: REFINERY AND PETROCHEMICAL FILTRATION MARKET, BY REGION, 2025-2030 (USD MILLION)
- TABLE 51 CARTRIDGE FILTER: REFINERY AND PETROCHEMICAL FILTRATION MARKET, BY APPLICATION, 2021-2024 (USD MILLION)
- TABLE 52 CARTRIDGE FILTER: REFINERY AND PETROCHEMICAL FILTRATION MARKET, BY APPLICATION, 2025-2030 (USD MILLION)
- TABLE 53 ELECTROSTATIC PRECIPITATOR: REFINERY AND PETROCHEMICAL FILTRATION MARKET, BY REGION, 2021-2024 (USD MILLION)
- TABLE 54 ELECTROSTATIC PRECIPITATOR: REFINERY AND PETROCHEMICAL FILTRATION MARKET, BY REGION, 2025-2030 (USD MILLION)
- TABLE 55 ELECTROSTATIC PRECIPITATOR: REFINERY AND PETROCHEMICAL FILTRATION MARKET, BY APPLICATION, 2021-2024 (USD MILLION)
- TABLE 56 ELECTROSTATIC PRECIPITATOR: REFINERY AND PETROCHEMICAL FILTRATION MARKET, BY APPLICATION, 2025-2030 (USD MILLION)
- TABLE 57 FILTER PRESS: REFINERY AND PETROCHEMICAL FILTRATION MARKET, BY REGION, 2021-2024 (USD MILLION)
- TABLE 58 FILTER PRESS: REFINERY AND PETROCHEMICAL FILTRATION MARKET, BY REGION, 2025-2030 (USD MILLION)
- TABLE 59 FILTER PRESS: REFINERY AND PETROCHEMICAL FILTRATION MARKET, BY APPLICATION, 2021-2024 (USD MILLION)
- TABLE 60 FILTER PRESS: REFINERY AND PETROCHEMICAL FILTRATION MARKET, BY APPLICATION, 2025-2030 (USD MILLION)
- TABLE 61 BAG FILTER: REFINERY AND PETROCHEMICAL FILTRATION MARKET, BY REGION, 2021-2024 (USD MILLION)
- TABLE 62 BAG FILTER: REFINERY AND PETROCHEMICAL FILTRATION MARKET, BY REGION, 2025-2030 (USD MILLION)
- TABLE 63 BAG FILTER: REFINERY AND PETROCHEMICAL FILTRATION MARKET, BY APPLICATION, 2021-2024 (USD MILLION)
- TABLE 64 BAG FILTER: REFINERY AND PETROCHEMICAL FILTRATION MARKET, BY APPLICATION, 2025-2030 (USD MILLION)
- TABLE 65 OTHER FILTER TYPES: REFINERY AND PETROCHEMICAL FILTRATION MARKET, BY REGION, 2021-2024 (USD MILLION)
- TABLE 66 OTHER FILTER TYPES: REFINERY AND PETROCHEMICAL FILTRATION MARKET, BY REGION, 2025-2030 (USD MILLION)
- TABLE 67 OTHER FILTER TYPES: REFINERY AND PETROCHEMICAL FILTRATION MARKET, BY APPLICATION, 2021-2024 (USD MILLION)
- TABLE 68 OTHER FILTER TYPES: REFINERY AND PETROCHEMICAL FILTRATION MARKET, BY APPLICATION, 2025-2030 (USD MILLION)
- TABLE 69 REFINERY AND PETROCHEMICAL FILTRATION MARKET, BY APPLICATION, 2021-2024 (USD MILLION)
- TABLE 70 REFINERY AND PETROCHEMICAL FILTRATION MARKET, BY APPLICATION, 2025-2030 (USD MILLION)
- TABLE 71 LIQUID-LIQUID SEPARATION: REFINERY AND PETROCHEMICAL FILTRATION MARKET, BY REGION, 2021-2024 (USD MILLION)
- TABLE 72 LIQUID-LIQUID SEPARATION: REFINERY AND PETROCHEMICAL FILTRATION MARKET, BY REGION, 2025-2030 (USD MILLION)
- TABLE 73 LIQUID-GAS SEPARATION: REFINERY AND PETROCHEMICAL FILTRATION MARKET, BY REGION, 2021-2024 (USD MILLION)
- TABLE 74 LIQUID-GAS SEPARATION: REFINERY AND PETROCHEMICAL FILTRATION MARKET, BY REGION, 2025-2030 (USD MILLION)
- TABLE 75 OTHER APPLICATIONS: REFINERY AND PETROCHEMICAL FILTRATION MARKET, BY REGION, 2021-2024 (USD MILLION)
- TABLE 76 OTHER APPLICATIONS: REFINERY AND PETROCHEMICAL FILTRATION MARKET, BY REGION, 2025-2030 (USD MILLION)
- TABLE 77 REFINERY AND PETROCHEMICAL FILTRATION MARKET, BY END USER, 2021-2024 (USD MILLION)
- TABLE 78 REFINERY AND PETROCHEMICAL FILTRATION MARKET, BY END USER, 2025-2030 (USD MILLION)
- TABLE 79 REFINERIES: REFINERY AND PETROCHEMICAL FILTRATION MARKET, BY REGION, 2021-2024 (USD MILLION)
- TABLE 80 REFINERIES: REFINERY AND PETROCHEMICAL FILTRATION MARKET, BY REGION, 2025-2030 (USD MILLION)
- TABLE 81 PETROCHEMICAL INDUSTRY: REFINERY AND PETROCHEMICAL FILTRATION MARKET, BY REGION, 2021-2024 (USD MILLION)
- TABLE 82 PETROCHEMICAL INDUSTRY: REFINERY AND PETROCHEMICAL FILTRATION MARKET, BY REGION, 2025-2030 (USD MILLION)
- TABLE 83 REFINERY AND PETROCHEMICAL FILTRATION MARKET, BY REGION, 2021-2024 (USD MILLION)
- TABLE 84 REFINERY AND PETROCHEMICAL FILTRATION MARKET, BY REGION, 2025-2030 (USD MILLION)
- TABLE 85 ASIA PACIFIC: REFINERY AND PETROCHEMICAL FILTRATION MARKET, BY FILTER TYPE, 2021-2024 (USD MILLION)
- TABLE 86 ASIA PACIFIC: REFINERY AND PETROCHEMICAL FILTRATION MARKET, BY FILTER TYPE, 2025-2030 (USD MILLION)
- TABLE 87 ASIA PACIFIC: REFINERY AND PETROCHEMICAL FILTRATION MARKET FOR COALESCER FILTER, BY FILTER TYPE, 2021-2024 (USD MILLION)
- TABLE 88 ASIA PACIFIC: REFINERY AND PETROCHEMICAL FILTRATION MARKET FOR COALESCER FILTER, BY FILTER TYPE, 2025-2030 (USD MILLION)
- TABLE 89 ASIA PACIFIC: REFINERY AND PETROCHEMICAL FILTRATION MARKET FOR CARTRIDGE FILTER, BY FILTER TYPE, 2021-2024 (USD MILLION)
- TABLE 90 ASIA PACIFIC: REFINERY AND PETROCHEMICAL FILTRATION MARKET FOR CARTRIDGE FILTER, BY FILTER TYPE, 2025-2030 (USD MILLION)
- TABLE 91 ASIA PACIFIC: REFINERY AND PETROCHEMICAL FILTRATION MARKET FOR COALESCER FILTER, BY APPLICATION, 2021-2024 (USD MILLION)
- TABLE 92 ASIA PACIFIC: REFINERY AND PETROCHEMICAL FILTRATION MARKET FOR COALESCER FILTER, BY APPLICATION, 2024-2030 (USD MILLION)
- TABLE 93 ASIA PACIFIC: REFINERY AND PETROCHEMICAL FILTRATION MARKET FOR CARTRIDGE FILTER, BY APPLICATION, 2021-2024 (USD MILLION)
- TABLE 94 ASIA PACIFIC: REFINERY AND PETROCHEMICAL FILTRATION MARKET FOR CARTRIDGE FILTER, BY APPLICATION, 2025-2030 (USD MILLION)
- TABLE 95 ASIA PACIFIC: REFINERY AND PETROCHEMICAL FILTRATION MARKET FOR ELECTROSTATIC PRECIPITATOR, BY APPLICATION, 2021-2024 (USD MILLION)
- TABLE 96 ASIA PACIFIC: REFINERY AND PETROCHEMICAL FILTRATION MARKET FOR ELECTROSTATIC PRECIPITATOR, BY APPLICATION, 2025-2030 (USD MILLION)
- TABLE 97 ASIA PACIFIC: REFINERY AND PETROCHEMICAL FILTRATION MARKET FOR FILTER PRESS, BY APPLICATION, 2021-2024 (USD MILLION)
- TABLE 98 ASIA PACIFIC: REFINERY AND PETROCHEMICAL FILTRATION MARKET FOR FILTER PRESS, BY APPLICATION, 2025-2030 (USD MILLION)
- TABLE 99 ASIA PACIFIC: REFINERY AND PETROCHEMICAL FILTRATION MARKET FOR BAG FILTER, BY APPLICATION, 2021-2024 (USD MILLION)
- TABLE 100 ASIA PACIFIC: REFINERY AND PETROCHEMICAL FILTRATION MARKET FOR BAG FILTER, BY APPLICATION, 2025-2030 (USD MILLION)
- TABLE 101 ASIA PACIFIC: REFINERY AND PETROCHEMICAL FILTRATION MARKET FOR OTHER FILTER TYPES, BY APPLICATION, 2021-2024 (USD MILLION)
- TABLE 102 ASIA PACIFIC: REFINERY AND PETROCHEMICAL FILTRATION MARKET FOR OTHER FILTER TYPES, BY APPLICATION, 2025-2030 (USD MILLION)
- TABLE 103 ASIA PACIFIC: REFINERY AND PETROCHEMICAL FILTRATION MARKET, BY APPLICATION, 2021-2024 (USD MILLION)
- TABLE 104 ASIA PACIFIC: REFINERY AND PETROCHEMICAL FILTRATION MARKET, BY APPLICATION, 2025-2030 (USD MILLION)
- TABLE 105 ASIA PACIFIC: REFINERY AND PETROCHEMICAL FILTRATION MARKET, BY END USER, 2021-2024 (USD MILLION)
- TABLE 106 ASIA PACIFIC: REFINERY AND PETROCHEMICAL FILTRATION MARKET, BY END USER, 2025-2030 (USD MILLION)
- TABLE 107 ASIA PACIFIC: REFINERY AND PETROCHEMICAL FILTRATION MARKET, BY COUNTRY, 2021-2024 (USD MILLION)
- TABLE 108 ASIA PACIFIC: REFINERY AND PETROCHEMICAL FILTRATION MARKET, BY COUNTRY, 2025-2030 (USD MILLION)
- TABLE 109 CHINA: REFINERY AND PETROCHEMICAL FILTRATION MARKET, BY END USER, 2021-2024 (USD MILLION)
- TABLE 110 CHINA: REFINERY AND PETROCHEMICAL FILTRATION MARKET, BY END USER, 2025-2030 (USD MILLION)
- TABLE 111 INDIA: REFINERY AND PETROCHEMICAL FILTRATION MARKET, BY END USER, 2021-2024 (USD MILLION)
- TABLE 112 INDIA: REFINERY AND PETROCHEMICAL FILTRATION MARKET, BY END USER, 2025-2030 (USD MILLION)
- TABLE 113 JAPAN: REFINERY AND PETROCHEMICAL FILTRATION MARKET, BY END USER, 2021-2024 (USD MILLION)
- TABLE 114 JAPAN: REFINERY AND PETROCHEMICAL FILTRATION MARKET, BY END USER, 2025-2030 (USD MILLION)
- TABLE 115 AUSTRALIA: REFINERY AND PETROCHEMICAL FILTRATION MARKET, BY END USER, 2021-2024 (USD MILLION)
- TABLE 116 AUSTRALIA: REFINERY AND PETROCHEMICAL FILTRATION MARKET, BY END USER, 2025-2030 (USD MILLION)
- TABLE 117 SOUTH KOREA: REFINERY AND PETROCHEMICAL FILTRATION MARKET, BY END USER, 2021-2024 (USD MILLION)
- TABLE 118 SOUTH KOREA: REFINERY AND PETROCHEMICAL FILTRATION MARKET, BY END USER, 2025-2030 (USD MILLION)
- TABLE 119 REST OF ASIA PACIFIC: REFINERY AND PETROCHEMICAL FILTRATION MARKET, BY END USER, 2021-2024 (USD MILLION)
- TABLE 120 REST OF ASIA PACIFIC: REFINERY AND PETROCHEMICAL FILTRATION MARKET, BY END USER, 2025-2030 (USD MILLION)
- TABLE 121 NORTH AMERICA: REFINERY AND PETROCHEMICAL FILTRATION MARKET, BY FILTER TYPE, 2021-2024 (USD MILLION)
- TABLE 122 NORTH AMERICA: REFINERY AND PETROCHEMICAL FILTRATION MARKET, BY FILTER TYPE, 2025-2030 (USD MILLION)
- TABLE 123 NORTH AMERICA: REFINERY AND PETROCHEMICAL FILTRATION MARKET FOR COALESCER FILTER, BY FILTER TYPE, 2021-2024 (USD MILLION)
- TABLE 124 NORTH AMERICA: REFINERY AND PETROCHEMICAL FILTRATION MARKET FOR COALESCER FILTER, BY FILTER TYPE, 2025-2030 (USD MILLION)
- TABLE 125 NORTH AMERICA: REFINERY AND PETROCHEMICAL FILTRATION MARKET FOR CARTRIDGE FILTER, BY FILTER TYPE, 2021-2024 (USD MILLION)
- TABLE 126 NORTH AMERICA: REFINERY AND PETROCHEMICAL FILTRATION MARKET FOR CARTRIDGE FILTER, BY FILTER TYPE, 2025-2030 (USD MILLION)
- TABLE 127 NORTH AMERICA: REFINERY AND PETROCHEMICAL FILTRATION MARKET FOR COALESCER FILTER, BY APPLICATION, 2021-2024 (USD MILLION)
- TABLE 128 NORTH AMERICA: REFINERY AND PETROCHEMICAL FILTRATION MARKET FOR COALESCER FILTER, BY APPLICATION, 2024-2030 (USD MILLION)
- TABLE 129 NORTH AMERICA: REFINERY AND PETROCHEMICAL FILTRATION MARKET FOR CARTRIDGE FILTER, BY APPLICATION, 2021-2024 (USD MILLION)
- TABLE 130 NORTH AMERICA: REFINERY AND PETROCHEMICAL FILTRATION MARKET FOR CARTRIDGE FILTER, BY APPLICATION, 2025-2030 (USD MILLION)
- TABLE 131 NORTH AMERICA: REFINERY AND PETROCHEMICAL FILTRATION MARKET FOR ELECTROSTATIC PRECIPITATOR, BY APPLICATION, 2021-2024 (USD MILLION)
- TABLE 132 NORTH AMERICA: REFINERY AND PETROCHEMICAL FILTRATION MARKET FOR ELECTROSTATIC PRECIPITATOR, BY APPLICATION, 2025-2030 (USD MILLION)
- TABLE 133 NORTH AMERICA: REFINERY AND PETROCHEMICAL FILTRATION MARKET FOR FILTER PRESS, BY APPLICATION, 2021-2024 (USD MILLION)
- TABLE 134 NORTH AMERICA: REFINERY AND PETROCHEMICAL FILTRATION MARKET FOR FILTER PRESS, BY APPLICATION, 2025-2030 (USD MILLION)
- TABLE 135 NORTH AMERICA: REFINERY AND PETROCHEMICAL FILTRATION MARKET FOR BAG FILTER, BY APPLICATION, 2021-2024 (USD MILLION)
- TABLE 136 NORTH AMERICA: REFINERY AND PETROCHEMICAL FILTRATION MARKET FOR BAG FILTER, BY APPLICATION, 2025-2030 (USD MILLION)
- TABLE 137 NORTH AMERICA: REFINERY AND PETROCHEMICAL FILTRATION MARKET FOR OTHER FILTER TYPES, BY APPLICATION, 2021-2024 (USD MILLION)
- TABLE 138 NORTH AMERICA: REFINERY AND PETROCHEMICAL FILTRATION MARKET FOR OTHER FILTER TYPES, BY APPLICATION, 2025-2030 (USD MILLION)
- TABLE 139 NORTH AMERICA: REFINERY AND PETROCHEMICAL FILTRATION MARKET, BY APPLICATION, 2021-2024 (USD MILLION)
- TABLE 140 NORTH AMERICA: REFINERY AND PETROCHEMICAL FILTRATION MARKET, BY APPLICATION, 2025-2030 (USD MILLION)
- TABLE 141 NORTH AMERICA: REFINERY AND PETROCHEMICAL FILTRATION MARKET, BY END USER, 2021-2024 (USD MILLION)
- TABLE 142 NORTH AMERICA: REFINERY AND PETROCHEMICAL FILTRATION MARKET, BY END USER, 2025-2030 (USD MILLION)
- TABLE 143 NORTH AMERICA: REFINERY AND PETROCHEMICAL FILTRATION MARKET, BY COUNTRY, 2021-2024 (USD MILLION)
- TABLE 144 NORTH AMERICA: REFINERY AND PETROCHEMICAL FILTRATION MARKET, BY COUNTRY, 2025-2030 (USD MILLION)
- TABLE 145 US: REFINERY AND PETROCHEMICAL FILTRATION MARKET, BY END USER, 2021-2024 (USD MILLION)
- TABLE 146 US: REFINERY AND PETROCHEMICAL FILTRATION MARKET, BY END USER, 2025-2030 (USD MILLION)
- TABLE 147 CANADA: REFINERY AND PETROCHEMICAL FILTRATION MARKET, BY END USER, 2021-2024 (USD MILLION)
- TABLE 148 CANADA: REFINERY AND PETROCHEMICAL FILTRATION MARKET, BY END USER, 2025-2030 (USD MILLION)
- TABLE 149 MEXICO: REFINERY AND PETROCHEMICAL FILTRATION MARKET, BY END USER, 2021-2024 (USD MILLION)
- TABLE 150 MEXICO: REFINERY AND PETROCHEMICAL FILTRATION MARKET, BY END USER, 2025-2030 (USD MILLION)
- TABLE 151 EUROPE: REFINERY AND PETROCHEMICAL FILTRATION MARKET, BY FILTER TYPE, 2021-2024 (USD MILLION)
- TABLE 152 EUROPE: REFINERY AND PETROCHEMICAL FILTRATION MARKET, BY FILTER TYPE, 2025-2030 (USD MILLION)
- TABLE 153 EUROPE: REFINERY AND PETROCHEMICAL FILTRATION MARKET FOR COALESCER FILTER, BY FILTER TYPE, 2021-2024 (USD MILLION)
- TABLE 154 EUROPE: REFINERY AND PETROCHEMICAL FILTRATION MARKET FOR COALESCER FILTER, BY FILTER TYPE, 2025-2030 (USD MILLION)
- TABLE 155 EUROPE: REFINERY AND PETROCHEMICAL FILTRATION MARKET FOR CARTRIDGE FILTER, BY FILTER TYPE, 2021-2024 (USD MILLION)
- TABLE 156 EUROPE: REFINERY AND PETROCHEMICAL FILTRATION MARKET FOR CARTRIDGE FILTER, BY FILTER TYPE, 2025-2030 (USD MILLION)
- TABLE 157 EUROPE: REFINERY AND PETROCHEMICAL FILTRATION MARKET FOR COALESCER FILTER, BY APPLICATION, 2021-2024 (USD MILLION)
- TABLE 158 EUROPE: REFINERY AND PETROCHEMICAL FILTRATION MARKET FOR COALESCER FILTER, BY APPLICATION, 2024-2030 (USD MILLION)
- TABLE 159 EUROPE: REFINERY AND PETROCHEMICAL FILTRATION MARKET FOR CARTRIDGE FILTER, BY APPLICATION, 2021-2024 (USD MILLION)
- TABLE 160 EUROPE: REFINERY AND PETROCHEMICAL FILTRATION MARKET FOR CARTRIDGE FILTER, BY APPLICATION, 2025-2030 (USD MILLION)
- TABLE 161 EUROPE: REFINERY AND PETROCHEMICAL FILTRATION MARKET FOR ELECTROSTATIC PRECIPITATOR, BY APPLICATION, 2021-2024 (USD MILLION)
- TABLE 162 EUROPE: REFINERY AND PETROCHEMICAL FILTRATION MARKET FOR ELECTROSTATIC PRECIPITATOR, BY APPLICATION, 2025-2030 (USD MILLION)
- TABLE 163 EUROPE: REFINERY AND PETROCHEMICAL FILTRATION MARKET FOR FILTER PRESS, BY APPLICATION, 2021-2024 (USD MILLION)
- TABLE 164 EUROPE: REFINERY AND PETROCHEMICAL FILTRATION MARKET FOR FILTER PRESS, BY APPLICATION, 2025-2030 (USD MILLION)
- TABLE 165 EUROPE: REFINERY AND PETROCHEMICAL FILTRATION MARKET FOR BAG FILTER, BY APPLICATION, 2021-2024 (USD MILLION)
- TABLE 166 EUROPE: REFINERY AND PETROCHEMICAL FILTRATION MARKET FOR BAG FILTER, BY APPLICATION, 2025-2030 (USD MILLION)
- TABLE 167 EUROPE: REFINERY AND PETROCHEMICAL FILTRATION MARKET FOR OTHER FILTER TYPES, BY APPLICATION, 2021-2024 (USD MILLION)
- TABLE 168 EUROPE: REFINERY AND PETROCHEMICAL FILTRATION MARKET FOR OTHER FILTER TYPES, BY APPLICATION, 2025-2030 (USD MILLION)
- TABLE 169 EUROPE: REFINERY AND PETROCHEMICAL FILTRATION MARKET, BY APPLICATION, 2021-2024 (USD MILLION)
- TABLE 170 EUROPE: REFINERY AND PETROCHEMICAL FILTRATION MARKET, BY APPLICATION, 2025-2030 (USD MILLION)
- TABLE 171 EUROPE: REFINERY AND PETROCHEMICAL FILTRATION MARKET, BY END USER, 2021-2024 (USD MILLION)
- TABLE 172 EUROPE: REFINERY AND PETROCHEMICAL FILTRATION MARKET, BY END USER, 2025-2030 (USD MILLION)
- TABLE 173 EUROPE: REFINERY AND PETROCHEMICAL FILTRATION MARKET, BY COUNTRY, 2021-2024 (USD MILLION)
- TABLE 174 EUROPE: REFINERY AND PETROCHEMICAL FILTRATION MARKET, BY COUNTRY, 2025-2030 (USD MILLION)
- TABLE 175 RUSSIA: REFINERY AND PETROCHEMICAL FILTRATION MARKET, BY END USER, 2021-2024 (USD MILLION)
- TABLE 176 RUSSIA: REFINERY AND PETROCHEMICAL FILTRATION MARKET, BY END USER, 2025-2030 (USD MILLION)
- TABLE 177 GERMANY: REFINERY AND PETROCHEMICAL FILTRATION MARKET, BY END USER, 2021-2024 (USD MILLION)
- TABLE 178 GERMANY: REFINERY AND PETROCHEMICAL FILTRATION MARKET, BY END USER, 2025-2030 (USD MILLION)
- TABLE 179 UK: REFINERY AND PETROCHEMICAL FILTRATION MARKET, BY END USER, 2021-2024 (USD MILLION)
- TABLE 180 UK: REFINERY AND PETROCHEMICAL FILTRATION MARKET, BY END USER, 2025-2030 (USD MILLION)
- TABLE 181 FRANCE: REFINERY AND PETROCHEMICAL FILTRATION MARKET, BY END USER, 2021-2024 (USD MILLION)
- TABLE 182 FRANCE: REFINERY AND PETROCHEMICAL FILTRATION MARKET, BY END USER, 2025-2030 (USD MILLION)
- TABLE 183 ITALY: REFINERY AND PETROCHEMICAL FILTRATION MARKET, BY END USER, 2021-2024 (USD MILLION)
- TABLE 184 ITALY: REFINERY AND PETROCHEMICAL FILTRATION MARKET, BY END USER, 2025-2030 (USD MILLION)
- TABLE 185 REST OF EUROPE: REFINERY AND PETROCHEMICAL FILTRATION MARKET, BY END USER, 2021-2024 (USD MILLION)
- TABLE 186 REST OF EUROPE: REFINERY AND PETROCHEMICAL FILTRATION MARKET, BY END USER, 2025-2030 (USD MILLION)
- TABLE 187 MIDDLE EAST & AFRICA: REFINERY AND PETROCHEMICAL FILTRATION MARKET, BY FILTER TYPE, 2021-2024 (USD MILLION)
- TABLE 188 MIDDLE EAST & AFRICA: REFINERY AND PETROCHEMICAL FILTRATION MARKET, BY FILTER TYPE, 2025-2030 (USD MILLION)
- TABLE 189 MIDDLE EAST & AFRICA: REFINERY AND PETROCHEMICAL FILTRATION MARKET FOR COALESCER FILTER, BY FILTER TYPE, 2021-2024 (USD MILLION)
- TABLE 190 MIDDLE EAST & AFRICA: REFINERY AND PETROCHEMICAL FILTRATION MARKET FOR COALESCER FILTER, BY FILTER TYPE, 2025-2030 (USD MILLION)
- TABLE 191 MIDDLE EAST & AFRICA: REFINERY AND PETROCHEMICAL FILTRATION MARKET FOR CARTRIDGE FILTER, BY FILTER TYPE, 2021-2024 (USD MILLION)
- TABLE 192 MIDDLE EAST & AFRICA: REFINERY AND PETROCHEMICAL FILTRATION MARKET FOR CARTRIDGE FILTER, BY FILTER TYPE, 2025-2030 (USD MILLION)
- TABLE 193 MIDDLE EAST & AFRICA: REFINERY AND PETROCHEMICAL FILTRATION MARKET FOR COALESCER FILTER, BY APPLICATION, 2021-2024 (USD MILLION)
- TABLE 194 MIDDLE EAST & AFRICA: REFINERY AND PETROCHEMICAL FILTRATION MARKET FOR COALESCER FILTER, BY APPLICATION, 2024-2030 (USD MILLION)
- TABLE 195 MIDDLE EAST & AFRICA: REFINERY AND PETROCHEMICAL FILTRATION MARKET FOR CARTRIDGE FILTER, BY APPLICATION, 2021-2024 (USD MILLION)
- TABLE 196 MIDDLE EAST & AFRICA: REFINERY AND PETROCHEMICAL FILTRATION MARKET FOR CARTRIDGE FILTER, BY APPLICATION, 2025-2030 (USD MILLION)
- TABLE 197 MIDDLE EAST & AFRICA: REFINERY AND PETROCHEMICAL FILTRATION MARKET FOR ELECTROSTATIC PRECIPITATOR, BY APPLICATION, 2021-2024 (USD MILLION)
- TABLE 198 MIDDLE EAST & AFRICA: REFINERY AND PETROCHEMICAL FILTRATION MARKET FOR ELECTROSTATIC PRECIPITATOR, BY APPLICATION, 2025-2030 (USD MILLION)
- TABLE 199 MIDDLE EAST & AFRICA: REFINERY AND PETROCHEMICAL FILTRATION MARKET FOR FILTER PRESS, BY APPLICATION, 2021-2024 (USD MILLION)
- TABLE 200 MIDDLE EAST & AFRICA: REFINERY AND PETROCHEMICAL FILTRATION MARKET FOR FILTER PRESS, BY APPLICATION, 2025-2030 (USD MILLION)
- TABLE 201 MIDDLE EAST & AFRICA: REFINERY AND PETROCHEMICAL FILTRATION MARKET FOR BAG FILTER, BY APPLICATION, 2021-2028 (USD MILLION)
- TABLE 202 MIDDLE EAST & AFRICA: REFINERY AND PETROCHEMICAL FILTRATION MARKET FOR BAG FILTER, BY APPLICATION, 2021-2028 (USD MILLION)
- TABLE 203 MIDDLE EAST & AFRICA: REFINERY AND PETROCHEMICAL FILTRATION MARKET FOR OTHER FILTER TYPES, BY APPLICATION, 2021-2024 (USD MILLION)
- TABLE 204 MIDDLE EAST & AFRICA: REFINERY AND PETROCHEMICAL FILTRATION MARKET FOR OTHER FILTER TYPES, BY APPLICATION, 2025-2030 (USD MILLION)
- TABLE 205 MIDDLE EAST & AFRICA: REFINERY AND PETROCHEMICAL FILTRATION MARKET, BY APPLICATION, 2021-2024 (USD MILLION)
- TABLE 206 MIDDLE EAST & AFRICA: REFINERY AND PETROCHEMICAL FILTRATION MARKET, BY APPLICATION, 2025-2030 (USD MILLION)
- TABLE 207 MIDDLE EAST & AFRICA: REFINERY AND PETROCHEMICAL FILTRATION MARKET, BY END USER, 2021-2024 (USD MILLION)
- TABLE 208 MIDDLE EAST & AFRICA: REFINERY AND PETROCHEMICAL FILTRATION MARKET, BY END USER, 2025-2030 (USD MILLION)
- TABLE 209 MIDDLE EAST & AFRICA: REFINERY AND PETROCHEMICAL FILTRATION MARKET, BY COUNTRY, 2021-2024 (USD MILLION)
- TABLE 210 MIDDLE EAST & AFRICA: REFINERY AND PETROCHEMICAL FILTRATION MARKET, BY COUNTRY, 2025-2030 (USD MILLION)
- TABLE 211 SAUDI ARABIA: REFINERY AND PETROCHEMICAL FILTRATION MARKET, BY END USER, 2021-2024 (USD MILLION)
- TABLE 212 SAUDI ARABIA: REFINERY AND PETROCHEMICAL FILTRATION MARKET, BY END USER, 2025-2030 (USD MILLION)
- TABLE 213 UAE: REFINERY AND PETROCHEMICAL FILTRATION MARKET, BY END USER, 2021-2024 (USD MILLION)
- TABLE 214 UAE: REFINERY AND PETROCHEMICAL FILTRATION MARKET, BY END USER, 2025-2030 (USD MILLION)
- TABLE 215 SOUTH AFRICA: REFINERY AND PETROCHEMICAL FILTRATION MARKET, BY END USER, 2021-2024 (USD MILLION)
- TABLE 216 SOUTH AFRICA: REFINERY AND PETROCHEMICAL FILTRATION MARKET, BY END USER, 2025-2030 (USD MILLION)
- TABLE 217 REST OF MIDDLE EAST & AFRICA: REFINERY AND PETROCHEMICAL FILTRATION MARKET, BY END USER, 2021-2024 (USD MILLION)
- TABLE 218 REST OF THE MIDDLE EAST & AFRICA: REFINERY AND PETROCHEMICAL FILTRATION MARKET, BY END USER, 2025-2030 (USD MILLION)
- TABLE 219 SOUTH AMERICA: REFINERY AND PETROCHEMICAL FILTRATION MARKET, BY FILTER TYPE, 2021-2024 (USD MILLION)
- TABLE 220 SOUTH AMERICA: REFINERY AND PETROCHEMICAL FILTRATION MARKET, BY FILTER TYPE, 2025-2030 (USD MILLION)
- TABLE 221 SOUTH AMERICA: REFINERY AND PETROCHEMICAL FILTRATION MARKET FOR COALESCER FILTER, BY FILTER TYPE, 2021-2024 (USD MILLION)
- TABLE 222 SOUTH AMERICA: REFINERY AND PETROCHEMICAL FILTRATION MARKET FOR COALESCER FILTER, BY FILTER TYPE, 2025-2030 (USD MILLION)
- TABLE 223 SOUTH AMERICA: REFINERY AND PETROCHEMICAL FILTRATION MARKET FOR CARTRIDGE FILTER, BY FILTER TYPE, 2021-2024 (USD MILLION)
- TABLE 224 SOUTH AMERICA: REFINERY AND PETROCHEMICAL FILTRATION MARKET FOR CARTRIDGE FILTER, BY FILTER TYPE, 2025-2030 (USD MILLION)
- TABLE 225 SOUTH AMERICA: REFINERY AND PETROCHEMICAL FILTRATION MARKET FOR COALESCER FILTER, BY APPLICATION, 2021-2024 (USD MILLION)
- TABLE 226 SOUTH AMERICA: REFINERY AND PETROCHEMICAL FILTRATION MARKET FOR COALESCER FILTER, BY APPLICATION, 2024-2030 (USD MILLION)
- TABLE 227 SOUTH AMERICA: REFINERY AND PETROCHEMICAL FILTRATION MARKET FOR CARTRIDGE FILTER, BY APPLICATION, 2021-2024 (USD MILLION)
- TABLE 228 SOUTH AMERICA: REFINERY AND PETROCHEMICAL FILTRATION MARKET FOR CARTRIDGE FILTER, BY APPLICATION, 2025-2030 (USD MILLION)
- TABLE 229 SOUTH AMERICA: REFINERY AND PETROCHEMICAL FILTRATION MARKET FOR ELECTROSTATIC PRECIPITATOR, BY APPLICATION, 2021-2024 (USD MILLION)
- TABLE 230 SOUTH AMERICA: REFINERY AND PETROCHEMICAL FILTRATION MARKET FOR ELECTROSTATIC PRECIPITATOR, BY APPLICATION, 2025-2030 (USD MILLION)
- TABLE 231 SOUTH AMERICA: REFINERY AND PETROCHEMICAL FILTRATION MARKET FOR FILTER PRESS, BY APPLICATION, 2021-2024 (USD MILLION)
- TABLE 232 SOUTH AMERICA: REFINERY AND PETROCHEMICAL FILTRATION MARKET FOR FILTER PRESS, BY APPLICATION, 2025-2030 (USD MILLION)
- TABLE 233 SOUTH AMERICA: REFINERY AND PETROCHEMICAL FILTRATION MARKET F OR BAG FILTER, BY APPLICATION, 2021-2028 (USD MILLION)
- TABLE 234 SOUTH AMERICA: REFINERY AND PETROCHEMICAL FILTRATION MARKET FOR BAG FILTER, BY APPLICATION, 2021-2028 (USD MILLION)
- TABLE 235 SOUTH AMERICA: REFINERY AND PETROCHEMICAL FILTRATION MARKET FOR OTHER FILTER TYPES, BY APPLICATION, 2021-2024 (USD MILLION)
- TABLE 236 SOUTH AMERICA: REFINERY AND PETROCHEMICAL FILTRATION MARKET FOR OTHER FILTER TYPES, BY APPLICATION, 2025-2030 (USD MILLION)
- TABLE 237 SOUTH AMERICA: REFINERY AND PETROCHEMICAL FILTRATION MARKET, BY APPLICATION, 2021-2024 (USD MILLION)
- TABLE 238 SOUTH AMERICA: REFINERY AND PETROCHEMICAL FILTRATION MARKET, BY APPLICATION, 2025-2030 (USD MILLION)
- TABLE 239 SOUTH AMERICA: REFINERY AND PETROCHEMICAL FILTRATION MARKET, BY END USER, 2021-2024 (USD MILLION)
- TABLE 240 SOUTH AMERICA: REFINERY AND PETROCHEMICAL FILTRATION MARKET, BY END USER, 2025-2030 (USD MILLION)
- TABLE 241 SOUTH AMERICA: REFINERY AND PETROCHEMICAL FILTRATION MARKET, BY COUNTRY, 2021-2024 (USD MILLION)
- TABLE 242 SOUTH AMERICA: REFINERY AND PETROCHEMICAL FILTRATION MARKET, BY COUNTRY, 2025-2030 (USD MILLION)
- TABLE 243 BRAZIL: REFINERY AND PETROCHEMICAL FILTRATION MARKET, BY END USER, 2021-2024 (USD MILLION)
- TABLE 244 BRAZIL: REFINERY AND PETROCHEMICAL FILTRATION MARKET, BY END USER, 2025-2030 (USD MILLION)
- TABLE 245 ARGENTINA: REFINERY AND PETROCHEMICAL FILTRATION MARKET, BY END USER, 2021-2024 (USD MILLION)
- TABLE 246 ARGENTINA: REFINERY AND PETROCHEMICAL FILTRATION MARKET, BY END USER, 2025-2030 (USD MILLION)
- TABLE 247 REST OF SOUTH AMERICA: REFINERY AND PETROCHEMICAL FILTRATION MARKET, BY END USER, 2021-2024 (USD MILLION)
- TABLE 248 REST OF SOUTH AMERICA: REFINERY AND PETROCHEMICAL FILTRATION MARKET, BY END USER, 2025-2030 (USD MILLION)
- TABLE 249 OVERVIEW OF KEY STRATEGIES ADOPTED BY TOP PLAYERS, 2020-2025
- TABLE 250 REFINERY AND PETROCHEMICAL FILTRATION MARKET: DEGREE OF COMPETITION
- TABLE 251 REFINERY AND PETROCHEMICAL FILTRATION MARKET: COMPANY FOOTPRINT
- TABLE 252 REFINERY AND PETROCHEMICAL FILTRATION MARKET: REGION FOOTPRINT
- TABLE 253 REFINERY AND PETROCHEMICAL FILTRATION MARKET: FILTER TYPE FOOTPRINT
- TABLE 254 REFINERY AND PETROCHEMICAL FILTRATION MARKET: END USER FOOTPRINT
- TABLE 255 REFINERY AND PETROCHEMICAL FILTRATION MARKET: APPLICATION FOOTPRINT
- TABLE 256 REFINERY AND PETROCHEMICAL FILTRATION MARKET: LIST OF KEY STARTUPS/SMES
- TABLE 257 REFINERY AND PETROCHEMICAL FILTRATION MARKET: COMPETITIVE BENCHMARKING OF KEY STARTUPS/SMES
- TABLE 258 REFINERY AND PETROCHEMICAL FILTRATION MARKET: PRODUCT LAUNCHES, JANUARY 2020-JULY 2025
- TABLE 259 REFINERY AND PETROCHEMICAL FILTRATION MARKET: DEALS, JANUARY 2020-JULY 2025
- TABLE 260 REFINERY AND PETROCHEMICAL FILTRATION MARKET: EXPANSIONS, JANUARY 2020-JULY 2025
- TABLE 261 REFINERY AND PETROCHEMICAL FILTRATION MARKET: OTHER DEVELOPMENTS, JANUARY 2020-JULY 2025
- TABLE 262 3M: COMPANY OVERVIEW
- TABLE 263 3M: PRODUCTS/SOLUTIONS/SERVICES OFFERED
- TABLE 264 3M: DEALS
- TABLE 265 3M: OTHER DEVELOPMENTS
- TABLE 266 EATON: COMPANY OVERVIEW
- TABLE 267 EATON: PRODUCTS/SOLUTIONS/SERVICES OFFERED
- TABLE 268 EATON: PRODUCT LAUNCHES
- TABLE 269 EATON: EXPANSIONS
- TABLE 270 PARKER HANNIFIN CORP.: COMPANY OVERVIEW
- TABLE 271 PARKER HANNIFIN CORP.: PRODUCTS/SOLUTIONS/SERVICES OFFERED
- TABLE 272 PARKER HANNIFIN CORP.: PRODUCT LAUNCHES
- TABLE 273 PARKER HANNIFIN CORP.: DEALS
- TABLE 274 PENTAIR: COMPANY OVERVIEW
- TABLE 275 PENTAIR: PRODUCTS/SOLUTIONS/SERVICES OFFERED
- TABLE 276 PENTAIR: PRODUCT LAUNCHES
- TABLE 277 CAMFIL: COMPANY OVERVIEW
- TABLE 278 CAMFIL: PRODUCTS/SOLUTIONS/SERVICES OFFERED
- TABLE 279 CAMFIL: PRODUCT LAUNCHES
- TABLE 280 W.L. GORE & ASSOCIATES, INC.: COMPANY OVERVIEW
- TABLE 281 W.L. GORE & ASSOCIATES, INC.: PRODUCTS/SOLUTIONS/SERVICES OFFERED
- TABLE 282 W.L. GORE & ASSOCIATES, INC.: PRODUCT LAUNCHES
- TABLE 283 PALL CORPORATION: COMPANY OVERVIEW
- TABLE 284 PALL CORPORATION: PRODUCTS/SOLUTIONS/SERVICES OFFERED
- TABLE 285 PALL CORPORATION: PRODUCT LAUNCHES
- TABLE 286 PALL CORPORATION: EXPANSIONS
- TABLE 287 PALL CORPORATION: OTHER DEVELOPMENTS
- TABLE 288 FILTRATION GROUP: COMPANY OVERVIEW
- TABLE 289 FILTRATION GROUP: PRODUCTS/SOLUTIONS/SERVICES OFFERED
- TABLE 290 FILTRATION GROUP: DEALS
- TABLE 291 FILTRATION GROUP: EXPANSIONS
- TABLE 292 FILTCARE TECHNOLOGY PVT. LTD.: COMPANY OVERVIEW
- TABLE 293 FILTCARE TECHNOLOGY PVT. LTD.: PRODUCTS/SOLUTIONS/SERVICES OFFERED
- TABLE 294 FTC: COMPANY OVERVIEW
- TABLE 295 FTC: PRODUCTS/SOLUTIONS/SERVICES OFFERED
- TABLE 296 PORVAIR FILTRATION GROUP: COMPANY OVERVIEW
- TABLE 297 PORVAIR FILTRATION GROUP: PRODUCTS/SOLUTIONS/SERVICES OFFERED
- TABLE 298 PORVAIR FILTRATION GROUP: PRODUCT LAUNCHES
- TABLE 299 PORVAIR FILTRATION: DEALS
- TABLE 300 LENNTECH B.V.: COMPANY OVERVIEW
- TABLE 301 LENNTECH B.V.: PRODUCTS/SOLUTIONS/SERVICES OFFERED
- TABLE 302 AMAZON FILTERS LTD.: COMPANY OVERVIEW
- TABLE 303 AMAZON FILTERS LTD.: PRODUCTS/SOLUTIONS/SERVICES OFFERED
- TABLE 304 AMAZON FILTERS LTD.: PRODUCT LAUNCHES
- TABLE 305 AMAZON FILTERS LTD.: EXPANSIONS
- TABLE 306 NORMAN FILTER COMPANY: COMPANY OVERVIEW
- TABLE 307 NORMAN FILTER COMPANY: PRODUCTS/SOLUTIONS/SERVICES OFFERED
- TABLE 308 SUNGOV ENGINEERING: COMPANY OVERVIEW
- TABLE 309 SUNGOV ENGINEERING: PRODUCTS/SOLUTIONS/SERVICES OFFERED
List of Figures
- FIGURE 1 REFINERY AND PETROCHEMICAL FILTRATION MARKET SEGMENTATION
- FIGURE 2 REFINERY AND PETROCHEMICAL FILTRATION MARKET: RESEARCH DESIGN
- FIGURE 3 DATA TRIANGULATION: REFINERY AND PETROCHEMICAL FILTRATION MARKET
- FIGURE 4 BREAKDOWN OF PRIMARIES
- FIGURE 5 MAIN METRICS CONSIDERED TO ANALYZE AND ASSESS DEMAND FOR REFINERY AND PETROCHEMICAL FILTRATION SYSTEMS
- FIGURE 6 MARKET SIZE ESTIMATION METHODOLOGY: BOTTOM-UP APPROACH
- FIGURE 7 MARKET SIZE ESTIMATION METHODOLOGY: TOP-DOWN APPROACH
- FIGURE 8 KEY STEPS CONSIDERED TO ASSESS SUPPLY OF REFINERY AND PETROCHEMICAL FILTRATION SYSTEMS
- FIGURE 9 REFINERY AND PETROCHEMICAL FILTRATION MARKET: SUPPLY-SIDE ANALYSIS
- FIGURE 10 ASIA PACIFIC TO REGISTER HIGHEST CAGR IN REFINERY AND PETROCHEMICAL FILTRATION MARKET FROM 2025 TO 2030
- FIGURE 11 COALESCER FILTER SEGMENT TO LEAD REFINERY AND PETROCHEMICAL FILTRATION MARKET DURING FORECAST PERIOD
- FIGURE 12 OTHER APPLICATIONS SEGMENT TO LEAD REFINERY AND PETROCHEMICAL FILTRATION MARKET DURING FORECAST PERIOD
- FIGURE 13 REFINERIES SEGMENT TO LEAD REFINERY AND PETROCHEMICAL FILTRATION MARKET DURING FORECAST PERIOD
- FIGURE 14 RISING FUEL CONSUMPTION TO BOOST MARKET GROWTH DURING FORECAST PERIOD
- FIGURE 15 ASIA PACIFIC TO REGISTER HIGHEST CAGR DURING FORECAST PERIOD
- FIGURE 16 US ACCOUNTED FOR DOMINANT SHARE OF NORTH AMERICAN REFINERY AND PETROCHEMICAL FILTRATION MARKET IN 2024
- FIGURE 17 COALESCER FILTER SEGMENT TO ACCOUNT FOR LARGEST SHARE OF REFINERY AND PETROCHEMICAL FILTRATION MARKET IN 2030
- FIGURE 18 OTHER APPLICATIONS SEGMENT TO LEAD REFINERY AND PETROCHEMICAL FILTRATION MARKET IN 2030
- FIGURE 19 REFINERIES TO BE LARGER END USER IN REFINERY AND PETROCHEMICAL FILTRATION IN 2030
- FIGURE 20 REFINERY AND PETROCHEMICAL FILTRATION MARKET: DRIVERS, RESTRAINTS, OPPORTUNITIES, AND CHALLENGES
- FIGURE 21 INSTALLED RENEWABLE ENERGY CAPACITY WORLDWIDE IN 2024
- FIGURE 22 RECOVERABLE SHALE OIL AND GAS RESERVES ACROSS MAJOR COUNTRIES
- FIGURE 23 GLOBAL VEHICLE SALES, 2019-2024
- FIGURE 24 REVENUE SHIFTS FOR REFINERY AND PETROCHEMICAL FILTRATION SYSTEM MANUFACTURERS
- FIGURE 25 ECOSYSTEM ANALYSIS: REFINERY AND PETROCHEMICAL FILTRATION MARKET
- FIGURE 26 REFINERY AND PETROCHEMICAL FILTRATION MARKET: VALUE CHAIN ANALYSIS
- FIGURE 27 AVERAGE SELLING PRICE OF REFINERY AND PETROCHEMICAL FILTRATION UNITS, BY FILTER TYPE
- FIGURE 28 AVERAGE SELLING PRICE TREND ANALYSIS, BY REGION (2022-2024)
- FIGURE 29 EXPORT SCENARIO FOR HS CODE 842199-COMPLIANT PRODUCTS, 2020-2024
- FIGURE 30 IMPORT SCENARIO FOR HS CODE 842199-COMPLIANT PRODUCTS, 2020-2024
- FIGURE 31 REFINERY AND PETROCHEMICAL FILTRATION MARKET: PORTER'S FIVE FORCES ANALYSIS
- FIGURE 32 INFLUENCE OF STAKEHOLDERS ON BUYING PROCESS, BY END USER
- FIGURE 33 KEY BUYING CRITERIA, BY END USER
- FIGURE 34 IMPACT OF GEN AI/AI ON REFINERY AND PETROCHEMICAL FILTRATION MARKET, BY END USER
- FIGURE 35 REFINERY AND PETROCHEMICAL FILTRATION MARKET, BY FILTER TYPE, 2024
- FIGURE 36 REFINERY AND PETROCHEMICAL FILTRATION MARKET, BY APPLICATION, 2024
- FIGURE 37 REFINERY AND PETROCHEMICAL FILTRATION MARKET, BY END USER, 2024
- FIGURE 38 ASIA PACIFIC REFINERY AND PETROCHEMICAL FILTRATION MARKET TO REGISTER HIGHEST CAGR FROM 2025 TO 2030
- FIGURE 39 REFINERY AND PETROCHEMICAL FILTRATION MARKET, BY REGION, 2024
- FIGURE 40 ASIA PACIFIC: REFINERY AND PETROCHEMICAL FILTRATION MARKET SNAPSHOT
- FIGURE 41 NORTH AMERICA: REFINERY AND PETROCHEMICAL FILTRATION MARKET SNAPSHOT
- FIGURE 42 REFINERY AND PETROCHEMICAL FILTRATION MARKET SHARE ANALYSIS, 2024
- FIGURE 43 TOP PLAYERS IN REFINERY AND PETROCHEMICAL FILTRATION MARKET FROM 2020 TO 2024
- FIGURE 44 COMPANY VALUATION, 2024
- FIGURE 45 FINANCIAL METRICS, 2024
- FIGURE 46 BRAND/PRODUCT COMPARISON
- FIGURE 47 REFINERY AND PETROCHEMICAL FILTRATION MARKET: COMPANY EVALUATION MATRIX (KEY PLAYERS), 2024
- FIGURE 48 REFINERY AND PETROCHEMICAL FILTRATION MARKET: COMPANY EVALUATION MATRIX (STARTUPS/SMES), 2024
- FIGURE 49 3M: COMPANY SNAPSHOT
- FIGURE 50 EATON: COMPANY SNAPSHOT
- FIGURE 51 PARKER HANNIFIN CORP.: COMPANY SNAPSHOT
- FIGURE 52 PENTAIR: COMPANY SNAPSHOT
- FIGURE 53 PORVAIR FILTRATION GROUP: COMPANY SNAPSHOT
目次
The global refinery and petrochemical filtration market is projected to grow from USD 5.08 billion in 2025 to USD 6.76 billion by 2030, at a CAGR of 5.9%.
| Scope of the Report | |
|---|---|
| Years Considered for the Study | 2021-2030 |
| Base Year | 2024 |
| Forecast Period | 2025-2030 |
| Units Considered | Value (USD Million/Billion) |
| Segments | Refinery and petrochemical filtration market by filter type, application, and end user |
| Regions covered | Asia Pacific, North America, Europe, South America, and Middle East & Africa |
Rising energy demand is driving increased downstream investments, boosting market growth. However, frequent replacement and disposal of filters pose a significant restraint, impacting operational costs and creating challenges for sustainability and waste management in the industry.
"The petrochemical industry is projected to emerge as the fastest-growing end user during the forecast period."
By end user, the refinery and petrochemical filtration market has been segmented into refineries and the petrochemical industry. Increasing infrastructure investments in the petrochemical industry are anticipated to drive the demand for petrochemical filtration. The rising investment in petrochemical plants is driven by increasing demand for products such as plastics, synthetic fibers, fertilizers, and chemicals as economies develop and populations grow. Petrochemical plant operators use bag filters, cartridge filters, membrane filters, and coalescers to remove impurities, contaminants, and particles from feedstocks and final products.
"The liquid-liquid segment is estimated to be the second-largest application."
Based on application, the liquid-liquid separation segment holds the second-largest share in the refinery and petrochemical filtration market due to its critical role in the downstream oil & gas sector. It is essential for removing water from gasoline, diesel, kerosene, and jet fuel to meet product quality specifications and prevent corrosion. This separation process helps to protect catalysts and adsorbents from water contamination, eliminates carryover of caustic and amine from treatment processes, and protects equipment such as salt dryers and clay towers. The high share of the liquid-liquid segment is driven by increasing refining capacity worldwide, stringent regulations for cleaner fuels, and the need to enhance operational efficiency, product purity, and equipment lifespan through effective water and impurity removal.
"Asia Pacific is estimated to be the second-largest refinery and petrochemical filtration market."
Asia Pacific is expected to be the second-largest refinery and petrochemical filtration market between 2025 and 2030. The downstream sector is growing in the region due to the increasing demand for petrochemical products. Moreover, countries in this region have strategic locations for refineries, which enable them to access crude oil supplies from the Middle East and other regions. Additionally, governments of countries in the region have implemented policies and incentives to attract foreign investments in the downstream sector. These are the key factors fostering the growth of the refinery and petrochemical filtration market in Asia Pacific.
Breakdown of Primaries:
In-depth interviews have been conducted with various key industry participants, subject-matter experts, C-level executives of key market players, and industry consultants, among other experts, to obtain and verify critical qualitative and quantitative information, as well as to assess future market prospects. The distribution of primary interviews is as follows:
By Company Type: Tier 1 - 45%, Tier 2 - 30%, and Tier 3 - 25%
By Designation: C-Level - 35%, Director Levels - 25%, and Others - 40%
By Region: Asia Pacific - 33%, North America - 27%, Europe - 20%, the Middle East & Africa - 12%, and South America - 8%
Notes: Others include product engineers, product specialists, and engineering leads.
The tiers of the companies are defined on the basis of their total revenues as of 2024. Tier 1: > USD 1 billion, Tier 2: From USD 500 million to USD 1 billion, and Tier 3: < USD 500 million
The refinery and petrochemical filtration market is dominated by a few major players that have a wide geographical presence. The leading players in the refinery and petrochemical filtration market are 3M (US), Pall Corporation (US), Parker Hannifin Corporation (US), Eaton (Ireland), Pentair (US), and others.
Research Coverage:
The report defines, describes, and forecasts the global refinery and petrochemical filtration market by filter type, application, end user, and region. It also offers a detailed qualitative and quantitative analysis of the market. The report provides a comprehensive review of the major market drivers, restraints, opportunities, and challenges. It also covers various important aspects of the market. These include an analysis of the competitive landscape, market dynamics, market estimates, in terms of value, and future trends in the refinery and petrochemical filtration market.
Key Benefits of Buying the Report
- Analysis of key drivers (Implementation of government mandates and policies for environmental protection, Increasing expenditure on refinery and petrochemical infrastructure development), restraints (Availability of low-cost and inferior-quality filtration products, Increasing focus on use of renewable energy), opportunities (Continuous shale development activities to enhance shale refining potential, Expanding transportation sector), and challenges (Supply chain constraints, Frequent replacement and disposal of filters) influencing the growth of the refinery and petrochemical filtration market
- Product Development/ Innovation: Trends such as innovative filter media materials, designs, and processes have led to more efficient, reliable, compact, and longer-lasting filters. The focus on sustainability and reducing carbon footprints has also led to the expectation that filter media will contribute to lower energy consumption.
- Market Development: Eaton expanded its offline filter units portfolio by introducing a compact, portable hydraulic filtration solution ideal for the oil & gas and power generation sectors, especially refinery equipment. This mobile unit offers high-efficiency hydraulic fluid filtration in hard-to-reach locations, enhancing system reliability and equipment longevity. Its portability and robust design make it perfectly suited for demanding industrial environments, supporting continuous operation and reducing maintenance downtime in critical refinery and power generation applications.
- Market Diversification: Eaton launched SENTINEL MAXPO and DURAGAF MAXPOXL specialty filter bags designed for oil, chemical, and petrochemical filtration. These polypropylene needle felt bags feature a fully-welded construction with an additional internal meltblown polypropylene core that enhances dirt-holding capacity and oil absorption. The DURAGAF MAXPOXL range offers a two to five times longer lifespan than standard bags, reducing operational costs. Both ranges are available with nominal retention rates from 1 to 200 µm, optimizing filtration efficiency and durability in industrial applications.
- Competitive Assessment: In-depth assessment of market shares, growth strategies, and service offerings of leading players like 3M (US), Pall Corporation (US), Parker Hannifin Corporation (US), Eaton (Ireland), and Pentair (US), among others, in the refinery and petrochemical filtration market has been provided.
TABLE OF CONTENTS
1 INTRODUCTION
- 1.1 STUDY OBJECTIVES
- 1.2 MARKET DEFINITION
- 1.2.1 INCLUSIONS AND EXCLUSIONS
- 1.2.1.1 Refinery and petrochemical filtration market, by filter type
- 1.2.1.2 Refinery and petrochemical filtration market, by application
- 1.2.1.3 Refinery and petrochemical filtration market, by end user
- 1.2.1 INCLUSIONS AND EXCLUSIONS
- 1.3 MARKET SCOPE
- 1.3.1 YEARS CONSIDERED
- 1.4 CURRENCY CONSIDERED
- 1.5 LIMITATIONS
- 1.6 STAKEHOLDERS
2 RESEARCH METHODOLOGY
- 2.1 RESEARCH DATA
- 2.2 MARKET BREAKDOWN AND DATA TRIANGULATION
- 2.2.1 SECONDARY DATA
- 2.2.1.1 Key data from secondary sources
- 2.2.2 PRIMARY DATA
- 2.2.2.1 Key data from primary sources
- 2.2.2.2 Breakdown of primaries
- 2.2.1 SECONDARY DATA
- 2.3 MARKET SIZE ESTIMATION
- 2.3.1 BOTTOM-UP APPROACH
- 2.3.2 TOP-DOWN APPROACH
- 2.3.3 DEMAND-SIDE ANALYSIS
- 2.3.3.1 Regional analysis
- 2.3.3.2 Country-level analysis
- 2.3.3.3 Demand-side assumptions
- 2.3.3.4 Demand-side calculations
- 2.3.4 SUPPLY-SIDE ANALYSIS
- 2.3.4.1 Supply-side calculations
- 2.3.4.2 Supply-side assumptions
- 2.3.5 MARKET GROWTH FORECAST
3 EXECUTIVE SUMMARY
4 PREMIUM INSIGHTS
- 4.1 ATTRACTIVE OPPORTUNITIES FOR PLAYERS IN REFINERY AND PETROCHEMICAL FILTRATION MARKET
- 4.2 REFINERY AND PETROCHEMICAL FILTRATION MARKET, BY REGION
- 4.3 NORTH AMERICAN REFINERY AND PETROCHEMICAL FILTRATION MARKET, BY APPLICATION AND COUNTRY
- 4.4 REFINERY AND PETROCHEMICAL FILTRATION MARKET, BY FILTER TYPE
- 4.5 REFINERY AND PETROCHEMICAL FILTRATION MARKET, BY APPLICATION
- 4.6 REFINERY AND PETROCHEMICAL FILTRATION MARKET, BY END USER
5 MARKET OVERVIEW
- 5.1 INTRODUCTION
- 5.2 MARKET DYNAMICS
- 5.2.1 DRIVERS
- 5.2.1.1 Implementation of government mandates and policies for environmental protection
- 5.2.1.2 Increasing expenditure on refinery and petrochemical infrastructure development
- 5.2.2 RESTRAINTS
- 5.2.2.1 Availability of low-cost and inferior-quality filtration products
- 5.2.2.2 Increasing focus on use of renewable energy
- 5.2.3 OPPORTUNITIES
- 5.2.3.1 Rising shale development activities to enhance shale refining potential
- 5.2.3.2 Expanding transportation sector
- 5.2.4 CHALLENGES
- 5.2.4.1 Supply chain constraints
- 5.2.4.2 Frequent replacement and disposal of filters
- 5.2.1 DRIVERS
- 5.3 TRENDS/DISRUPTIONS IMPACTING CUSTOMER BUSINESS
- 5.3.1 REVENUE SHIFTS AND NEW REVENUE POCKETS FOR REFINERY AND PETROCHEMICAL FILTRATION SYSTEM MANUFACTURERS
- 5.4 ECOSYSTEM ANALYSIS
- 5.5 VALUE CHAIN ANALYSIS
- 5.5.1 RAW MATERIAL PROVIDERS/SUPPLIERS
- 5.5.2 REFINERY AND PETROCHEMICAL FILTRATION SYSTEM MANUFACTURERS
- 5.5.3 DISTRIBUTORS AND END USERS
- 5.5.4 POST-SALES SERVICE PROVIDERS
- 5.6 PRICING ANALYSIS
- 5.7 REPLACEMENT RATE
- 5.8 TECHNOLOGY ANALYSIS
- 5.8.1 NANOFIBER FILTRATION MEDIA AND MEMBRANE FILTERS
- 5.9 TARIFF AND REGULATORY LANDSCAPE
- 5.9.1 TARIFFS RELATED TO REFINERY AND PETROCHEMICAL FILTRATION UNITS
- 5.9.2 REGULATORY BODIES, GOVERNMENT AGENCIES, AND OTHER ORGANIZATIONS
- 5.9.3 CODES AND REGULATIONS RELATED TO REFINERY AND PETROCHEMICAL FILTRATION
- 5.10 PATENT ANALYSIS
- 5.11 TRADE ANALYSIS
- 5.11.1 EXPORT SCENARIO
- 5.11.2 IMPORT SCENARIO
- 5.12 KEY CONFERENCES AND EVENTS, 2025-2026
- 5.13 CASE STUDY ANALYSIS
- 5.13.1 JONELL SYSTEMS REDUCED COALESCING COSTS IN EUROPEAN REFINERY
- 5.13.2 JONELL SYSTEMS' REFINERY PRE-FILTRATION SOLUTION SAVED USD 2 MILLION FOR US REFINERY
- 5.14 PORTER'S FIVE FORCES ANALYSIS
- 5.14.1 THREAT OF SUBSTITUTES
- 5.14.2 BARGAINING POWER OF SUPPLIERS
- 5.14.3 BARGAINING POWER OF BUYERS
- 5.14.4 THREAT OF NEW ENTRANTS
- 5.14.5 INTENSITY OF COMPETITIVE RIVALRY
- 5.15 KEY STAKEHOLDERS AND BUYING CRITERIA
- 5.15.1 KEY STAKEHOLDERS IN BUYING PROCESS
- 5.15.2 BUYING CRITERIA
- 5.16 IMPACT OF GEN AI/AI ON REFINERY AND PETROCHEMICAL FILTRATION MARKET
- 5.16.1 ADOPTION OF GEN AI/AI IN REFINERY AND PETROCHEMICAL FILTRATION MARKET
- 5.16.2 IMPACT OF GEN AI/AI, BY END USER
- 5.16.3 IMPACT OF GEN AI/AI ON REFINERY AND PETROCHEMICAL FILTRATION MARKET, BY REGION
- 5.17 GLOBAL MACROECONOMIC OUTLOOK
- 5.17.1 INTRODUCTION
- 5.17.2 GDP TRENDS AND FORECAST
- 5.17.3 IMPACT OF INFLATION ON REFINERY AND PETROCHEMICAL FILTRATION MARKET
- 5.18 IMPACT OF 2025 US TARIFF - OVERVIEW
- 5.18.1 INTRODUCTION
- 5.18.2 KEY TARIFF RATES
- 5.18.3 IMPACT ON REGIONS
- 5.18.3.1 North America
- 5.18.3.2 Europe
- 5.18.3.3 Asia Pacific
- 5.18.3.4 South america
- 5.18.3.5 Middle East & Africa
6 REFINERY AND PETROCHEMICAL FILTRATION MARKET, BY FILTER TYPE
- 6.1 INTRODUCTION
- 6.2 COALESCER FILTER
- 6.2.1 EFFECTIVENESS AT SEPARATING LIQUIDS FROM LIQUIDS AND GASES TO DRIVE MARKET
- 6.2.1.1 Liquid-liquid coalescer
- 6.2.1.1.1 Offers cost-effective solution for separating liquids from liquids
- 6.2.1.2 Liquid-gas coalescer
- 6.2.1.2.1 Offer efficient solution to enhance quality of end products
- 6.2.1.1 Liquid-liquid coalescer
- 6.2.1 EFFECTIVENESS AT SEPARATING LIQUIDS FROM LIQUIDS AND GASES TO DRIVE MARKET
- 6.3 CARTRIDGE FILTER
- 6.3.1 OFFERS HIGH VERSATILITY AND REQUIRES LESS MAINTENANCE
- 6.3.1.1 Pleated cartridge filter
- 6.3.1.1.1 Offers good filtration efficiency due to large surface area
- 6.3.1.2 Depth cartridge filter
- 6.3.1.2.1 Long service life and effectiveness against different contaminants to drive demand
- 6.3.1.3 High flow cartridge filter
- 6.3.1.3.1 Demand in high-flow processes to drive segmental growth
- 6.3.1.1 Pleated cartridge filter
- 6.3.1 OFFERS HIGH VERSATILITY AND REQUIRES LESS MAINTENANCE
- 6.4 ELECTROSTATIC PRECIPITATOR
- 6.4.1 HIGH EFFICIENCY IN REMOVING PARTICULATE MATTER AND POLLUTANTS FROM EXHAUST GASES TO FUEL DEMAND
- 6.5 FILTER PRESS
- 6.5.1 INCREASING USE IN DEWATERING, CLARIFICATION, AND SLUDGE HANDLING APPLICATIONS TO SUPPORT MARKET GROWTH
- 6.6 BAG FILTER
- 6.6.1 EASE OF INSTALLATION AND MAINTENANCE, HIGH DIRT-HOLDING CAPACITY, AND LONG SERVICE LIFE TO DRIVE DEMAND
- 6.7 OTHER FILTER TYPES
7 REFINERY AND PETROCHEMICAL FILTRATION MARKET, BY APPLICATION
- 7.1 INTRODUCTION
- 7.2 LIQUID-LIQUID SEPARATION
- 7.2.1 WIDE ADOPTION IN REMOVAL OF WATER FROM FUEL TO DRIVE DEMAND
- 7.3 LIQUID-GAS SEPARATION
- 7.3.1 NEED FOR HYDROGEN RECYCLE GAS COMPRESSOR PROTECTION AND OTHER PROCESSES TO FUEL DEMAND
- 7.4 OTHER APPLICATIONS
8 REFINERY AND PETROCHEMICAL FILTRATION MARKET, BY END USER
- 8.1 INTRODUCTION
- 8.2 REFINERIES
- 8.2.1 RISING INVESTMENTS IN REFINERIES TO DRIVE MARKET GROWTH
- 8.3 PETROCHEMICAL INDUSTRY
- 8.3.1 INVESTMENTS IN EXPANSION OF PETROCHEMICAL SECTOR TO DRIVE DEMAND
9 REFINERY AND PETROCHEMICAL FILTRATION MARKET, BY REGION
- 9.1 INTRODUCTION
- 9.2 ASIA PACIFIC
- 9.2.1 BY FILTER TYPE
- 9.2.2 BY APPLICATION
- 9.2.3 BY END USER
- 9.2.4 BY COUNTRY
- 9.2.4.1 China
- 9.2.4.1.1 Rising investments in refinery and petrochemical infrastructure development to drive market
- 9.2.4.2 India
- 9.2.4.2.1 Increasing investments in refineries and petrochemical plants to support market growth
- 9.2.4.3 Japan
- 9.2.4.3.1 Favorable government policies to support market growth
- 9.2.4.4 Australia
- 9.2.4.4.1 Government-led initiatives to enhance fuel quality to drive demand
- 9.2.4.5 South Korea
- 9.2.4.5.1 Capacity expansion and major foreign investments accelerating market growth
- 9.2.4.6 Rest of Asia Pacific
- 9.2.4.1 China
- 9.3 NORTH AMERICA
- 9.3.1 BY FILTER TYPE
- 9.3.2 BY APPLICATION
- 9.3.3 BY END USER
- 9.3.4 BY COUNTRY
- 9.3.4.1 US
- 9.3.4.1.1 Government policies and funding for development of downstream oil & gas industry to drive demand
- 9.3.4.2 Canada
- 9.3.4.2.1 Environmental initiatives to reduce greenhouse gas emissions to support market growth
- 9.3.4.3 Mexico
- 9.3.4.3.1 Increasing investments in downstream infrastructure to fuel market
- 9.3.4.1 US
- 9.4 EUROPE
- 9.4.1 BY FILTER TYPE
- 9.4.2 BY APPLICATION
- 9.4.3 BY END USER
- 9.4.4 BY COUNTRY
- 9.4.4.1 Russia
- 9.4.4.1.1 High crude production to boost downstream investment
- 9.4.4.2 Germany
- 9.4.4.2.1 High energy requirement to fuel market growth
- 9.4.4.3 UK
- 9.4.4.3.1 Favorable government policies related to industrial waste management to support market growth
- 9.4.4.4 France
- 9.4.4.4.1 Technological advancements in refineries to increase demand
- 9.4.4.5 Italy
- 9.4.4.5.1 High refining potential and presence of stringent environmental regulations to fuel market
- 9.4.4.6 Rest of Europe
- 9.4.4.1 Russia
- 9.5 MIDDLE EAST & AFRICA
- 9.5.1 BY FILTER TYPE
- 9.5.2 BY APPLICATION
- 9.5.3 BY END USER
- 9.5.4 BY COUNTRY
- 9.5.4.1 Saudi Arabia
- 9.5.4.1.1 Rising infrastructure development investments to drive market growth
- 9.5.4.2 UAE
- 9.5.4.2.1 Favorable government policies and partnerships with international companies to support market growth
- 9.5.4.3 South Africa
- 9.5.4.3.1 Government initiatives to support petrochemical industry to drive market
- 9.5.4.4 Rest of Middle East & Africa
- 9.5.4.1 Saudi Arabia
- 9.6 SOUTH AMERICA
- 9.6.1 BY FILTER TYPE
- 9.6.2 BY APPLICATION
- 9.6.3 BY END USER
- 9.6.4 BY COUNTRY
- 9.6.4.1 Brazil
- 9.6.4.1.1 Rising investments in infrastructure development in refineries and petrochemical industry to drive demand
- 9.6.4.2 Argentina
- 9.6.4.2.1 Increase in new infrastructure development investments to fuel market growth
- 9.6.4.3 Rest of South America
- 9.6.4.1 Brazil
10 COMPETITIVE LANDSCAPE
- 10.1 STRATEGIES ADOPTED BY KEY PLAYERS
- 10.2 KEY PLAYERS' STRATEGIES/RIGHT TO WIN, JANUARY 2020-JULY 2025
- 10.3 MARKET SHARE ANALYSIS OF TOP FIVE PLAYERS
- 10.4 REVENUE ANALYSIS
- 10.5 COMPANY VALUATION AND FINANCIAL METRICS
- 10.6 BRAND/PRODUCT COMPARISON
- 10.7 COMPANY EVALUATION MATRIX: KEY PLAYERS, 2024
- 10.7.1 STARS
- 10.7.2 PERVASIVE PLAYERS
- 10.7.3 EMERGING LEADERS
- 10.7.4 PARTICIPANTS
- 10.7.5 COMPANY FOOTPRINT: KEY PLAYERS, 2024
- 10.7.5.1 Company footprint
- 10.7.5.2 Region footprint
- 10.7.5.3 Filter type footprint
- 10.7.5.4 End user footprint
- 10.7.5.5 Application footprint
- 10.8 COMPANY EVALUATION MATRIX: STARTUPS/SMALL AND MEDIUM-SIZED ENTERPRISES (SMES), 2024
- 10.8.1 PROGRESSIVE COMPANIES
- 10.8.2 RESPONSIVE COMPANIES
- 10.8.3 DYNAMIC COMPANIES
- 10.8.4 STARTING BLOCKS
- 10.8.5 COMPETITIVE BENCHMARKING: KEY STARTUPS/SMES, 2024
- 10.8.5.1 Detailed list of key startups/SMEs
- 10.8.5.2 Competitive benchmarking of key startups/SMEs
- 10.9 COMPETITIVE SCENARIO
- 10.9.1 PRODUCT LAUNCHES
- 10.9.2 DEALS
- 10.9.3 EXPANSIONS
- 10.9.4 OTHER DEVELOPMENTS
11 COMPANY PROFILES
- 11.1 KEY PLAYERS
- 11.1.1 3M
- 11.1.1.1 Business overview
- 11.1.1.2 Products/Solutions/Services offered
- 11.1.1.3 Recent developments
- 11.1.1.3.1 Deals
- 11.1.1.3.2 Other developments
- 11.1.1.4 MnM view
- 11.1.1.4.1 Right to win
- 11.1.1.4.2 Strategic choices
- 11.1.1.4.3 Weaknesses and competitive threats
- 11.1.2 EATON
- 11.1.2.1 Business overview
- 11.1.2.2 Products/Solutions/Services offered
- 11.1.2.3 Recent developments
- 11.1.2.3.1 Product launches
- 11.1.2.3.2 Expansions
- 11.1.2.4 MnM view
- 11.1.2.4.1 Right to win
- 11.1.2.4.2 Strategic choices
- 11.1.2.4.3 Weaknesses and competitive threats
- 11.1.3 PARKER HANNIFIN CORP.
- 11.1.3.1 Business overview
- 11.1.3.2 Products/Solutions/Services offered
- 11.1.3.3 Recent developments
- 11.1.3.3.1 Product launches
- 11.1.3.3.2 Deals
- 11.1.3.4 MnM view
- 11.1.3.4.1 Right to win
- 11.1.3.4.2 Strategic choices
- 11.1.3.4.3 Weaknesses and competitive threats
- 11.1.4 PENTAIR
- 11.1.4.1 Business overview
- 11.1.4.2 Products/Solutions/Services offered
- 11.1.4.3 Recent developments
- 11.1.4.3.1 Product launches
- 11.1.4.4 MnM view
- 11.1.4.4.1 Right to win
- 11.1.4.4.2 Strategic choices
- 11.1.4.4.3 Weaknesses and competitive threats
- 11.1.5 CAMFIL
- 11.1.5.1 Business overview
- 11.1.5.2 Products/Solutions/Services offered
- 11.1.5.3 Recent developments
- 11.1.5.3.1 Product launches
- 11.1.6 W.L. GORE & ASSOCIATES, INC.
- 11.1.6.1 Business overview
- 11.1.6.2 Products/Solutions/Services offered
- 11.1.6.3 Recent developments
- 11.1.6.3.1 Product launches
- 11.1.7 PALL CORPORATION
- 11.1.7.1 Business overview
- 11.1.7.2 Products/Solutions/Services offered
- 11.1.7.3 Recent developments
- 11.1.7.3.1 Product launches
- 11.1.7.3.2 Expansions
- 11.1.7.3.3 Other developments
- 11.1.7.4 MnM view
- 11.1.7.4.1 Right to win
- 11.1.7.4.2 Strategic choices
- 11.1.7.4.3 Weaknesses and competitive threats
- 11.1.8 FILTRATION GROUP
- 11.1.8.1 Business overview
- 11.1.8.2 Products/Solutions/Services offered
- 11.1.8.3 Recent developments
- 11.1.8.3.1 Deals
- 11.1.8.3.2 Expansions
- 11.1.9 FILTCARE TECHNOLOGY PVT. LTD.
- 11.1.9.1 Business overview
- 11.1.9.2 Products/Solutions/Services offered
- 11.1.10 FTC
- 11.1.10.1 Business overview
- 11.1.10.2 Products/Solutions/Services offered
- 11.1.11 PORVAIR FILTRATION GROUP
- 11.1.11.1 Business overview
- 11.1.11.2 Products/Solutions/Services offered
- 11.1.11.3 Recent developments
- 11.1.11.3.1 Product launches
- 11.1.11.3.2 Deals
- 11.1.12 LENNTECH B.V.
- 11.1.12.1 Business overview
- 11.1.12.2 Products/Solutions/Services offered
- 11.1.13 AMAZON FILTERS LTD.
- 11.1.13.1 Business overview
- 11.1.13.2 Products/Solutions/Services offered
- 11.1.13.3 Recent developments
- 11.1.13.3.1 Product launches
- 11.1.13.3.2 Expansions
- 11.1.14 NORMAN FILTER COMPANY
- 11.1.14.1 Business overview
- 11.1.14.2 Products/Solutions/Services offered
- 11.1.15 SUNGOV ENGINEERING
- 11.1.15.1 Business overview
- 11.1.15.2 Products/Solutions/Services offered
- 11.1.1 3M
- 11.2 OTHER PLAYERS
- 11.2.1 FILSONFILTER
- 11.2.2 BROTHER FILTRATION
- 11.2.3 COMPOSITECH PRODUCTS MANUFACTURING, INC.
- 11.2.4 KEL INDIA FILTERS
- 11.2.5 YIXING HUADING MACHINERY CO., LTD.
12 APPENDIX
- 12.1 INSIGHTS FROM INDUSTRY EXPERTS
- 12.2 DISCUSSION GUIDE
- 12.3 KNOWLEDGESTORE: MARKETSANDMARKETS' SUBSCRIPTION PORTAL
- 12.4 CUSTOMIZATION OPTIONS
- 12.5 RELATED REPORTS
- 12.6 AUTHOR DETAILS
- 発行日
- 発行
- MarketsandMarkets
- ページ情報
- 英文 258 Pages
- 納期
- 即納可能