|
|
市場調査レポート
商品コード
1755996
RIP・RIFブッシングの世界市場:タイプ別、用途別、エンドユーザー別、地域別 - 2032年までの予測RIP & RIF Bushings Market by Type, Application, End User, and Region - Global Forecast to 2032 |
||||||
|
|||||||
カスタマイズ可能
|
|||||||

| RIP・RIFブッシングの世界市場:タイプ別、用途別、エンドユーザー別、地域別 - 2032年までの予測 |
|
出版日: 2025年06月17日
発行: MarketsandMarkets
ページ情報: 英文 197 Pages
納期: 即納可能
|

全表示
- 概要
- 図表
- 目次
世界のRIP・RIFブッシングの市場規模は、5.9%のCAGRで拡大し、2025年の12億1,000万米ドルから2032年までに18億3,000万米ドルに成長すると予測されています。
| 調査範囲 | |
|---|---|
| 調査対象年 | 2021年~2032年 |
| 基準年 | 2024年 |
| 予測期間 | 2025年~2032年 |
| 検討単位 | 金額(100万米ドル) |
| セグメント別 | タイプ別、用途別、エンドユーザー別、地域別 |
| 対象地域 | 北米、欧州、アジア太平洋、中東・アフリカ、南米 |
市場成長は、近代的な電力インフラにおける、信頼性が高く、メンテナンスフリーで、環境的に持続可能な部品に対する需要の増加が後押ししています。送電網の近代化、電化、再生可能エネルギー統合への投資が増加するにつれ、公益事業会社や送電会社はRIPやRIFなどの先進ブッシング技術に目を向けています。これらの技術は、送電網の信頼性を高め、運転効率を向上させ、故障率を低下させます。特に都市部や工業地帯では、コンパクトなモジュール式変電所や高圧機器が好まれるようになっており、こうした乾式ブッシングの採用がさらに加速しています。RIP・RIFブッシングは、従来の含油ブッシングに比べ、熱性能、機械的耐久性、環境安全性に優れています。さらに、デジタル監視システムと状態ベースの資産管理の導入は、ユーティリティ企業がダウンタイムを削減し、機器の耐用年数を延ばすための予知保全戦略への依存度を高めていることから、これらのブッシングの採用を後押ししています。
2025年から2032年にかけて、世界のRIP・RIFブッシング市場では公益事業が最も高い成長率を示すと予想されます。これは、電力会社が老朽化したインフラ・グリッドの近代化と運用信頼性の向上に力を入れているためです。既存の送配電網に再生可能エネルギー源を組み込むと、複雑さが増します。再生可能エネルギー源の使用増加に伴い、高電圧、環境ストレス、メンテナンスフリーの長寿命に耐える最高グレードの絶縁材料がさらに求められています。RIP&RIFブッシングは高い絶縁耐力、耐部分放電性、難燃性を備えているため、ユーティリティ企業はシステム障害を最小限に抑え、送電網の信頼性を向上させるために、ますますRIP&RIFブッシングを好むようになっています。また、電力会社は新しい安全、効率、環境保護基準を採用し、従来の油入りブッシングの代わりに信頼性が高く安全な乾式ブッシングを使用する必要があります。新興経済諸国における農村部の電化と相まって、スマートグリッドや変電所の建設が増加しているため、電力会社向けRIP・RIFブッシングの需要がさらに高まると予想されます。
RIP・RIFブッシング市場は、従来の含油タイプよりも需要が高まり、RIP技術が進歩したため、大きな成長が見込まれています。RIPブッシングは、熱安定性、耐部分放電性、優れた機械的強度が強化されており、高負荷の電圧指令変圧器、回路遮断器、ガス絶縁開閉装置に最適です。乾式設計は油漏れのリスクを最小限に抑え、火災安全性を強化し、メンテナンスの必要性を低減します。さらに、費用対効果の高い絶縁部品の世界の普及とスマートグリッドインフラへの投資の増加が、発展途上国と先進国の両方でRIPブッシングの採用を促進しています。
アジア太平洋は、RIP・RIFブッシング市場で最も大きく急成長すると予想されます。この成長の原動力となっているのは、中国、インド、日本、韓国など、送電網の近代化が優先課題となっている国々における急速な工業化と大規模なインフラ開発です。
信頼性が高く高性能なブッシングの必要性は、再生可能エネルギーの統合、輸送の電化、送配電サービスの拡大といった需要から生じています。加えて、政府の支援政策、都市化の進展、電力消費の増加が、業界各社に事業拡大と技術革新の機会をもたらしています。
この調査レポートは、RIP・RIFブッシング市場をタイプ別(RIPとRIF)、用途別(変圧器、開閉装置、その他の用途)、エンドユーザー別(公益事業、産業、住宅&商業)、地域別に定義、記述、予測しています。また、市場の詳細な質的・量的分析も行っています。主な市場促進要因・抑制要因・機会・課題を包括的にレビューしています。また、市場の様々な重要な側面もカバーしています。RIP&RIFブッシング市場の主要企業について包括的な分析を行っています。この分析により、各社の事業概要、ソリューションとサービス、主要戦略に関する洞察が得られます。また、新製品発売、合併、買収、その他市場の最近の動向とともに、関連する契約、パートナーシップ、協定についても取り上げています。さらに、RIP・RIFブッシング市場のエコシステムにおける新興企業の競合分析も掲載しています。
当レポートは、業界リーダーや新規参入者にとっての戦略的リソースであり、市場とそのサブセグメントの包括的な分析を提供します。競合情勢を完全に理解することで、利害関係者はビジネスのポジショニングを洗練させ、効果的な市場参入戦略を考案することができます。さらに、当レポートは現在の市場力学を解明し、戦略的意思決定に役立つ重要な促進要因・制約・課題・機会を明らかにしています。
目次
第1章 イントロダクション
第2章 調査手法
第3章 エグゼクティブサマリー
第4章 重要考察
第5章 市場概要
- イントロダクション
- 市場力学
- 顧客ビジネスに影響を与える動向/混乱
- エコシステム分析
- 投資と資金調達のシナリオ
- サプライチェーン分析
- 技術分析
- 主要な会議とイベント
- 関税と規制状況
- 貿易分析
- 特許分析
- ポーターのファイブフォース分析
- 主要な利害関係者と購入基準
- 購入基準
- ケーススタディ分析
- 生成AI/AIがRIP・RIFブッシング市場に与える影響
- マクロ経済見通し
第6章 RIP・RIFブッシング市場(タイプ別)
- イントロダクション
- 樹脂含浸紙ブッシング
- 樹脂含浸グラスファイバーブッシング
第7章 RIP・RIFブッシング市場(用途別)
- イントロダクション
- トランスフォーマー
- スイッチギア
- その他
第8章 RIP・RIFブッシング市場(エンドユーザー別)
- イントロダクション
- ユーティリティ
- 工業
- 住宅および商業施設
第9章 RIP・RIFブッシング市場(地域別)
- イントロダクション
- アジア太平洋
- 中国
- インド
- 日本
- 韓国
- その他
- 北米
- 米国
- カナダ
- メキシコ
- 欧州
- ドイツ
- 英国
- フランス
- イタリア
- その他
- 中東・アフリカ
- GCC諸国
- 南アフリカ
- その他
- 南米
- ブラジル
- アルゼンチン
- その他
第10章 競合情勢
- イントロダクション
- 主要参入企業の戦略/強み、2021年~2024年
- 収益分析、2019年~2023年
- 2023年の市場シェア分析
- 企業評価と財務指標、2024年
- 製品比較
- 企業評価マトリックス:主要参入企業、2023年
- 企業評価マトリックス:スタートアップ/中小企業、2023年
- 競合シナリオ
第11章 企業プロファイル
- 主要参入企業
- ABB
- SIEMENS
- HITACHI ENERGY LTD.
- EATON
- GENERAL ELECTRIC COMPANY
- TRENCH GROUP
- RHM INTERNATIONAL, LLC
- PFISTERER HOLDING SE
- BUSHING(BEIJING)HV ELECTRIC CO., LTD.
- YASH HIGHVOLTAGE INSULATORS PVT. LTD.
- NU-CORK PRODUCTS PVT LTD
- SHANDONG CHINSUN ELECTRICAL EQUIPMENT CO., LTD
- その他の企業
- DALIAN HIVOLT POWER SYSTEM CO., LTD.
- NANJING ELECTRIC HV BUSHING CO., LTD.
- BAODING HEWEI POWER TECHNOLOGY CO., LTD.
- MASSA IZOLYATOR MEHRU PVT. LTD.
- NANJING RAINBOW ELECTRIC CO., LTD
第12章 付録
List of Tables
- TABLE 1 INCLUSIONS & EXCLUSIONS, BY TYPE
- TABLE 2 INCLUSIONS & EXCLUSIONS, BY APPLICATION
- TABLE 3 INCLUSIONS & EXCLUSIONS, BY END USER
- TABLE 4 INCLUSIONS & EXCLUSIONS, BY REGION
- TABLE 5 LIST OF KEY SECONDARY SOURCES
- TABLE 6 LIST OF PRIMARY INTERVIEW PARTICIPANTS
- TABLE 7 RIP & RIF BUSHINGS MARKET SIZE ESTIMATION METHODOLOGY (DEMAND SIDE)
- TABLE 8 RIP & RIF BUSHINGS MARKET: RISK ANALYSIS
- TABLE 9 RIP & RIF BUSHINGS MARKET SNAPSHOT
- TABLE 10 ROLE OF COMPANIES IN ELECTRICAL BUSHINGS ECOSYSTEM
- TABLE 11 LIST OF KEY CONFERENCES AND EVENTS, 2025-2026
- TABLE 12 MFN TARIFF FOR HS CODE 854620-COMPLIANT PRODUCTS, BY COUNTRY, 2023
- TABLE 13 NORTH AMERICA: LIST OF REGULATORY BODIES, GOVERNMENT AGENCIES, AND OTHER ORGANIZATIONS
- TABLE 14 EUROPE: LIST OF REGULATORY BODIES, GOVERNMENT AGENCIES, AND OTHER ORGANIZATIONS
- TABLE 15 ASIA PACIFIC: LIST OF REGULATORY BODIES, GOVERNMENT AGENCIES, AND OTHER ORGANIZATIONS
- TABLE 16 MIDDLE EAST & AFRICA: LIST OF REGULATORY BODIES, GOVERNMENT AGENCIES, AND OTHER ORGANIZATIONS
- TABLE 17 SOUTH AMERICA: LIST OF REGULATORY BODIES, GOVERNMENT AGENCIES, AND OTHER ORGANIZATIONS
- TABLE 18 CODES AND REGULATIONS
- TABLE 19 IMPORT DATA FOR HS CODE 854620-COMPLIANT PRODUCTS, BY COUNTRY, 2019-2023 (USD THOUSAND)
- TABLE 20 EXPORT DATA FOR HS CODE 854620-COMPLIANT PRODUCTS, BY COUNTRY, 2019-2023 (USD THOUSAND)
- TABLE 21 LIST OF KEY PATENTS, 2020-2023
- TABLE 22 PORTER'S FIVE FORCES ANALYSIS
- TABLE 23 INFLUENCE OF KEY STAKEHOLDERS ON BUYING PROCESS, BY END USER
- TABLE 24 KEY BUYING CRITERIA, BY END USER
- TABLE 25 RIP & RIF BUSHINGS MARKET, BY TYPE, 2021-2023 (USD MILLION)
- TABLE 26 RIP & RIF BUSHINGS MARKET, BY TYPE, 2024-2032 (USD MILLION)
- TABLE 27 RESIN-IMPREGNATED PAPER BUSHINGS MARKET, BY REGION, 2021-2023 (USD MILLION)
- TABLE 28 RESIN IMPREGNATED PAPER BUSHINGS MARKET, BY REGION, 2024-2032 (USD MILLION)
- TABLE 29 RESIN-IMPREGNATED FIBERGLASS BUSHINGS MARKET, BY REGION, 2021-2023 (USD MILLION)
- TABLE 30 RESIN-IMPREGNATED FIBERGLASS BUSHINGS MARKET, BY REGION, 2024-2032 (USD MILLION)
- TABLE 31 RIP & RIF BUSHINGS MARKET, BY APPLICATION, 2021-2023 (USD MILLION)
- TABLE 32 RIP & RIF BUSHINGS MARKET, BY APPLICATION, 2024-2032 (USD MILLION)
- TABLE 33 TRANSFORMERS: RIP & RIF BUSHINGS MARKET, BY REGION, 2021-2023 (USD MILLION)
- TABLE 34 TRANSFORMERS: RIP & RIF BUSHINGS MARKET, BY REGION, 2024-2032 (USD MILLION)
- TABLE 35 SWITCHGEARS: RIP & RIF BUSHINGS MARKET, BY REGION, 2021-2023 (USD MILLION)
- TABLE 36 SWITCHGEARS: RIP & RIF BUSHINGS MARKET, BY REGION, 2024-2032 (USD MILLION)
- TABLE 37 OTHER APPLICATIONS: RIP & RIF BUSHINGS MARKET, BY REGION, 2021-2023 (USD MILLION)
- TABLE 38 OTHER APPLICATIONS: RIP & RIF BUSHINGS MARKET, BY REGION, 2024-2032 (USD MILLION)
- TABLE 39 RIP & RIF BUSHINGS MARKET, BY END USER, 2021-2023 (USD MILLION)
- TABLE 40 RIP & RIF BUSHINGS MARKET, BY END USER, 2024-2032 (USD MILLION)
- TABLE 41 UTILITIES: RIP & RIF BUSHINGS MARKET, BY REGION, 2021-2023 (USD MILLION)
- TABLE 42 UTILITIES: RIP & RIF BUSHINGS MARKET, BY REGION, 2024-2032 (USD MILLION)
- TABLE 43 INDUSTRIAL: RIP & RIF BUSHINGS MARKET, BY REGION, 2021-2023 (USD MILLION)
- TABLE 44 INDUSTRIAL: RIP & RIF BUSHINGS MARKET, BY REGION, 2024-2032 (USD MILLION)
- TABLE 45 RESIDENTIAL & COMMERCIAL: RIP & RIF BUSHINGS MARKET, BY REGION, 2021-2023 (USD MILLION)
- TABLE 46 RESIDENTIAL & COMMERCIAL: RIP & RIF BUSHINGS MARKET, BY REGION, 2024-2032 (USD MILLION)
- TABLE 47 RIP & RIF BUSHINGS MARKET, BY REGION, 2021-2023 (USD MILLION)
- TABLE 48 RIP & RIF BUSHINGS MARKET, BY REGION, 2024-2032 (USD MILLION)
- TABLE 49 ASIA PACIFIC: RIP & RIF BUSHINGS MARKET, BY TYPE, 2021-2023 (USD MILLION)
- TABLE 50 ASIA PACIFIC: RIP & RIF BUSHINGS MARKET, BY TYPE, 2024-2032 (USD MILLION)
- TABLE 51 ASIA PACIFIC: RIP & RIF BUSHINGS MARKET, BY END USER, 2021-2023 (USD MILLION)
- TABLE 52 ASIA PACIFIC: RIP & RIF BUSHINGS MARKET, BY END USER, 2024-2032 (USD MILLION)
- TABLE 53 ASIA PACIFIC: RIP & RIF BUSHINGS MARKET, BY APPLICATION, 2021-2023 (USD MILLION)
- TABLE 54 ASIA PACIFIC: RIP & RIF BUSHINGS MARKET, BY APPLICATION, 2024-2032 (USD MILLION)
- TABLE 55 ASIA PACIFIC: RIP & RIF BUSHINGS MARKET, BY COUNTRY, 2021-2023 (USD MILLION)
- TABLE 56 ASIA PACIFIC: RIP & RIF BUSHINGS MARKET, BY COUNTRY, 2024-2032 (USD MILLION)
- TABLE 57 NORTH AMERICA: RIP & RIF BUSHINGS MARKET, BY TYPE, 2021-2023 (USD MILLION)
- TABLE 58 NORTH AMERICA: RIP & RIF BUSHINGS MARKET, BY TYPE, 2024-2032 (USD MILLION)
- TABLE 59 NORTH AMERICA: RIP & RIF BUSHINGS MARKET, BY END USER, 2021-2023 (USD MILLION)
- TABLE 60 NORTH AMERICA: RIP & RIF BUSHINGS MARKET, BY END USER, 2024-2032 (USD MILLION)
- TABLE 61 NORTH AMERICA: RIP & RIF BUSHINGS MARKET, BY APPLICATION, 2021-2023 (USD MILLION)
- TABLE 62 NORTH AMERICA: RIP & RIF BUSHINGS MARKET, BY APPLICATION, 2024-2032 (USD MILLION)
- TABLE 63 NORTH AMERICA: RIP & RIF BUSHINGS MARKET, BY COUNTRY, 2021-2023 (USD MILLION)
- TABLE 64 NORTH AMERICA: RIP & RIF BUSHINGS MARKET, BY COUNTRY, 2024-2032 (USD MILLION)
- TABLE 65 EUROPE: RIP & RIF BUSHINGS MARKET, BY TYPE, 2021-2023 (USD MILLION)
- TABLE 66 EUROPE: RIP & RIF BUSHINGS MARKET, BY TYPE, 2024-2032 (USD MILLION)
- TABLE 67 EUROPE: RIP & RIF BUSHINGS MARKET, BY END USER, 2021-2023 (USD MILLION)
- TABLE 68 EUROPE: RIP & RIF BUSHINGS MARKET, BY END USER, 2024-2032 (USD MILLION)
- TABLE 69 EUROPE: RIP & RIF BUSHINGS MARKET, BY APPLICATION, 2021-2023 (USD MILLION)
- TABLE 70 EUROPE: RIP & RIF BUSHINGS MARKET, BY APPLICATION, 2024-2032 (USD MILLION)
- TABLE 71 EUROPE: RIP & RIF BUSHINGS MARKET, BY COUNTRY, 2021-2023 (USD MILLION)
- TABLE 72 EUROPE: RIP & RIF BUSHINGS MARKET, BY COUNTRY, 2024-2032 (USD MILLION)
- TABLE 73 MIDDLE EAST & AFRICA: RIP & RIF BUSHINGS MARKET, BY TYPE, 2021-2023 (USD MILLION)
- TABLE 74 MIDDLE EAST & AFRICA: RIP & RIF BUSHINGS MARKET, BY TYPE, 2024-2032 (USD MILLION)
- TABLE 75 MIDDLE EAST & AFRICA: RIP & RIF BUSHINGS MARKET, BY END USER, 2021-2023 (USD MILLION)
- TABLE 76 MIDDLE EAST & AFRICA: RIP & RIF BUSHINGS MARKET, BY END USER, 2024-2032 (USD MILLION)
- TABLE 77 MIDDLE EAST & AFRICA: RIP & RIF BUSHINGS MARKET, BY APPLICATION, 2021-2023 (USD MILLION)
- TABLE 78 MIDDLE EAST & AFRICA: RIP & RIF BUSHINGS MARKET, BY APPLICATION, 2024-2032 (USD MILLION)
- TABLE 79 MIDDLE EAST & AFRICA: RIP & RIF BUSHINGS MARKET, BY COUNTRY, 2021-2023 (USD MILLION)
- TABLE 80 MIDDLE EAST & AFRICA: RIP & RIF BUSHINGS MARKET, BY COUNTRY, 2024-2032 (USD MILLION)
- TABLE 81 SOUTH AMERICA: RIP & RIF BUSHINGS MARKET, BY TYPE, 2021-2023 (USD MILLION)
- TABLE 82 SOUTH AMERICA: RIP & RIF BUSHINGS MARKET, BY TYPE, 2024-2032 (USD MILLION)
- TABLE 83 SOUTH AMERICA: RIP & RIF BUSHINGS MARKET, BY END USER, 2021-2023 (USD MILLION)
- TABLE 84 SOUTH AMERICA: RIP & RIF BUSHINGS MARKET, BY END USER, 2024-2032 (USD MILLION)
- TABLE 85 SOUTH AMERICA: RIP & RIF BUSHINGS MARKET, BY APPLICATION, 2021-2023 (USD MILLION)
- TABLE 86 SOUTH AMERICA: RIP & RIF BUSHINGS MARKET, BY APPLICATION, 2024-2032 (USD MILLION)
- TABLE 87 SOUTH AMERICA: RIP & RIF BUSHINGS MARKET, BY COUNTRY, 2021-2023 (USD MILLION)
- TABLE 88 SOUTH AMERICA: RIP & RIF BUSHINGS MARKET, BY COUNTRY, 2024-2032 (USD MILLION)
- TABLE 89 RIP & RIF BUSHINGS MARKET: OVERVIEW OF STRATEGIES ADOPTED BY KEY PLAYERS, 2021-2024
- TABLE 90 RIP & RIF BUSHINGS MARKET: DEGREE OF COMPETITION, 2023
- TABLE 91 RIP & RIF BUSHINGS MARKET: REGION FOOTPRINT, 2023
- TABLE 92 RIP & RIF BUSHINGS MARKET: TYPE FOOTPRINT, 2023
- TABLE 93 RIP & RIF BUSHINGS MARKET: APPLICATION FOOTPRINT, 2023
- TABLE 94 RIP & RIF BUSHINGS MARKET: DETAILED LIST OF KEY STARTUPS/SMES
- TABLE 95 RIP & RIF BUSHINGS MARKET: COMPETITIVE BENCHMARKING OF KEY STARTUPS/SMES
- TABLE 96 RIP & RIF BUSHINGS MARKET: PRODUCT LAUNCHES, JANUARY 2021-OCTOBER 2024
- TABLE 97 RIP & RIF BUSHINGS MARKET: DEALS, JANUARY 2021-OCTOBER 2024
- TABLE 98 RIP & RIF BUSHINGS MARKET: EXPANSIONS, JANUARY 2021-OCTOBER 2024
- TABLE 99 ABB: COMPANY OVERVIEW
- TABLE 100 ABB: PRODUCTS/SOLUTIONS/SERVICES OFFERED
- TABLE 101 ABB: DEALS
- TABLE 102 ABB: EXPANSIONS
- TABLE 103 ABB: OTHER DEVELOPMENTS
- TABLE 104 SIEMENS: COMPANY OVERVIEW
- TABLE 105 SIEMENS: PRODUCTS/SOLUTIONS/SERVICES OFFERED
- TABLE 106 SIEMENS: PRODUCT LAUNCHES
- TABLE 107 SIEMENS: DEALS
- TABLE 108 HITACHI ENERGY LTD.: COMPANY OVERVIEW
- TABLE 109 HITACHI ENERGY LTD.: PRODUCTS/SOLUTIONS/SERVICES OFFERED
- TABLE 110 HITACHI ENERGY LTD.: DEVELOPMENTS
- TABLE 111 EATON: COMPANY OVERVIEW
- TABLE 112 EATON: PRODUCTS/SOLUTIONS/SERVICES OFFERED
- TABLE 113 EATON: DEALS
- TABLE 114 EATON: EXPANSIONS
- TABLE 115 GENERAL ELECTRIC COMPANY: COMPANY OVERVIEW
- TABLE 116 GENERAL ELECTRIC COMPANY: PRODUCTS/SOLUTIONS/SERVICES OFFERED
- TABLE 117 GENERAL ELECTRIC COMPANY: DEALS
- TABLE 118 GENERAL ELECTRIC COMPANY: OTHER DEVELOPMENTS
- TABLE 119 TRENCH GROUP: COMPANY OVERVIEW
- TABLE 120 TRENCH GROUP: PRODUCTS/SOLUTIONS/SERVICES OFFERED
- TABLE 121 TRENCH GROUP: DEALS
- TABLE 122 RHM INTERNATIONAL, LLC: COMPANY OVERVIEW
- TABLE 123 RHM INTERNATIONAL, LLC: PRODUCTS/SOLUTIONS/SERVICES OFFERED
- TABLE 124 PFISTERER HOLDING SE: COMPANY OVERVIEW
- TABLE 125 PFISTERER HOLDING SE: PRODUCTS/SOLUTIONS/SERVICES OFFERED
- TABLE 126 BUSHING (BEIJING) HV ELECTRIC CO., LTD.: COMPANY OVERVIEW
- TABLE 127 BUSHING (BEIJING) HV ELECTRIC CO., LTD.: PRODUCTS/SOLUTIONS/SERVICES OFFERED
- TABLE 128 YASH HIGHVOLTAGE INSULATORS PVT. LTD.: COMPANY OVERVIEW
- TABLE 129 YASH HIGHVOLTAGE INSULATORS PVT. LTD.: PRODUCTS/SOLUTIONS/SERVICES OFFERED
- TABLE 130 YASH HIGHVOLTAGE INSULATORS PVT. LTD.: PRODUCT LAUNCHES
- TABLE 131 NU-CORK PRODUCTS PVT LTD: COMPANY OVERVIEW
- TABLE 132 NU-CORK PRODUCTS PVT LTD: PRODUCTS/SOLUTIONS/SERVICES OFFERED
- TABLE 133 SHANDONG CHINSUN ELECTRICAL EQUIPMENT CO., LTD: COMPANY OVERVIEW
- TABLE 134 SHANDONG CHINSUN ELECTRICAL EQUIPMENT CO., LTD: PRODUCTS/SOLUTIONS/SERVICES OFFERED
List of Figures
- FIGURE 1 RIP & RIF BUSHINGS MARKET SEGMENTATION AND REGIONAL SCOPE
- FIGURE 2 STUDY YEARS CONSIDERED
- FIGURE 3 RIP & RIF BUSHINGS MARKET: RESEARCH DESIGN
- FIGURE 4 KEY DATA FROM SECONDARY SOURCES
- FIGURE 5 KEY DATA FROM PRIMARY SOURCES
- FIGURE 6 KEY INSIGHTS FROM INDUSTRY EXPERTS
- FIGURE 7 BREAKDOWN OF PRIMARIES, BY COMPANY TYPE, DESIGNATION, AND REGION
- FIGURE 8 KEY METRICS CONSIDERED TO ANALYZE DEMAND FOR RIP & RIF BUSHINGS
- FIGURE 9 RIP & RIF BUSHINGS MARKET: BOTTOM-UP APPROACH
- FIGURE 10 RIP & RIF BUSHINGS MARKET: REGIONAL ANALYSIS (BOTTOM-UP APPROACH)
- FIGURE 11 RIP & RIF BUSHINGS MARKET: COUNTRY-LEVEL ANALYSIS (BOTTOM-UP APPROACH)
- FIGURE 12 RIP & RIF BUSHINGS MARKET: TOP-DOWN APPROACH
- FIGURE 13 KEY STEPS CONSIDERED TO ASSESS SUPPLY OF RIP & RIF BUSHINGS
- FIGURE 14 RIP & RIF BUSHINGS MARKET SIZE ESTIMATION METHODOLOGY (SUPPLY SIDE)
- FIGURE 15 RIP & RIF BUSHINGS MARKET: DATA TRIANGULATION
- FIGURE 16 RESIN-IMPREGNATED PAPER BUSHINGS SEGMENT TO DOMINATE MARKET BETWEEN 2024 AND 2032
- FIGURE 17 TRANSFORMERS SEGMENT TO CAPTURE LARGEST SHARE OF RIP & RIF BUSHINGS MARKET IN 2032
- FIGURE 18 UTILITIES SEGMENT ACCOUNTED FOR LARGEST MARKET SHARE IN 2024
- FIGURE 19 ASIA PACIFIC HELD LARGEST SHARE OF RIP & RIF BUSHINGS MARKET IN 2023
- FIGURE 20 RISING EMPHASIS ON GRID MODERNIZATION TO ENHANCE POWER TRANSMISSION EFFICIENCY TO DRIVE MARKET
- FIGURE 21 RESIN-IMPREGNATED PAPER BUSHINGS AND CHINA CAPTURED LARGEST SEGMENTAL SHARES OF RIP & RIF BUSHINGS MARKET IN ASIA PACIFIC IN 2023
- FIGURE 22 RESIN-IMPREGNATED PAPER BUSHINGS SEGMENT TO ACCOUNT FOR ALMOST TOTAL MARKET SHARE IN 2032
- FIGURE 23 TRANSFORMERS SEGMENT TO ACCOUNT FOR LARGEST MARKET SHARE IN 2032
- FIGURE 24 UTILITIES SEGMENT TO ACCOUNT FOR SIGNIFICANTLY LARGE MARKET SHARE IN 2032
- FIGURE 25 ASIA PACIFIC TO EXHIBIT HIGHEST CAGR IN RIP & RIF BUSHINGS MARKET FROM 2024 TO 2032
- FIGURE 26 DRIVERS, RESTRAINTS, OPPORTUNITIES, AND CHALLENGES
- FIGURE 27 GLOBAL INVESTMENT IN POWER SECTOR, 2019-2023 (USD BILLION)
- FIGURE 28 GLOBAL ANNUAL INVESTMENT IN GRID INFRASTRUCTURE, 2017-2023 (USD BILLION)
- FIGURE 29 GLOBAL CLEAN ENERGY INVESTMENT, 2017-2023 (USD BILLION)
- FIGURE 30 INCREASE IN ANNUAL CLEAN ENERGY INVESTMENT IN SELECTED COUNTRIES AND REGIONS, 2019-2023 (USD BILLION)
- FIGURE 31 TRENDS/DISRUPTIONS IMPACTING CUSTOMER BUSINESS
- FIGURE 32 ECOSYSTEM ANALYSIS
- FIGURE 33 INVESTMENT AND FUNDING SCENARIO, 2023 (USD BILLION)
- FIGURE 34 SUPPLY CHAIN ANALYSIS
- FIGURE 35 IMPORT DATA FOR HS CODE 854620-COMPLIANT PRODUCTS FOR TOP 5 COUNTRIES, 2019-2023 (USD THOUSAND)
- FIGURE 36 EXPORT DATA FOR HS CODE 854620-COMPLIANT PRODUCTS FOR TOP 5 COUNTRIES, 2019-2023 (USD THOUSAND)
- FIGURE 37 PATENTS APPLIED AND GRANTED, 2014-2023
- FIGURE 38 PORTER'S FIVE FORCES ANALYSIS
- FIGURE 39 INFLUENCE OF KEY STAKEHOLDERS ON BUYING PROCESS, BY END USER
- FIGURE 40 KEY BUYING CRITERIA, BY END USER
- FIGURE 41 IMPACT OF GEN AI/AI ON RIP & RIF BUSHINGS MARKET, BY REGION
- FIGURE 42 RIP & RIF BUSHINGS MARKET SHARE, BY TYPE, 2023
- FIGURE 43 RIP & RIF BUSHINGS MARKET SHARE, BY APPLICATION, 2023
- FIGURE 44 RIP & RIF BUSHINGS MARKET SHARE, BY END USER, 2023
- FIGURE 45 ASIA PACIFIC TO REGISTER HIGHEST CAGR IN RIP & RIF BUSHINGS MARKET FROM 2024 TO 2032
- FIGURE 46 RIP & RIF BUSHINGS MARKET SHARE, BY REGION, 2023
- FIGURE 47 ASIA PACIFIC: RIP & RIF BUSHINGS MARKET SNAPSHOT
- FIGURE 48 NORTH AMERICA: RIP & RIF BUSHINGS MARKET SNAPSHOT
- FIGURE 49 RIP & RIF BUSHINGS MARKET: REVENUE ANALYSIS OF FIVE KEY PLAYERS, 2019-2023 (USD BILLION)
- FIGURE 50 MARKET SHARE ANALYSIS OF COMPANIES OFFERING RIP & RIF BUSHINGS, 2023
- FIGURE 51 COMPANY VALUATION, 2024 (USD BILLION)
- FIGURE 52 FINANCIAL METRICS, 2024
- FIGURE 53 PRODUCT COMPARISON
- FIGURE 54 RIP & RIF BUSHINGS MARKET: COMPANY EVALUATION MATRIX (KEY PLAYERS), 2023
- FIGURE 55 RIP & RIF BUSHINGS MARKET: COMPANY FOOTPRINT, 2023
- FIGURE 56 RIP & RIF BUSHINGS MARKET: COMPANY EVALUATION MATRIX (STARTUPS/SMES), 2023
- FIGURE 57 ABB: COMPANY SNAPSHOT
- FIGURE 58 SIEMENS: COMPANY SNAPSHOT
- FIGURE 59 HITACHI ENERGY LTD.: COMPANY SNAPSHOT
- FIGURE 60 EATON: COMPANY SNAPSHOT
- FIGURE 61 GENERAL ELECTRIC COMPANY: COMPANY SNAPSHOT
The global RIP & RIF bushings market is projected to grow from USD 1.21 billion by 2025 to USD 1.83 billion by 2032, at a CAGR of 5.9%.
| Scope of the Report | |
|---|---|
| Years Considered for the Study | 2021-2032 |
| Base Year | 2024 |
| Forecast Period | 2025-2032 |
| Units Considered | Value (USD million) |
| Segments | RIP & RIF bushings market by type, application, end user, and region |
| Regions covered | North America, Europe, Asia Pacific, Middle East & Africa and South America |
Market growth is propelled by the increasing demand for reliable, maintenance-free, and environmentally sustainable components within modern power infrastructure. As investments rise in grid modernization, electrification, and renewable energy integration, utilities and power transmission companies are turning to advanced bushing technologies such as RIP and RIF. These technologies enhance grid reliability, boost operational efficiency, and lower failure rates. The growing preference for compact, modular substations and high-voltage equipment, particularly in urban and industrial settings, further accelerates the adoption of these dry-type bushings. RIP and RIF bushings provide superior thermal performance, mechanical durability, and environmental safety compared to traditional oil-impregnated alternatives. Additionally, the implementation of digital monitoring systems and condition-based asset management supports their uptake, as utilities increasingly rely on predictive maintenance strategies to reduce downtime and extend the service life of equipment.
Utilities, by end user, to be fastest-growing segment during forecast period
Utilities are expected to experience the highest growth rate in the global RIP & RIF bushings market from 2025 to 2032. This is due to utility companies focusing more on modernizing aging infrastructure grids and improving operational reliability. Incorporating renewable energy sources into the existing power transmission and distribution networks adds complexity. With the increasing use of renewable energy sources, there is an additional requirement for supreme-grade insulating materials that endure high voltages, environmental stress, and maintenance-free longevity in service. Since RIP & RIF bushings possess high dielectric strength, partial discharge resistance, and fire retardancy, utilities increasingly prefer them to minimize system failures and improve grid reliability. Also, utilities must adopt new safety, efficiency, and environmental protection standards and use reliable and safe dry-type bushings instead of traditional oil-filled ones. The growing construction of smart grids and substations, coupled with rural electrification in developing economies, is further anticipated to drive the demand for RIP & RIF bushings for utilities.
Resin-impregnated paper bushings, by type, to exhibit highest CAGR during the forecast period
The RIP and RIF bushings market is poised for significant growth due to rising demand and advancements in RIP technology over traditional oil-impregnated types. RIP bushings offer enhanced thermal stability, partial discharge resistance, and superior mechanical strength, making them ideal for heavy-duty voltage command transformers, circuit breakers, and gas-insulated switchgear. Their dry-type design minimizes oil leakage risks, bolstering fire safety and reducing maintenance needs-key factors for industrial users seeking operational efficiency and sustainability. Additionally, the global push for cost-effective insulating components and increased investment in smart grid infrastructure is driving the adoption of RIP bushings in both developing and developed nations.
Asia Pacific, by region, is expected to be the largest and fastest-growing market during forecast period
The Asia Pacific region is expected to become the most significant and fastest-growing RIP and RIF bushings market. This growth is driven by rapid industrialization and extensive infrastructure development in countries such as China, India, Japan, and South Korea, where power grid modernization is a priority.
The need for reliable and high-performance bushings arises from the demands of renewable energy integration, transportation electrification, and expansion of transmission and distribution services. Additionally, supportive government policies, rising urbanization, and increasing power consumption are creating opportunities for industry players to expand and innovate.
In-depth interviews have been conducted with chief executive officers (CEOs), directors, and other executives from various key organizations operating in the RIP and RIF bushings market.
By Company Type: Tier 1 - 30%, Tier 2 - 55%, and Tier 3 - 15%
By Designation: C-level Executives - 30%, Directors - 20%, and Others - 50%
By Region: Asia Pacific - 60%, North America - 18%, Europe - 8%, Middle East & Africa - 10%, and South America - 4%
Note: Other designations include engineers and sales & regional managers.
The tiers of the companies are defined based on their total revenue as of 2024: Tier 1: >USD 1 billion, Tier 2: USD 500 million-1 billion, and Tier 3: <USD 500 million
A few major players with extensive regional presence dominate the RIP & RIF bushings market. The leading players are Hitachi Energy Ltd (Switzerland), Siemens (Germany), Schneider Electric (France), General Electric Company (US), and PFISTERER Holding SE (Germany).
Research Coverage:
The report defines, describes, and forecasts the RIP & RIF bushings market by type (RIP and RIF), application (transformer, switchgear, and other applications), end user (utilities, industries, and residential & commercial), and region. It also offers a detailed qualitative and quantitative analysis of the market. The report comprehensively reviews the major market drivers, restraints, opportunities, and challenges. It also covers various important aspects of the market. A comprehensive analysis of the key players in the RIP & RIF bushings market has been conducted. This analysis provides insights into their business overview, solutions and services, and key strategies. It also covers relevant contracts, partnerships, and agreements, along with new product launches, mergers, acquisitions, and other recent developments in the market. Additionally, the report includes a competitive analysis of emerging startups within the RIP & RIF bushings market ecosystem.
Reasons to Buy This Report:
This report is a strategic resource for industry leaders and new entrants, offering a comprehensive analysis of the market and its subsegments. It equips stakeholders with a thorough understanding of the competitive landscape, enabling them to refine their business positioning and devise effective go-to-market strategies. Additionally, the report elucidates the current market dynamics, highlighting critical drivers, constraints, challenges, and opportunities that inform strategic decision-making.
The report provides insights on the following points:
- Analysis of key drivers (mounting demand for reliable power due to industrialization, rapid modernization of aging grid infrastructure, surging adoption of electric vehicles), restraints (high initial and upfront costs, availability of low-cost alternatives), opportunities (increasing integration of renewable energy into power grids, rising emphasis on expansion of smart grid infrastructure, rapid advances in nanocomposite materials), and challenges (complex manufacturing and customization requirements) influencing the growth.
- Product Development/Innovation: Competition among manufacturers in the RIP (resin-impregnated paper) & RIF (resin-impregnated fiberglass) bushings market is geared toward developing and enhancing mechanical strength, insulation performance, and operational lifespan. The development of new partial discharge-, temperature-, and moisture-resistant dry bushings is the primary focus of the advancements. Manufacturers improve modern epoxy resin systems, add multi-layer insulation configurations, and apply vacuum pressure impregnation to maintain thermal and electrical fire safety while ensuring environmentally friendly measures. The use of sensors and digital interfaces for monitoring infrastructure conditions is also increasing, and they facilitate predictive maintenance, which enhances grid reliability.
- Market Development: The world is witnessing robust growth in the RIP & RIF bushings market as investments in upgrading power infrastructure within Asia Pacific, Latin America, and parts of Africa are undergoing modernization. Rapid urbanization, industrial expansion, and the increasing demand for high-voltage transmission and substation installations for renewable energy are all occurring in these areas. Utilities and government are actively switching from traditional oil-immersed bushings to dry-type RIP & RIF bushings and using a mixture of reactive and incorporated polymer as bushings to attain safety, lower maintenance expenditure, and environmental compliance within a drying oil framework. In addition, widening the grid to support the electrification of rural and remote areas drives the need for compact and enduring insulation materials, further strengthening the market.
- Market Diversification: The market for RIP & RIF bushings is progressively expanding into more end--use sectors, such as data centers, industrial manufacturing, renewable energy, and the railroad and maritime industries. The growth of these sectors generates a need for insulating materials to ensure the continuous and effective operation of transformers, switchgear, and other high-voltage equipment. The use of these RIP bushings in the renewable energy facilities is an example of this, as they are environmentally friendly and resilient to severe weather conditions.
- Market Diversification: The RIP & RIF bushings market, which once served only traditional utility applications, now reaches multiple sectors including railways, wind farms, solar power plants, marine operations, data centers, and industrial manufacturing. High-performance insulation components are necessary to continuously and efficiently operate transformers, switchgear, and other high-voltage apparatus in these sectors. Renewable energy facilities now regularly use RIP bushings, which deliver environmental benefits and high durability against extreme environmental conditions. Railway systems and data centers require bushings that offer compact sizes, high dielectric strength, and minimal maintenance needs, generating new revenue opportunities and promoting specialized product creation for specific markets.
- Competitive Assessment: The market for RIP & RIF bushings is highly competitive, with top industry players such as ABB (Switzerland), Siemens (Germany), Hitachi Energy Ltd. (Switzerland), General Electric Company (US), Eaton (Ireland), Trench Group (Germany), RHM International, LLC (US) remaining competitive by expanding their presence in global markets through strategic efforts. These involve product portfolio growth, mergers and acquisitions, joint ventures, and new factory openings in high-growth areas. Firms also spend heavily on R&D to create future-proof dry-type bushings with higher reliability, energy efficiency, and smart monitoring features. By adapting to changing grid needs and sustainability objectives, these companies seek to take a bigger market share and facilitate global electrification to safe and robust electrical networks.
TABLE OF CONTENTS
1 INTRODUCTION
- 1.1 STUDY OBJECTIVES
- 1.2 MARKET DEFINITION
- 1.3 STUDY SCOPE
- 1.3.1 MARKETS COVERED AND REGIONAL SCOPE
- 1.3.2 INCLUSIONS AND EXCLUSIONS
- 1.3.3 YEARS CONSIDERED
- 1.4 CURRENCY CONSIDERED
- 1.5 LIMITATIONS
- 1.6 STAKEHOLDERS
- 1.7 SUMMARY OF CHANGES
2 RESEARCH METHODOLOGY
- 2.1 RESEARCH DATA
- 2.1.1 SECONDARY DATA
- 2.1.1.1 List of key secondary sources
- 2.1.1.2 Key data from secondary sources
- 2.1.2 PRIMARY DATA
- 2.1.2.1 List of primary interview participants
- 2.1.2.2 Key data from primary sources
- 2.1.2.3 Key industry insights
- 2.1.2.4 Breakdown of primaries
- 2.1.1 SECONDARY DATA
- 2.2 MARKET SIZE ESTIMATION METHODOLOGY
- 2.2.1 BOTTOM-UP APPROACH
- 2.2.1.1 Regional analysis
- 2.2.1.2 Country-level analysis
- 2.2.1.3 Demand-side assumptions
- 2.2.1.4 Demand-side calculations
- 2.2.2 TOP-DOWN APPROACH
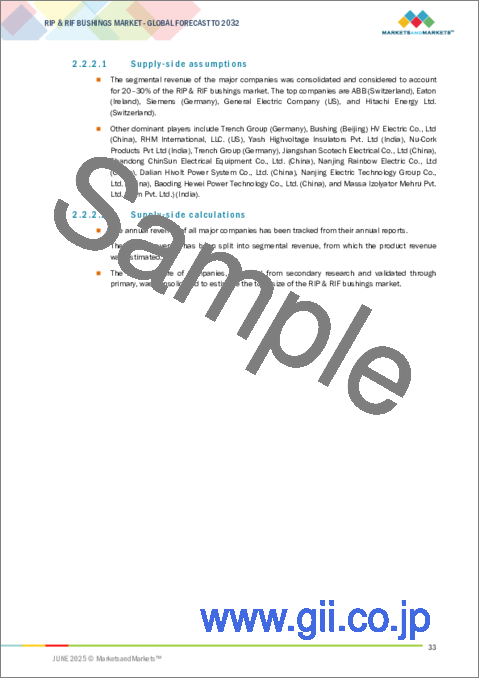
- 2.2.2.1 Supply-side assumptions
- 2.2.2.2 Supply-side calculations
- 2.2.1 BOTTOM-UP APPROACH
- 2.3 DATA TRIANGULATION
- 2.4 FORECAST
- 2.5 RESEARCH ASSUMPTIONS
- 2.6 RISK ANALYSIS
- 2.7 RESEARCH LIMITATIONS
3 EXECUTIVE SUMMARY
4 PREMIUM INSIGHTS
- 4.1 ATTRACTIVE OPPORTUNITIES FOR PLAYERS IN RIP & RIF BUSHINGS MARKET
- 4.2 ASIA PACIFIC: RIP & RIF BUSHINGS MARKET, BY TYPE AND COUNTRY
- 4.3 RIP & RIF BUSHINGS MARKET, BY TYPE
- 4.4 RIP & RIF BUSHINGS MARKET, BY APPLICATION
- 4.5 RIP & RIF BUSHINGS MARKET, BY END USER
- 4.6 RIP & RIF BUSHINGS MARKET, BY REGION
5 MARKET OVERVIEW
- 5.1 INTRODUCTION
- 5.2 MARKET DYNAMICS
- 5.2.1 DRIVERS
- 5.2.1.1 Mounting demand for reliable power due to industrialization
- 5.2.1.2 Rapid modernization of aging grid infrastructure
- 5.2.1.3 Surging adoption of electric vehicles
- 5.2.2 RESTRAINTS
- 5.2.2.1 High initial and upfront costs
- 5.2.2.2 Availability of low-cost alternatives
- 5.2.3 OPPORTUNITIES
- 5.2.3.1 Increasing integration of renewable energy into power grids
- 5.2.3.2 Rising emphasis on expansion of smart grid infrastructure
- 5.2.3.3 Rapid advances in nanocomposite materials
- 5.2.4 CHALLENGES
- 5.2.4.1 Complex manufacturing and customization requirements
- 5.2.4.2 Complexities associated with maintenance and replacement
- 5.2.1 DRIVERS
- 5.3 TRENDS/DISRUPTIONS IMPACTING CUSTOMER BUSINESS
- 5.4 ECOSYSTEM ANALYSIS
- 5.5 INVESTMENT AND FUNDING SCENARIO
- 5.6 SUPPLY CHAIN ANALYSIS
- 5.6.1 RAW MATERIAL PROVIDERS/SUPPLIERS
- 5.6.2 MANUFACTURERS/ASSEMBLERS
- 5.6.3 DISTRIBUTORS
- 5.6.4 END USERS
- 5.6.5 POST-SALES SERVICE PROVIDERS
- 5.7 TECHNOLOGY ANALYSIS
- 5.7.1 KEY TECHNOLOGIES
- 5.7.1.1 Advanced insulation technologies
- 5.7.1.2 Smart bushings
- 5.7.2 ADJACENT TECHNOLOGIES
- 5.7.2.1 Additive manufacturing
- 5.7.1 KEY TECHNOLOGIES
- 5.8 KEY CONFERENCES AND EVENTS
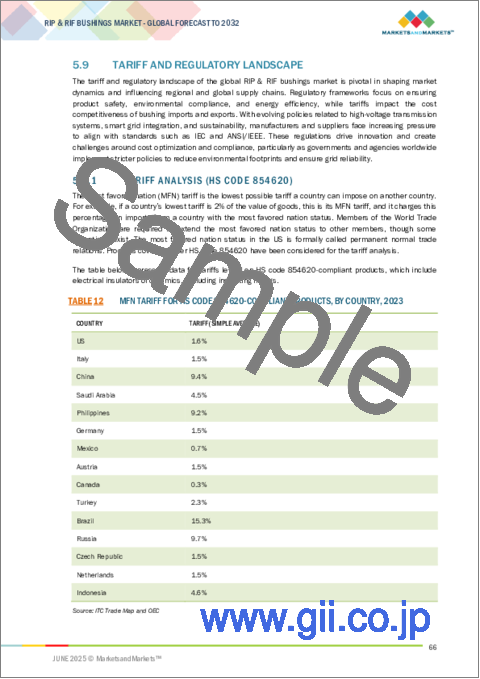
- 5.9 TARIFF AND REGULATORY LANDSCAPE
- 5.9.1 TARIFF ANALYSIS (HS CODE 854620)
- 5.9.2 REGULATORY BODIES, GOVERNMENT AGENCIES, AND OTHER ORGANIZATIONS
- 5.9.3 CODES AND REGULATIONS
- 5.10 TRADE ANALYSIS
- 5.10.1 IMPORT SCENARIO (HS CODE 854620)
- 5.10.2 EXPORT SCENARIO (HS CODE 854620)
- 5.11 PATENT ANALYSIS
- 5.12 PORTER'S FIVE FORCES ANALYSIS
- 5.12.1 THREAT OF NEW ENTRANTS
- 5.12.2 THREAT OF SUBSTITUTES
- 5.12.3 BARGAINING POWER OF SUPPLIERS
- 5.12.4 BARGAINING POWER OF BUYERS
- 5.12.5 INTENSITY OF COMPETITIVE RIVALRY
- 5.13 KEY STAKEHOLDERS AND BUYING CRITERIA
- 5.13.1 KEY STAKEHOLDERS IN BUYING PROCESS
- 5.14 BUYING CRITERIA
- 5.15 CASE STUDY ANALYSIS
- 5.15.1 UTILITY COMPANY IN EUROPE IMPLEMENTED BIIT BUSHING TO ENHANCE OPERATIONAL EFFICIENCY OF HIGH-VOLTAGE SYSTEMS
- 5.15.2 SIEMENS' BUSHING ENABLED TECHNISCHE BETRIEBE GLARUS NORD TO ACHIEVE SECURE AND SUSTAINABLE POWER SUPPLY AND ENHANCE GRID TRANSPARENCY
- 5.16 IMPACT OF GEN AI/AI ON RIP & RIF BUSHINGS MARKET
- 5.17 MACROECONOMIC OUTLOOK
- 5.17.1 GDP OUTLOOK
- 5.17.2 RESEARCH & DEVELOPMENT EXPENDITURE
- 5.17.3 INVESTMENTS BY END USERS
- 5.17.4 POWER SECTOR GROWTH
6 RIP & RIF BUSHINGS MARKET, BY TYPE
- 6.1 INTRODUCTION
- 6.2 RESIN-IMPREGNATED PAPER BUSHINGS
- 6.2.1 HIGH MOISTURE RESISTANCE AND EXCEPTIONAL DIELECTRIC STRENGTH TO FOSTER SEGMENTAL GROWTH
- 6.3 RESIN-IMPREGNATED FIBERGLASS BUSHINGS
- 6.3.1 RELIABLE PERFORMANCE AND COST-EFFECTIVENESS TO CONTRIBUTE TO SEGMENTAL GROWTH
7 RIP & RIF BUSHINGS MARKET, BY APPLICATION
- 7.1 INTRODUCTION
- 7.2 TRANSFORMERS
- 7.2.1 EXPANDING GLOBAL ELECTRICITY INFRASTRUCTURE TO BOOST SEGMENTAL GROWTH
- 7.3 SWITCHGEARS
- 7.3.1 RAPID INDUSTRIALIZATION AND URBANIZATION TO AUGMENT SEGMENTAL GROWTH
- 7.4 OTHER APPLICATIONS
8 RIP & RIF BUSHINGS MARKET, BY END USER
- 8.1 INTRODUCTION
- 8.2 UTILITIES
- 8.2.1 RELIANCE ON HIGH-PERFORMANCE BUSHINGS FOR EFFICIENT POWER TRANSMISSION AND DISTRIBUTION TO SPUR DEMAND
- 8.3 INDUSTRIAL
- 8.3.1 HIGH EMPHASIS ON AUTOMATION AND DIGITALIZATION TO FUEL SEGMENTAL GROWTH
- 8.4 RESIDENTIAL & COMMERCIAL
- 8.4.1 RAPID URBANIZATION, ELECTRIFICATION, AND INTEGRATION OF RENEWABLE ENERGY TO DRIVE MARKET
9 RIP & RIF BUSHINGS MARKET, BY REGION
- 9.1 INTRODUCTION
- 9.2 ASIA PACIFIC
- 9.2.1 CHINA
- 9.2.1.1 Rising emphasis on grid modernization to accelerate market growth
- 9.2.2 INDIA
- 9.2.2.1 Rapid urbanization and rising energy demand to drive market
- 9.2.3 JAPAN
- 9.2.3.1 Increasing allocation of funds for energy infrastructure development to drive market
- 9.2.4 SOUTH KOREA
- 9.2.4.1 Growing focus on modernizing power infrastructure to foster market growth
- 9.2.5 REST OF ASIA PACIFIC
- 9.2.1 CHINA
- 9.3 NORTH AMERICA
- 9.3.1 US
- 9.3.1.1 Increasing focus on modernizing aging electrical infrastructure to boost market growth
- 9.3.2 CANADA
- 9.3.2.1 Rapid expansion of renewable energy capacity to augment market growth
- 9.3.3 MEXICO
- 9.3.3.1 Growing investment in power infrastructure modernization and renewable energy projects to drive market
- 9.3.1 US
- 9.4 EUROPE
- 9.4.1 GERMANY
- 9.4.1.1 Rising investment in green energy to accelerate market growth
- 9.4.2 UK
- 9.4.2.1 High commitment to generating clean power to bolster market growth
- 9.4.3 FRANCE
- 9.4.3.1 Growing emphasis on achieving carbon neutrality to spur demand
- 9.4.4 ITALY
- 9.4.4.1 Increasing focus on modernizing energy infrastructure to accelerate market growth
- 9.4.5 REST OF EUROPE
- 9.4.1 GERMANY
- 9.5 MIDDLE EAST & AFRICA
- 9.5.1 GCC COUNTRIES
- 9.5.1.1 Increasing investment in electricity transmission and distribution infrastructure to facilitate market growth
- 9.5.2 SOUTH AFRICA
- 9.5.2.1 Rising integration of renewable energy to foster market growth
- 9.5.3 REST OF THE MIDDLE EAST & AFRICA
- 9.5.1 GCC COUNTRIES
- 9.6 SOUTH AMERICA
- 9.6.1 BRAZIL
- 9.6.1.1 Rising modernization of electricity grid to bolster market growth
- 9.6.2 ARGENTINA
- 9.6.2.1 Increasing integration of renewable energy into power grid to accelerate market growth
- 9.6.3 REST OF SOUTH AMERICA
- 9.6.1 BRAZIL
10 COMPETITIVE LANDSCAPE
- 10.1 INTRODUCTION
- 10.2 KEY PLAYER STRATEGIES/RIGHT TO WIN, 2021-2024
- 10.3 REVENUE ANALYSIS, 2019-2023
- 10.4 MARKET SHARE ANALYSIS, 2023
- 10.5 COMPANY VALUATION AND FINANCIAL METRICS, 2024
- 10.5.1 COMPANY VALUATION
- 10.5.2 FINANCIAL METRICS
- 10.6 PRODUCT COMPARISON
- 10.7 COMPANY EVALUATION MATRIX: KEY PLAYERS, 2023
- 10.7.1 STARS
- 10.7.2 EMERGING LEADERS
- 10.7.3 PERVASIVE PLAYERS
- 10.7.4 PARTICIPANTS
- 10.7.5 COMPANY FOOTPRINT: KEY PLAYERS, 2023
- 10.7.5.1 Company footprint
- 10.7.5.2 Region footprint
- 10.7.5.3 Type footprint
- 10.7.5.4 Application footprint
- 10.8 COMPANY EVALUATION MATRIX: STARTUPS/SMES, 2023
- 10.8.1 PROGRESSIVE COMPANIES
- 10.8.2 RESPONSIVE COMPANIES
- 10.8.3 DYNAMIC COMPANIES
- 10.8.4 STARTING BLOCKS
- 10.8.5 COMPETITIVE BENCHMARKING: STARTUPS/SMES, 2023
- 10.8.5.1 Detailed list of key startups/SMEs
- 10.8.5.2 Competitive benchmarking of key startups/SMEs
- 10.9 COMPETITIVE SCENARIO
- 10.9.1 PRODUCT LAUNCHES
- 10.9.2 DEALS
- 10.9.3 EXPANSIONS
11 COMPANY PROFILES
- 11.1 KEY PLAYERS
- 11.1.1 ABB
- 11.1.1.1 Business overview
- 11.1.1.2 Products/Solutions/Services offered
- 11.1.1.3 Recent developments
- 11.1.1.3.1 Deals
- 11.1.1.3.2 Expansions
- 11.1.1.3.3 Other developments
- 11.1.1.4 MnM view
- 11.1.1.4.1 Key strengths
- 11.1.1.4.2 Strategic choices
- 11.1.1.4.3 Weaknesses and competitive threats
- 11.1.2 SIEMENS
- 11.1.2.1 Business overview
- 11.1.2.2 Products/Solutions/Services offered
- 11.1.2.3 Recent developments
- 11.1.2.3.1 Product launches
- 11.1.2.3.2 Deals
- 11.1.2.4 MnM view
- 11.1.2.4.1 Key strengths
- 11.1.2.4.2 Strategic choices
- 11.1.2.4.3 Weaknesses and competitive threats
- 11.1.3 HITACHI ENERGY LTD.
- 11.1.3.1 Business overview
- 11.1.3.2 Products/Solutions/Services offered
- 11.1.3.3 Recent developments
- 11.1.3.3.1 Developments
- 11.1.3.4 MnM view
- 11.1.3.4.1 Key strengths
- 11.1.3.4.2 Strategic choices
- 11.1.3.4.3 Weaknesses and competitive threats
- 11.1.4 EATON
- 11.1.4.1 Business overview
- 11.1.4.2 Products/Solutions/Services offered
- 11.1.4.3 Recent developments
- 11.1.4.3.1 Deals
- 11.1.4.3.2 Expansions
- 11.1.4.4 MnM view
- 11.1.4.4.1 Key strengths
- 11.1.4.4.2 Strategic choices
- 11.1.4.4.3 Weaknesses and competitive threats
- 11.1.5 GENERAL ELECTRIC COMPANY
- 11.1.5.1 Business overview
- 11.1.5.2 Products/Solutions/Services offered
- 11.1.5.3 Recent developments
- 11.1.5.3.1 Deals
- 11.1.5.3.2 Other developments
- 11.1.5.4 MnM view
- 11.1.5.4.1 Key strengths
- 11.1.5.4.2 Strategic choices
- 11.1.5.4.3 Weaknesses and competitive threats
- 11.1.6 TRENCH GROUP
- 11.1.6.1 Business overview
- 11.1.6.2 Products/Solutions/Services offered
- 11.1.6.3 Recent developments
- 11.1.6.3.1 Deals
- 11.1.7 RHM INTERNATIONAL, LLC
- 11.1.7.1 Business overview
- 11.1.7.2 Products/Solutions/Services offered
- 11.1.8 PFISTERER HOLDING SE
- 11.1.8.1 Business overview
- 11.1.8.2 Products/Solutions/Services offered
- 11.1.9 BUSHING (BEIJING) HV ELECTRIC CO., LTD.
- 11.1.9.1 Business overview
- 11.1.9.2 Products/Solutions/Services offered
- 11.1.10 YASH HIGHVOLTAGE INSULATORS PVT. LTD.
- 11.1.10.1 Business overview
- 11.1.10.2 Products/Solutions/Services offered
- 11.1.10.3 Recent developments
- 11.1.10.3.1 Product launches
- 11.1.11 NU-CORK PRODUCTS PVT LTD
- 11.1.11.1 Business overview
- 11.1.11.2 Products/Solutions/Services offered
- 11.1.12 SHANDONG CHINSUN ELECTRICAL EQUIPMENT CO., LTD
- 11.1.12.1 Business overview
- 11.1.12.2 Products/Solutions/Services offered
- 11.1.1 ABB
- 11.2 OTHER PLAYERS
- 11.2.1 DALIAN HIVOLT POWER SYSTEM CO., LTD.
- 11.2.2 NANJING ELECTRIC HV BUSHING CO., LTD.
- 11.2.3 BAODING HEWEI POWER TECHNOLOGY CO., LTD.
- 11.2.4 MASSA IZOLYATOR MEHRU PVT. LTD.
- 11.2.5 NANJING RAINBOW ELECTRIC CO., LTD
12 APPENDIX
- 12.1 INSIGHTS FROM INDUSTRY EXPERTS
- 12.2 DISCUSSION GUIDE
- 12.3 KNOWLEDGESTORE: MARKETSANDMARKETS' SUBSCRIPTION PORTAL
- 12.4 CUSTOMIZATION OPTIONS
- 12.5 RELATED REPORTS
- 12.6 AUTHOR DETAILS
