|
|
市場調査レポート
商品コード
1516913
産業用ソフトウェアの世界市場:技術別、エンドユーザー業界別、地域別 - 2029年までの予測Industrial Software Market by Type (Manufacturing Execution System, SCADA, Human Machine Interface, Robotic Software, Fault Detection and Classification, AI in manufacturing, Industrial Metrology), End-use (Process, Discrete) - Global Forecast to 2029 |
||||||
|
|||||||
カスタマイズ可能
|
|||||||

| 産業用ソフトウェアの世界市場:技術別、エンドユーザー業界別、地域別 - 2029年までの予測 |
|
出版日: 2024年06月25日
発行: MarketsandMarkets
ページ情報: 英文 264 Pages
納期: 即納可能
|

全表示
- 概要
- 図表
- 目次
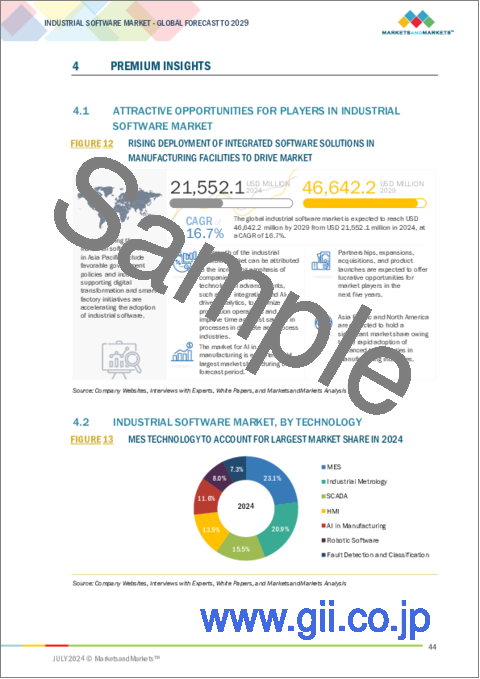
世界の産業用ソフトウェアの市場規模は、2024年に215億米ドルになるとみられ、2029年には466億米ドルに達すると予測されており、予測期間中のCAGRは16.7%と見込まれています。
都市化の進展、持続可能な製造に対する規制要件、スマート製造とスマートファクトリー戦略の統合が、産業用ソフトウェア市場の合理的な環境を促進しています。
| 調査範囲 | |
|---|---|
| 調査対象年 | 2020年~2029年 |
| 基準年 | 2023年 |
| 予測期間 | 2024年~2029年 |
| 検討単位 | 金額(10億米ドル) |
| セグメント別 | 技術別、エンドユーザー業界別、地域別 |
| 対象地域 | 北米、欧州、アジア大平洋、その他の地域 |
SCADAソフトウェアは、産業プロセスのリアルタイム監視、制御、自動化を可能にする重要な役割により、産業用ソフトウェア市場において大きな成長を遂げようとしています。SCADAシステムは、製造、エネルギー、石油・ガス、水処理、輸送などの産業において不可欠であり、地理的に分散した場所でのインフラ、機器、オペレーションの遠隔管理を容易にします。IoT(Internet of Things)やIIoT(Industrial Internet of Things)技術の採用の増加は、センサーやデバイスからのデータを集中制御システムに統合し、予知保全を可能にし、リソース利用を最適化し、運用効率を改善することによって、SCADAの機能をさらに強化します。産業界がデジタルトランスフォーメーションのイニシアチブを優先し、プロセスの最適化と自動化のための堅牢なソリューションを求め続ける中、SCADAソフトウェアはオペレーショナルエクセレンスを推進し、厳しい規制要件を満たす上で重要な役割を果たすと予想され、それによって産業用ソフトウェア市場における大きな成長を後押ししています。
ディスクリート産業セグメントは、いくつかの説得力のある理由により、産業用ソフトウェア市場内で大きな成長を遂げ、かなりの市場シェアを獲得する態勢を整えています。自動車、航空宇宙、エレクトロニクス、機械などの産業は、MES、SCADA、HMI、工業計測、ロボットソフトウェアなどの高度な産業用ソフトウェアソリューションから大きな恩恵を受ける複雑な製造プロセスに直面しています。これらのツールは、オペレーションを合理化し、ワークフローを最適化し、製造ライフサイクルを通じて厳格な品質管理を保証します。さらに、技術革新とカスタマイズの需要が産業用ソフトウェアの採用を促進し、多様な消費者ニーズを満たすための俊敏な製品設計、迅速なプロトタイプ作成、効率的な生産計画を可能にしています。世界な競争は、生産性の向上、無駄の削減、複雑なサプライチェーンの管理によって、産業用ソフトウェアが促進する業務効率と費用対効果の重要性を強調しています。AI、IoT、デジタルツインの技術的進歩は製造能力をさらに強化し、予知保全、リアルタイム監視、データ主導の意思決定をサポートします。規制コンプライアンスも堅牢なソフトウェア・ソリューションによって促進され、品質、安全性、環境基準の遵守が保証されます。ディスクリート・メーカーがデジタルトランスフォーメーション・イニシアチブを採用する中、産業用ソフトウェアは、自動化、接続性、継続的改善のためのスマート製造技術の統合において極めて重要な役割を果たし、それによってこのセグメントの成長と市場の注目を牽引しています。
当レポートでは、世界の産業用ソフトウェア市場について調査し、技術別、エンドユーザー業界別、地域別動向、および市場に参入する企業のプロファイルなどをまとめています。
目次
第1章 イントロダクション
第2章 調査手法
第3章 エグゼクティブサマリー
第4章 重要考察
第5章 市場概要
- イントロダクション
- 市場力学
- サプライチェーン分析
- エコシステム分析
- 投資と資金調達のシナリオ
- 価格分析
- 顧客のビジネスに影響を与える動向/混乱
- 技術分析
- ポーターのファイブフォース分析
- 主な利害関係者と購入基準
- ケーススタディ分析
- 貿易分析
- 特許分析
- 2024年~2025年の主な会議とイベント
- 規制状況
第6章 産業用ソフトウェア市場の新たな動向
- 産業用ソフトウェア市場の最新動向
第7章 産業用ソフトウェア市場、技術別
- イントロダクション
- MES
- SCADA
- ヒューマンマシンインターフェース
- 製造業におけるAI
- ロボットソフトウェア
- 障害検出と分類
- 工業計測
第8章 産業用ソフトウェア市場、エンドユーザー業界別
- イントロダクション
- プロセス産業
- 個別産業
第9章 産業用ソフトウェア市場、地域別
- イントロダクション
- 北米
- 欧州
- アジア太平洋
- その他の地域
第10章 競合情勢
- 概要
- 主要参入企業の戦略/強み、2019年~2024年
- 市場シェア分析、2023年
- 収益分析、2019年~2023年
- 企業価値評価と財務指標
- ブランド/製品比較
- 企業評価マトリックス:主要参入企業、2023年
- 企業評価マトリックス:スタートアップ/中小企業、2023年
- 競合シナリオと動向
第11章 企業プロファイル
- 主要参入企業
- SIEMENS
- SAP
- ROCKWELL AUTOMATION
- HONEYWELL INTERNATIONAL INC.
- ABB
- GENERAL ELECTRIC COMPANY
- OMRON CORPORATION
- ORACLE
- MITSUBISHI ELECTRIC CORPORATION
- HEXAGON AB
- その他の企業
- 42Q
- DASSAULT SYSTEMES
- RENISHAW PLC
- NIKON CORPORATION
- EPICOR SOFTWARE CORPORATION
- YOKOGAWA ELECTRIC CORPORATION
- APPLIED MATERIALS, INC.
- SPARKCOGNITION
- AIBRAIN INC.
- COGNEX CORPORATION
- EMERSON ELECTRIC CO.
- MICROSOFT
- TELEDYNE TECHNOLOGIES INCORPORATED
- SCHNEIDER ELECTRIC
第12章 付録
List of Tables
- TABLE 1 BENEFITS OF MES
- TABLE 2 ROLES OF COMPANIES IN INDUSTRIAL SOFTWARE ECOSYSTEM
- TABLE 3 INDICATIVE LICENSE/SUBSCRIPTION COST OF MES OFFERED BY THREE KEY PLAYERS (USD)
- TABLE 4 INDICATIVE SUBSCRIPTION COST OF MES (USD)
- TABLE 5 INDICATIVE COST RANGE OF MES (USD)
- TABLE 6 INDUSTRIAL SOFTWARE MARKET: PORTER'S FIVE FORCES ANALYSIS
- TABLE 7 INFLUENCE OF KEY STAKEHOLDERS ON BUYING PROCESS, BY DISCRETE INDUSTRY (%)
- TABLE 8 KEY BUYING CRITERIA, BY DISCRETE INDUSTRY
- TABLE 9 LIST OF APPLIED/GRANTED PATENTS RELATED TO INDUSTRIAL SOFTWARE, 2021-2024
- TABLE 10 INDUSTRIAL SOFTWARE MARKET: LIST OF CONFERENCES AND EVENTS, 2024-2025
- TABLE 11 NORTH AMERICA: LIST OF REGULATORY BODIES, GOVERNMENT AGENCIES, AND OTHER ORGANIZATIONS
- TABLE 12 EUROPE: LIST OF REGULATORY BODIES, GOVERNMENT AGENCIES, AND OTHER ORGANIZATIONS
- TABLE 13 ASIA PACIFIC: LIST OF REGULATORY BODIES, GOVERNMENT AGENCIES, AND OTHER ORGANIZATIONS
- TABLE 14 ROW: LIST OF REGULATORY BODIES, GOVERNMENT AGENCIES, AND OTHER ORGANIZATIONS
- TABLE 15 MAJOR COMMUNICATION STANDARDS FOR SCADA SYSTEMS
- TABLE 16 INDUSTRIAL SOFTWARE MARKET, BY TECHNOLOGY, 2020-2023 (USD MILLION)
- TABLE 17 INDUSTRIAL SOFTWARE MARKET, BY TECHNOLOGY, 2024-2029 (USD MILLION)
- TABLE 18 MES: INDUSTRIAL SOFTWARE MARKET, BY DEPLOYMENT, 2020-2023 (USD MILLION)
- TABLE 19 MES: INDUSTRIAL SOFTWARE MARKET, BY DEPLOYMENT, 2024-2029 (USD MILLION)
- TABLE 20 MES: INDUSTRIAL SOFTWARE MARKET, BY END-USER INDUSTRY, 2020-2023 (USD MILLION)
- TABLE 21 MES: INDUSTRIAL SOFTWARE MARKET, BY END-USER INDUSTRY, 2024-2029 (USD MILLION)
- TABLE 22 MES: INDUSTRIAL SOFTWARE MARKET, BY PROCESS INDUSTRY, 2020-2023 (USD MILLION)
- TABLE 23 MES: INDUSTRIAL SOFTWARE MARKET, BY PROCESS INDUSTRY, 2024-2029 (USD MILLION)
- TABLE 24 MES: INDUSTRIAL SOFTWARE MARKET, BY DISCRETE INDUSTRY, 2020-2023 (USD MILLION)
- TABLE 25 MES: INDUSTRIAL SOFTWARE MARKET, BY DISCRETE INDUSTRY, 2024-2029 (USD MILLION)
- TABLE 26 MES: INDUSTRIAL SOFTWARE MARKET, BY REGION, 2020-2023 (USD MILLION)
- TABLE 27 MES: INDUSTRIAL SOFTWARE MARKET, BY REGION, 2024-2029 (USD MILLION)
- TABLE 28 SCADA: INDUSTRIAL SOFTWARE MARKET, BY END-USER INDUSTRY, 2020-2023 (USD MILLION).
- TABLE 29 SCADA: INDUSTRIAL SOFTWARE MARKET, BY END-USER INDUSTRY, 2024-2029 (USD MILLION)
- TABLE 30 SCADA: INDUSTRIAL SOFTWARE MARKET, BY PROCESS INDUSTRY, 2020-2023 (USD MILLION)
- TABLE 31 SCADA: INDUSTRIAL SOFTWARE MARKET, BY PROCESS INDUSTRY, 2024-2029 (USD MILLION)
- TABLE 32 SCADA: INDUSTRIAL SOFTWARE MARKET, BY DISCRETE INDUSTRY, 2020-2023 (USD MILLION)
- TABLE 33 SCADA: INDUSTRIAL SOFTWARE MARKET, BY DISCRETE INDUSTRY, 2024-2029 (USD MILLION)
- TABLE 34 SCADA: INDUSTRIAL SOFTWARE MARKET, BY REGION, 2020-2023 (USD MILLION)
- TABLE 35 SCADA: INDUSTRIAL SOFTWARE MARKET, BY REGION, 2024-2029 (USD MILLION)
- TABLE 36 HMI: INDUSTRIAL SOFTWARE MARKET, BY DEPLOYMENT, 2020-2023 (USD MILLION)
- TABLE 37 HMI: INDUSTRIAL SOFTWARE MARKET, BY DEPLOYMENT, 2024-2029 (USD MILLION)
- TABLE 38 HMI: INDUSTRIAL SOFTWARE MARKET, BY END-USER INDUSTRY, 2020-2023 (USD MILLION)
- TABLE 39 HMI: INDUSTRIAL SOFTWARE MARKET, BY END-USER INDUSTRY, 2024-2029 (USD MILLION)
- TABLE 40 HMI: INDUSTRIAL SOFTWARE MARKET, BY PROCESS INDUSTRY, 2020-2023 (USD MILLION)
- TABLE 41 HMI: INDUSTRIAL SOFTWARE MARKET, BY PROCESS INDUSTRY, 2024-2029 (USD MILLION)
- TABLE 42 HMI: INDUSTRIAL SOFTWARE MARKET, BY DISCRETE INDUSTRY, 2020-2023 (USD MILLION)
- TABLE 43 HMI: INDUSTRIAL SOFTWARE MARKET, BY DISCRETE INDUSTRY, 2024-2029 (USD MILLION)
- TABLE 44 HMI: INDUSTRIAL SOFTWARE MARKET, BY REGION, 2020-2023 (USD MILLION)
- TABLE 45 HMI: INDUSTRIAL SOFTWARE MARKET, BY REGION, 2024-2029 (USD MILLION)
- TABLE 46 AI IN MANUFACTURING: INDUSTRIAL SOFTWARE MARKET, BY TYPE, 2020-2023 (USD MILLION)
- TABLE 47 AI IN MANUFACTURING: INDUSTRIAL SOFTWARE MARKET, BY TYPE, 2024-2029 (USD MILLION)
- TABLE 48 AI SOLUTIONS: AI IN MANUFACTURING MARKET, BY DEPLOYMENT, 2020-2023 (USD MILLION)
- TABLE 49 AI SOLUTIONS: AI IN MANUFACTURING MARKET, BY DEPLOYMENT, 2024-2029 (USD MILLION)
- TABLE 50 AI PLATFORMS: AI IN MANUFACTURING MARKET, BY PLATFORM TYPE, 2020-2023 (USD MILLION)
- TABLE 51 AI PLATFORMS: AI IN MANUFACTURING MARKET, BY PLATFORM TYPE, 2024-2029 (USD MILLION)
- TABLE 52 AI IN MANUFACTURING: INDUSTRIAL SOFTWARE MARKET, BY END-USER INDUSTRY, 2020-2023 (USD MILLION)
- TABLE 53 AI IN MANUFACTURING: INDUSTRIAL SOFTWARE MARKET, BY END-USER INDUSTRY, 2024-2029 (USD MILLION)
- TABLE 54 AI IN MANUFACTURING: INDUSTRIAL SOFTWARE MARKET, BY PROCESS INDUSTRY, 2020-2023 (USD MILLION)
- TABLE 55 AI IN MANUFACTURING: INDUSTRIAL SOFTWARE MARKET, BY PROCESS INDUSTRY, 2024-2029 (USD MILLION)
- TABLE 56 AI IN MANUFACTURING: INDUSTRIAL SOFTWARE MARKET, BY DISCRETE INDUSTRY, 2020-2023 (USD MILLION)
- TABLE 57 AI IN MANUFACTURING: INDUSTRIAL SOFTWARE MARKET, BY DISCRETE INDUSTRY, 2024-2029 (USD MILLION)
- TABLE 58 AI IN MANUFACTURING: INDUSTRIAL SOFTWARE MARKET, BY REGION, 2020-2023 (USD MILLION)
- TABLE 59 AI IN MANUFACTURING: INDUSTRIAL SOFTWARE MARKET, BY REGION, 2024-2029 (USD MILLION)
- TABLE 60 ROBOTIC SOFTWARE: INDUSTRIAL SOFTWARE MARKET, BY TYPE, 2020-2023 (USD MILLION)
- TABLE 61 ROBOTIC SOFTWARE: INDUSTRIAL SOFTWARE MARKET, BY TYPE, 2024-2029 (USD MILLION)
- TABLE 62 ROBOTIC SOFTWARE: INDUSTRIAL SOFTWARE MARKET, BY END-USER INDUSTRY, 2020-2023 (USD MILLION)
- TABLE 63 ROBOTIC SOFTWARE: INDUSTRIAL SOFTWARE MARKET, BY END-USER INDUSTRY, 2024-2029 (USD MILLION)
- TABLE 64 ROBOTIC SOFTWARE: INDUSTRIAL SOFTWARE MARKET, BY PROCESS INDUSTRY, 2020-2023 (USD MILLION)
- TABLE 65 ROBOTIC SOFTWARE: INDUSTRIAL SOFTWARE MARKET, BY PROCESS INDUSTRY, 2024-2029 (USD MILLION)
- TABLE 66 ROBOTIC SOFTWARE: INDUSTRIAL SOFTWARE MARKET, BY DISCRETE INDUSTRY, 2020-2023 (USD MILLION)
- TABLE 67 ROBOTIC SOFTWARE: INDUSTRIAL SOFTWARE MARKET, BY DISCRETE INDUSTRY, 2024-2029 (USD MILLION)
- TABLE 68 ROBOTIC SOFTWARE: INDUSTRIAL SOFTWARE MARKET, BY REGION, 2020-2023 (USD MILLION)
- TABLE 69 ROBOTIC SOFTWARE: INDUSTRIAL SOFTWARE MARKET, BY REGION, 2024-2029 (USD MILLION)
- TABLE 70 FAULT DETECTION AND CLASSIFICATION: INDUSTRIAL SOFTWARE MARKET, BY END-USER INDUSTRY, 2020-2023 (USD MILLION)
- TABLE 71 FAULT DETECTION AND CLASSIFICATION: INDUSTRIAL SOFTWARE MARKET, BY END-USER INDUSTRY, 2024-2029 (USD MILLION)
- TABLE 72 FAULT DETECTION AND CLASSIFICATION: INDUSTRIAL SOFTWARE MARKET, BY PROCESS INDUSTRY, 2020-2023 (USD MILLION)
- TABLE 73 FAULT DETECTION AND CLASSIFICATION: INDUSTRIAL SOFTWARE MARKET, BY PROCESS INDUSTRY, 2024-2029 (USD MILLION)
- TABLE 74 FAULT DETECTION AND CLASSIFICATION: INDUSTRIAL SOFTWARE MARKET, BY DISCRETE INDUSTRY, 2020-2023 (USD MILLION)
- TABLE 75 FAULT DETECTION AND CLASSIFICATION: INDUSTRIAL SOFTWARE MARKET, BY DISCRETE INDUSTRY, 2024-2029 (USD MILLION)
- TABLE 76 FAULT DETECTION AND CLASSIFICATION: INDUSTRIAL SOFTWARE MARKET, BY REGION, 2020-2023 (USD MILLION)
- TABLE 77 FAULT DETECTION AND CLASSIFICATION: INDUSTRIAL SOFTWARE MARKET, BY REGION, 2024-2029 (USD MILLION)
- TABLE 78 INDUSTRIAL METROLOGY: INDUSTRIAL SOFTWARE MARKET, BY END-USER INDUSTRY, 2020-2023 (USD MILLION)
- TABLE 79 INDUSTRIAL METROLOGY: INDUSTRIAL SOFTWARE MARKET, BY END-USER INDUSTRY, 2024-2029 (USD MILLION)
- TABLE 80 INDUSTRIAL METROLOGY: INDUSTRIAL SOFTWARE MARKET, BY PROCESS INDUSTRY, 2020-2023 (USD MILLION)
- TABLE 81 INDUSTRIAL METROLOGY: INDUSTRIAL SOFTWARE MARKET, BY PROCESS INDUSTRY, 2024-2029 (USD MILLION)
- TABLE 82 INDUSTRIAL METROLOGY: INDUSTRIAL SOFTWARE MARKET, BY DISCRETE INDUSTRY, 2020-2023 (USD MILLION)
- TABLE 83 INDUSTRIAL METROLOGY: INDUSTRIAL SOFTWARE MARKET, BY DISCRETE INDUSTRY, 2024-2029 (USD MILLION)
- TABLE 84 INDUSTRIAL METROLOGY: INDUSTRIAL SOFTWARE MARKET, BY REGION, 2020-2023 (USD MILLION)
- TABLE 85 INDUSTRIAL METROLOGY: INDUSTRIAL SOFTWARE MARKET, BY REGION, 2024-2029 (USD MILLION)
- TABLE 86 INDUSTRIAL SOFTWARE MARKET, BY END-USER INDUSTRY, 2020-2023 (USD MILLION)
- TABLE 87 INDUSTRIAL SOFTWARE MARKET, BY END-USER INDUSTRY, 2024-2029 (USD MILLION)
- TABLE 88 INDUSTRIAL SOFTWARE MARKET, BY PROCESS INDUSTRY, 2020-2023 (USD MILLION)
- TABLE 89 INDUSTRIAL SOFTWARE MARKET, BY PROCESS INDUSTRY, 2024-2029 (USD MILLION)
- TABLE 90 PROCESS INDUSTRY: INDUSTRIAL SOFTWARE MARKET, BY TECHNOLOGY, 2020-2023 (USD MILLION)
- TABLE 91 PROCESS INDUSTRY: INDUSTRIAL SOFTWARE MARKET, BY TECHNOLOGY, 2024-2029 (USD MILLION)
- TABLE 92 INDUSTRIAL SOFTWARE MARKET, BY DISCRETE INDUSTRY, 2020-2023 (USD MILLION)
- TABLE 93 INDUSTRIAL SOFTWARE MARKET, BY DISCRETE INDUSTRY, 2024-2029 (USD MILLION)
- TABLE 94 DISCRETE INDUSTRY: INDUSTRIAL SOFTWARE MARKET, BY TECHNOLOGY, 2020-2023 (USD MILLION)
- TABLE 95 DISCRETE INDUSTRY: INDUSTRIAL SOFTWARE MARKET, BY TECHNOLOGY, 2024-2029 (USD MILLION)
- TABLE 96 INDUSTRIAL SOFTWARE MARKET, BY REGION, 2020-2023 (USD MILLION)
- TABLE 97 INDUSTRIAL SOFTWARE MARKET, BY REGION, 2024-2029 (USD MILLION)
- TABLE 98 NORTH AMERICA: INDUSTRIAL SOFTWARE MARKET, BY COUNTRY, 2020-2023 (USD MILLION)
- TABLE 99 NORTH AMERICA: INDUSTRIAL SOFTWARE MARKET, BY COUNTRY, 2024-2029 (USD MILLION)
- TABLE 100 NORTH AMERICA: INDUSTRIAL SOFTWARE MARKET, BY TECHNOLOGY, 2020-2023 (USD MILLION)
- TABLE 101 NORTH AMERICA: INDUSTRIAL SOFTWARE MARKET, BY TECHNOLOGY, 2024-2029 (USD MILLION)
- TABLE 102 EUROPE: INDUSTRIAL SOFTWARE MARKET, BY COUNTRY, 2020-2023 (USD MILLION)
- TABLE 103 EUROPE: INDUSTRIAL SOFTWARE MARKET, BY COUNTRY, 2024-2029 (USD MILLION)
- TABLE 104 EUROPE: INDUSTRIAL SOFTWARE MARKET, BY TECHNOLOGY, 2020-2023 (USD MILLION)
- TABLE 105 EUROPE: INDUSTRIAL SOFTWARE MARKET, BY TECHNOLOGY, 2024-2029 (USD MILLION)
- TABLE 106 ASIA PACIFIC: INDUSTRIAL SOFTWARE MARKET, BY COUNTRY, 2020-2023 (USD MILLION)
- TABLE 107 ASIA PACIFIC: INDUSTRIAL SOFTWARE MARKET, BY COUNTRY, 2024-2029 (USD MILLION)
- TABLE 108 ASIA PACIFIC: INDUSTRIAL SOFTWARE MARKET, BY TECHNOLOGY, 2020-2023 (USD MILLION)
- TABLE 109 ASIA PACIFIC: INDUSTRIAL SOFTWARE MARKET, BY TECHNOLOGY, 2024-2029 (USD MILLION)
- TABLE 110 ROW: INDUSTRIAL SOFTWARE MARKET, BY REGION, 2020-2023 (USD MILLION)
- TABLE 111 ROW: INDUSTRIAL SOFTWARE MARKET, BY REGION, 2024-2029 (USD MILLION)
- TABLE 112 ROW: INDUSTRIAL SOFTWARE MARKET, BY TECHNOLOGY, 2020-2023 (USD MILLION)
- TABLE 113 ROW: INDUSTRIAL SOFTWARE MARKET, BY TECHNOLOGY, 2024-2029 (USD MILLION)
- TABLE 114 MIDDLE EAST & AFRICA: INDUSTRIAL SOFTWARE MARKET, BY REGION, 2020-2023 (USD MILLION)
- TABLE 115 MIDDLE EAST & AFRICA: INDUSTRIAL SOFTWARE MARKET, BY REGION, 2024-2029 (USD MILLION)
- TABLE 116 KEY PLAYER STRATEGIES/RIGHT TO WIN, 2019-2024
- TABLE 117 INDUSTRIAL SOFTWARE MARKET: DEGREE OF COMPETITION, 2023
- TABLE 118 INDUSTRIAL SOFTWARE MARKET: COMPANY DEPLOYMENT FOOTPRINT
- TABLE 119 INDUSTRIAL SOFTWARE MARKET: END-USER INDUSTRY FOOTPRINT
- TABLE 120 INDUSTRIAL SOFTWARE MARKET: REGION FOOTPRINT
- TABLE 121 INDUSTRIAL SOFTWARE MARKET: DETAILED LIST OF KEY STARTUPS/SMES
- TABLE 122 INDUSTRIAL SOFTWARE MARKET FOR MES TECHNOLOGY: COMPETITIVE BENCHMARKING OF KEY STARTUPS/SMES
- TABLE 123 INDUSTRIAL SOFTWARE MARKET: PRODUCT LAUNCHES/DEVELOPMENTS, JULY 2019-APRIL 2024
- TABLE 124 INDUSTRIAL SOFTWARE MARKET: DEALS, JULY 2019- APRIL 2024
- TABLE 125 INDUSTRIAL SOFTWARE MARKET: OTHERS, JULY 2019- APRIL 2024
- TABLE 126 SIEMENS: COMPANY OVERVIEW
- TABLE 127 SIEMENS: PRODUCTS/SOLUTIONS/SERVICES OFFERED
- TABLE 128 SIEMENS: PRODUCT LAUNCHES/DEVELOPMENTS
- TABLE 129 SIEMENS: DEALS
- TABLE 130 SAP: COMPANY OVERVIEW
- TABLE 131 SAP: PRODUCTS/SOLUTIONS/SERVICES OFFERED
- TABLE 132 SAP: DEALS
- TABLE 133 ROCKWELL AUTOMATION: COMPANY OVERVIEW
- TABLE 134 ROCKWELL AUTOMATION: PRODUCTS/SOLUTIONS/SERVICES OFFERED
- TABLE 135 ROCKWELL AUTOMATION: PRODUCT LAUNCHES/DEVELOPMENTS
- TABLE 136 ROCKWELL AUTOMATION: DEALS
- TABLE 137 ROCKWELL AUTOMATION: OTHERS
- TABLE 138 HONEYWELL INTERNATIONAL INC.: COMPANY OVERVIEW
- TABLE 139 HONEYWELL INTERNATIONAL INC.: PRODUCTS/SOLUTIONS/SERVICES OFFERED
- TABLE 140 HONEYWELL INTERNATIONAL INC.: DEALS
- TABLE 141 ABB: COMPANY OVERVIEW
- TABLE 142 ABB: PRODUCTS/SOLUTIONS/SERVICES OFFERED
- TABLE 143 ABB: PRODUCT LAUNCHES/DEVELOPMENTS
- TABLE 144 ABB: DEALS
- TABLE 145 GENERAL ELECTRIC COMPANY: COMPANY OVERVIEW
- TABLE 146 GENERAL ELECTRIC COMPANY: PRODUCTS/SOLUTIONS/SERVICES OFFERED
- TABLE 147 GENERAL ELECTRIC COMPANY: PRODUCT LAUNCHES/DEVELOPMENTS
- TABLE 148 GENERAL ELECTRIC COMPANY: DEALS
- TABLE 149 OMRON CORPORATION: COMPANY OVERVIEW
- TABLE 150 OMRON CORPORATION: PRODUCTS/SOLUTIONS/SERVICES OFFERED
- TABLE 151 OMRON CORPORATION: PRODUCT LAUNCHES/DEVELOPMENTS
- TABLE 152 OMRON CORPORATION: DEALS
- TABLE 153 ORACLE: COMPANY OVERVIEW
- TABLE 154 ORACLE: PRODUCTS/SOLUTIONS/SERVICES OFFERED
- TABLE 155 MITSUBISHI ELECTRIC CORPORATION: COMPANY OVERVIEW
- TABLE 156 MITSUBISHI ELECTRIC CORPORATION: PRODUCTS/SOLUTIONS/SERVICES OFFERED
- TABLE 157 MITSUBISHI ELECTRIC CORPORATION: PRODUCT LAUNCHES/DEVELOPMENTS
- TABLE 158 MITSUBISHI ELECTRIC CORPORATION: DEALS
- TABLE 159 HEXAGON AB: COMPANY OVERVIEW
- TABLE 160 HEXAGON AB: PRODUCTS/SOLUTIONS/SERVICES OFFERED
- TABLE 161 HEXAGON AB: PRODUCT LAUNCHES/DEVELOPMENTS
- TABLE 162 HEXAGON AB: DEALS
List of Figures
- FIGURE 1 INDUSTRIAL SOFTWARE MARKET SEGMENTATION
- FIGURE 2 INDUSTRIAL SOFTWARE MARKET SIZE ESTIMATION PROCESS FLOW
- FIGURE 3 INDUSTRIAL SOFTWARE MARKET: RESEARCH DESIGN
- FIGURE 4 MARKET SIZE ESTIMATION METHODOLOGY: BOTTOM-UP APPROACH
- FIGURE 5 MARKET SIZE ESTIMATION METHODOLOGY: TOP-DOWN APPROACH
- FIGURE 6 MARKET SIZE ESTIMATION METHODOLOGY (SUPPLY SIDE): REVENUE GENERATED BY KEY PLAYERS
- FIGURE 7 DATA TRIANGULATION
- FIGURE 8 AI IN MANUFACTURING TECHNOLOGY TO ACCOUNT FOR LARGEST MARKET SHARE IN 2029
- FIGURE 9 DISCRETE INDUSTRIES TO HOLD LARGER MARKET SHARE IN 2029
- FIGURE 10 PHARMACEUTICALS INDUSTRY TO CLAIM LARGEST MARKET SHARE IN 2029
- FIGURE 11 ASIA PACIFIC TO EXHIBIT HIGHEST CAGR DURING FORECAST PERIOD
- FIGURE 12 RISING DEPLOYMENT OF INTEGRATED SOFTWARE SOLUTIONS IN MANUFACTURING FACILITIES TO DRIVE MARKET
- FIGURE 13 MES TECHNOLOGY TO ACCOUNT FOR LARGEST MARKET SHARE IN 2024
- FIGURE 14 DISCRETE INDUSTRIES TO CAPTURE LARGER MARKET SHARE IN 2024
- FIGURE 15 AUTOMOTIVE INDUSTRY TO HOLD LARGER MARKET SHARE IN 2029
- FIGURE 16 CHINA TO REGISTER HIGHEST CAGR IN GLOBAL INDUSTRIAL SOFTWARE MARKET DURING FORECAST PERIOD
- FIGURE 17 INDUSTRIAL SOFTWARE MARKET: DRIVERS, RESTRAINTS, OPPORTUNITIES, AND CHALLENGES
- FIGURE 18 INDUSTRIAL SOFTWARE MARKET: IMPACT ANALYSIS OF DRIVERS
- FIGURE 19 INDUSTRIAL SOFTWARE MARKET: IMPACT ANALYSIS OF RESTRAINTS
- FIGURE 20 INDUSTRIAL SOFTWARE MARKET: IMPACT ANALYSIS OF OPPORTUNITIES
- FIGURE 21 INDUSTRIAL SOFTWARE MARKET: IMPACT ANALYSIS OF CHALLENGES
- FIGURE 22 INDUSTRIAL SOFTWARE MARKET: SUPPLY CHAIN ANALYSIS
- FIGURE 23 INDUSTRIAL SOFTWARE ECOSYSTEM ANALYSIS
- FIGURE 24 INVESTMENT AND FUNDING SCENARIO
- FIGURE 25 INDICATIVE COST OF LICENSES/SUBSCRIPTIONS OF MES OFFERED BY THREE KEY PLAYERS (USD)
- FIGURE 26 INDICATIVE LICENSE/SUBSCRIPTION COST OF MES, 2020-2023 (USD)
- FIGURE 27 INDICATIVE LICENSE/SUBSCRIPTION COST OF MES, BY REGION, 2020-2023 (USD)
- FIGURE 28 TRENDS/DISRUPTIONS IMPACTING CUSTOMERS' BUSINESSES
- FIGURE 29 INDUSTRIAL SOFTWARE MARKET: PORTER'S FIVE FORCES ANALYSIS
- FIGURE 30 INFLUENCE OF STAKEHOLDERS ON BUYING PROCESS, BY DISCRETE INDUSTRY
- FIGURE 31 KEY BUYING CRITERIA, BY DISCRETE INDUSTRY
- FIGURE 32 IMPORT DATA FOR HS CODE 903289-COMPLIANT PRODUCTS, BY COUNTRY, 2019-2023 (USD MILLION)
- FIGURE 33 EXPORT DATA FOR HS CODE 903289-COMPLIANT PRODUCTS, BY COUNTRY, 2019-2023 (USD MILLION)
- FIGURE 34 NUMBER OF PATENTS APPLIED AND GRANTED FOR INDUSTRIAL SOFTWARE SOLUTIONS, 2014-2023
- FIGURE 35 INDUSTRIAL SOFTWARE MARKET, BY TECHNOLOGY
- FIGURE 36 MES TECHNOLOGY TO LEAD MARKET IN 2024
- FIGURE 37 ADVANTAGES OF SOFTWARE-INTEGRATED SCADA SYSTEMS
- FIGURE 38 INDUSTRIAL SOFTWARE MARKET, BY END-USER INDUSTRY
- FIGURE 39 PHARMACEUTICALS SEGMENT TO HOLD LARGEST MARKET SHARE IN 2024
- FIGURE 40 AUTOMOTIVE SEGMENT TO DOMINATE MARKET IN 2029
- FIGURE 41 INDUSTRIAL SOFTWARE MARKET, BY REGION
- FIGURE 42 NORTH AMERICA: INDUSTRIAL SOFTWARE MARKET SNAPSHOT
- FIGURE 43 EUROPE: INDUSTRIAL SOFTWARE MARKET SNAPSHOT
- FIGURE 44 ASIA PACIFIC: INDUSTRIAL SOFTWARE MARKET SNAPSHOT
- FIGURE 45 INDUSTRIAL SOFTWARE MARKET SHARE ANALYSIS, 2023
- FIGURE 46 REVENUE ANALYSIS OF TOP FIVE PLAYERS, 2019-2023
- FIGURE 47 COMPANY VALUATION, 2023
- FIGURE 48 FINANCIAL METRICS (EV/EBITDA), 2023
- FIGURE 49 BRAND/PRODUCT COMPARISON
- FIGURE 50 INDUSTRIAL SOFTWARE MARKET: COMPANY EVALUATION MATRIX (KEY PLAYERS), 2023
- FIGURE 51 INDUSTRIAL SOFTWARE MARKET: COMPANY FOOTPRINT
- FIGURE 52 INDUSTRIAL SOFTWARE MARKET: COMPANY EVALUATION MATRIX (STARTUPS/SMES), 2023
- FIGURE 53 SIEMENS: COMPANY SNAPSHOT
- FIGURE 54 SAP: COMPANY SNAPSHOT
- FIGURE 55 ROCKWELL AUTOMATION: COMPANY SNAPSHOT
- FIGURE 56 HONEYWELL INTERNATIONAL INC.: COMPANY SNAPSHOT
- FIGURE 57 ABB: COMPANY SNAPSHOT
- FIGURE 58 OMRON CORPORATION: COMPANY SNAPSHOT
- FIGURE 59 ORACLE: COMPANY SNAPSHOT
- FIGURE 60 MITSUBISHI ELECTRIC CORPORATION: COMPANY SNAPSHOT
- FIGURE 61 HEXAGON AB: COMPANY SNAPSHOT
The global industrial software market was valued at USD 21.5 billion in 2024 and is estimated to reach USD 46.6 billion by 2029, registering a CAGR of 16.7% during the forecast period. The rising urbanization, regulatory requirements for sustainable manufacturing and the integration of smart manufacturing and smart factory strategies foster a reasonable setting for industrial software market.
| Scope of the Report | |
|---|---|
| Years Considered for the Study | 2020-2029 |
| Base Year | 2023 |
| Forecast Period | 2024-2029 |
| Units Considered | Value (USD Billion) |
| Segments | By Type, End-use and Region |
| Regions covered | North America, Europe, APAC, RoW |
"SCADA to contribute significant share in industrial software market."
SCADA (Supervisory Control and Data Acquisition) software is poised for significant growth within the industrial software market due to its critical role in enabling real-time monitoring, control, and automation of industrial processes. SCADA systems are essential in industries such as manufacturing, energy, oil & gas, water treatment, and transportation, where they facilitate remote management of infrastructure, equipment, and operations across geographically dispersed locations. The increasing adoption of IoT (Internet of Things) and IIoT (Industrial Internet of Things) technologies further enhances SCADA's capabilities by integrating data from sensors and devices into centralized control systems, enabling predictive maintenance, optimizing resource utilization, and improving operational efficiency. As industries continue to prioritize digital transformation initiatives and seek robust solutions for process optimization and automation, SCADA software is expected to play a crucial role in driving operational excellence and meeting stringent regulatory requirements, thereby fueling its significant growth in the industrial software market..
"Discrete segment contributes significant share in the industrial software market."
The discrete industry segment is poised to experience significant growth and capture a substantial market share within the industrial software market for several compelling reasons. Industries such as automotive, aerospace, electronics, and machinery face complex manufacturing processes that benefit greatly from advanced industrial software solutions like MES, SCADA,HMI, industrial metrology and robotic software. These tools streamline operations, optimize workflows, and ensure stringent quality control throughout the manufacturing lifecycle. Moreover, the demand for innovation and customization drives the adoption of industrial software, enabling agile product design, rapid prototyping, and efficient production planning to meet diverse consumer needs. Global competition underscores the importance of operational efficiency and cost-effectiveness, which industrial software facilitates by improving productivity, reducing waste, and managing complex supply chains. Technological advancements in AI, IoT, and digital twins further enhance manufacturing capabilities, supporting predictive maintenance, real-time monitoring, and data-driven decision-making. Regulatory compliance is also facilitated through robust software solutions, ensuring adherence to quality, safety, and environmental standards. As discrete manufacturers embrace digital transformation initiatives, industrial software plays a pivotal role in integrating smart manufacturing technologies for automation, connectivity, and continuous improvement, thereby driving the segment's growth and market prominence.
"North America will contribute significantly to the growth rate in industrial software market."
North America is poised to contribute a significant share to the industrial software market for several compelling reasons. The region boasts a robust industrial base across sectors such as manufacturing, automotive, aerospace, energy, and pharmaceuticals, all of which heavily rely on advanced software solutions to optimize operations and enhance productivity. Industrial software applications such as MES (Manufacturing Execution Systems), SCADA (Supervisory Control and Data Acquisition), are integral to managing complex manufacturing processes, ensuring regulatory compliance, and improving efficiency. Moreover, North America leads in technological innovation, with ongoing investments in AI (Artificial Intelligence), IoT (Internet of Things), and cloud computing driving the adoption of smart manufacturing practices. These technologies enable real-time monitoring, predictive maintenance, and data analytics, thereby supporting agile decision-making and continuous improvement initiatives. The region's commitment to digital transformation, coupled with a strong emphasis on quality control and operational excellence, positions North America as a key contributor to the global industrial software market, driving innovation and competitiveness across industries.
In-depth interviews have been conducted with chief executive officers (CEOs), Directors, and other executives from various key organizations operating in the industrial software market place.
- By Company Type: Tier 1 - 40%, Tier 2 - 35%, and Tier 3 - 25%
- By Designation: C-level Executives - 35%, Directors - 28%, and Others - 37%
- By Region: North America- 45%, Europe - 35%, Asia Pacific- 15% and RoW- 5%
Siemens (Germany), Rockwell Automation (US), ABB (Switzerland), Emerson Electric Co. (US) and General Electric (US) among others, are some of the key players in the industrial software market.
The study includes an in-depth competitive analysis of these key players in the industrial software market, with their company profiles, recent developments, and key market strategies.
Research Coverage
This research report categorizes the industrial software market by type, end-use, and region (North America, Europe, Asia Pacific, and RoW). The report scope covers detailed information regarding the major factors, such as drivers, restraints, challenges, and opportunities, influencing the growth of the industrial software market. A detailed analysis of the key industry players has provided insights into their business overview, solutions and services, key strategies, Contracts, partnerships, and agreements. New product and service launches, acquisitions, and recent developments associated with the industrial software market. This report covers competitive analysis of upcoming startups in the industrial software market ecosystem.
Reasons to buy this report
The report will help the market leaders/new entrants with information on the closest approximations of the revenue numbers for the industrial software market, and subsegments. This report will help stakeholders understand the competitive landscape and gain more insights to position their businesses better and plan suitable go-to-market strategies. The report also helps stakeholders understand the market pulse and provides information on key market drivers, restraints, challenges, and opportunities.
The report provides insights on the following pointers:
This new version of the report on the industrial software market includes the following:
- Market size from 2020 to 2029
- Average selling prices (ASPs) of industrial software calculated by the weighted average method
- Updated research assumptions and limitations
- Information related to trends/disruptions impacting businesses of customers, as well as information on the ecosystem of industrial software, trade analysis, regulatory analyses, technology analysis, patents analysis, and case studies pertaining to the industrial software market.
- Updated financial information until 2023 (depending on availability) for each listed company helps in the easy analysis of the present status of the profiled companies in terms of their financial strength, profitability, key revenue-generating regions/countries, and the highest revenue-generating business segments.
- Recent developments that help assess market trends and growth strategies adopted by leading market players
- Key manufacturers offering industrial software; key 25 providers are categorized into star, pervasive, emerging leader, and participant companies based on their performance on various parameters such as product footprint, focus on product innovations and geographic footprint.
- Market share analysis of various players operating in the industrial software market for 2023
- Small- and medium-sized enterprises (SME) matrix that brief some business strategies and product offerings of 15 SME players operating in the market, which are classified into four groups: progressive, dynamic, responsive companies, and starting blocks
- Brief information regarding the competitive situations and trends in the industrial software market
- The product, application, and geographic footprints of the key 25 providers of industrial software market
- Product Development/Innovation: Detailed insights on upcoming technologies, research & development activities, and new product & service launches in the industrial software market
- Market Development: Comprehensive information about lucrative markets - the report analyses the industrial software market across varied regions.
- Market Diversification: Exhaustive information about new products & services, untapped geographies, recent developments, and investments in the industrial software market
- Competitive Assessment: In-depth assessment of market shares, growth strategies, and service offerings of leading players like Siemens (Germany), Rockwell Automation (US), ABB (Switzerland), Emerson Electric Co. (US) and General Electric (US) among others in the industrial software market.
TABLE OF CONTENTS
1 INTRODUCTION
- 1.1 STUDY OBJECTIVES
- 1.2 MARKET DEFINITION
- 1.3 STUDY SCOPE
- 1.3.1 MARKETS COVERED
- 1.3.2 INCLUSIONS AND EXCLUSIONS
- 1.3.3 REGIONAL SCOPE
- 1.3.4 YEARS CONSIDERED
- 1.4 CURRENCY CONSIDERED
- 1.5 UNITS CONSIDERED
- 1.6 LIMITATIONS
- 1.7 STAKEHOLDERS
- 1.8 RECESSION IMPACT
2 RESEARCH METHODOLOGY
- 2.1 RESEARCH DATA
- 2.1.1 SECONDARY AND PRIMARY RESEARCH
- 2.1.2 SECONDARY DATA
- 2.1.2.1 List of key secondary sources
- 2.1.2.2 Key data from secondary sources
- 2.1.3 PRIMARY DATA
- 2.1.3.1 List of major primary interview participants
- 2.1.3.2 Breakdown of primaries
- 2.1.3.3 Key industry insights
- 2.1.3.4 Key data from primary sources
- 2.2 MARKET SIZE ESTIMATION
- 2.2.1 BOTTOM-UP APPROACH
- 2.2.1.1 Approach to estimate market size using bottom-up analysis
- 2.2.2 TOP-DOWN APPROACH
- 2.2.2.1 Approach to estimate market size using top-down analysis
- 2.2.1 BOTTOM-UP APPROACH
- 2.3 MARKET BREAKDOWN AND DATA TRIANGULATION
- 2.4 RESEARCH ASSUMPTIONS
- 2.5 IMPACT OF RECESSION
- 2.6 RESEARCH LIMITATIONS
- 2.7 RISK ANALYSIS
3 EXECUTIVE SUMMARY
4 PREMIUM INSIGHTS
- 4.1 ATTRACTIVE OPPORTUNITIES FOR PLAYERS IN INDUSTRIAL SOFTWARE MARKET
- 4.2 INDUSTRIAL SOFTWARE MARKET, BY TECHNOLOGY
- 4.3 INDUSTRIAL SOFTWARE MARKET, BY END-USER INDUSTRY
- 4.4 INDUSTRIAL SOFTWARE MARKET, BY DISCRETE INDUSTRY
- 4.5 INDUSTRIAL SOFTWARE MARKET, BY REGION
5 MARKET OVERVIEW
- 5.1 INTRODUCTION
- 5.2 MARKET DYNAMICS
- 5.2.1 DRIVERS
- 5.2.1.1 Growing need for connected supply chain in manufacturing sector
- 5.2.1.2 Increasing importance of real-time data in performing process analysis and predictive maintenance
- 5.2.1.3 Integration of AI and ML into discrete and process industries
- 5.2.1.4 Government-led investments in AI, HMI, and IIoT
- 5.2.1.5 Increasing demand for fault detection and classification solutions
- 5.2.2 RESTRAINTS
- 5.2.2.1 High installation and maintenance costs
- 5.2.2.2 Complexities associated with integrating components with existing infrastructure
- 5.2.2.3 Requirement for high level of technical expertise
- 5.2.3 OPPORTUNITIES
- 5.2.3.1 Integration of MES with enterprise resource planning and product lifecycle management solutions
- 5.2.3.2 Rising shift from on-premises to cloud-based SCADA systems
- 5.2.3.3 Increasing adoption of cloud services to store and analyze metrological data
- 5.2.4 CHALLENGES
- 5.2.4.1 Susceptibility to cyberattacks
- 5.2.4.2 High operational costs of 3D metrology systems
- 5.2.1 DRIVERS
- 5.3 SUPPLY CHAIN ANALYSIS
- 5.4 ECOSYSTEM ANALYSIS
- 5.5 INVESTMENT AND FUNDING SCENARIO
- 5.6 PRICING ANALYSIS
- 5.6.1 INDICATIVE LICENSE/SUBSCRIPTION COST OF KEY PLAYERS
- 5.6.2 INDICATIVE LICENSE/SUBSCRIPTION COST, BY REGION
- 5.7 TRENDS/DISRUPTIONS IMPACTING CUSTOMERS' BUSINESSES
- 5.8 TECHNOLOGY ANALYSIS
- 5.8.1 KEY TECHNOLOGIES
- 5.8.1.1 IoT
- 5.8.1.2 Cloud computing
- 5.8.1.3 AI
- 5.8.1.4 Next-generation SCADA
- 5.8.2 COMPLEMENTARY TECHNOLOGIES
- 5.8.2.1 5G
- 5.8.3 ADJACENT TECHNOLOGIES
- 5.8.3.1 Next-generation HMI
- 5.8.1 KEY TECHNOLOGIES
- 5.9 PORTER'S FIVE FORCES ANALYSIS
- 5.9.1 BARGAINING POWER OF SUPPLIERS
- 5.9.2 BARGAINING POWER OF BUYERS
- 5.9.3 THREAT OF NEW ENTRANTS
- 5.9.4 THREAT OF SUBSTITUTES
- 5.9.5 INTENSITY OF COMPETITIVE RIVALRY
- 5.10 KEY STAKEHOLDERS AND BUYING CRITERIA
- 5.10.1 KEY STAKEHOLDERS IN BUYING PROCESS
- 5.10.2 BUYING CRITERIA
- 5.11 CASE STUDY ANALYSIS
- 5.11.1 ELMWOOD RECLAIMED TIMBER ADOPTED SIEMENS' APS SOLUTION TO IMPROVE DELIVERY TIMELINESS AND ELIMINATE MANUAL SCHEDULING ISSUES
- 5.11.2 PHARMA COMPANY DEPLOYED SIEMENS' MES OPCENTER EXECUTION DEVICE FOR AUTOMATED AND PAPERLESS MANUFACTURING
- 5.11.3 SAFRAN CERAMICS INSTALLED INFODREAM'S MES SOFTWARE TO MONITOR AND DIGITALIZE PRODUCTION PROCESSES
- 5.11.4 LONZA ACHIEVED COMPLIANCE WITH FDA REGULATIONS AND REDUCED DATA ENTRY ERRORS WITH ROCKWELL AUTOMATION'S FACTORYTALK PHARMASUITE
- 5.11.5 MADTREE BREWING AND THERMALTECH ENGINEERING CHOSE INDUCTIVE AUTOMATION'S IGNITION TO IMPROVE PRODUCTION AND ANALYSIS
- 5.11.6 OVARRO OFFERED EMS STREAM WEBSCADA PLATFORM TO PROVIDE REAL-TIME INSIGHTS INTO MANUFACTURING PROCESSES
- 5.12 TRADE ANALYSIS
- 5.12.1 IMPORT DATA (HS CODE 903289)
- 5.12.2 EXPORT DATA (HS CODE 903289)
- 5.13 PATENT ANALYSIS
- 5.14 KEY CONFERENCES AND EVENTS, 2024-2025
- 5.15 REGULATORY LANDSCAPE
- 5.15.1 REGULATORY BODIES, GOVERNMENT AGENCIES, AND OTHER ORGANIZATIONS
- 5.15.2 MAJOR STANDARDS RELATED TO INDUSTRIAL SOFTWARE MARKET
- 5.15.3 REGULATIONS
6 EMERGING TRENDS IN INDUSTRIAL SOFTWARE MARKET
- 6.1 LATEST TRENDS IN INDUSTRIAL SOFTWARE MARKET
- 6.1.1 IIOT
- 6.1.2 AI AND ML
- 6.1.3 DIGITAL TWINS
- 6.1.4 CLOUD COMPUTING
- 6.1.5 EDGE COMPUTING
- 6.1.6 CYBERSECURITY
- 6.1.7 SUSTAINABILITY AND GREEN MANUFACTURING
- 6.1.8 ADVANCED ROBOTICS AND AUTOMATION
- 6.1.9 5G CONNECTIVITY
- 6.1.10 BIG DATA ANALYTICS
- 6.1.11 USER-FRIENDLY INTERFACES AND CUSTOMIZATION
- 6.1.12 BLOCKCHAIN
7 INDUSTRIAL SOFTWARE MARKET, BY TECHNOLOGY
- 7.1 INTRODUCTION
- 7.2 MES
- 7.2.1 BY DEPLOYMENT
- 7.2.1.1 On-premises
- 7.2.1.1.1 Security concerns to boost deployment
- 7.2.1.2 On-demand
- 7.2.1.2.1 Reduced need for manual labor in IT departments to drive market
- 7.2.1.3 Hybrid
- 7.2.1.3.1 Ability to provide scalability, agility, and flexibility to business processes to foster segmental growth
- 7.2.1.1 On-premises
- 7.2.1 BY DEPLOYMENT
- 7.3 SCADA
- 7.3.1 INCREASING NEED TO MANAGE CONFIDENTIAL DATA TO BOOST DEMAND
- 7.4 HMI
- 7.4.1 BY DEPLOYMENT
- 7.4.1.1 On-premises
- 7.4.1.1.1 Growing demand for low latency and robust data security to drive market
- 7.4.1.2 Cloud-based
- 7.4.1.2.1 Ability to provide virtual accessibility in remote monitoring to spur demand
- 7.4.1.1 On-premises
- 7.4.1 BY DEPLOYMENT
- 7.5 AI IN MANUFACTURING
- 7.5.1 AI SOLUTIONS
- 7.5.1.1 By deployment
- 7.5.1.1.1 On-premises
- 7.5.1.1.1.1 Increasing focus on developing new cloud business models for NLP and ML tools to drive market
- 7.5.1.1.2 Cloud-based
- 7.5.1.1.2.1 Integration of NLP and ML tools with AI to drive market
- 7.5.1.1.1 On-premises
- 7.5.1.1 By deployment
- 7.5.2 AI PLATFORMS
- 7.5.2.1 By platform type
- 7.5.2.1.1 Machine learning framework
- 7.5.2.1.1.1 Increasing collaborations among established players to offer lucrative growth opportunities
- 7.5.2.1.2 API
- 7.5.2.1.2.1 Ease of developing program with building blocks to boost demand
- 7.5.2.1.1 Machine learning framework
- 7.5.2.1 By platform type
- 7.5.1 AI SOLUTIONS
- 7.6 ROBOTIC SOFTWARE
- 7.6.1 BY TYPE
- 7.6.1.1 Simulation
- 7.6.1.1.1 Ability to offer virtual modeling, testing, and visualization of robotic systems to drive market
- 7.6.1.2 Predictive maintenance
- 7.6.1.2.1 Growing incorporation into robot software to prevent position deviation to boost demand
- 7.6.1.3 Communication management
- 7.6.1.3.1 Presence of centralized platform to control, monitor, and perform complex tasks effectively to spur demand
- 7.6.1.4 Data management and analysis
- 7.6.1.4.1 Increasing demand for multi-language support and data security to drive market
- 7.6.1.5 Recognition
- 7.6.1.5.1 Pressing need to address language- and dialog-related challenges to accelerate demand
- 7.6.1.1 Simulation
- 7.6.1 BY TYPE
- 7.7 FAULT DETECTION AND CLASSIFICATION
- 7.7.1 RISING CRITICALITY OF INFRASTRUCTURE SYSTEMS TO FOSTER SEGMENTAL GROWTH
- 7.8 INDUSTRIAL METROLOGY
- 7.8.1 ABILITY TO FACILITATE REAL-TIME COLLABORATION AMONG MULTIPLE USERS TO DRIVE DEMAND
8 INDUSTRIAL SOFTWARE MARKET, BY END-USER INDUSTRY
- 8.1 INTRODUCTION
- 8.2 PROCESS INDUSTRIES
- 8.2.1 FOOD & BEVERAGES
- 8.2.1.1 Growing demand for processed food among expanding population to boost demand
- 8.2.2 OIL & GAS
- 8.2.2.1 Improved decision-making through comprehensive data insights to accelerate demand
- 8.2.3 CHEMICAL
- 8.2.3.1 Rising reliance of chemical manufacturers on automated solutions to fuel market growth
- 8.2.4 PHARMACEUTICALS
- 8.2.4.1 Pressing need for infection-free environment to drive market
- 8.2.5 ENERGY & POWER
- 8.2.5.1 Growing industrialization to spur demand
- 8.2.6 WATER & WASTEWATER TREATMENT
- 8.2.6.1 Increasing need to tackle sewage and wastewater challenges to foster segmental growth
- 8.2.7 OTHER PROCESS INDUSTRIES
- 8.2.1 FOOD & BEVERAGES
- 8.3 DISCRETE INDUSTRIES
- 8.3.1 AUTOMOTIVE
- 8.3.1.1 Ability to identify manufacturing and maintenance issues to drive demand
- 8.3.2 AEROSPACE
- 8.3.2.1 Increasing focus on improving product quality and shortening production cycle to fuel market growth
- 8.3.3 ELECTRONICS & SEMICONDUCTORS
- 8.3.3.1 Rising data volume from manufacturing value chain to accelerate demand
- 8.3.4 OTHER DISCRETE INDUSTRIES
- 8.3.1 AUTOMOTIVE
9 INDUSTRIAL SOFTWARE MARKET, BY REGION
- 9.1 INTRODUCTION
- 9.2 NORTH AMERICA
- 9.2.1 RECESSION IMPACT ON INDUSTRIAL SOFTWARE MARKET IN NORTH AMERICA
- 9.2.2 US
- 9.2.2.1 Government-led initiatives to develop manufacturing technologies to boost demand
- 9.2.3 CANADA
- 9.2.3.1 Increasing adoption of SCADA, AI, and IIoT in manufacturing sector to drive demand
- 9.2.4 MEXICO
- 9.2.4.1 Thriving manufacturing sector to fuel market growth
- 9.3 EUROPE
- 9.3.1 RECESSION IMPACT ON INDUSTRIAL SOFTWARE MARKET IN EUROPE
- 9.3.2 UK
- 9.3.2.1 Growing number of startups and SMEs to offer lucrative growth opportunities
- 9.3.3 GERMANY
- 9.3.3.1 Rising demand for remote monitoring in automobile companies to drive market
- 9.3.4 FRANCE
- 9.3.4.1 Increasing emphasis on modernizing production systems and developing advanced production processes to spur demand
- 9.3.5 REST OF EUROPE
- 9.4 ASIA PACIFIC
- 9.4.1 RECESSION IMPACT ON INDUSTRIAL SOFTWARE MARKET IN ASIA PACIFIC
- 9.4.2 CHINA
- 9.4.2.1 Government-led initiatives to develop IIoT capabilities in semiconductor and manufacturing sectors to accelerate demand
- 9.4.3 JAPAN
- 9.4.3.1 Introduction of Society 5.0 to offer lucrative growth opportunities
- 9.4.4 SOUTH KOREA
- 9.4.4.1 Thriving manufacturing sector to drive market
- 9.4.5 REST OF ASIA PACIFIC
- 9.5 ROW
- 9.5.1 RECESSION IMPACT ON INDUSTRIAL SOFTWARE MARKET IN ROW
- 9.5.2 SOUTH AMERICA
- 9.5.2.1 Growing adoption of IoT-based devices in manufacturing sector to foster market growth
- 9.5.3 MIDDLE EAST & AFRICA
- 9.5.3.1 Rising focus of oil & gas companies on improving productivity and reducing waste to spike demand
- 9.5.3.2 GCC
- 9.5.3.3 Africa & Rest of Middle East
10 COMPETITIVE LANDSCAPE
- 10.1 OVERVIEW
- 10.2 KEY PLAYER STRATEGIES/RIGHT TO WIN, 2019-2024
- 10.3 MARKET SHARE ANALYSIS, 2023
- 10.4 REVENUE ANALYSIS, 2019-2023
- 10.5 COMPANY VALUATION AND FINANCIAL METRICS
- 10.6 BRAND/PRODUCT COMPARISON
- 10.7 COMPANY EVALUATION MATRIX: KEY PLAYERS, 2023
- 10.7.1 STARS
- 10.7.2 EMERGING LEADERS
- 10.7.3 PERVASIVE PLAYERS
- 10.7.4 PARTICIPANTS
- 10.7.5 COMPANY FOOTPRINT: KEY PLAYERS, 2023
- 10.7.5.1 Company footprint
- 10.7.5.2 Deployment footprint
- 10.7.5.3 End-user industry footprint
- 10.7.5.4 Region footprint
- 10.8 COMPANY EVALUATION MATRIX: STARTUPS/SMES, 2023
- 10.8.1 PROGRESSIVE COMPANIES
- 10.8.2 RESPONSIVE COMPANIES
- 10.8.3 DYNAMIC COMPANIES
- 10.8.4 STARTING BLOCKS
- 10.8.5 COMPETITIVE BENCHMARKING: STARTUPS/SMES, 2023
- 10.8.5.1 Detailed list of key startups/SMEs
- 10.8.5.2 Competitive benchmarking of key startups/SMEs
- 10.9 COMPETITIVE SCENARIO AND TRENDS
- 10.9.1 PRODUCT LAUNCHES/DEVELOPMENTS
- 10.9.2 DEALS
- 10.9.3 OTHERS
11 COMPANY PROFILES
- 11.1 KEY PLAYERS
- 11.1.1 SIEMENS
- 11.1.1.1 Business overview
- 11.1.1.2 Products/Solutions/Services offered
- 11.1.1.3 Recent developments
- 11.1.1.3.1 Product launches/Developments
- 11.1.1.3.2 Deals
- 11.1.1.4 MnM view
- 11.1.1.4.1 Key strengths/Right to win
- 11.1.1.4.2 Strategic choices
- 11.1.1.4.3 Weaknesses/Competitive threats
- 11.1.2 SAP
- 11.1.2.1 Business overview
- 11.1.2.2 Products/Solutions/Services offered
- 11.1.2.3 Recent developments
- 11.1.2.3.1 Deals
- 11.1.2.4 MnM view
- 11.1.2.4.1 Key strengths/Right to win
- 11.1.2.4.2 Strategic choices
- 11.1.2.4.3 Weaknesses/Competitive threats
- 11.1.3 ROCKWELL AUTOMATION
- 11.1.3.1 Business overview
- 11.1.3.2 Products/Solutions/Services offered
- 11.1.3.3 Recent developments
- 11.1.3.3.1 Product launches/Developments
- 11.1.3.3.2 Deals
- 11.1.3.3.3 Others
- 11.1.3.4 MnM view
- 11.1.3.4.1 Key strengths/Right to win
- 11.1.3.4.2 Strategic choices
- 11.1.3.4.3 Weaknesses/Competitive threats
- 11.1.4 HONEYWELL INTERNATIONAL INC.
- 11.1.4.1 Business overview
- 11.1.4.2 Products/Solutions/Services offered
- 11.1.4.3 Recent developments
- 11.1.4.3.1 Deals
- 11.1.4.4 MnM view
- 11.1.4.4.1 Key strengths/Right to win
- 11.1.4.4.2 Strategic choices
- 11.1.4.4.3 Weaknesses/Competitive threats
- 11.1.5 ABB
- 11.1.5.1 Business overview
- 11.1.5.2 Products/Solutions/Services offered
- 11.1.5.3 Recent developments
- 11.1.5.3.1 Product launches/Developments
- 11.1.5.3.2 Deals
- 11.1.5.4 MnM view
- 11.1.5.4.1 Key strengths/Right to win
- 11.1.5.4.2 Strategic choices
- 11.1.5.4.3 Weaknesses/Competitive threats
- 11.1.6 GENERAL ELECTRIC COMPANY
- 11.1.6.1 Business overview
- 11.1.6.2 Products/Solutions/Services offered
- 11.1.6.3 Recent developments
- 11.1.6.3.1 Product launches/Developments
- 11.1.6.3.2 Deals
- 11.1.7 OMRON CORPORATION
- 11.1.7.1 Business overview
- 11.1.7.2 Products/Solutions/Services offered
- 11.1.7.3 Recent developments
- 11.1.7.3.1 Product launches/Developments
- 11.1.7.3.2 Deals
- 11.1.8 ORACLE
- 11.1.8.1 Business overview
- 11.1.8.2 Products/Solutions/Services offered
- 11.1.9 MITSUBISHI ELECTRIC CORPORATION
- 11.1.9.1 Business overview
- 11.1.9.2 Products/Solutions/Services offered
- 11.1.9.3 Recent developments
- 11.1.9.3.1 Product launches/Developments
- 11.1.9.3.2 Deals
- 11.1.10 HEXAGON AB
- 11.1.10.1 Business overview
- 11.1.10.2 Products/Solutions/Services offered
- 11.1.10.3 Recent developments
- 11.1.10.3.1 Product launches/Developments
- 11.1.10.3.2 Deals
- 11.1.1 SIEMENS
- 11.2 OTHER PLAYERS
- 11.2.1 42Q
- 11.2.2 DASSAULT SYSTEMES
- 11.2.3 RENISHAW PLC
- 11.2.4 NIKON CORPORATION
- 11.2.5 EPICOR SOFTWARE CORPORATION
- 11.2.6 YOKOGAWA ELECTRIC CORPORATION
- 11.2.7 APPLIED MATERIALS, INC.
- 11.2.8 SPARKCOGNITION
- 11.2.9 AIBRAIN INC.
- 11.2.10 COGNEX CORPORATION
- 11.2.11 EMERSON ELECTRIC CO.
- 11.2.12 MICROSOFT
- 11.2.13 TELEDYNE TECHNOLOGIES INCORPORATED
- 11.2.14 SCHNEIDER ELECTRIC
- 11.2.15 GOOGLE
12 APPENDIX
- 12.1 INSIGHTS FROM INDUSTRY EXPERTS
- 12.2 DISCUSSION GUIDE
- 12.3 KNOWLEDGESTORE: MARKETSANDMARKETS' SUBSCRIPTION PORTAL
- 12.4 CUSTOMIZATION OPTIONS
- 12.5 RELATED REPORTS
- 12.6 AUTHOR DETAILS
