|
|
市場調査レポート
商品コード
1348061
組み込みセキュリティの世界市場:オファリング別、セキュリティタイプ別、用途別、地域別-2028年までの予測Embedded Security Market by Offering (Hardware (Secure Element, Embedded Sim, Hardware Token), Software, Services), Security Type (Authentication and Access Management, Payment, Content Protection), Application and Region - Global Forecast to 2028 |
||||||
|
|
|||||||
カスタマイズ可能
|
|||||||


| 組み込みセキュリティの世界市場:オファリング別、セキュリティタイプ別、用途別、地域別-2028年までの予測 |
|
出版日: 2023年08月28日
発行: MarketsandMarkets
ページ情報: 英文 269 Pages
納期: 即納可能
|

- 全表示
- 概要
- 目次
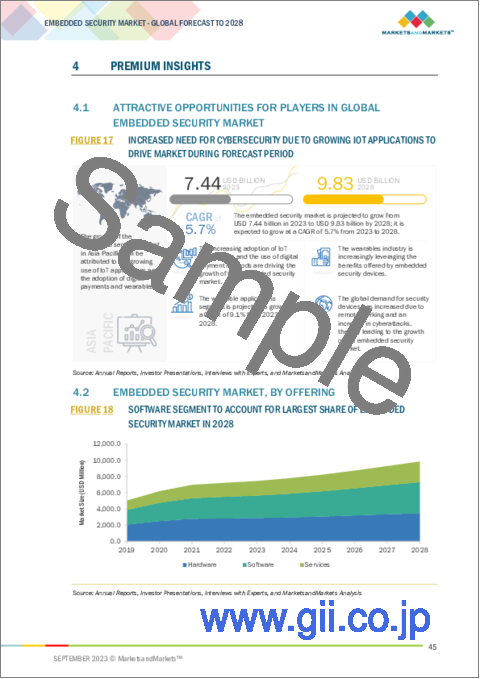
組み込みセキュリティの市場規模は、2023年に74億米ドルと推計されており、2023年~2028年にかけて5.7%のCAGRで拡大すると予測されています。
同市場は、2028年には98億米ドルに達するとみられています。さまざまな用途でIoTの導入が進んでいることが、組み込みセキュリティ市場を拡大する重要なきっかけとなっています。より多くのデバイスがオンラインで相互接続されるようになり、サイバー脅威の影響を受けやすくなっています。組み込みセキュリテ・ハードウェアは、これらのデバイスを潜在的な攻撃から守る盾の役割を果たします。同様に、ジェネレーティブAIの受け入れが増加していることも、組み込みセキュリティ市場を促進する上で極めて重要な役割を果たしています。ジェネレーティブAIは、画像、動画、音声のような欺瞞的なコンテンツを捏造するために利用され、組み込み機器に対して武器化することができます。組み込みセキュリティハードウェアは、こうした有害な攻撃を特定し阻止するための重要な防御メカニズムとして浮上しています。
スマートフォンにおける組込みセキュリティシステムの需要が高まっている背景には、接続性の向上、個人データの保護と安全なモバイル決済の必要性、悪意のあるソフトウェアに対するアプリのセキュリティ、IoTの統合、生体認証、企業利用、規制遵守、デバイスの盗難防止、サイバーセキュリティに対するユーザーの意識の高まり、進化する脅威状況、市場競争などの要因があり、これらすべてが機密情報を保護し、デバイスの完全性を確保することの重要性を強調しています。
セキュアエレメントとトラステッドプラットフォームモジュールハードウェアコンポーネントは、予測期間中、組み込みセキュリティ市場のハードウェアセグメント全体で大きな市場シェアを占める可能性が高いです。セキュアエレメントとは、規則やセキュリティ要件に従って、アプリケーションやその機密データ、暗号データを安全にホストできる耐改ざん性のあるプラットフォームのことです。付加価値サービス(VAS)の展開には、セキュアエレメントの存在が不可欠です。認証、署名、識別、暗証番号管理はすべて、VASの展開の中心であり、したがって、すべて安全な運用のために保護された環境を必要とします。トラステッド・プラットフォームモジュール(TPM)は、スマートカードベースのセキュリティ・コントローラの特殊なタイプです。ノートパソコン、タブレット、携帯電話といったデバイスの利用が世界的に拡大していることが、トラステッドプラットフォームモジュールの需要を後押ししています。この業界では、クラウドコンピューティングにおけるトラステッドプラットフォームモジュールの需要の高まりにより、需要が増加しています。
組込みセキュリティ製品における中国の優位性は、いくつかの重要な要因によるものです。これには、組み込みセキュリティハードウェアのような電子部品のコスト効率に優れた生産を可能にする強力な製造能力、セキュリティソリューションへの技術革新と投資を促進する充実した国内市場需要などが含まれます。技術やサイバーセキュリティ分野に対する政策やインセンティブを通じた政府の後押しが、中国の組み込みセキュリティ企業の成長をさらに後押ししています。特に5G、IoT、AIなどの分野における中国の急速な技術進歩は、組み込みセキュリティと密接に絡み合い、世界のリーダーシップを強化しています。中国が世界の技術的優位を目指す中、研究開発、イノベーションにリソースを振り向け、最先端の組込みセキュリティソリューションを生み出す能力を強化しています。
当レポートでは、世界の組み込みセキュリティ市場について調査し、製品別、セキュリティタイプ別、用途別、地域別動向、および市場に参入する企業のプロファイルなどをまとめています。
目次
第1章 イントロダクション
第2章 調査手法
第3章 エグゼクティブサマリー
第4章 重要考察
第5章 市場概要
- イントロダクション
- 市場力学
- バリューチェーン分析
- 生態系マッピング
- 収益の変化と組み込みセキュリティ市場プレーヤーの新たな収益源
- 技術動向
- 価格分析
- ポーターのファイブフォース分析
- ケーススタディ分析
- 貿易分析
- 特許分析
- 主要な利害関係者と購入基準
- 2023年~2024年の主要な会議とイベント
- 関税と規制状況
第6章 組み込みセキュリティ市場、セキュリティタイプ別
- イントロダクション
- 認証とアクセス管理
- 決済
- コンテンツの保護
第7章 組み込みセキュリティ市場、オファリング別
- イントロダクション
- ハードウェア
- ソフトウェア
- サービス
第8章 組み込みセキュリティ市場、用途別
- イントロダクション
- ウェアラブル
- スマートフォン
- 自動車
- スマートIDカード
- 産業用
- 決済処理とカード
- その他
第9章 組み込みセキュリティ市場、地域別
- イントロダクション
- 北米
- 欧州
- アジア太平洋
- その他の地域
第10章 競合情勢
- イントロダクション
- 主要参入企業が採用した戦略、2020年~2023年
- 主要企業の収益分析、2018年~2022年
- 市場シェア分析、2022年
- 主要企業評価マトリックス、2022年
- 主要企業の競合ベンチマーキング
- 中小企業(SMES)/スタートアップ評価マトリックス、2022年
- 競争シナリオと動向
- スタートアップ/中小企業の競合ベンチマーキング
第11章 企業プロファイル
- イントロダクション
- 主要参入企業
- INFINEON TECHNOLOGIES AG
- STMICROELECTRONICS
- NXP SEMICONDUCTORS
- TEXAS INSTRUMENTS INCORPORATED
- QUALCOMM TECHNOLOGIES, INC.
- RENESAS ELECTRONICS CORPORATION
- THALES
- MICROCHIP TECHNOLOGY INC.
- SAMSUNG
- IDEMIA
- ICTK CO., LTD.
- その他の企業
- RAMBUS INC.
- CISCO SYSTEMS, INC.
- ETAS
- OVD KINEGRAM AG
- BAE SYSTEMS
- LANTRONIX, INC.
- IBM
- SWIFT
- MCAFEE, LLC
- BROADCOM
- HITEX GMBH
- ANALOG DEVICES, INC
- ADVANTECH CO., LTD.
- ETA COMPUTE
- RUNSAFE SECURITY
第12章 付録
The embedded security market size has been estimated to be valued at USD 7.4 Billion in 2023 and is projected to reach USD 9.8 Billion by 2028; growing at a CAGR of 5.7% from 2023 to 2028. The growing implementation of IoT in various applications is a significant catalyst for expanding the embedded security market. With a higher number of devices becoming interconnected online, they become susceptible to cyber threats. Embedded security hardware serves as a shield to safeguard these devices from potential attacks. Similarly, the rising acceptance of generative AI plays a pivotal role in driving the embedded security market. Generative AI is harnessed to fabricate deceptive content like images, videos, and audio, which can be weaponized against embedded devices. Embedded security hardware emerges as a crucial defense mechanism to identify and thwart these detrimental attacks.
Based on application, the smartphone segment likely to account for the second largest share in the embedded security market during the forecast period
The higher demand for embedded security systems in smartphones is driven by factors including increased connectivity, the need to protect personal data and facilitate secure mobile payments, app security against malicious software, IoT integration, biometric authentication, corporate use, regulatory compliance, device theft protection, growing user awareness of cybersecurity, the evolving threat landscape, and market competition, all of which emphasize the importance of safeguarding sensitive information and ensuring device integrity.
Secure element, and trusted platform modules hardware components to account for the largest market share between 2023 and 2028
Secure elements, and trusted platform modules hardware components likely to account for a significant market share in the overall hardware segment of the embedded security market during the forecast period. A secure element is a tamper-resistant platform capable of securely hosting applications and their confidential and cryptographic data in accordance with the rules and security requirements. The presence of a secure element is essential to the deployment of value-added services (VAS). Authentication, signatures, identification, and PIN management are all central to the deployment of VAS, and therefore, all require a protected environment for secure operations. Trusted platform modules (TPMs) are a special type of smart card-based security controller. The security functionality of TPMs is defined by the Trusted Computing Group (TCG) standardization body. TPMs are widely used in computers, automotive, and industries. In automotive, almost all functions in a vehicle are managed by an electronic control unit (ECU). However, these minicomputers are being hacked increasingly. The growing use of devices such as laptops, tablets, and mobile phones worldwide is driving demand for trusted platform modules. This industry is experiencing increased demand due to the growing demand for trusted platform modules in cloud computing.
China likely to dominate the embedded security market in Asia Pacific by 2028
China's supremacy in embedded security products can be credited to several key factors. These include its strong manufacturing capabilities, enabling cost-effective production of electronic components like embedded security hardware, and its substantial domestic market demand, which fuels innovation and investment in security solutions. Government backing through policies and incentives for the tech and cybersecurity sectors further propels the growth of Chinese embedded security firms. The country's rapid technological strides, particularly in fields like 5G, IoT, and AI, intersect closely with embedded security, bolstering its global leadership. As China strives for global tech preeminence, it directs resources towards research, development, and innovation, fortifying its ability to produce cutting-edge embedded security solutions.
The breakup of primaries conducted during the study is depicted below:
- By Company Type: Tier 1 - 20 %, Tier 2 - 55%, and Tier 3 -25%
- By Designation: C-Level Executives - 50%, Directors - 25%, and Others - 25%
- By Region: North America- 60%, Europe - 20%, APAC - 10%, Rest of world- 10%
Research Coverage
The report segments the embedded security market based on region (North America, Europe, Asia Pacific, and RoW), application (wearables, smartphones, automotive, smart identity cards, industrial, payment processing, and card and others), security type (authentication and access management, payment, content protection), and offering (hardware, software, and services ). The report comprehensively reviews market drivers, restraints, opportunities, and challenges in the embedded security market. The report also consists of leadership mapping and analysis of all the companies in the embedded security ecosystem. Additionally, the report covers the impact of the recession on the global embedded security ecosystem and on different regions.
Key Benefits of Buying This Report
- The report will help market leaders/new entrants with information on the closest approximations of the revenue numbers for the overall embedded security market and the subsegments. This report will help stakeholders understand the competitive landscape and gain more insights to position their businesses better and plan suitable go-to-market strategies. The report also helps stakeholders understand the market pulse and provides information on key market drivers, restraints, challenges, and opportunities.
- Analysis of key drivers (growing IoT applications would increase need for embedded security, inclusion of payments functionality in wearables, growing adoption of generative AI in various applications, government agencies promoting digitization, increase in data breaches and cyberattacks, increased demand for embedded security in electric and hybrid vehicles, intensifying need to secure digital crypto-based transactions), restraints (non-adherence to government regulations due to lack of auditing, susceptibility of embedded systems to cyber-threats and security breaches, costs associated with hardware security modules, strong inclination of customers toward adoption of hardware security modules on rental basis), opportunities (integration of embedded security in electric vehicles, need for integrated security solutions for IoT paired with advent of smart cities, growing adoption of embedded systems in healthcare systems, introduction of 5G and development of 5G-enabled embedded devices), and challenges ( lack of awareness regarding safety and low-security budget, high energy consumption associated with compact embedded systems, complexities involved in designing embedded systems, shortage in supply of semiconductors) influencing the growth of the embedded security market.
- Product Development/Innovation: Detailed insights on upcoming technologies, research & development activities, and new product & service launches in the embedded security market.
- Market Development: Comprehensive information about lucrative markets - the report analyses the embedded security market across varied regions.
- Market Diversification: Exhaustive information about new products & services, untapped geographies, recent developments, and investments in the embedded security market.
- Competitive Assessment: In-depth assessment of market shares, growth strategies and service offerings of leading players like Infineon Technologies AG (Germany), STMicroelectronics (Switzerland ), NXP Semiconductor (Netherlands), Texas Instruments Incorporated (US), Qualcomm Technologies, Inc. (US), Renesas Electronics Corporation (Japan), Thales (France), Microchip Technology Inc. (US), Samsung (South Korea), and IDEMIA (France) among others in the embedded security market strategies.
TABLE OF CONTENTS
1 INTRODUCTION
- 1.1 STUDY OBJECTIVES
- 1.2 MARKET DEFINITION
- 1.2.1 INCLUSIONS AND EXCLUSIONS
- 1.3 STUDY SCOPE
- 1.3.1 MARKETS COVERED
- FIGURE 1 EMBEDDED SECURITY MARKET SEGMENTATION
- 1.3.2 REGIONAL SCOPE
- 1.3.3 YEARS CONSIDERED
- 1.4 CURRENCY CONSIDERED
- 1.5 LIMITATIONS
- 1.6 STAKEHOLDERS
- 1.7 SUMMARY OF CHANGES
- 1.7.1 RECESSION IMPACT ON EMBEDDED SECURITY MARKET
2 RESEARCH METHODOLOGY
- 2.1 RESEARCH DATA
- FIGURE 2 EMBEDDED SECURITY MARKET: RESEARCH DESIGN
- 2.1.1 SECONDARY AND PRIMARY RESEARCH
- 2.1.2 SECONDARY DATA
- 2.1.2.1 List of major secondary sources
- 2.1.2.2 Secondary sources
- 2.1.3 PRIMARY DATA
- 2.1.3.1 Primary interviews with experts
- 2.1.3.2 Primary sources
- 2.1.3.3 Key industry insights
- 2.1.3.4 Breakdown of primaries
- 2.2 MARKET SIZE ESTIMATION
- FIGURE 3 EMBEDDED SECURITY MARKET: PROCESS FLOW OF MARKET SIZE ESTIMATION
- FIGURE 4 MARKET SIZE ESTIMATION METHODOLOGY: APPROACH
(SUPPLY SIDE, BY OFFERING)
- FIGURE 5 MARKET SIZE ESTIMATION METHODOLOGY: APPROACH
(SUPPLY SIDE, BY KEY PLAYERS)
- FIGURE 6 MARKET SIZE ESTIMATION METHODOLOGY: APPROACH
(DEMAND SIDE-BOTTOM-UP ANALYSIS, BY APPLICATION)
- 2.2.1 BOTTOM-UP APPROACH
- 2.2.1.1 Approach to estimate market size using bottom-up analysis (demand side)
- FIGURE 7 MARKET SIZE ESTIMATION METHODOLOGY: BOTTOM-UP APPROACH
- 2.2.2 TOP-DOWN APPROACH
- 2.2.2.1 Approach to estimate market size using top-down analysis (supply side)
- FIGURE 8 MARKET SIZE ESTIMATION METHODOLOGY: TOP-DOWN APPROACH
- 2.3 MARKET BREAKDOWN AND DATA TRIANGULATION
- FIGURE 9 DATA TRIANGULATION
- 2.4 RISK ASSESSMENT
- TABLE 1 EMBEDDED SECURITY MARKET: RISK ASSESSMENT
- 2.5 RESEARCH ASSUMPTIONS
- FIGURE 10 EMBEDDED SECURITY MARKET: RESEARCH ASSUMPTIONS
- 2.6 LIMITATIONS
- FIGURE 11 EMBEDDED SECURITY MARKET: LIMITATIONS
- 2.7 IMPACT OF RECESSION ON EMBEDDED SECURITY MARKET
3 EXECUTIVE SUMMARY
- FIGURE 12 EMBEDDED SECURITY MARKET, 2019-2028 (USD MILLION)
- FIGURE 13 PAYMENTS SEGMENT TO ACCOUNT FOR LARGEST SHARE OF EMBEDDED SECURITY MARKET IN 2028
- FIGURE 14 SMART IDENTITY CARDS SEGMENT TO LEAD EMBEDDED SECURITY MARKET FROM 2023 TO 2028
- FIGURE 15 SERVICES SEGMENT TO REGISTER HIGHEST CAGR DURING FORECAST PERIOD
- FIGURE 16 ASIA PACIFIC TO BE FASTEST-GROWING EMBEDDED SECURITY MARKET DURING FORECAST PERIOD
4 PREMIUM INSIGHTS
- 4.1 ATTRACTIVE OPPORTUNITIES FOR PLAYERS IN GLOBAL EMBEDDED SECURITY MARKET
- FIGURE 17 INCREASED NEED FOR CYBERSECURITY DUE TO GROWING IOT APPLICATIONS TO DRIVE MARKET DURING FORECAST PERIOD
- 4.2 EMBEDDED SECURITY MARKET, BY OFFERING
- FIGURE 18 SOFTWARE SEGMENT TO ACCOUNT FOR LARGEST SHARE OF EMBEDDED SECURITY MARKET IN 2028
- 4.3 EMBEDDED SECURITY MARKET, BY SECURITY TYPE
- FIGURE 19 PAYMENTS SEGMENT TO HOLD LARGEST SHARE OF EMBEDDED SECURITY MARKET IN 2028
- 4.4 EMBEDDED SECURITY MARKET, BY APPLICATION
- FIGURE 20 SMART IDENTITY CARDS SEGMENT TO DOMINATE MARKET DURING FORECAST PERIOD
- 4.5 EMBEDDED SECURITY MARKET, BY REGION
- FIGURE 21 ASIA PACIFIC TO LEAD EMBEDDED SECURITY MARKET DURING FORECAST PERIOD
5 MARKET OVERVIEW
- 5.1 INTRODUCTION
- 5.2 MARKET DYNAMICS
- FIGURE 22 EMBEDDED SECURITY MARKET: DRIVERS, RESTRAINTS, OPPORTUNITIES AND CHALLENGES
- 5.2.1 DRIVERS
- 5.2.1.1 Growing IoT applications
- 5.2.1.2 Inclusion of payments functionality in wearables
- 5.2.1.3 Growing adoption of generative AI in various applications
- 5.2.1.4 Digitalization initiatives by governments worldwide
- 5.2.1.5 Increase in data breaches and cyberattacks
- 5.2.1.6 Rising demand for robust security solutions for electric and hybrid vehicles
- 5.2.1.7 Need for more secure crypto-based transactions
- 5.2.2 RESTRAINTS
- 5.2.2.1 Non-compliance with government regulations due to lack of auditing
- 5.2.2.2 Susceptibility of embedded systems to cyberthreats and security breaches
- 5.2.2.3 Inclination of customers toward renting hardware security modules
- 5.2.3 OPPORTUNITIES
- 5.2.3.1 Integration of embedded security in electric vehicles
- 5.2.3.2 Growing importance of IoT security in development of smart cities
- 5.2.3.3 Growing adoption of embedded security in healthcare systems
- 5.2.3.4 Emergence of 5G and advancements in 5G-enabled embedded devices
- 5.2.4 CHALLENGES
- 5.2.4.1 Lack of safety awareness regarding embedded systems and limited security budget
- 5.2.4.2 High energy consumption associated with compact embedded systems
- 5.2.4.3 Designing complexities associated with embedded systems
- 5.2.4.4 Shortage in supply of semiconductors
- 5.3 VALUE CHAIN ANALYSIS
- FIGURE 23 EMBEDDED SECURITY MARKET: VALUE CHAIN ANALYSIS
- 5.4 ECOSYSTEM MAPPING
- TABLE 2 PARTICIPANTS AND THEIR ROLE IN ECOSYSTEM
- FIGURE 24 PARTICIPANTS IN EMBEDDED SECURITY ECOSYSTEM
- 5.5 REVENUE SHIFTS AND NEW REVENUE POCKETS FOR PLAYERS IN EMBEDDED SECURITY MARKET
- FIGURE 25 TRENDS AND DISRUPTIONS IMPACTING CUSTOMER BUSINESS
- 5.6 TECHNOLOGY TRENDS
- 5.6.1 GROWING EMPHASIS ON AUTOMOBILE SECURITY
- 5.6.2 INCREASING CONTACTLESS PAYMENT
- 5.6.3 RISING USE OF WEARABLES
- 5.6.4 INCREASING NUMBER OF IOT DEVICES
- 5.6.5 EMERGENCE OF 5G
- 5.7 PRICING ANALYSIS
- TABLE 3 INDICATIVE PRICING ANALYSIS OF EMBEDDED SECURITY HARDWARE COMPONENTS
- 5.8 PORTER'S FIVE FORCES ANALYSIS
- TABLE 4 EMBEDDED SECURITY MARKET: PORTER'S FIVE FORCES ANALYSIS, 2022
- FIGURE 26 EMBEDDED SECURITY MARKET: PORTER'S FIVE FORCES ANALYSIS
- FIGURE 27 EMBEDDED SECURITY MARKET: IMPACT ANALYSIS OF PORTER'S FIVE FORCES
- 5.8.1 BARGAINING POWER OF SUPPLIERS
- 5.8.2 BARGAINING POWER OF BUYERS
- 5.8.3 THREAT OF NEW ENTRANTS
- 5.8.4 THREAT OF SUBSTITUTES
- 5.8.5 INTENSITY OF COMPETITIVE RIVALRY
- 5.9 CASE STUDY ANALYSIS
- TABLE 5 EMBEDDED SECURITY STRENGTHENED DATA PROTECTION OF MEDICAL TESTING EQUIPMENT
- TABLE 6 GARUDA INDONESIA DEVELOPED CORPORATE MOBILITY MANAGEMENT SYSTEM TO WORK ON ELECTRONIC FLIGHT BAGS FOR PILOTS
- TABLE 7 US-BASED FINANCIAL SERVICES COMPANY CREATED PUBLIC KEY INFRASTRUCTURE INVENTORY USING VENAFI PLATFORM
- TABLE 8 KASPERSKY LAB AND BE.SERVICES GMBH DEVELOPED EMBEDDED SECURITY SHIELD TO SAFEGUARD INDUSTRIAL CONTROL SYSTEMS
- TABLE 9 HEALTHCARE ORGANIZATION PROTECTED EMPLOYEE SAFETY AND SECURITY WITH WASHABLE, RFID-EMBEDDED KEYBOARD
- 5.10 TRADE ANALYSIS
- 5.10.1 EXPORT SCENARIO FOR HS CODE 8471, BY COUNTRY, 2018-2022
- TABLE 10 EXPORT DATA FOR AUTOMATIC DATA PROCESSING MACHINES FOR HS CODE 8471, BY COUNTRY, 2018-2022 (USD BILLION)
- FIGURE 28 EXPORT SCENARIO FOR AUTOMATIC DATA PROCESSING MACHINES FOR HS CODE 8471, BY COUNTRY, 2018-2022 (USD BILLION)
- 5.10.2 IMPORT SCENARIO FOR HS CODE 8471, BY COUNTRY, 2018-2022
- TABLE 11 IMPORT DATA FOR AUTOMATIC DATA PROCESSING MACHINES FOR HS CODE 8471, BY COUNTRY, 2018-2022 (USD BILLION)
- FIGURE 29 IMPORT SCENARIO FOR AUTOMATIC DATA PROCESSING MACHINES FOR HS CODE 8471, BY COUNTRY, 2018-2022 (USD BILLION)
- 5.11 PATENT ANALYSIS
- FIGURE 30 NUMBER OF PATENTS GRANTED PER YEAR, 2013-2022
- TABLE 12 TOP 10 PATENT OWNERS IN EMBEDDED SECURITY MARKET
- FIGURE 31 TOP 10 COMPANIES WITH HIGHEST NUMBER OF PATENT APPLICATIONS IN LAST 10 YEARS
- 5.11.1 LIST OF MAJOR PATENTS, 2019-2023
- TABLE 13 EMBEDDED SECURITY MARKET: PATENT REGISTRATIONS, 2019-2023
- 5.12 KEY STAKEHOLDERS AND BUYING CRITERIA
- 5.12.1 KEY STAKEHOLDERS IN BUYING PROCESS
- FIGURE 32 INFLUENCE OF STAKEHOLDERS ON BUYING PROCESS, BY OFFERING
- TABLE 14 INFLUENCE OF STAKEHOLDERS ON BUYING PROCESS, BY OFFERING (%)
- 5.12.2 BUYING CRITERIA
- FIGURE 33 KEY BUYING CRITERIA FOR OFFERINGS
- TABLE 15 KEY BUYING CRITERIA, BY OFFERING
- 5.13 KEY CONFERENCES AND EVENTS, 2023-2024
- TABLE 16 EMBEDDED SECURITY MARKET: LIST OF CONFERENCES AND EVENTS
- 5.14 TARIFFS AND REGULATORY LANDSCAPE
- 5.14.1 TARIFFS
- 5.14.2 REGULATORY BODIES, GOVERNMENT AGENCIES, AND OTHER ORGANIZATIONS
- 5.14.2.1 North America
- 5.14.2.2 Europe
- 5.14.2.3 Asia Pacific
- 5.14.2.4 RoW
- 5.14.3 STANDARDS
- TABLE 17 BASE STANDARDS FOR INFORMATION SECURITY
- TABLE 18 EUROPEAN TELECOMMUNICATIONS STANDARDS INSTITUTE: STANDARDS
- 5.14.4 REGULATIONS
- 5.14.4.1 Global
- 5.14.4.2 North America
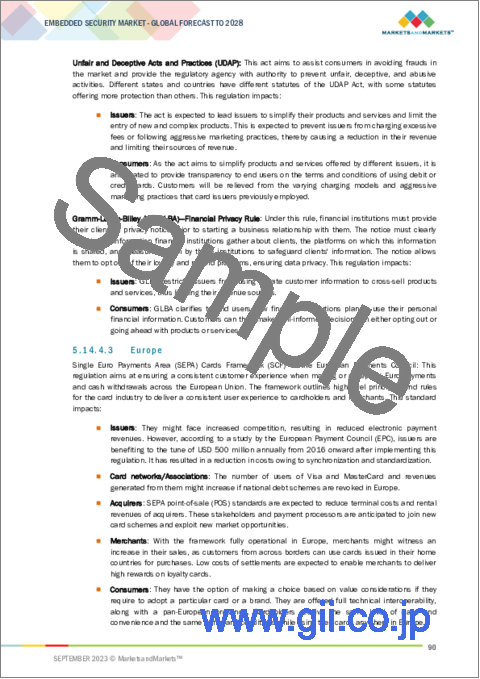
- 5.14.4.3 Europe
- 5.14.4.4 Asia Pacific
6 EMBEDDED SECURITY MARKET, BY SECURITY TYPE
- 6.1 INTRODUCTION
- FIGURE 34 EMBEDDED SECURITY MARKET, BY SECURITY TYPE, 2023-2028 (USD MILLION)
- TABLE 19 EMBEDDED SECURITY MARKET, BY SECURITY TYPE, 2019-2022 (USD MILLION)
- TABLE 20 EMBEDDED SECURITY MARKET, BY SECURITY TYPE, 2023-2028 (USD MILLION)
- 6.2 AUTHENTICATION & ACCESS MANAGEMENT
- 6.2.1 ABILITY TO BLOCK UNAUTHORIZED USERS FROM ACCESSING DEVICES TO GENERATE DEMAND FOR AUTHENTICATION & ACCESS MANAGEMENT
- TABLE 21 AUTHENTICATION & ACCESS MANAGEMENT: EMBEDDED SECURITY MARKET, BY REGION, 2019-2022 (USD MILLION)
- TABLE 22 AUTHENTICATION & ACCESS MANAGEMENT: EMBEDDED SECURITY MARKET, BY REGION, 2023-2028 (USD MILLION)
- 6.3 PAYMENTS
- 6.3.1 NEED TO ENSURE SECURE TRANSACTIONS AND PROTECT SENSITIVE CONSUMER DATA TO FUEL DEMAND FOR PAYMENT SECURITY
- TABLE 23 PAYMENT: EMBEDDED SECURITY MARKET, BY REGION, 2019-2022 (USD MILLION)
- TABLE 24 PAYMENT: EMBEDDED SECURITY MARKET, BY REGION, 2023-2028 (USD MILLION)
- 6.4 CONTENT PROTECTION
- 6.4.1 NEED TO PROTECT SENSITIVE ORGANIZATIONAL DATA FROM FRAUDULENT ACTIVITIES AND PRIVACY BREACHES TO DRIVE MARKET FOR CONTENT PROTECTION
- TABLE 25 CONTENT PROTECTION: EMBEDDED SECURITY MARKET, BY REGION, 2019-2022 (USD MILLION)
- TABLE 26 CONTENT PROTECTION: EMBEDDED SECURITY MARKET, BY REGION, 2023-2028 (USD MILLION)
7 EMBEDDED SECURITY MARKET, BY OFFERING
- 7.1 INTRODUCTION
- FIGURE 35 EMBEDDED SECURITY MARKET, BY OFFERING, 2023-2028 (USD MILLION)
- TABLE 27 EMBEDDED SECURITY MARKET, BY OFFERING, 2019-2022 (USD MILLION)
- TABLE 28 EMBEDDED SECURITY MARKET, BY OFFERING, 2023-2028 (USD MILLION)
- 7.2 HARDWARE
- TABLE 29 HARDWARE: EMBEDDED SECURITY MARKET, BY PRODUCT, 2019-2022 (USD MILLION)
- TABLE 30 HARDWARE: EMBEDDED SECURITY MARKET, BY PRODUCT, 2023-2028 (USD MILLION)
- TABLE 31 HARDWARE: EMBEDDED SECURITY MARKET, BY REGION, 2019-2022 (USD MILLION)
- TABLE 32 HARDWARE: EMBEDDED SECURITY MARKET, BY REGION, 2023-2028 (USD MILLION)
- 7.2.1 SECURE ELEMENTS
- 7.2.1.1 Extensive use of secure elements in e-Government applications such as e-passports and smart identity cards to drive market
- 7.2.2 EMBEDDED SIM
- 7.2.2.1 Increasing machine-to-machine connections globally to propel market
- 7.2.3 TRUSTED PLATFORM MODULES
- 7.2.3.1 Increasing number of cybersecurity attacks to fuel market growth
- 7.2.4 HARDWARE SECURITY MODULES
- 7.2.4.1 Rising need for information and data security to drive market
- 7.2.5 HARDWARE TOKENS
- 7.2.5.1 Rising demand for secure internet-based transactions to propel market
- 7.3 SOFTWARE
- TABLE 33 SOFTWARE: EMBEDDED SECURITY MARKET, BY REGION, 2019-2022 (USD MILLION)
- TABLE 34 SOFTWARE: EMBEDDED SECURITY MARKET, BY REGION, 2023-2028 (USD MILLION)
- 7.3.1 FIREWALLS
- 7.3.1.1 Need to prevent unauthorized computer and network access to boost adoption of firewalls
- 7.3.2 ANTIVIRUS
- 7.3.2.1 Potential to address post-firewall intrusions and mitigate advanced threats to contribute to market growth
- 7.3.3 ANTISPYWARE
- 7.3.3.1 Utilization in monitoring and detecting unauthorized communications to propel market
- 7.3.4 NETWORK SECURITY
- 7.3.4.1 Higher cost-efficiency of implementing security at network level to boost market
- 7.4 SERVICES
- TABLE 35 SERVICES: EMBEDDED SECURITY MARKET, BY REGION, 2019-2022 (USD MILLION)
- TABLE 36 SERVICES: EMBEDDED SECURITY MARKET, BY REGION, 2023-2028 (USD MILLION)
- 7.4.1 SYSTEM INTEGRATION SERVICES
- 7.4.1.1 Increasing emphasis on enhancing quality of business operations to propel market
- 7.4.2 SUPPORT AND MAINTENANCE SERVICES
- 7.4.2.1 Increased technological complexities to fuel demand for support and maintenance services
- 7.4.3 SECURITY CONSULTING
- 7.4.3.1 Focus on enhancing effectiveness of business and IT processes to boost demand for security consulting
8 EMBEDDED SECURITY MARKET, BY APPLICATION
- 8.1 INTRODUCTION
- FIGURE 36 EMBEDDED SECURITY MARKET, BY APPLICATION, 2023-2028 (USD MILLION)
- TABLE 37 EMBEDDED SECURITY MARKET, BY APPLICATION, 2019-2022 (USD MILLION)
- TABLE 38 EMBEDDED SECURITY MARKET, BY APPLICATION, 2023-2028 (USD MILLION)
- 8.2 WEARABLES
- 8.2.1 RISING INTEGRATION OF WEARBLE DEVICES WITH DIGITAL WALLETS TO INCREASE DEMAND FOR EMBEDDED SECURITY
- TABLE 39 WEARABLES: EMBEDDED SECURITY MARKET, BY REGION, 2019-2022 (USD MILLION)
- TABLE 40 WEARABLES: EMBEDDED SECURITY MARKET, BY REGION, 2023-2028 (USD MILLION)
- 8.3 SMARTPHONES
- 8.3.1 SURGE IN MOBILE PAYMENTS TO NECESSITATE ADOPTION OF EMBEDDED SECURITY
- TABLE 41 SMARTPHONES: EMBEDDED SECURITY MARKET, BY REGION, 2019-2022 (USD MILLION)
- TABLE 42 SMARTPHONES: EMBEDDED SECURITY MARKET, BY REGION, 2023-2028 (USD MILLION)
- 8.4 AUTOMOTIVE
- 8.4.1 GROWING DEMAND FOR CONNECTED CARS TO BOOST MARKET
- TABLE 43 AUTOMOTIVE: EMBEDDED SECURITY MARKET, BY REGION, 2019-2022 (USD MILLION)
- TABLE 44 AUTOMOTIVE: EMBEDDED SECURITY MARKET, BY REGION, 2023-2028 (USD MILLION)
- 8.5 SMART IDENTITY CARDS
- 8.5.1 EMERGENCE OF MULTI-APPLICATION SMART CARDS FOR SHARED STORAGE AND INFORMATION PROCESSING TO FOSTER MARKET GROWTH
- TABLE 45 SMART IDENTITY CARDS: EMBEDDED SECURITY MARKET, BY REGION, 2019-2022 (USD MILLION)
- TABLE 46 SMART IDENTITY CARDS: EMBEDDED SECURITY MARKET, BY REGION, 2023-2028 (USD MILLION)
- 8.6 INDUSTRIAL
- 8.6.1 RISING INTEGRATION OF IOT WITH INDUSTRIAL SYSTEMS TO SUPPORT MARKET GROWTH
- TABLE 47 INDUSTRIAL: EMBEDDED SECURITY MARKET, BY REGION, 2019-2022 (USD MILLION)
- TABLE 48 INDUSTRIAL: EMBEDDED SECURITY MARKET, BY REGION, 2023-2028 (USD MILLION)
- 8.7 PAYMENT PROCESSING & CARDS
- 8.7.1 INCREASING E-COMMERCE SALES AND GROWING INTERNET PENETRATION TO SPUR MARKET GROWTH
- TABLE 49 PAYMENT PROCESSING & CARDS: EMBEDDED SECURITY MARKET, BY REGION, 2019-2022 (USD MILLION)
- TABLE 50 PAYMENT PROCESSING & CARDS: EMBEDDED SECURITY MARKET, BY REGION, 2023-2028 (USD MILLION)
- 8.8 OTHERS
- TABLE 51 OTHERS: EMBEDDED SECURITY MARKET, BY REGION, 2019-2022 (USD MILLION)
- TABLE 52 OTHERS: EMBEDDED SECURITY MARKET, BY REGION, 2023-2028 (USD MILLION)
9 EMBEDDED SECURITY MARKET, BY REGION
- 9.1 INTRODUCTION
- FIGURE 37 EMBEDDED SECURITY MARKET, BY COUNTRY
- TABLE 53 EMBEDDED SECURITY MARKET, BY REGION, 2019-2022 (USD MILLION)
- TABLE 54 EMBEDDED SECURITY MARKET, BY REGION, 2023-2028 (USD MILLION)
- 9.2 NORTH AMERICA
- FIGURE 38 NORTH AMERICA: EMBEDDED SECURITY MARKET SNAPSHOT
- 9.2.1 RECESSION IMPACT ON EMBEDDED SECURITY MARKET IN NORTH AMERICA
- FIGURE 39 NORTH AMERICA: RECESSION IMPACT ANALYSIS, 2019-2028
- TABLE 55 NORTH AMERICA: EMBEDDED SECURITY MARKET, BY SECURITY TYPE, 2019-2022 (USD MILLION)
- TABLE 56 NORTH AMERICA: EMBEDDED SECURITY MARKET, BY SECURITY TYPE, 2023-2028 (USD MILLION)
- TABLE 57 NORTH AMERICA: EMBEDDED SECURITY MARKET, BY OFFERING, 2019-2022 (USD MILLION)
- TABLE 58 NORTH AMERICA: EMBEDDED SECURITY MARKET, BY OFFERING, 2023-2028 (USD MILLION)
- TABLE 59 NORTH AMERICA: EMBEDDED SECURITY MARKET, BY APPLICATION, 2019-2022 (USD MILLION)
- TABLE 60 NORTH AMERICA: EMBEDDED SECURITY MARKET, BY APPLICATION, 2023-2028 (USD MILLION)
- TABLE 61 NORTH AMERICA: EMBEDDED SECURITY MARKET, BY COUNTRY, 2019-2022 (USD MILLION)
- TABLE 62 NORTH AMERICA: EMBEDDED SECURITY MARKET, BY COUNTRY, 2023-2028 (USD MILLION)
- 9.2.2 US
- 9.2.2.1 Rising cost burden of data breaches to fuel demand for embedded security
- TABLE 63 US: EMBEDDED SECURITY MARKET, BY SECURITY TYPE, 2019-2022 (USD MILLION)
- TABLE 64 US: EMBEDDED SECURITY MARKET, BY SECURITY TYPE, 2023-2028 (USD MILLION)
- TABLE 65 US: EMBEDDED SECURITY MARKET, BY OFFERING, 2019-2022 (USD MILLION)
- TABLE 66 US: EMBEDDED SECURITY MARKET, BY OFFERING, 2023-2028 (USD MILLION)
- TABLE 67 US: EMBEDDED SECURITY MARKET, BY APPLICATION, 2019-2022 (USD MILLION)
- TABLE 68 US: EMBEDDED SECURITY MARKET, BY APPLICATION, 2023-2028 (USD MILLION)
- 9.2.3 CANADA
- 9.2.3.1 Rapid advancements in next-generation digital technologies to foster market growth
- TABLE 69 CANADA: EMBEDDED SECURITY MARKET, BY SECURITY TYPE, 2019-2022 (USD MILLION)
- TABLE 70 CANADA: EMBEDDED SECURITY MARKET, BY SECURITY TYPE, 2023-2028 (USD MILLION)
- TABLE 71 CANADA: EMBEDDED SECURITY MARKET, BY OFFERING, 2019-2022 (USD MILLION)
- TABLE 72 CANADA: EMBEDDED SECURITY MARKET, BY OFFERING, 2023-2028 (USD MILLION)
- TABLE 73 CANADA: EMBEDDED SECURITY MARKET, BY APPLICATION, 2019-2022 (USD MILLION)
- TABLE 74 CANADA: EMBEDDED SECURITY MARKET, BY APPLICATION, 2023-2028 (USD MILLION)
- 9.2.4 MEXICO
- 9.2.4.1 Rising adoption of wireless connectivity technologies to contribute to market growth
- TABLE 75 MEXICO: EMBEDDED SECURITY MARKET, BY SECURITY TYPE, 2019-2022 (USD MILLION)
- TABLE 76 MEXICO: EMBEDDED SECURITY MARKET, BY SECURITY TYPE, 2023-2028 (USD MILLION
- TABLE 77 MEXICO: EMBEDDED SECURITY MARKET, BY OFFERING, 2019-2022 (USD MILLION)
- TABLE 78 MEXICO: EMBEDDED SECURITY MARKET, BY OFFERING, 2023-2028 (USD MILLION)
- TABLE 79 MEXICO: EMBEDDED SECURITY MARKET, BY APPLICATION, 2019-2022 (USD MILLION)
- TABLE 80 MEXICO: EMBEDDED SECURITY MARKET, BY APPLICATION, 2023-2028 (USD MILLION)
- 9.3 EUROPE
- FIGURE 40 EUROPE: EMBEDDED SECURITY MARKET SNAPSHOT
- 9.3.1 RECESSION IMPACT ON EMBEDDED SECURITY MARKET IN EUROPE
- FIGURE 41 EUROPE: RECESSION IMPACT ANALYSIS, 2019-2028
- TABLE 81 EUROPE: EMBEDDED SECURITY MARKET, BY SECURITY TYPE, 2019-2022 (USD MILLION)
- TABLE 82 EUROPE: EMBEDDED SECURITY MARKET, BY SECURITY TYPE, 2023-2028 (USD MILLION)
- TABLE 83 EUROPE: EMBEDDED SECURITY MARKET, BY OFFERING, 2019-2022 (USD MILLION)
- TABLE 84 EUROPE: EMBEDDED SECURITY MARKET, BY OFFERING, 2023-2028 (USD MILLION)
- TABLE 85 EUROPE: EMBEDDED SECURITY MARKET, BY APPLICATION, 2019-2022 (USD MILLION)
- TABLE 86 EUROPE: EMBEDDED SECURITY MARKET, BY APPLICATION, 2023-2028 (USD MILLION)
- TABLE 87 EUROPE: EMBEDDED SECURITY MARKET, BY COUNTRY, 2019-2022 (USD MILLION)
- TABLE 88 EUROPE: EMBEDDED SECURITY MARKET, BY COUNTRY, 2023-2028 (USD MILLION)
- 9.3.2 UK
- 9.3.2.1 Sharp increase in cyberattacks to boost demand for embedded security systems
- TABLE 89 UK: EMBEDDED SECURITY MARKET, BY SECURITY TYPE, 2019-2022 (USD MILLION)
- TABLE 90 UK: EMBEDDED SECURITY MARKET, BY SECURITY TYPE, 2023-2028 (USD MILLION)
- TABLE 91 UK: EMBEDDED SECURITY MARKET, BY OFFERING, 2019-2022 (USD MILLION)
- TABLE 92 UK: EMBEDDED SECURITY MARKET, BY OFFERING, 2023-2028 (USD MILLION)
- TABLE 93 UK: EMBEDDED SECURITY MARKET, BY APPLICATION, 2019-2022 (USD MILLION)
- TABLE 94 UK: EMBEDDED SECURITY MARKET, BY APPLICATION, 2023-2028 (USD MILLION)
- 9.3.3 GERMANY
- 9.3.3.1 Rising government investments in security projects to fuel market growth
- TABLE 95 GERMANY: EMBEDDED SECURITY MARKET, BY SECURITY TYPE, 2019-2022 (USD MILLION)
- TABLE 96 GERMANY: EMBEDDED SECURITY MARKET, BY SECURITY TYPE, 2023-2028 (USD MILLION)
- TABLE 97 GERMANY: EMBEDDED SECURITY MARKET, BY OFFERING, 2019-2022 (USD MILLION)
- TABLE 98 GERMANY: EMBEDDED SECURITY MARKET, BY OFFERING, 2023-2028 (USD MILLION)
- TABLE 99 GERMANY: EMBEDDED SECURITY MARKET, BY APPLICATION, 2019-2022 (USD MILLION)
- TABLE 100 GERMANY: EMBEDDED SECURITY MARKET, BY APPLICATION, 2023-2028 (USD MILLION)
- 9.3.4 FRANCE
- 9.3.4.1 Increasing initiatives to boost cybersecurity to accelerate market growth
- TABLE 101 FRANCE: EMBEDDED SECURITY MARKET, BY SECURITY TYPE, 2019-2022 (USD MILLION)
- TABLE 102 FRANCE: EMBEDDED SECURITY MARKET, BY SECURITY TYPE, 2023-2028 (USD MILLION)
- TABLE 103 FRANCE: EMBEDDED SECURITY MARKET, BY OFFERING, 2019-2022 (USD MILLION)
- TABLE 104 FRANCE: EMBEDDED SECURITY MARKET, BY OFFERING, 2023-2028 (USD MILLION)
- TABLE 105 FRANCE: EMBEDDED SECURITY MARKET, BY APPLICATION, 2019-2022 (USD MILLION)
- TABLE 106 FRANCE: EMBEDDED SECURITY MARKET, BY APPLICATION, 2023-2028 (USD MILLION)
- 9.3.5 REST OF EUROPE
- TABLE 107 REST OF EUROPE: EMBEDDED SECURITY MARKET, BY SECURITY TYPE, 2019-2022 (USD MILLION)
- TABLE 108 REST OF EUROPE: EMBEDDED SECURITY MARKET, BY SECURITY TYPE, 2023-2028 (USD MILLION)
- TABLE 109 REST OF EUROPE: EMBEDDED SECURITY MARKET, BY OFFERING, 2019-2022 (USD MILLION)
- TABLE 110 REST OF EUROPE: EMBEDDED SECURITY MARKET, BY OFFERING, 2023-2028 (USD MILLION)
- TABLE 111 REST OF EUROPE: EMBEDDED SECURITY MARKET, BY APPLICATION, 2019-2022 (USD MILLION)
- TABLE 112 REST OF EUROPE: EMBEDDED SECURITY MARKET, BY APPLICATION, 2023-2028 (USD MILLION)
- 9.4 ASIA PACIFIC
- FIGURE 42 ASIA PACIFIC: EMBEDDED SECURITY MARKET SNAPSHOT
- 9.4.1 RECESSION IMPACT ON EMBEDDED SECURITY MARKET IN ASIA PACIFIC
- FIGURE 43 ASIA PACIFIC: RECESSION IMPACT ANALYSIS, 2019-2028
- TABLE 113 ASIA PACIFIC: EMBEDDED SECURITY MARKET, BY SECURITY TYPE, 2019-2022 (USD MILLION)
- TABLE 114 ASIA PACIFIC: EMBEDDED SECURITY MARKET, BY SECURITY TYPE, 2023-2028 (USD MILLION)
- TABLE 115 ASIA PACIFIC: EMBEDDED SECURITY MARKET, BY OFFERING, 2019-2022 (USD MILLION)
- TABLE 116 ASIA PACIFIC: EMBEDDED SECURITY MARKET, BY OFFERING, 2023-2028 (USD MILLION)
- TABLE 117 ASIA PACIFIC: EMBEDDED SECURITY MARKET, BY APPLICATION, 2019-2022 (USD MILLION)
- TABLE 118 ASIA PACIFIC: EMBEDDED SECURITY MARKET, BY APPLICATION, 2023-2028 (USD MILLION)
- TABLE 119 ASIA PACIFIC: EMBEDDED SECURITY MARKET, BY COUNTRY, 2019-2022 (USD MILLION)
- TABLE 120 ASIA PACIFIC: EMBEDDED SECURITY MARKET, BY COUNTRY, 2023-2028 (USD MILLION)
- 9.4.2 CHINA
- 9.4.2.1 Enforcement of data management and security laws to boost market growth
- TABLE 121 CHINA: EMBEDDED SECURITY MARKET, BY SECURITY TYPE, 2019-2022 (USD MILLION)
- TABLE 122 CHINA: EMBEDDED SECURITY MARKET, BY SECURITY TYPE, 2023-2028 (USD MILLION)
- TABLE 123 CHINA: EMBEDDED SECURITY MARKET, BY OFFERING, 2019-2022 (USD MILLION)
- TABLE 124 CHINA: EMBEDDED SECURITY MARKET, BY OFFERING, 2023-2028 (USD MILLION)
- TABLE 125 CHINA: EMBEDDED SECURITY MARKET, BY APPLICATION, 2019-2022 (USD MILLION)
- TABLE 126 CHINA: EMBEDDED SECURITY MARKET, BY APPLICATION, 2023-2028 (USD MILLION)
- 9.4.3 SOUTH KOREA
- 9.4.3.1 5G implementation to boost demand for embedded security solutions
- TABLE 127 SOUTH KOREA: EMBEDDED SECURITY MARKET, BY SECURITY TYPE, 2019-2022 (USD MILLION)
- TABLE 128 SOUTH KOREA: EMBEDDED SECURITY MARKET, BY SECURITY TYPE, 2023-2028 (USD MILLION)
- TABLE 129 SOUTH KOREA: EMBEDDED SECURITY MARKET, BY OFFERING, 2019-2022 (USD MILLION)
- TABLE 130 SOUTH KOREA: EMBEDDED SECURITY MARKET, BY OFFERING, 2023-2028 (USD MILLION)
- TABLE 131 SOUTH KOREA: EMBEDDED SECURITY MARKET, BY APPLICATION, 2019-2022 (USD MILLION)
- TABLE 132 SOUTH KOREA: EMBEDDED SECURITY MARKET, BY APPLICATION, 2023-2028 (USD MILLION)
- 9.4.4 JAPAN
- 9.4.4.1 Government focus on strengthening cybersecurity capabilities to boost market growth
- TABLE 133 JAPAN: EMBEDDED SECURITY MARKET, BY SECURITY TYPE, 2019-2022 (USD MILLION)
- TABLE 134 JAPAN: EMBEDDED SECURITY MARKET, BY SECURITY TYPE, 2023-2028 (USD MILLION)
- TABLE 135 JAPAN: EMBEDDED SECURITY MARKET, BY OFFERING, 2019-2022 (USD MILLION)
- TABLE 136 JAPAN: EMBEDDED SECURITY MARKET, BY OFFERING, 2023-2028 (USD MILLION)
- TABLE 137 JAPAN: EMBEDDED SECURITY MARKET, BY APPLICATION, 2019-2022 (USD MILLION)
- TABLE 138 JAPAN: EMBEDDED SECURITY MARKET, BY APPLICATION, 2023-2028 (USD MILLION)
- 9.4.5 REST OF ASIA PACIFIC
- TABLE 139 REST OF ASIA PACIFIC: EMBEDDED SECURITY MARKET, BY SECURITY TYPE, 2019-2022 (USD MILLION)
- TABLE 140 REST OF ASIA PACIFIC: EMBEDDED SECURITY MARKET, BY SECURITY TYPE, 2023-2028 (USD MILLION)
- TABLE 141 REST OF ASIA PACIFIC: EMBEDDED SECURITY MARKET, BY OFFERING, 2019-2022 (USD MILLION)
- TABLE 142 REST OF ASIA PACIFIC: EMBEDDED SECURITY MARKET, BY OFFERING, 2023-2028 (USD MILLION)
- TABLE 143 REST OF ASIA PACIFIC: EMBEDDED SECURITY MARKET, BY APPLICATION, 2019-2022 (USD MILLION)
- TABLE 144 REST OF ASIA PACIFIC: EMBEDDED SECURITY MARKET, BY APPLICATION, 2023-2028 (USD MILLION)
- 9.5 ROW
- 9.5.1 RECESSION IMPACT ON EMBEDDED SECURITY MARKET IN ROW
- FIGURE 44 ROW: RECESSION IMPACT ANALYSIS, 2019-2028
- TABLE 145 ROW: EMBEDDED SECURITY MARKET, BY SECURITY TYPE, 2019-2022 (USD MILLION)
- TABLE 146 ROW: EMBEDDED SECURITY MARKET, BY SECURITY TYPE, 2023-2028 (USD MILLION)
- TABLE 147 ROW: EMBEDDED SECURITY MARKET, BY OFFERING, 2019-2022 (USD MILLION)
- TABLE 148 ROW: EMBEDDED SECURITY MARKET, BY OFFERING, 2023-2028 (USD MILLION)
- TABLE 149 ROW: EMBEDDED SECURITY MARKET, BY APPLICATION, 2019-2022 (USD MILLION)
- TABLE 150 ROW: EMBEDDED SECURITY MARKET, BY APPLICATION, 2023-2028 (USD MILLION)
- TABLE 151 ROW: EMBEDDED SECURITY MARKET, BY REGION, 2019-2022 (USD MILLION)
- TABLE 152 ROW: EMBEDDED SECURITY MARKET, BY REGION, 2023-2028 (USD MILLION)
- 9.5.2 MIDDLE EAST & AFRICA
- 9.5.2.1 Rising focus on ensuring cyber resilience in oil & gas sector to boost market
- 9.5.3 LATIN AMERICA
- 9.5.3.1 Increasing investment in transportation and energy infrastructure to propel market
10 COMPETITIVE LANDSCAPE
- 10.1 INTRODUCTION
- 10.2 STRATEGIES ADOPTED BY KEY PLAYERS, 2020-2023
- TABLE 153 OVERVIEW OF STRATEGIES ADOPTED BY KEY PLAYERS, 2020-2023
- 10.3 REVENUE ANALYSIS OF KEY PLAYERS, 2018-2022
- FIGURE 45 5-YEAR REVENUE ANALYSIS OF KEY PLAYERS IN EMBEDDED SECURITY MARKET
- 10.4 MARKET SHARE ANALYSIS, 2022
- TABLE 154 EMBEDDED SECURITY MARKET: DEGREE OF COMPETITION
- FIGURE 46 MARKET SHARE ANALYSIS, 2022
- 10.5 KEY COMPANY EVALUATION MATRIX, 2022
- 10.5.1 STARS
- 10.5.2 PERVASIVE PLAYERS
- 10.5.3 EMERGING LEADERS
- 10.5.4 PARTICIPANTS
- FIGURE 47 EMBEDDED SECURITY MARKET: KEY COMPANY EVALUATION MATRIX, 2022
- 10.6 COMPETITIVE BENCHMARKING OF KEY PLAYERS
- TABLE 155 OVERALL COMPANY FOOTPRINT
- TABLE 156 COMPANY FOOTPRINT, BY APPLICATION
- TABLE 157 COMPANY FOOTPRINT, BY OFFERING
- TABLE 158 COMPANY FOOTPRINT, BY REGION
- 10.7 SMALL AND MEDIUM-SIZED ENTERPRISES (SMES)/STARTUPS EVALUATION MATRIX, 2022
- 10.7.1 PROGRESSIVE COMPANIES
- 10.7.2 RESPONSIVE COMPANIES
- 10.7.3 DYNAMIC COMPANIES
- 10.7.4 STARTING BLOCKS
- FIGURE 48 EMBEDDED SECURITY MARKET: SMES/STARTUPS EVALUATION MATRIX, 2022
- 10.8 COMPETITIVE SCENARIOS AND TRENDS
- 10.8.1 PRODUCT LAUNCHES
- TABLE 159 EMBEDDED SECURITY MARKET: PRODUCT LAUNCHES AND DEVELOPMENTS, 2021-2023
- 10.8.2 DEALS
- TABLE 160 EMBEDDED SECURITY MARKET: DEALS, 2021-2023
- 10.9 COMPETITIVE BENCHMARKING OF STARTUPS/SMES
- TABLE 161 EMBEDDED SECURITY MARKET: LIST OF KEY STARTUPS/SMES
- TABLE 162 EMBEDDED SECURITY MARKET: COMPETITIVE BENCHMARKING OF KEY STARTUPS/SMES
11 COMPANY PROFILES
- (Business Overview, Products/Solutions/Services Offered, Recent Developments, and MnM View (Key strengths/Right to Win, Strategic Choices Made, and Weaknesses and Competitive Threats))**
- 11.1 INTRODUCTION
- 11.2 KEY PLAYERS
- 11.2.1 INFINEON TECHNOLOGIES AG
- TABLE 163 INFINEON TECHNOLOGIES AG: COMPANY OVERVIEW
- FIGURE 49 INFINEON TECHNOLOGIES AG: COMPANY SNAPSHOT
- TABLE 164 INFINEON TECHNOLOGIES AG: PRODUCTS/SOLUTIONS/SERVICES OFFERED
- TABLE 165 INFINEON TECHNOLOGIES AG: PRODUCT LAUNCHES
- TABLE 166 INFINEON TECHNOLOGIES AG: DEALS
- TABLE 167 INFINEON TECHNOLOGIES AG: OTHERS
- 11.2.2 STMICROELECTRONICS
- TABLE 168 STMICROELECTRONICS: COMPANY OVERVIEW
- FIGURE 50 STMICROELECTRONICS: COMPANY SNAPSHOT
- TABLE 169 STMICROELECTRONICS: PRODUCTS/SOLUTIONS/SERVICES OFFERED
- TABLE 170 STMICROELECTRONICS: PRODUCT LAUNCHES
- TABLE 171 STMICROELECTRONICS: DEALS
- 11.2.3 NXP SEMICONDUCTORS
- TABLE 172 NXP SEMICONDUCTORS: COMPANY OVERVIEW
- FIGURE 51 NXP SEMICONDUCTORS: COMPANY SNAPSHOT
- TABLE 173 NXP SEMICONDUCTORS: PRODUCTS/SOLUTIONS/SERVICES OFFERED
- TABLE 174 NXP SEMICONDUCTORS: PRODUCT LAUNCHES
- TABLE 175 NXP SEMICONDUCTORS: DEALS
- 11.2.4 TEXAS INSTRUMENTS INCORPORATED
- TABLE 176 TEXAS INSTRUMENTS INCORPORATED: COMPANY OVERVIEW
- FIGURE 52 TEXAS INSTRUMENTS INCORPORATED: COMPANY SNAPSHOT
- TABLE 177 TEXAS INSTRUMENTS INCORPORATED: PRODUCTS/SOLUTIONS/SERVICES OFFERED
- TABLE 178 TEXAS INSTRUMENTS INCORPORATED: PRODUCT LAUNCHES
- TABLE 179 TEXAS INSTRUMENTS INCORPORATED: DEALS
- TABLE 180 TEXAS INSTRUMENTS INCORPORATED: OTHERS
- 11.2.5 QUALCOMM TECHNOLOGIES, INC.
- TABLE 181 QUALCOMM TECHNOLOGIES, INC.: COMPANY OVERVIEW
- FIGURE 53 QUALCOMM TECHNOLOGIES, INC.: COMPANY SNAPSHOT
- TABLE 182 QUALCOMM TECHNOLOGIES, INC.: PRODUCTS/SOLUTIONS/SERVICES OFFERED
- TABLE 183 QUALCOMM TECHNOLOGIES, INC.: PRODUCT LAUNCHES
- TABLE 184 QUALCOMM TECHNOLOGIES, INC.: DEALS
- 11.2.6 RENESAS ELECTRONICS CORPORATION
- TABLE 185 RENESAS ELECTRONICS CORPORATION: COMPANY OVERVIEW
- FIGURE 54 RENESAS ELECTRONICS CORPORATION: COMPANY SNAPSHOT
- TABLE 186 RENESAS ELECTRONICS CORPORATION: PRODUCTS/SOLUTIONS/SERVICES OFFERED
- TABLE 187 RENESAS ELECTRONICS CORPORATION: PRODUCT LAUNCHES
- TABLE 188 RENESAS ELECTRONICS CORPORATION: DEALS
- TABLE 189 RENESAS ELECTRONICS CORPORATION: OTHERS
- 11.2.7 THALES
- TABLE 190 THALES: COMPANY OVERVIEW
- FIGURE 55 THALES GROUP: COMPANY SNAPSHOT
- TABLE 191 THALES: PRODUCTS/SOLUTIONS/SERVICES OFFERED
- TABLE 192 THALES: PRODUCT LAUNCHES
- TABLE 193 THALES: DEALS
- 11.2.8 MICROCHIP TECHNOLOGY INC.
- TABLE 194 MICROCHIP TECHNOLOGY INC.: COMPANY OVERVIEW
- FIGURE 56 MICROCHIP TECHNOLOGY INC.: COMPANY SNAPSHOT
- TABLE 195 MICROCHIP TECHNOLOGY INC.: PRODUCTS/SOLUTIONS/SERVICES OFFERED
- TABLE 196 MICROCHIP TECHNOLOGY INC.: PRODUCT LAUNCHES
- TABLE 197 MICROCHIP TECHNOLOGY INC.: OTHERS
- 11.2.9 SAMSUNG
- TABLE 198 SAMSUNG: COMPANY OVERVIEW
- FIGURE 57 SAMSUNG: COMPANY SNAPSHOT
- TABLE 199 SAMSUNG: PRODUCTS/SOLUTIONS/SERVICES OFFERED
- TABLE 200 SAMSUNG: PRODUCT LAUNCHES
- 11.2.10 IDEMIA
- TABLE 201 IDEMIA: COMPANY OVERVIEW
- TABLE 202 IDEMIA: PRODUCTS/SOLUTIONS/SERVICES OFFERED
- TABLE 203 IDEMIA: PRODUCT LAUNCHES
- TABLE 204 IDEMIA: DEALS
- 11.2.11 ICTK CO., LTD.
- TABLE 205 ICTK CO., LTD.: COMPANY OVERVIEW
- TABLE 206 ICTK CO., LTD.: PRODUCTS/SOLUTIONS/SERVICES OFFERED
- TABLE 207 ICTK CO., LTD.: DEALS
- 11.3 OTHER PLAYERS
- 11.3.1 RAMBUS INC.
- 11.3.2 CISCO SYSTEMS, INC.
- 11.3.3 ETAS
- 11.3.4 OVD KINEGRAM AG
- 11.3.5 BAE SYSTEMS
- 11.3.6 LANTRONIX, INC.
- 11.3.7 IBM
- 11.3.8 SWIFT
- 11.3.9 MCAFEE, LLC
- 11.3.10 BROADCOM
- 11.3.11 HITEX GMBH
- 11.3.12 ANALOG DEVICES, INC
- 11.3.13 ADVANTECH CO., LTD.
- 11.3.14 ETA COMPUTE
- 11.3.15 RUNSAFE SECURITY
- *Details on Business Overview, Products/Solutions/Services Offered, Recent Developments, and MnM View (Key strengths/Right to Win, Strategic Choices Made, and Weaknesses and Competitive Threats) might not be captured in case of unlisted companies.
12 APPENDIX
- 12.1 INSIGHTS FROM INDUSTRY EXPERTS
- 12.2 DISCUSSION GUIDE
- 12.3 KNOWLEDGESTORE: MARKETSANDMARKETS' SUBSCRIPTION PORTAL
- 12.4 CUSTOMIZATION OPTIONS
- 12.5 RELATED REPORTS
- 12.6 AUTHOR DETAILS
