|
|
市場調査レポート
商品コード
1241255
自動車用IoTの世界市場:提供製品/サービス別 (ハードウェア、ソフトウェア、サービス)・コネクティビティのフォームファクタ別 (組込型、テザー型、一体型)・通信の種類別・用途別 (ナビゲーション、テレマティクス、インフォテインメント)・地域別の将来予測 (2028年まで)Automotive IoT Market by Offering (Hardware, Software, Services), by Connectivity Form Factor (Embedded, Tethered, Integrated), by Communication Type, by Application (Navigation, Telematics, Infotainment) and Region - Global Forecast to 2028 |
||||||
|
|
|||||||
|
● お客様のご希望に応じて、既存データの加工や未掲載情報(例:国別セグメント)の追加などの対応が可能です。 詳細はお問い合わせください。 |
|||||||


| 自動車用IoTの世界市場:提供製品/サービス別 (ハードウェア、ソフトウェア、サービス)・コネクティビティのフォームファクタ別 (組込型、テザー型、一体型)・通信の種類別・用途別 (ナビゲーション、テレマティクス、インフォテインメント)・地域別の将来予測 (2028年まで) |
|
出版日: 2023年03月14日
発行: MarketsandMarkets
ページ情報: 英文 326 Pages
納期: 即納可能
|
- 全表示
- 概要
- 目次
世界の自動車用IoTの市場規模は、2023年の1,312億米ドルから、2028年には3,220億米ドルに達する見通しで、2023年から2028年にかけて19.7%のCAGRで成長すると予想されています。
CO2排出量を削減するために電気自動車やハイブリッド車の導入が進むとともに、燃料の浪費を減らすためのコネクテッドカー技術の普及が増加していることが、自動車用IoT市場の成長を促進すると予想されています。一方、コネクテッドカーが適切に機能するためのインフラがないことが、自動車IoT市場の成長を制限しています。
"提供製品/サービス別では、サービス分野が予測期間中に最も大きく成長する"
提供製品/サービス別に見ると、サービス分野が予測期間中に最も高いCAGRで成長すると予想されます。コネクテッドカーを持ちたいと考えている車両所有者は適切なソリューションを必要としているため、自動車用IoTのレトロフィット市場の成長がサービス市場の主要な促進要因となっています。
"コネクティビティのフォームファクタ別では、組込型システム分野が予測期間中に最大のシェアを占める"
コネクティビティのフォームファクタ別に見ると、組込型システムのセグメントが予測期間中に最大のシェアを占める、と予想されています。最高の消費者体験に対する需要の増加は、インターネットに接続され、クラウド機能を備えた自動車のインフォテインメント・システムの更新によって満たされています。インフォテインメントなどの自動車用IoTアプリケーションでは、組込型接続により、互換性・相互運用性・テザリングの問題が回避され、良好な通信性能が得られます。組込型自動車用IoTソリューションの長期的な成長は、政府の義務付け、サービスプランのコスト最適化、クラウドベースのサービスの増加など、さまざまな破壊的要因に起因していると考えられます。さらに、高速接続を実現する5G技術の採用により、メーカーやバイヤーの志向は組込型・自動車用IoTソリューションにシフトしていくでしょう。
"用途別では、インフォテインメントのセグメントが予測期間中に大きなシェアを獲得する"
インフォテインメント向け用途は、2028年までに2番目に大きな市場シェアを占めると予想されます。高度な安全機能、自動運転車、運転支援用デジタルコックピット、エンタテインメンなどの需要の高まりが、自動車用IoTインフォテインメント市場の成長を促進しています。さらに、技術的に高度な製品に対する消費者の嗜好の変化が、市場全体の成長に寄与しています。運転中のエンターテインメントに注目する消費者の急増と、一人当たりの所得の高さを背景とした自動車のカスタマイズ需要の高さは、インフォテインメント用途のセグメントの成長に寄与すると考えられます。ユーザーは、車両に搭載されるシステムに、デバイスの統合、高速接続性、直感的でマルチモーダルなユーザーインターフェースなどのマルチメディアサポートやスマートアプリを求めます。インターネットラジオ、音楽ストリーミング、ソーシャルネットワーキングアプリの実行は、一般的に利用できるサービスです。
"予測期間中、欧州が自動車用IoT市場で大きなシェアを占める"
世界の自動車用IoT市場を地域別に見ると、予測期間中は欧州諸国 (ドイツ、英国、フランスなど) が著しく大きなシェアを占めると予想されます。欧州には多くの大手自動車会社があり、自動車産業は経済への重要な貢献者の1つです。厳しい車両安全基準を満たすために、従来の運転支援システムから先進的なコネクテッドシステムへの移行が進んでいます。このため、テレマティクス・ソリューションを搭載した乗用車の需要に将来的にプラスの影響を与えると予想されます。この地域における市場の成長は、EUにおいてeCallなどの特定のテレマティクスサービスを使用することが義務付けられた規制 (すべての乗用車において2018年から) に起因していると考えられます。これらの先進技術は、安全性を向上させ、衝突や危険な状況のリスクを最小化するのに役立ちます。欧州の市場は、インフォテインメントとナビゲーションのアプリケーションに大きな機会を与えています。したがって、テレマティクスアプリケーションを最小限に抑えた自動車用IoTの需要は、この地域の市場を牽引すると考えられます。欧州の自動車用IoT市場のもう一つの主要な促進要因は、すべての新車に事故時に緊急サービスを呼び出すセンサーの装着を義務付けるeCall義務化です。
当レポートでは、世界の自動車用IoTの市場について分析し、市場の基本構造や最新情勢、主な市場促進・抑制要因、提供製品/サービス別・コネクティビティのフォームファクタ別・通信方式別・用途別・地域別の市場動向の見通し、市場競争の状態、主要企業のプロファイルなどを調査しております。
目次
第1章 イントロダクション
第2章 調査手法
第3章 エグゼクティブサマリー
第4章 重要考察
第5章 市場概要
- イントロダクション
- 市場力学
- 促進要因
- 抑制要因
- 機会
- 課題
- バリューチェーン分析
- エコシステム/マーケットマップ
- 主な利害関係者と購入基準
- ポーターのファイブフォース分析
- ケーススタディ分析
- 市場関係者と原材料サプライヤーのビジネスに影響を与える動向/混乱
- 技術分析
- 特許分析
- 貿易分析
- 関税
- 規制基準
- 主な会議とイベント (2023年~2024年)
- 価格分析
第6章 自動車用IoT市場:提供製品/サービス別
- イントロダクション
- ハードウェア
- 半導体部品
- 接続技術用IC
- ソフトウェア
- プラットフォーム
- ソリューション
- サービス
- 導入・統合サービス
- サポート・整備サービス
第7章 自動車用IoT市場:コネクティビティのフォームファクター別
- イントロダクション
- 組込型
- テザー型
- 一体型
第8章 自動車用IoT市場:通信方式別
- イントロダクション
- 車載通信
- V2V (車車間) 通信
- V2I (車路間) 通信
第9章 自動車用IoT市場:用途別
- イントロダクション
- ナビゲーション
- リアルタイムデータ取得
- 道路・車両モニタリング
- テレマティクス
- フリート・資産管理
- ITS (高度交通システム)
- 衝突回避
- 駐車場管理システム
- 旅客情報システム
- 緊急車両通知
- 予知保全
- リモート監視と診断
- インフォテインメント
- エンターテイメント
- 通信
第10章 自動車用IoT市場:地域別
- イントロダクション
- 北米
- 米国
- カナダ
- メキシコ
- 欧州
- ドイツ
- 英国
- フランス
- イタリア
- スペイン
- 他の欧州諸国
- アジア太平洋
- 中国
- 日本
- 韓国
- インド
- 他のアジア太平洋諸国
- 他の国々 (RoW)
- 中東・アフリカ
- 南米
第11章 競合情勢
- イントロダクション
- 収益分析
- 市場シェア分析 (2022年)
- 企業評価クアドラント (2022年)
- スタートアップ/中小企業の評価クアドラント (2022年)
- 企業の製品フットプリント分析
- 競合シナリオと動向
- 製品の発売
- 資本取引
第12章 企業プロファイル
- イントロダクション
- 主要企業
- NXP SEMICONDUCTORS
- HARMAN
- ROBERT BOSCH GMBH
- THALES
- TOMTOM INTERNATIONAL
- TEXAS INSTRUMENTS INC.
- INTEL CORPORATION
- IBM
- GEOTAB INC.
- EUROTECH
- INFINEON TECHNOLOGIES
- STMICROELECTRONICS
- RENESAS
- その他の企業
- AIRBIQUITY
- QUALCOMM
- VISTEON
- VODAFONE GROUP
- MICROSOFT CORPORATION
- ALPHABET INC.
- AT&T
- CLOUDMADE
- SIERRA WIRELESS
- VERIZON COMMUNICATION
- TELEFONICA
- MITSUBISHI ELECTRIC CORP.
- TECH MAHINDRA
- DESAY HV AUTOMOTIVE
- VALEO
- APTIV PLC
- INTELLIAS
第13章 付録
The automotive IoT market is projected to grow from USD 131.2 billion in 2023 and is projected to reach USD 322.0 by 2028; it is expected to grow at a CAGR of 19.7% from 2023 to 2028.
Increasing adoption of connected vehicle technology for reducing fuel wastage along with rising adoption of electric and hybrid vehicles to reduce CO2 emissions is expected to fuel the growth of the automotive IoT market. However, lack of infrastructure for proper functioning of connected vehicles is limiting the growth of the automotive IoT market.
"Services segment of the automotive IoT market to witness highest growth during the forecast period."
By offering, the automotive IoT market has been segmented into hardware, software, and services. The services segment is expected to grow at the highest CAGR during the forecast period. Deployment and integration, consulting, and support & maintenance are the major services contributing to the growth of the automotive IoT market for services. Growth in automotive IoT retrofit market is the major driver for the services market as vehicle owners looking to have a connected car require suitable solutions.
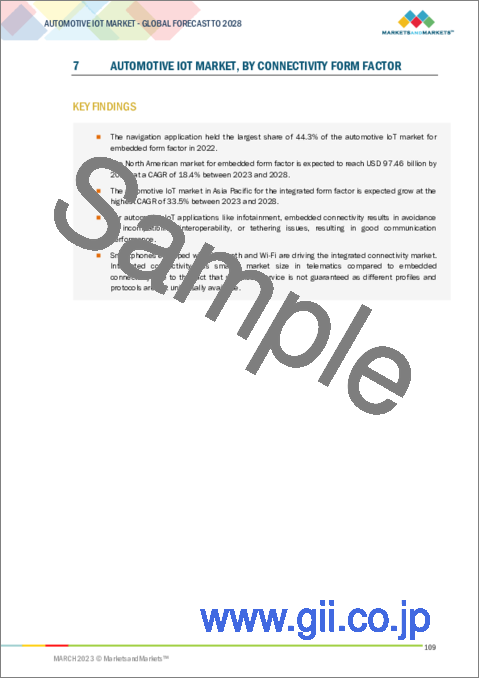
"Market for embedded systems segment is expected to account for largest share during the forecast period"
The market for embedded systems segment is expected to account for largest share of the automotive IoT market during the forecast period. Increase in demand for the best consumer experience is met by upgrade of infotainment systems in vehicles connected to the Internet and with cloud facility. For automotive IoT applications like infotainment, embedded connectivity results in avoidance of incompatibility, interoperability, or tethering issues, resulting in good communication performance. The growth of embedded automotive IoT solutions in the long term can be attributed to various disruptive factors such as government mandates, cost optimization of service plans, and increase in cloud-based services. Moreover, the adoption of 5G technology, which provides high-speed connectivity, will shift the inclination of manufacturers and buyers toward embedded automotive IoT solutions.
"Market for infotainment application is expected to significant share of the automotive IoT market during the forecast period "
The infotainment application is expected to hold the second-largest market share by 2028. The rising demand for advanced safety features, self-driving vehicles, digital cockpits for driver assistance, and entertainment purposes is driving the growth of the automotive IoT infotainment market. Furthermore, changing consumer preferences toward technologically advanced products is contributing to the growth of the overall market growth. Rapidly growing consumer focus on entertainment while driving, coupled with high demand for car customization backed by high per capita income, is likely to contribute to the growth of infotainment application segment. The introduction of cloud-based services for music and other multimedia support has led to an increase in infotainment applications in vehicles. Users look for multimedia support and smart apps for device integration, high-speed connectivity, intuitive and multi-modal user interfaces in the systems installed in vehicles. Internet radio, music streaming music, and running social networking apps are commonly available services.
"Europe to hold a significant share of the automotive IoT market during the forecast period"
Europe is expected to hold a significantly large share for automotive IoT market during the forecast period. The countries that constitute a major portion of the automotive IoT market in Europe include the Germany, UK, France. Europe is home to many major automobile companies, where the automotive industry is one of the key contributors to the economy. There is a drift from conventional driver assistance systems to advanced connected systems to meet the stringent vehicle safety norms. This is expected to positively impact the demand for passenger cars with telematics solutions in the future. The market growth in the region can be attributed to mandatory regulations in the EU to use certain telematics services such as eCall (since 2018 in all passenger cars). These advanced technologies help in improving safety and minimizing the risks of collisions and hazardous situations. The market in Europe presents a big opportunity for infotainment and navigation applications. Therefore, the demand for automotive IoT with minimal telematics applications is likely to drive the market in this region. Another key driver for the automotive IoT market in Europe is the eCall mandate, which necessitates all new cars to be fitted with a mandatory sensor that calls emergency services in case of an accident
The report profiles key players in the automotive IoT market with their respective market ranking analysis. Prominent players profiled in this report are include are NXP Semiconductors (Netherlands), Harman (US), Robert Bosch (Germany), Thales (France), TomTom International (Netherlands), IBM (US), Geotab Inc. (Canada), Texas Instruments (US), Intel Corp. (US), Eurotech (Italy), STMicroelectronics (Switzerland), Renesas (Japan), Infineon Technologies (Germany). Apart from this, Airbiquity (US), Qualcomm (US), Visteon (US), Vodafone Group (UK), Microsoft Corporation (US), Alphabet Inc. (US), AT&T (US), Cloudmade (UK), Sierra Wireless (Canada) are among a few emerging companies in the automotive IoT market.
Research Coverage:
This research report categorizes the automotive IoT market on the basis of offering, connectivity form factor, communication type, application, and region. The report describes the major drivers, restraints, challenges, and opportunities pertaining to the automotive IoT market and forecasts the same till 2028. Apart from these, the report also consists of leadership mapping and analysis of all the companies included in the automotive IoT ecosystem.
Key Benefits of Buying the Report
The report will help the market leaders/new entrants in this market with information on the closest approximations of the revenue numbers for the overall automotive IoTmarket and the subsegments. This report will help stakeholders understand the competitive landscape and gain more insights to position their businesses better and to plan suitable go-to-market strategies. The report also helps stakeholders understand the pulse of the market and provides them with information on key market drivers, restraints, challenges, and opportunities.
The report provides insights on the following pointers:
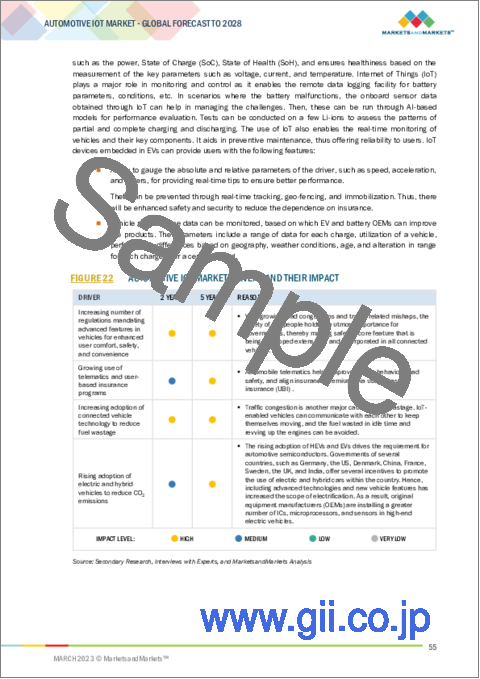
- Analysis of key drivers (Increasing number of regulations mandating advanced features in vehicles for enhanced user comfort, safety, and convenience, Growing use of telematics and user-based insurance programs, Increasing adoption of connected vehicle technology to reduce fuel wastage, Rising adoption of electric and hybrid vehicles to reduce CO2 emissions), restraints (Lack of infrastructure for proper functioning of connected vehicles, Additional cost burden on consumers), opportunities (Emergence of various technologies such as 5G and AI, Ongoing technological developments in autonomous vehicles, Integration of predictive maintenance platform with vehicles) ), and challenges (Threats associated with cybersecurity) influencing the growth of the automotive IoT market.
- Product Development/Innovation: Detailed insights on upcoming technologies, research & development activities, and new product & service launches in the automotive IoT market
- Market Development: Comprehensive information about lucrative markets - the report analyses the automotive IoT market across varied regions
- Market Diversification: Exhaustive information about new products & services, untapped geographies, recent developments, and investments in the automotive IoT market
- Competitive Assessment: In-depth assessment of market shares, growth strategies and service offerings of leading players like NXP Semiconductors (Netherlands), Harman (US), Robert Bosch (Germany), Thales (France), TomTom International (Netherlands), IBM (US), Geotab Inc. (Canada), Texas Instruments (US),among others in the automotive IoT market
TABLE OF CONTENTS
1 INTRODUCTION
- 1.1 STUDY OBJECTIVES
- 1.2 MARKET DEFINITION
- 1.3 STUDY SCOPE
- 1.3.1 MARKETS COVERED
- FIGURE 1 AUTOMOTIVE IOT MARKET SEGMENTATION
- 1.3.2 AUTOMOTIVE IOT MARKET: INCLUSIONS AND EXCLUSIONS
- 1.3.3 REGIONAL SCOPE
- 1.3.4 YEARS CONSIDERED
- 1.4 CURRENCY CONSIDERED
- TABLE 1 AVERAGE EXCHANGE RATES FOR EUROS TO USD CONVERSION
- 1.5 UNITS CONSIDERED
- 1.6 STAKEHOLDERS
- 1.7 SUMMARY OF CHANGES
2 RESEARCH METHODOLOGY
- 2.1 RESEARCH DATA
- FIGURE 2 AUTOMOTIVE IOT MARKET: RESEARCH DESIGN
- 2.1.1 SECONDARY DATA
- 2.1.1.1 List of key secondary sources
- 2.1.1.2 Key data from secondary sources
- 2.1.2 PRIMARY DATA
- 2.1.2.1 Primary interviews with experts
- 2.1.2.2 Breakdown of primaries
- 2.1.3 SECONDARY AND PRIMARY RESEARCH
- 2.1.3.1 Key industry insights
- 2.2 MARKET SIZE ESTIMATION
- FIGURE 3 MARKET SIZE ESTIMATION METHODOLOGY: REVENUE OF MARKET PLAYERS
- 2.2.1 BOTTOM-UP APPROACH
- 2.2.1.1 Approach to arrive at market size by bottom-up analysis (demand side)
- FIGURE 4 MARKET SIZE ESTIMATION METHODOLOGY: BOTTOM-UP APPROACH
- 2.2.2 TOP-DOWN APPROACH
- 2.2.2.1 Approach to arrive at market size by top-down analysis (supply side)
- FIGURE 5 MARKET SIZE ESTIMATION METHODOLOGY: TOP-DOWN APPROACH
- 2.3 DATA TRIANGULATION
- FIGURE 6 DATA TRIANGULATION
- 2.4 RESEARCH ASSUMPTIONS
- 2.5 RISK ASSESSMENT
- 2.5.1 ASSUMPTIONS RELATED TO RECESSION
- 2.6 LIMITATIONS
3 EXECUTIVE SUMMARY
- 3.1 RECESSION ANALYSIS
- FIGURE 7 GDP GROWTH PROJECTION FOR MAJOR ECONOMIES TILL 2023
- 3.2 GROWTH RATE ASSUMPTIONS/GROWTH FORECAST
- FIGURE 8 SERVICES SEGMENT TO GROW AT HIGHEST CAGR DURING FORECAST PERIOD
- FIGURE 9 INTEGRATED CONNECTIVITY FORM FACTOR SEGMENT TO REGISTER HIGHEST CAGR DURING FORECAST PERIOD
- FIGURE 10 VEHICLE-TO-VEHICLE COMMUNICATION SEGMENT TO WITNESS HIGHEST GROWTH DURING FORECAST PERIOD
- FIGURE 11 NAVIGATION APPLICATION TO ACCOUNT FOR LARGEST MARKET SHARE DURING FORECAST PERIOD
- FIGURE 12 NORTH AMERICA ACCOUNTED FOR LARGEST SHARE OF AUTOMOTIVE IOT MARKET IN 2022
4 PREMIUM INSIGHTS
- 4.1 ATTRACTIVE MARKET OPPORTUNITIES FOR PLAYERS IN AUTOMOTIVE IOT MARKET
- FIGURE 13 GROWING DEMAND FOR NAVIGATION AND INFOTAINMENT APPLICATIONS TO CONTRIBUTE TO MARKET GROWTH
- 4.2 AUTOMOTIVE IOT MARKET, BY OFFERING
- FIGURE 14 SOFTWARE SEGMENT TO HOLD LARGEST SHARE OF AUTOMOTIVE IOT MARKET BETWEEN 2023 AND 2028
- 4.3 AUTOMOTIVE IOT MARKET, BY APPLICATION
- FIGURE 15 INFOTAINMENT APPLICATION HELD LARGEST SIZE OF AUTOMOTIVE IOT MARKET IN 2022
- 4.4 AUTOMOTIVE IOT MARKET, BY CONNECTIVITY FORM FACTOR
- FIGURE 16 INTEGRATED SEGMENT REGISTERED HIGHEST CAGR IN AUTOMOTIVE IOT MARKET IN 2022
- 4.5 AUTOMOTIVE IOT MARKET, BY REGION
- FIGURE 17 AUTOMOTIVE IOT MARKET TO GROW AT HIGHEST CAGR IN ASIA PACIFIC DURING FORECAST PERIOD
- 4.6 ASIA PACIFIC: AUTOMOTIVE IOT MARKET, BY COUNTRY AND FORM FACTOR
- FIGURE 18 AUTOMOTIVE IOT MARKET IN ASIA PACIFIC, BY COUNTRY AND FORM FACTOR
- 4.7 AUTOMOTIVE IOT MARKET, BY COUNTRY
- FIGURE 19 CHINA TO RECORD HIGHEST CAGR IN AUTOMOTIVE IOT MARKET DURING FORECAST PERIOD
5 MARKET OVERVIEW
- 5.1 INTRODUCTION
- 5.2 MARKET DYNAMICS
- FIGURE 20 AUTOMOTIVE IOT MARKET: DRIVERS, RESTRAINTS, OPPORTUNITIES, AND CHALLENGES
- 5.2.1 DRIVERS
- 5.2.1.1 Increasing number of regulations mandating advanced features in vehicles for enhanced user comfort, safety, and convenience
- 5.2.1.2 Growing use of telematics and user-based insurance programs
- FIGURE 21 AUTOMOTIVE TELEMATICS MARKET, 2022 VS. 2027
- 5.2.1.3 Increasing adoption of connected vehicle technology to reduce fuel wastage
- 5.2.1.4 Rising adoption of electric and hybrid vehicles to reduce CO2 emissions
- FIGURE 22 AUTOMOTIVE IOT MARKET DRIVERS AND THEIR IMPACT
- 5.2.2 RESTRAINTS
- 5.2.2.1 Lack of infrastructure for proper functioning of connected vehicles
- 5.2.2.2 Additional cost burden on consumers
- FIGURE 23 AUTOMOTIVE IOT MARKET RESTRAINTS AND THEIR IMPACT
- 5.2.3 OPPORTUNITIES
- 5.2.3.1 Emergence of technologies such as 5G and AI
- 5.2.3.2 Ongoing technological developments in autonomous vehicles
- 5.2.3.3 Integration of predictive maintenance platform with vehicles
- FIGURE 24 AUTOMOTIVE IOT MARKET OPPORTUNITIES AND THEIR IMPACT
- 5.2.4 CHALLENGES
- 5.2.4.1 Threats associated with cybersecurity
- FIGURE 25 AUTOMOTIVE IOT MARKET CHALLENGES AND THEIR IMPACT
- 5.3 VALUE CHAIN ANALYSIS
- 5.3.1 RESEARCH & DEVELOPMENT
- 5.3.2 COMPONENT MANUFACTURING & ASSEMBLY
- 5.3.3 SOFTWARE INTEGRATION
- 5.3.4 DISTRIBUTION AND SUPPLY
- 5.3.5 MARKETING AND SALES
- 5.3.6 POST-SALES SERVICES
- 5.4 ECOSYSTEM/MARKET MAP
- TABLE 2 PLAYERS AND THEIR ROLE IN ECOSYSTEM
- 5.5 KEY STAKEHOLDERS AND BUYING CRITERIA
- 5.5.1 KEY STAKEHOLDERS IN BUYING PROCESS
- FIGURE 26 INFLUENCE OF STAKEHOLDERS ON BUYING PROCESS FOR TOP THREE APPLICATIONS
- TABLE 3 INFLUENCE OF STAKEHOLDERS ON BUYING PROCESS FOR TOP THREE APPLICATIONS (%)
- 5.5.2 BUYING CRITERIA
- FIGURE 27 KEY BUYING CRITERIA FOR TOP THREE APPLICATIONS
- TABLE 4 KEY BUYING CRITERIA FOR TOP THREE APPLICATIONS
- 5.6 PORTER'S FIVE FORCES ANALYSIS
- TABLE 5 IMPACT OF PORTER'S FIVE FORCES ON AUTOMOTIVE IOT MARKET
- FIGURE 28 AUTOMOTIVE IOT MARKET: PORTER'S FIVE FORCES ANALYSIS
- 5.6.1 INTENSITY OF COMPETITIVE RIVALRY
- 5.6.2 BARGAINING POWER OF SUPPLIERS
- 5.6.3 BARGAINING POWER OF BUYERS
- 5.6.4 THREAT OF SUBSTITUTES
- 5.6.5 THREAT OF NEW ENTRANTS
- 5.7 CASE STUDY ANALYSIS
- 5.7.1 HONDA CARS INDIA IMPROVES CUSTOMER CONNECTION AND SERVICES WITH IOT AND CLOUD
- 5.7.2 BMW MOTORRAD PROVIDES RIDERS WITH CUSTOM BUILT-IN NAVIGATION EXPERIENCE WITH HELP OF TOMTOM
- 5.7.3 TOMTOM DELIVERED PRECISE HD MAPPING SOLUTION IN COLLABORATION WITH HELLA AGLAIA FOR AUTOMATED DRIVING
- 5.7.4 IBM HELPS AUDI WITH REAL-TIME VEHICLE TRACKING
- 5.7.5 ALLGO EMBEDDED DEVELOPED PLATFORM FOR FUTURISTIC CAR INFOTAINMENT DEMONSTRATION
- 5.8 TRENDS/DISRUPTIONS IMPACTING BUSINESS OF MARKET PLAYERS AND RAW MATERIAL SUPPLIERS
- FIGURE 29 REVENUE SHIFTS AND NEW REVENUE POCKETS FOR AUTOMOTIVE IOT PLAYERS
- 5.9 TECHNOLOGY ANALYSIS
- 5.9.1 KEY TECHNOLOGIES
- 5.9.1.1 Advancements in infotainment systems
- 5.9.1.2 Adoption of cloud technology
- 5.9.2 ADJACENT TECHNOLOGY
- 5.9.2.1 Future of automotive displays
- 5.9.1 KEY TECHNOLOGIES
- 5.10 PATENT ANALYSIS
- TABLE 6 NUMBER OF PATENTS REGISTERED IN AUTOMOTIVE IOT MARKET FROM 2012 TO 2022
- FIGURE 30 TOP 10 COMPANIES WITH HIGHEST NUMBER OF PATENT APPLICATIONS BETWEEN 2012 AND 2022
- FIGURE 31 AUTOMOTIVE IOT PATENTS ISSUED BETWEEN 2012 AND 2022
- TABLE 7 PATENT REGISTRATIONS RELATED TO AUTOMOTIVE IOT MARKET
- 5.11 TRADE ANALYSIS
- 5.11.1 IMPORT SCENARIO
- 5.11.1.1 Import scenario for semiconductor ICs
- TABLE 8 IMPORT DATA, BY COUNTRY, 2017-2021 (USD MILLION)
- 5.11.2 EXPORT SCENARIO
- 5.11.2.1 Export scenario for semiconductor ICs
- TABLE 9 EXPORT DATA, BY COUNTRY, 2017-2021 (USD MILLION)
- 5.11.1 IMPORT SCENARIO
- 5.12 TARIFFS
- TABLE 10 MFN TARIFFS FOR PARTS OF ELECTRONIC CIRCUITS EXPORTED BY US
- TABLE 11 MFN TARIFFS FOR PARTS OF ELECTRONIC CIRCUITS EXPORTED BY CHINA
- 5.13 REGULATORY STANDARDS
- 5.13.1 REGULATORY COMPLIANCE
- 5.13.1.1 Standards
- TABLE 12 NORTH AMERICA: REGULATORY BODIES, GOVERNMENT AGENCIES, AND OTHER ORGANIZATIONS
- TABLE 13 EUROPE: REGULATORY BODIES, GOVERNMENT AGENCIES, AND OTHER ORGANIZATIONS
- TABLE 14 ASIA PACIFIC: REGULATORY BODIES, GOVERNMENT AGENCIES, AND OTHER ORGANIZATIONS
- TABLE 15 ROW: REGULATORY BODIES, GOVERNMENT AGENCIES, AND OTHER ORGANIZATIONS
- 5.13.1 REGULATORY COMPLIANCE
- 5.14 KEY CONFERENCES AND EVENTS, 2023-2024
- TABLE 16 AUTOMOTIVE IOT MARKET: DETAILED LIST OF CONFERENCES AND EVENTS
- 5.15 PRICING ANALYSIS
- TABLE 17 PRICING OF AUTOMOTIVE IOT HARDWARE COMPONENTS
- FIGURE 32 AVERAGE SELLING PRICE FORECAST FOR AUTOMOTIVE IOT HARDWARE COMPONENTS
- 5.15.1 AVERAGE SELLING PRICE OF AUTOMOTIVE IOT HARDWARE COMPONENTS OFFERED BY MARKET PLAYERS
- FIGURE 33 AVERAGE SELLING PRICE OF AUTOMOTIVE IOT HARDWARE COMPONENTS OFFERED BY KEY PLAYERS
- TABLE 18 AVERAGE SELLING PRICE OF AUTOMOTIVE IOT HARDWARE COMPONENTS OFFERED BY KEY PLAYERS
6 AUTOMOTIVE IOT MARKET, BY OFFERING
- 6.1 INTRODUCTION
- FIGURE 34 SERVICES SEGMENT TO EXHIBIT HIGHEST GROWTH RATE BETWEEN 2023 AND 2028
- TABLE 19 AUTOMOTIVE IOT MARKET, BY OFFERING, 2019-2022 (USD BILLION)
- TABLE 20 AUTOMOTIVE IOT MARKET, BY OFFERING, 2023-2028 (USD BILLION)
- 6.2 HARDWARE
- TABLE 21 HARDWARE: AUTOMOTIVE IOT MARKET, BY TYPE, 2019-2022 (USD BILLION)
- TABLE 22 HARDWARE: AUTOMOTIVE IOT MARKET, BY TYPE, 2023-2028 (USD BILLION)
- 6.2.1 SEMICONDUCTOR COMPONENTS
- 6.2.1.1 Microcontrollers
- 6.2.1.1.1 Control and monitor electronic systems
- 6.2.1.2 Field programmable gate arrays (FPGAs)
- 6.2.1.2.1 Handle data input from multiple sensors in autonomous vehicles
- 6.2.1.2.2 Use case: Velodyne's Lidar solutions use Xilinx FPGAs as key components
- 6.2.1.3 Digital signal processors (DSPs)
- 6.2.1.3.1 Focus on computation-intensive functions encountered in transmitting and manipulating digital signals
- 6.2.1.3.2 Use case: CEVA's high-performance DSP solution powers Renesas' next-generation automotive System-on-chip (SoC)
- 6.2.1.4 Memory chips
- 6.2.1.4.1 Facilitate incorporation of advanced electronics for in-vehicle entertainment and connectivity in vehicles
- 6.2.1.4.2 Use case: Mobileye selected Micron Technology to advance development of its fifth-generation autonomous driving platform
- 6.2.1.1 Microcontrollers
- TABLE 23 HARDWARE: AUTOMOTIVE IOT MARKET, BY SEMICONDUCTOR COMPONENT, 2019-2022 (USD BILLION)
- TABLE 24 HARDWARE: AUTOMOTIVE IOT MARKET, BY SEMICONDUCTOR COMPONENT, 2023-2028 (USD BILLION)
- TABLE 25 HARDWARE: AUTOMOTIVE IOT MARKET, BY SEMICONDUCTOR COMPONENT, 2019-2022 (MILLION UNITS)
- TABLE 26 HARDWARE: AUTOMOTIVE IOT MARKET, BY SEMICONDUCTOR COMPONENT, 2023-2028 (MILLION UNITS)
- 6.2.2 CONNECTIVITY TECHNOLOGY ICS
- TABLE 27 HARDWARE: AUTOMOTIVE IOT MARKET, BY CONNECTIVITY TECHNOLOGY ICS, 2019-2022 (USD BILLION)
- TABLE 28 HARDWARE: AUTOMOTIVE IOT MARKET, BY CONNECTIVITY TECHNOLOGY ICS, 2023-2028 (USD BILLION)
- TABLE 29 HARDWARE: AUTOMOTIVE IOT MARKET, BY CONNECTIVITY COMPONENT, 2019-2022 (MILLION UNITS)
- TABLE 30 HARDWARE: AUTOMOTIVE IOT MARKET, BY CONNECTIVITY COMPONENT, 2023-2028 (MILLION UNITS)
- 6.2.2.1 Cellular
- 6.2.2.1.1 Cellular connectivity technology to dominate market during forecast period
- 6.2.2.2 Wi-Fi
- 6.2.2.2.1 Wi-Fi connectivity technology to exhibit highest growth during forecast period
- 6.2.2.3 Bluetooth
- 6.2.2.3.1 Bluetooth smart ideal for automotive IoT applications
- 6.2.2.4 Others
- 6.2.2.1 Cellular
- 6.3 SOFTWARE
- TABLE 31 SOFTWARE: AUTOMOTIVE IOT MARKET, BY OFFERING, 2019-2022 (USD BILLION)
- TABLE 32 SOFTWARE: AUTOMOTIVE IOT MARKET, BY OFFERING, 2023-2028 (USD BILLION)
- 6.3.1 PLATFORMS
- 6.3.1.1 Device management platform
- 6.3.1.1.1 Manages data transmitted by IoT devices
- 6.3.1.2 Application management platform
- 6.3.1.2.1 Helps to manage application operations throughout lifecycle
- 6.3.1.3 Network management platform
- 6.3.1.3.1 Provides common platforms to manage networks of vehicles
- 6.3.1.1 Device management platform
- 6.3.2 SOLUTIONS
- 6.3.2.1 Real-time streaming analytics
- 6.3.2.1.1 Processing and analysis of fast-moving live data from various sources
- 6.3.2.2 Security solutions
- 6.3.2.2.1 Designed to safeguard connected devices, data, and all components of IoT platforms
- 6.3.2.3 Data management
- 6.3.2.3.1 Helps detect pre-failure conditions, avoid malfunctions, and reduce cost of car maintenance
- 6.3.2.4 Remote monitoring systems
- 6.3.2.4.1 Allow to track, trace, and monitor vehicles in real time
- 6.3.2.5 Network bandwidth management
- 6.3.2.5.1 Ensures performance and availability of servers and entire vehicular network
- 6.3.2.1 Real-time streaming analytics
- 6.4 SERVICES
- TABLE 33 SERVICES: AUTOMOTIVE IOT MARKET, BY TYPE, 2019-2022 (USD BILLION)
- TABLE 34 SERVICES: AUTOMOTIVE IOT MARKET, BY TYPE, 2023-2028 (USD BILLION)
- 6.4.1 DEPLOYMENT & INTEGRATION SERVICES
- 6.4.1.1 Deployment and integration services to hold larger market share during forecast period
- 6.4.2 SUPPORT & MAINTENANCE SERVICES
- 6.4.2.1 Help lower risk, reduce complexity, and raise return on investment
7 AUTOMOTIVE IOT MARKET, BY CONNECTIVITY FORM FACTOR
- 7.1 INTRODUCTION
- FIGURE 35 AUTOMOTIVE IOT MARKET, BY CONNECTIVITY FORM FACTOR
- FIGURE 36 EMBEDDED SEGMENT TO HOLD LARGEST SIZE OF AUTOMOTIVE IOT MARKET BETWEEN 2023 AND 2028
- TABLE 35 AUTOMOTIVE IOT MARKET, BY CONNECTIVITY FORM FACTOR, 2019-2022 (USD BILLION)
- TABLE 36 AUTOMOTIVE IOT MARKET, BY CONNECTIVITY FORM FACTOR, 2023-2028 (USD BILLION)
- 7.2 EMBEDDED
- 7.2.1 REDUCTION IN PRICE OF SERVICE PLANS TO FUEL DEMAND FOR EMBEDDED CONNECTIVITY
- TABLE 37 EMBEDDED: AUTOMOTIVE IOT MARKET, BY APPLICATION, 2019-2022 (USD BILLION)
- TABLE 38 EMBEDDED: AUTOMOTIVE IOT MARKET, BY APPLICATION, 2023-2028 (USD BILLION)
- TABLE 39 EMBEDDED: AUTOMOTIVE IOT MARKET, BY COMMUNICATION TYPE, 2019-2022 (USD BILLION)
- TABLE 40 EMBEDDED: AUTOMOTIVE IOT MARKET, BY COMMUNICATION TYPE, 2023-2028 (USD BILLION)
- TABLE 41 EMBEDDED: AUTOMOTIVE IOT MARKET, BY REGION, 2019-2022 (USD BILLION)
- TABLE 42 EMBEDDED: AUTOMOTIVE IOT MARKET, BY REGION, 2023-2028 (USD BILLION)
- 7.3 TETHERED
- 7.3.1 LOWER PRICE OF TETHERED SYSTEMS LIKELY TO CONTRIBUTE TO THEIR DEMAND DURING FORECAST PERIOD
- 7.3.1.1 Use case: Tethered IoT platform for Tata Motors connected vehicles
- TABLE 43 TETHERED: AUTOMOTIVE IOT MARKET, BY APPLICATION, 2019-2022 (USD BILLION)
- TABLE 44 TETHERED: AUTOMOTIVE IOT MARKET, BY APPLICATION, 2023-2028 (USD BILLION)
- TABLE 45 TETHERED: AUTOMOTIVE IOT MARKET, BY COMMUNICATION TYPE, 2019-2022 (USD BILLION)
- TABLE 46 TETHERED: AUTOMOTIVE IOT MARKET, BY COMMUNICATION TYPE, 2023-2028 (USD BILLION)
- TABLE 47 TETHERED: AUTOMOTIVE IOT MARKET, BY REGION, 2019-2022 (USD MILLION)
- TABLE 48 TETHERED: AUTOMOTIVE IOT MARKET, BY REGION, 2023-2028 (USD MILLION)
- 7.3.1 LOWER PRICE OF TETHERED SYSTEMS LIKELY TO CONTRIBUTE TO THEIR DEMAND DURING FORECAST PERIOD
- 7.4 INTEGRATED
- 7.4.1 INCREASED PENETRATION OF SMARTPHONES TO INDUCE DEMAND FOR INTEGRATED FORM FACTOR
- TABLE 49 INTEGRATED: AUTOMOTIVE IOT MARKET, BY APPLICATION, 2019-2022 (USD BILLION)
- TABLE 50 INTEGRATED: AUTOMOTIVE IOT MARKET, BY APPLICATION, 2023-2028 (USD BILLION)
- TABLE 51 INTEGRATED: AUTOMOTIVE IOT MARKET, BY COMMUNICATION TYPE, 2019-2022 (USD BILLION)
- TABLE 52 INTEGRATED: AUTOMOTIVE IOT MARKET, BY COMMUNICATION TYPE, 2023-2028 (USD BILLION)
- TABLE 53 INTEGRATED: AUTOMOTIVE IOT MARKET, BY REGION, 2019-2022 (USD BILLION)
- TABLE 54 INTEGRATED: AUTOMOTIVE IOT MARKET, BY REGION, 2023-2028 (USD BILLION)
8 AUTOMOTIVE IOT MARKET, COMMUNICATION TYPE
- 8.1 INTRODUCTION
- FIGURE 37 AUTOMOTIVE IOT MARKET, BY COMMUNICATION TYPE
- FIGURE 38 VEHICLE-TO-VEHICLE COMMUNICATION SEGMENT EXPECTED TO GROW AT HIGHEST RATE BETWEEN 2023 AND 2028
- TABLE 55 AUTOMOTIVE IOT MARKET, BY COMMUNICATION TYPE, 2019-2022 (USD BILLION)
- TABLE 56 AUTOMOTIVE IOT MARKET, BY COMMUNICATION TYPE, 2023-2028 (USD BILLION)
- 8.2 IN-VEHICLE COMMUNICATION
- 8.2.1 IN-VEHICLE COMMUNICATION SEGMENT HELD LARGEST MARKET SHARE IN 2022
- 8.2.1.1 Use case: Honda Motors incorporated integrated in-vehicle connected services offered by Google for customers in North America
- TABLE 57 IN-VEHICLE COMMUNICATION: AUTOMOTIVE IOT MARKET, BY REGION, 2019-2022 (USD BILLION)
- TABLE 58 IN-VEHICLE COMMUNICATION: AUTOMOTIVE IOT MARKET, BY REGION, 2023-2028 (USD BILLION)
- 8.2.1 IN-VEHICLE COMMUNICATION SEGMENT HELD LARGEST MARKET SHARE IN 2022
- 8.3 VEHICLE-TO-VEHICLE COMMUNICATION
- 8.3.1 MARKET FOR VEHICLE-TO-VEHICLE COMMUNICATION TO EXHIBIT HIGHEST GROWTH DURING FORECAST PERIOD
- 8.3.1.1 Use case: Implementation of Ambulance Alerting System based on V2V communication
- TABLE 59 VEHICLE-TO-VEHICLE COMMUNICATION: AUTOMOTIVE IOT MARKET, BY REGION, 2019-2022 (USD BILLION)
- TABLE 60 VEHICLE-TO-VEHICLE COMMUNICATION: AUTOMOTIVE IOT MARKET, BY REGION, 2023-2028 (USD BILLION)
- 8.3.1 MARKET FOR VEHICLE-TO-VEHICLE COMMUNICATION TO EXHIBIT HIGHEST GROWTH DURING FORECAST PERIOD
- 8.4 VEHICLE-TO-INFRASTRUCTURE COMMUNICATION
- 8.4.1 ENABLES SEVERAL VEHICLES TO SHARE INFORMATION WITH VARIOUS DEVICES
- 8.4.1.1 Use case: Vodafone assists in facilitating vehicle-to-infrastructure (V2I) communication for providing parking assistance and anti-theft functions
- TABLE 61 VEHICLE-TO-INFRASTRUCTURE COMMUNICATION: AUTOMOTIVE IOT MARKET, BY REGION, 2019-2022 (USD BILLION)
- TABLE 62 VEHICLE-TO-INFRASTRUCTURE COMMUNICATION: AUTOMOTIVE IOT MARKET, BY REGION, 2023-2028 (USD BILLION)
- 8.4.1 ENABLES SEVERAL VEHICLES TO SHARE INFORMATION WITH VARIOUS DEVICES
9 AUTOMOTIVE IOT MARKET, BY APPLICATION
- 9.1 INTRODUCTION
- FIGURE 39 AUTOMOTIVE IOT MARKET, BY APPLICATION
- FIGURE 40 NAVIGATION APPLICATION EXPECTED TO GROW AT HIGHEST RATE BETWEEN 2023 AND 2028
- TABLE 63 AUTOMOTIVE IOT MARKET, BY APPLICATION, 2019-2022 (USD BILLION)
- TABLE 64 AUTOMOTIVE IOT MARKET, BY APPLICATION, 2023-2028 (USD BILLION)
- 9.2 NAVIGATION
- 9.2.1 USE CASE: TOMTOM NAVIGATION SDK POWERED PTV GROUP'S (GERMANY) TRUCK NAVIGATION APPLICATION
- TABLE 65 NAVIGATION: AUTOMOTIVE IOT MARKET, BY TYPE, 2019-2022 (USD BILLION)
- TABLE 66 NAVIGATION: AUTOMOTIVE IOT MARKET, BY TYPE, 2023-2028 (USD BILLION)
- 9.2.2 REAL-TIME DATA CAPTURE
- 9.2.2.1 Real-time data capture navigation application to exhibit higher growth during forecast period
- 9.2.2.2 Use case: Hyundai Motor Group (HMG) selected TomTom navigation offerings to capture real-time data
- 9.2.3 ROAD & VEHICLE MONITORING
- 9.2.3.1 Includes managing data available through controller area network (CAN) or other vehicle internal bus systems
- 9.2.3.2 Use case: GreenMile integrated TomTom Map APIs into its solutions to facilitate vehicle monitoring and real-time route planning
- 9.2.3.3 Use case: Implementation of system for monitoring of vehicles
- TABLE 67 NAVIGATION: AUTOMOTIVE IOT MARKET, BY CONNECTIVITY FORM FACTOR, 2019-2022 (USD BILLION)
- TABLE 68 NAVIGATION: AUTOMOTIVE IOT MARKET, BY CONNECTIVITY FORM FACTOR, 2023-2028 (USD BILLION)
- TABLE 69 NAVIGATION: AUTOMOTIVE IOT MARKET, BY REGION, 2019-2022 (USD BILLION)
- TABLE 70 NAVIGATION: AUTOMOTIVE IOT MARKET, BY REGION, 2023-2028 (USD BILLION)
- 9.3 TELEMATICS
- TABLE 71 TELEMATICS: AUTOMOTIVE IOT MARKET, BY TYPE, 2019-2022 (USD BILLION)
- TABLE 72 TELEMATICS: AUTOMOTIVE IOT MARKET, BY TYPE, 2023-2028 (USD BILLION)
- 9.3.1 FLEET & ASSET MANAGEMENT
- 9.3.1.1 Eliminate paperwork and reduce maintenance costs
- 9.3.1.2 Use case: Kent Central Ambulance Service adopted fleet management solution offered by TomTom Telematics
- 9.3.1.3 Use case: Wabco Holdings Inc. (US) acquired AssetTrackr (India) to expand its fleet management solutions business
- 9.3.2 INTELLIGENT TRAFFIC SYSTEM
- 9.3.2.1 Integral part of smart cities
- 9.3.2.2 Use case: Honda Motors uses IoT Telematics solutions from Bright Box
- 9.3.3 COLLISION AVOIDANCE
- 9.3.3.1 Alerts drivers about imminent crashes and can assist in braking and stopping vehicles
- 9.3.3.2 Use case: Driver safety solution developed by Affectiva and TomTom helps in collision avoidance
- 9.3.4 PARKING MANAGEMENT SYSTEM
- 9.3.4.1 Allows efficient use of on-street parking spaces or areas
- 9.3.5 PASSENGER INFORMATION SYSTEM
- 9.3.5.1 Provides information to public about status of transportation mediums
- 9.3.5.2 Use case: Tamil Nadu State Transport Corporation uses IoT-based passenger information system for crowd estimation
- 9.3.6 EMERGENCY VEHICLE NOTIFICATION
- 9.3.6.1 Designed to alert family members and emergency personnel about accidents
- 9.3.7 PREDICTIVE MAINTENANCE
- 9.3.7.1 Predicts ambient conditions, fuel consumption, and other factors critical for ideal performance
- 9.3.8 REMOTE MONITORING AND DIAGNOSTICS
- 9.3.8.1 Offer health and diagnosis report for vehicles through wireless networks
- TABLE 73 TELEMATICS: AUTOMOTIVE IOT MARKET, BY CONNECTIVITY FORM FACTOR, 2019-2022 (USD BILLION)
- TABLE 74 TELEMATICS: AUTOMOTIVE IOT MARKET, BY CONNECTIVITY FORM FACTOR, 2023-2028 (USD BILLION)
- TABLE 75 TELEMATICS: AUTOMOTIVE IOT MARKET, BY REGION, 2019-2022 (USD BILLION)
- TABLE 76 TELEMATICS: AUTOMOTIVE IOT MARKET, BY REGION, 2023-2028 (USD BILLION)
- 9.4 INFOTAINMENT
- TABLE 77 INFOTAINMENT: AUTOMOTIVE IOT MARKET, BY TYPE, 2019-2022 (USD BILLION)
- TABLE 78 INFOTAINMENT: AUTOMOTIVE IOT MARKET, BY TYPE, 2023-2028 (USD BILLION)
- 9.4.1 ENTERTAINMENT
- 9.4.1.1 Focus on rear seat entertainment to create demand for automotive IoT
- 9.4.2 COMMUNICATION
- 9.4.2.1 Enables consumers to seamlessly interconnect their smartphones or network devices to their vehicles
- TABLE 79 INFOTAINMENT: AUTOMOTIVE IOT MARKET, BY CONNECTIVITY FORM FACTOR, 2019-2022 (USD BILLION)
- TABLE 80 INFOTAINMENT: AUTOMOTIVE IOT MARKET, BY CONNECTIVITY FORM FACTOR, 2023-2028 (USD BILLION)
- TABLE 81 INFOTAINMENT: AUTOMOTIVE IOT MARKET, BY REGION, 2019-2022 (USD BILLION)
- TABLE 82 INFOTAINMENT: AUTOMOTIVE IOT MARKET, BY REGION, 2023-2028 (USD BILLION)
10 AUTOMOTIVE IOT MARKET, BY REGION
- 10.1 INTRODUCTION
- FIGURE 41 AUTOMOTIVE IOT MARKET, BY REGION
- TABLE 83 AUTOMOTIVE IOT MARKET, BY REGION, 2019-2022 (USD BILLION)
- TABLE 84 AUTOMOTIVE IOT MARKET, BY REGION, 2023-2028 (USD BILLION)
- 10.2 NORTH AMERICA
- 10.2.1 IMPACT OF RECESSION ON NORTH AMERICA
- FIGURE 42 NORTH AMERICA: AUTOMOTIVE IOT MARKET SNAPSHOT
- TABLE 85 NORTH AMERICA: AUTOMOTIVE IOT MARKET, BY COUNTRY, 2019-2022 (USD BILLION)
- TABLE 86 NORTH AMERICA: AUTOMOTIVE IOT MARKET, BY COUNTRY, 2023-2028 (USD BILLION)
- 10.2.2 US
- 10.2.2.1 US accounted for largest share of North American automotive IoT market in 2022
- 10.2.2.2 Use case: Honda Motors incorporated integrated in-vehicle connected services offered by Google for its customers in North America
- 10.2.3 CANADA
- 10.2.3.1 Growing popularity of mobile broadband access in vehicles to drive demand for automotive IoT solutions
- 10.2.3.2 Use case: Public vehicles in Wellington County, Ontario (Canada), integrated with telematics solution from Geotab
- 10.2.4 MEXICO
- 10.2.4.1 Presence of established automotive manufacturing base to support market growth
- 10.2.4.2 Use case: Telefonica Mexico offers unlimited connected car data via General Motors' OnStar platform
- TABLE 87 NORTH AMERICA: AUTOMOTIVE IOT MARKET, BY CONNECTIVITY FORM FACTOR, 2019-2022 (USD BILLION)
- TABLE 88 NORTH AMERICA: AUTOMOTIVE IOT MARKET, BY CONNECTIVITY FORM FACTOR, 2023-2028 (USD BILLION)
- TABLE 89 NORTH AMERICA: AUTOMOTIVE IOT MARKET, BY APPLICATION, 2019-2022 (USD BILLION)
- TABLE 90 NORTH AMERICA: AUTOMOTIVE IOT MARKET, BY APPLICATION, 2023-2028 (USD BILLION)
- 10.3 EUROPE
- 10.3.1 IMPACT OF RECESSION ON EUROPE
- FIGURE 43 EUROPE: AUTOMOTIVE IOT MARKET SNAPSHOT
- TABLE 91 EUROPE: AUTOMOTIVE IOT MARKET, BY COUNTRY, 2019-2022 (USD BILLION)
- TABLE 92 EUROPE: AUTOMOTIVE IOT MARKET, BY COUNTRY, 2023-2028 (USD BILLION)
- 10.3.2 GERMANY
- 10.3.2.1 Increased R&D and government bill supporting automated driving to support market growth
- 10.3.2.2 Use case: TomTom Navigation SDK powers PTV Group's (Germany) new truck navigation application
- 10.3.3 UK
- 10.3.3.1 Premium and sports car manufacturers to support market growth
- 10.3.3.2 Use case: Volvo UK incorporated new vehicle tracking device
- 10.3.4 FRANCE
- 10.3.4.1 Significant investments in security technologies to drive market
- 10.3.4.2 Use case: COYOTE, in collaboration with Sigfox Network (France), implemented COYOTE Secure stolen vehicle recovery solution
- 10.3.5 ITALY
- 10.3.5.1 Presence of comprehensive intelligent traffic system infrastructure to drive market
- 10.3.5.2 Use case: DUEL (Italy) leveraged location and navigation services from TomTom to provide real-time traffic information in Italy
- 10.3.5.3 Use case: LoJack Italia brought enhanced telematics to ALD Automotive Italy
- 10.3.5.4 OCTO Telematics (Italy) leveraged Ford's connected vehicle data to enhance its telematics services
- TABLE 93 ITALY: AUTOMOTIVE IOT MARKET, BY APPLICATION, 2019-2022 (USD BILLION)
- TABLE 94 ITALY: AUTOMOTIVE IOT MARKET, BY APPLICATION, 2023-2028 (USD BILLION)
- TABLE 95 ITALY: AUTOMOTIVE IOT MARKET, BY TELEMATICS APPLICATION TYPE, 2019-2022 (USD MILLION)
- TABLE 96 ITALY: AUTOMOTIVE IOT MARKET, BY TELEMATICS APPLICATION TYPE, 2023-2028 (USD MILLION)
- TABLE 97 ITALY: AUTOMOTIVE IOT MARKET, BY CONNECTIVITY FORM FACTOR, 2019-2022 (USD BILLION)
- TABLE 98 ITALY: AUTOMOTIVE IOT MARKET, BY CONNECTIVITY FORM FACTOR, 2023-2028 (USD BILLION)
- TABLE 99 ITALY: AUTOMOTIVE IOT MARKET, BY OFFERING, 2019-2022 (USD BILLION)
- TABLE 100 ITALY: AUTOMOTIVE IOT MARKET, BY OFFERING, 2023-2028 (USD BILLION)
- TABLE 101 ITALY: AUTOMOTIVE IOT MARKET, BY COMMUNICATION TYPE, 2019-2022 (USD BILLION)
- TABLE 102 ITALY: AUTOMOTIVE IOT MARKET, BY COMMUNICATION TYPE, 2023-2028 (USD BILLION)
- TABLE 103 ITALY: AUTOMOTIVE IOT MARKET, BY VEHICLE TYPE, 2019-2022 (USD BILLION)
- TABLE 104 ITALY: AUTOMOTIVE IOT MARKET, BY VEHICLE TYPE, 2023-2028 (USD BILLION)
- TABLE 105 ITALY: PASSENGER CARS AUTOMOTIVE IOT MARKET, BY OFFERING, 2019-2022 (USD BILLION)
- TABLE 106 ITALY: PASSENGER CARS AUTOMOTIVE IOT MARKET, BY OFFERING, 2023-2028 (USD BILLION)
- TABLE 107 ITALY: COMMERCIAL VEHICLES AUTOMOTIVE IOT MARKET, BY OFFERING, 2019-2022 (USD MILLION)
- TABLE 108 ITALY: COMMERCIAL VEHICLES AUTOMOTIVE IOT MARKET, BY OFFERING, 2023-2028 (USD MILLION)
- TABLE 109 ITALY: PASSENGER CARS AUTOMOTIVE IOT MARKET, BY CONNECTIVITY FORM FACTOR, 2019-2022 (USD BILLION)
- TABLE 110 ITALY: PASSENGER CARS AUTOMOTIVE IOT MARKET, BY CONNECTIVITY FORM FACTOR, 2023-2028 (USD BILLION)
- TABLE 111 ITALY: COMMERCIAL VEHICLES AUTOMOTIVE IOT MARKET, BY CONNECTIVITY FORM FACTOR, 2019-2022 (USD MILLION)
- TABLE 112 ITALY: COMMERCIAL VEHICLES AUTOMOTIVE IOT MARKET, BY CONNECTIVITY FORM FACTOR, 2023-2028 (USD MILLION)
- TABLE 113 ITALY: PASSENGER CARS AUTOMOTIVE IOT MARKET, BY COMMUNICATION TYPE, 2019-2022 (USD BILLION)
- TABLE 114 ITALY: PASSENGER CARS AUTOMOTIVE IOT MARKET, BY COMMUNICATION TYPE, 2023-2028 (USD BILLION)
- TABLE 115 ITALY: COMMERCIAL VEHICLES AUTOMOTIVE IOT MARKET, BY COMMUNICATION TYPE, 2019-2022 (USD MILLION)
- TABLE 116 ITALY: COMMERCIAL VEHICLES AUTOMOTIVE IOT MARKET, BY COMMUNICATION TYPE, 2023-2028 (USD MILLION)
- TABLE 117 ITALY: PASSENGER CARS AUTOMOTIVE IOT MARKET, BY APPLICATION, 2019-2022 (USD BILLION)
- TABLE 118 ITALY: PASSENGER CARS AUTOMOTIVE IOT MARKET, BY APPLICATION, 2023-2028 (USD BILLION)
- TABLE 119 ITALY: COMMERCIAL VEHICLES AUTOMOTIVE IOT MARKET, BY APPLICATION, 2019-2022 (USD MILLION)
- TABLE 120 ITALY: COMMERCIAL VEHICLES AUTOMOTIVE IOT MARKET, BY APPLICATION, 2023-2028 (USD MILLION)
- 10.3.6 SPAIN
- 10.3.6.1 Adoption of AI and cognitive computing to accelerate market growth
- 10.3.6.2 Use case: Telefonica Espana collaborated with Spain's Directorate General for Traffic and SEAT on IoT road safety project
- 10.3.7 REST OF EUROPE
- 10.3.7.1 Use case: Bara Posten AB (Sweden) leverages Geotab's fleet telematics platform to deliver sustainable services
- TABLE 121 EUROPE: AUTOMOTIVE IOT MARKET, BY CONNECTIVITY FORM FACTOR, 2019-2022 (USD BILLION)
- TABLE 122 EUROPE: AUTOMOTIVE IOT MARKET, BY CONNECTIVITY FORM FACTOR, 2023-2028 (USD BILLION)
- TABLE 123 EUROPE: AUTOMOTIVE IOT MARKET, BY APPLICATION, 2019-2022 (USD BILLION)
- TABLE 124 EUROPE: AUTOMOTIVE IOT MARKET, BY APPLICATION, 2023-2028 (USD BILLION)
- 10.4 ASIA PACIFIC
- 10.4.1 IMPACT OF RECESSION ON ASIA PACIFIC
- FIGURE 44 ASIA PACIFIC: AUTOMOTIVE IOT MARKET SNAPSHOT
- TABLE 125 ASIA PACIFIC: AUTOMOTIVE IOT MARKET, BY COUNTRY, 2019-2022 (USD BILLION)
- TABLE 126 ASIA PACIFIC: AUTOMOTIVE IOT MARKET, BY COUNTRY, 2023-2028 (USD BILLION)
- 10.4.2 CHINA
- 10.4.2.1 5G rollout to foster market growth
- 10.4.2.2 Use case: Huawei Technologies (China) leverages navigation applications offered by TomTom
- 10.4.3 JAPAN
- 10.4.3.1 Need for real-time traffic information to propel demand for automotive IoT solutions
- 10.4.3.2 Use case: KDDI in Japan leverages Gemalto's connected cars and IoT solution
- 10.4.4 SOUTH KOREA
- 10.4.4.1 Government initiatives to introduce autonomous cars in South Korea to contribute to market growth
- 10.4.4.2 Use case: Hyundai Motor Group leverages maps and real-time traffic data provided by TomTom
- 10.4.5 INDIA
- 10.4.5.1 Demand for high-end navigation systems in India to foster market growth
- 10.4.5.2 Use case: MG Motor partnered with Jio India to incorporate Internet of Things (IoT) features in its upcoming mid-size SUV
- 10.4.6 REST OF ASIA PACIFIC
- 10.4.6.1 Use case: Toyota Motor Corporation Australia delivered connected vehicles with support from Intelematics
- TABLE 127 ASIA PACIFIC: AUTOMOTIVE IOT MARKET, BY CONNECTIVITY FORM FACTOR, 2019-2022 (USD BILLION)
- TABLE 128 ASIA PACIFIC: AUTOMOTIVE IOT MARKET, BY CONNECTIVITY FORM FACTOR, 2023-2028 (USD BILLION)
- TABLE 129 ASIA PACIFIC: AUTOMOTIVE IOT MARKET, BY APPLICATION, 2019-2022 (USD BILLION)
- TABLE 130 ASIA PACIFIC: AUTOMOTIVE IOT MARKET, BY APPLICATION, 2023-2028 (USD BILLION)
- 10.5 REST OF THE WORLD
- 10.5.1 IMPACT OF RECESSION ON REST OF THE WORLD
- FIGURE 45 REST OF THE WORLD: AUTOMOTIVE IOT MARKET SNAPSHOT
- 10.5.2 MIDDLE EAST & AFRICA
- 10.5.2.1 Government initiatives to introduce autonomous vehicles to favor market growth
- 10.5.3 SOUTH AMERICA
- 10.5.3.1 Demand for vehicle tracking and safety features to drive market
- 10.5.3.2 Use case: Hyundai Motors leveraged Vivo's IoT platform to launch its internet-based service in Brazil
- TABLE 131 REST OF THE WORLD: AUTOMOTIVE IOT MARKET, BY REGION, 2019-2022 (USD BILLION)
- TABLE 132 REST OF THE WORLD: AUTOMOTIVE IOT MARKET, BY REGION, 2023-2028 (USD BILLION)
- TABLE 133 REST OF THE WORLD: AUTOMOTIVE IOT MARKET, BY CONNECTIVITY FORM FACTOR, 2019-2022 (USD BILLION)
- TABLE 134 REST OF THE WORLD: AUTOMOTIVE IOT MARKET, BY CONNECTIVITY FORM FACTOR, 2023-2028 (USD BILLION)
- TABLE 135 REST OF THE WORLD: AUTOMOTIVE IOT MARKET, BY APPLICATION, 2019-2022 (USD BILLION)
- TABLE 136 REST OF THE WORLD: AUTOMOTIVE IOT MARKET, BY APPLICATION, 2023-2028 (USD BILLION)
11 COMPETITIVE LANDSCAPE
- 11.1 INTRODUCTION
- TABLE 137 AUTOMOTIVE IOT MARKET: KEY GROWTH STRATEGIES ADOPTED BY COMPANIES FROM 2021 TO 2023
- 11.2 REVENUE ANALYSIS
- FIGURE 46 FOUR-YEAR REVENUE ANALYSIS OF TOP FIVE PLAYERS IN AUTOMOTIVE IOT MARKET
- 11.3 MARKET SHARE ANALYSIS, 2022
- TABLE 138 AUTOMOTIVE IOT MARKET: DEGREE OF COMPETITION
- FIGURE 47 MARKET SHARE, 2022
- 11.4 COMPANY EVALUATION QUADRANT, 2022
- 11.4.1 STARS
- 11.4.2 EMERGING LEADERS
- 11.4.3 PERVASIVE PLAYERS
- 11.4.4 PARTICIPANTS
- FIGURE 48 AUTOMOTIVE IOT MARKET (GLOBAL): COMPANY EVALUATION QUADRANT, 2022
- 11.5 STARTUPS/SMES EVALUATION QUADRANT, 2022
- TABLE 139 STARTUPS/SMES IN AUTOMOTIVE MARKET
- 11.5.1 PROGRESSIVE COMPANIES
- 11.5.2 RESPONSIVE COMPANIES
- 11.5.3 DYNAMIC COMPANIES
- 11.5.4 STARTING BLOCKS
- FIGURE 49 AUTOMOTIVE IOT MARKET: STARTUPS/SMES EVALUATION QUADRANT, 2022
- TABLE 140 STARTUPS/SMES MATRIX: DETAILED LIST OF KEY STARTUPS
- 11.5.5 COMPETITIVE BENCHMARKING
- TABLE 141 COMPETITIVE BENCHMARKING OF KEY STARTUPS/SMES
- 11.6 COMPANY PRODUCT FOOTPRINT ANALYSIS
- TABLE 142 COMPANY PRODUCT FOOTPRINT
- TABLE 143 COMPANY OFFERING FOOTPRINT
- TABLE 144 COMPANY COMMUNICATION FOOTPRINT
- TABLE 145 COMPANY CONNECTIVITY FORM FACTOR FOOTPRINT
- TABLE 146 COMPANY APPLICATION FOOTPRINT
- TABLE 147 COMPANY REGION FOOTPRINT
- 11.7 COMPETITIVE SCENARIOS AND TRENDS
- 11.7.1 PRODUCT LAUNCHES
- TABLE 148 AUTOMOTIVE IOT MARKET: TOP PRODUCT LAUNCHES AND DEVELOPMENTS, JUNE 2019 TO JANUARY 2023
- 11.7.2 DEALS
- TABLE 149 AUTOMOTIVE IOT MARKET: TOP DEALS AND OTHER DEVELOPMENTS, JULY 2019 TO JANUARY 2023
12 COMPANY PROFILES
- 12.1 INTRODUCTION
- 12.2 KEY PLAYERS
(Business Overview, Products/Services/Solutions Offered, MnM View, Key Strengths and Right to Win, Strategic Choices Made, Weaknesses and Competitive Threats, Recent Developments)*
- 12.2.1 NXP SEMICONDUCTORS
- TABLE 150 NXP SEMICONDUCTORS: BUSINESS OVERVIEW
- FIGURE 50 NXP SEMICONDUCTORS: COMPANY SNAPSHOT
- TABLE 151 NXP SEMICONDUCTORS: PRODUCTS/SOLUTIONS/SERVICES OFFERED
- TABLE 152 NXP SEMICONDUCTORS: PRODUCT LAUNCHES
- TABLE 153 NXP SEMICONDUCTOR: DEALS
- 12.2.2 HARMAN
- TABLE 154 HARMAN: BUSINESS OVERVIEW
- FIGURE 51 HARMAN: COMPANY SNAPSHOT
- TABLE 155 HARMAN: PRODUCTS/SOLUTIONS/SERVICES OFFERED
- TABLE 156 HARMAN: PRODUCT LAUNCHES
- TABLE 157 HARMAN: DEALS
- 12.2.3 ROBERT BOSCH GMBH
- TABLE 158 ROBERT BOSCH: BUSINESS OVERVIEW
- FIGURE 52 ROBERT BOSCH: COMPANY SNAPSHOT
- TABLE 159 ROBERT BOSCH: PRODUCTS/SOLUTIONS/SERVICES OFFERED
- TABLE 160 ROBERT BOSCH: PRODUCT LAUNCHES
- TABLE 161 ROBERT BOSCH: DEALS
- 12.2.4 THALES
- TABLE 162 THALES: BUSINESS OVERVIEW
- FIGURE 53 THALES: COMPANY SNAPSHOT
- TABLE 163 THALES: PRODUCTS/SOLUTIONS/SERVICES OFFERED
- TABLE 164 THALES: PRODUCT LAUNCHES
- TABLE 165 THALES: DEALS
- 12.2.5 TOMTOM INTERNATIONAL
- TABLE 166 TOMTOM INTERNATIONAL.: BUSINESS OVERVIEW
- FIGURE 54 TOMTOM INTERNATIONAL: COMPANY SNAPSHOT
- TABLE 167 TOMTOM INTERNATIONAL: PRODUCTS/SOLUTIONS/SERVICES OFFERED
- TABLE 168 TOMTOM INTERNATIONAL: PRODUCT LAUNCHES
- TABLE 169 TOMTOM INTERNATIONAL B.V.: DEALS
- 12.2.6 TEXAS INSTRUMENTS INC.
- TABLE 170 TEXAS INSTRUMENTS INC.: BUSINESS OVERVIEW
- FIGURE 55 TEXAS INSTRUMENTS INC.: COMPANY SNAPSHOT
- TABLE 171 TEXAS INSTRUMENTS INC.: PRODUCTS/SOLUTIONS/SERVICES OFFERED
- TABLE 172 TEXAS INSTRUMENTS INC.: PRODUCT LAUNCHES
- TABLE 173 TEXAS INSTRUMENTS INC.: DEALS
- 12.2.7 INTEL CORPORATION
- TABLE 174 INTEL CORPORATION: BUSINESS OVERVIEW
- FIGURE 56 INTEL CORPORATION: COMPANY SNAPSHOT
- TABLE 175 INTEL CORPORATION: PRODUCTS/SOLUTIONS/SERVICES OFFERED
- TABLE 176 INTEL CORPORATION: PRODUCT LAUNCHES
- TABLE 177 INTEL CORPORATION: DEALS
- 12.2.8 IBM
- TABLE 178 IBM: BUSINESS OVERVIEW
- FIGURE 57 IBM: COMPANY SNAPSHOT
- TABLE 179 IBM: PRODUCTS/SOLUTIONS/SERVICES OFFERED
- TABLE 180 IBM: DEALS
- 12.2.9 GEOTAB INC.
- TABLE 181 GEOTAB INC.: BUSINESS OVERVIEW
- TABLE 182 GEOTAB INC.: PRODUCTS/SOLUTIONS/SERVICES OFFERED
- TABLE 183 GEOTAB INC.: PRODUCT LAUNCHES
- TABLE 184 GEOTAB INC.: DEALS
- 12.2.10 EUROTECH
- TABLE 185 EUROTECH: BUSINESS OVERVIEW
- FIGURE 58 EUROTECH: COMPANY SNAPSHOT
- TABLE 186 EUROTECH: PRODUCTS/SOLUTIONS/SERVICES OFFERED
- TABLE 187 EUROTECH: PRODUCT LAUNCHES
- TABLE 188 EUROTECH: DEALS
- 12.2.11 INFINEON TECHNOLOGIES
- TABLE 189 INFINEON TECHNOLOGIES: BUSINESS OVERVIEW
- FIGURE 59 INFINEON TECHNOLOGIES: COMPANY SNAPSHOT
- TABLE 190 INFINEON TECHNOLOGIES: PRODUCTS/SOLUTIONS/SERVICES OFFERED
- TABLE 191 INFINEON TECHNOLOGIES.: DEALS
- 12.2.12 STMICROELECTRONICS
- TABLE 192 STMICROELECTRONICS: BUSINESS OVERVIEW
- FIGURE 60 STMICROELECTRONICS: COMPANY SNAPSHOT
- TABLE 193 STMICROELECTRONICS: PRODUCTS/SOLUTIONS/SERVICES OFFERED
- TABLE 194 STMICROELECTRONICS: PRODUCT LAUNCHES
- TABLE 195 STMICROELECTRONICS: DEALS
- 12.2.13 RENESAS
- TABLE 196 RENESAS: BUSINESS OVERVIEW
- FIGURE 61 RENESAS: COMPANY SNAPSHOT
- TABLE 197 RENESAS: PRODUCTS/SOLUTIONS/SERVICES OFFERED
- TABLE 198 RENESAS: PRODUCT LAUNCHES
- Business Overview, Products/Services/Solutions Offered, MnM View, Key Strengths and Right to Win, Strategic Choices Made, Weaknesses and Competitive Threats, Recent Developments might not be captured in case of unlisted companies.
- 12.3 OTHER PLAYERS
- 12.3.1 AIRBIQUITY
- 12.3.2 QUALCOMM
- 12.3.3 VISTEON
- 12.3.4 VODAFONE GROUP
- 12.3.5 MICROSOFT CORPORATION
- 12.3.6 ALPHABET INC.
- 12.3.7 AT&T
- 12.3.8 CLOUDMADE
- 12.3.9 SIERRA WIRELESS
- 12.3.10 VERIZON COMMUNICATION
- 12.3.11 TELEFONICA
- 12.3.12 MITSUBISHI ELECTRIC CORP.
- 12.3.13 TECH MAHINDRA
- 12.3.14 DESAY HV AUTOMOTIVE
- 12.3.15 VALEO
- 12.3.16 APTIV PLC
- 12.3.17 INTELLIAS
13 APPENDIX
- 13.1 DISCUSSION GUIDE
- 13.2 KNOWLEDGESTORE: MARKETSANDMARKETS' SUBSCRIPTION PORTAL
- 13.3 CUSTOMIZATION OPTIONS
- 13.4 RELATED REPORTS
- 13.5 AUTHOR DETAILS