 |
市場調査レポート
商品コード
1365592
自動車におけるIoT市場:通信別、用途別、コネクティビティ別:世界の機会分析と産業予測、2023~2032年IoT in Automotive Market By Communication, By Application, By Connectivity : Global Opportunity Analysis and Industry Forecast, 2023-2032 |
||||||

| 自動車におけるIoT市場:通信別、用途別、コネクティビティ別:世界の機会分析と産業予測、2023~2032年 |
|
出版日: 2023年07月01日
発行: Allied Market Research
ページ情報: 英文 263 Pages
納期: 2~3営業日
|
- 全表示
- 概要
- 図表
- 目次
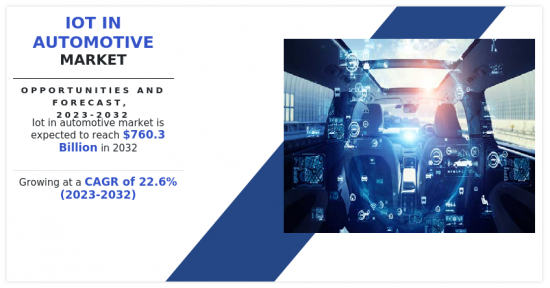
自動車におけるIoT、特にコネクテッドカーの需要により、自動車におけるIoTは2023年から2032年にかけて22.6%という大幅な成長率が見込まれています。
.
自動車におけるIoTの需要は、特にコネクテッドカーの需要が増加しています。同市場は、スマートシティ開拓に向けた政府の取り組みにより成長が見込まれています。交通管理へのIoT活用も増加すると予測されます。さまざまな地域の政府や当局は、自律走行車の需要を高めるために一貫して資金を提供しています。自動車のインフォテインメント機能に対する需要も高まっています。自動車の安全ソリューションは 促進要因の安全性を高めるため、需要も高いです。これらすべての要因が市場成長の原動力となっています。
さらに、従来の自動車所有からの大転換が予測されているにもかかわらず、シェアード・モビリティが自動車産業に与える影響は、個人の自動車所有の放棄を広めるまでには至っていないです。当初は、特に人口密度の高い都市部では、代替交通手段が従来型に取って代わると期待されていました。しかし、スクーターのような超小型モビリティ・ソリューションや、BMWのDriveNowのようなビークル・シェアリング・サービスなど、さまざまなサービスが登場しては消えていっています。とはいえ、AI、自律走行車、IoTアプリ開発、自動車におけるIoTの融合は、将来的にこの領域に大きな変革をもたらす可能性を秘めています。
例えば、UberやLyftのようなサービスは大きな人気を博し、世界の多くの都市で従来の交通モデルを破壊してきました。UberやLyftは、便利で手頃なオンデマンド交通手段を提供することで、自動車所有に代わる選択肢を提供しています。現在、多くの人々が毎日の通勤をライドヘイリングサービスに頼っており、個人で自動車を所有する必要性を減らしています。
目次
第1章 イントロダクション
第2章 エグゼクティブサマリー
第3章 市場概要
- 市場の定義と範囲
- 主な調査結果
- 影響要因
- 主な投資機会
- ポーターのファイブフォース分析
- 市場力学
- 促進要因
- コネクテッドカーのサービスと機能に対する需要の高まり
- 交通安全の向上と事故削減への注目の高まり
- 自律走行車の出現
- 抑制要因
- データのプライバシーとセキュリティに関する懸念
- インフラの限界と相互運用性の課題
- 機会
- 車車間(V2X)通信
- データ主導のサービスと収益化
- 促進要因
- COVID-19市場への影響分析
第4章 自動車におけるIoT市場:通信別
- 概要
- 車両間通信
- 車載通信
- 車両対インフラ
第5章 自動車におけるIoT市場:用途別
- 概要
- ナビゲーション
- インフォテインメント
- テレマティクス
- その他
第6章 自動車におけるIoT市場:コネクティビティ別
- 概要
- 組み込み型
- テザリング
- 統合型
第7章 自動車におけるIoT市場:地域別
- 概要
- 北米
- 米国
- カナダ
- メキシコ
- 欧州
- 英国
- ドイツ
- スペイン
- フランス
- その他
- アジア太平洋
- 中国
- インド
- 日本
- 韓国
- その他
- ラテンアメリカ
- ラテンアメリカ
- 中東
- アフリカ
第8章 競合情勢
- イントロダクション
- 主要成功戦略
- 主要10社の製品マッピング
- 競合ダッシュボード
- 競合ヒートマップ
- 主要企業のポジショニング、2022年
第9章 企業プロファイル
- AT&T
- Cisco System, Inc.
- Intel Corporation
- Microsoft Corporation
- NXP Semiconductors
- Robert Bosch GmbH
- Texas Instruments Inc.
- Thales
- TomTom International BV
- Alphabet Inc.
LIST OF TABLES
- TABLE 01. GLOBAL IOT IN AUTOMOTIVE MARKET, BY COMMUNICATION, 2022-2032 ($MILLION)
- TABLE 02. IOT IN AUTOMOTIVE MARKET FOR VEHICLE TO VEHICLE, BY REGION, 2022-2032 ($MILLION)
- TABLE 03. IOT IN AUTOMOTIVE MARKET FOR IN VEHICLE COMMUNICATION, BY REGION, 2022-2032 ($MILLION)
- TABLE 04. IOT IN AUTOMOTIVE MARKET FOR VEHICLE TO INFRASTRUCTURE, BY REGION, 2022-2032 ($MILLION)
- TABLE 05. GLOBAL IOT IN AUTOMOTIVE MARKET, BY APPLICATION, 2022-2032 ($MILLION)
- TABLE 06. IOT IN AUTOMOTIVE MARKET FOR NAVIGATION, BY REGION, 2022-2032 ($MILLION)
- TABLE 07. IOT IN AUTOMOTIVE MARKET FOR INFOTAINMENT, BY REGION, 2022-2032 ($MILLION)
- TABLE 08. IOT IN AUTOMOTIVE MARKET FOR TELEMATICS, BY REGION, 2022-2032 ($MILLION)
- TABLE 09. IOT IN AUTOMOTIVE MARKET FOR OTHERS, BY REGION, 2022-2032 ($MILLION)
- TABLE 10. GLOBAL IOT IN AUTOMOTIVE MARKET, BY CONNECTIVITY, 2022-2032 ($MILLION)
- TABLE 11. IOT IN AUTOMOTIVE MARKET FOR EMBEDDED, BY REGION, 2022-2032 ($MILLION)
- TABLE 12. IOT IN AUTOMOTIVE MARKET FOR TETHERED, BY REGION, 2022-2032 ($MILLION)
- TABLE 13. IOT IN AUTOMOTIVE MARKET FOR INTEGRATED, BY REGION, 2022-2032 ($MILLION)
- TABLE 14. IOT IN AUTOMOTIVE MARKET, BY REGION, 2022-2032 ($MILLION)
- TABLE 15. NORTH AMERICA IOT IN AUTOMOTIVE MARKET, BY COMMUNICATION, 2022-2032 ($MILLION)
- TABLE 16. NORTH AMERICA IOT IN AUTOMOTIVE MARKET, BY APPLICATION, 2022-2032 ($MILLION)
- TABLE 17. NORTH AMERICA IOT IN AUTOMOTIVE MARKET, BY CONNECTIVITY, 2022-2032 ($MILLION)
- TABLE 18. NORTH AMERICA IOT IN AUTOMOTIVE MARKET, BY COUNTRY, 2022-2032 ($MILLION)
- TABLE 19. U.S. IOT IN AUTOMOTIVE MARKET, BY COMMUNICATION, 2022-2032 ($MILLION)
- TABLE 20. U.S. IOT IN AUTOMOTIVE MARKET, BY APPLICATION, 2022-2032 ($MILLION)
- TABLE 21. U.S. IOT IN AUTOMOTIVE MARKET, BY CONNECTIVITY, 2022-2032 ($MILLION)
- TABLE 22. CANADA IOT IN AUTOMOTIVE MARKET, BY COMMUNICATION, 2022-2032 ($MILLION)
- TABLE 23. CANADA IOT IN AUTOMOTIVE MARKET, BY APPLICATION, 2022-2032 ($MILLION)
- TABLE 24. CANADA IOT IN AUTOMOTIVE MARKET, BY CONNECTIVITY, 2022-2032 ($MILLION)
- TABLE 25. MEXICO IOT IN AUTOMOTIVE MARKET, BY COMMUNICATION, 2022-2032 ($MILLION)
- TABLE 26. MEXICO IOT IN AUTOMOTIVE MARKET, BY APPLICATION, 2022-2032 ($MILLION)
- TABLE 27. MEXICO IOT IN AUTOMOTIVE MARKET, BY CONNECTIVITY, 2022-2032 ($MILLION)
- TABLE 28. EUROPE IOT IN AUTOMOTIVE MARKET, BY COMMUNICATION, 2022-2032 ($MILLION)
- TABLE 29. EUROPE IOT IN AUTOMOTIVE MARKET, BY APPLICATION, 2022-2032 ($MILLION)
- TABLE 30. EUROPE IOT IN AUTOMOTIVE MARKET, BY CONNECTIVITY, 2022-2032 ($MILLION)
- TABLE 31. EUROPE IOT IN AUTOMOTIVE MARKET, BY COUNTRY, 2022-2032 ($MILLION)
- TABLE 32. UK IOT IN AUTOMOTIVE MARKET, BY COMMUNICATION, 2022-2032 ($MILLION)
- TABLE 33. UK IOT IN AUTOMOTIVE MARKET, BY APPLICATION, 2022-2032 ($MILLION)
- TABLE 34. UK IOT IN AUTOMOTIVE MARKET, BY CONNECTIVITY, 2022-2032 ($MILLION)
- TABLE 35. GERMANY IOT IN AUTOMOTIVE MARKET, BY COMMUNICATION, 2022-2032 ($MILLION)
- TABLE 36. GERMANY IOT IN AUTOMOTIVE MARKET, BY APPLICATION, 2022-2032 ($MILLION)
- TABLE 37. GERMANY IOT IN AUTOMOTIVE MARKET, BY CONNECTIVITY, 2022-2032 ($MILLION)
- TABLE 38. SPAIN IOT IN AUTOMOTIVE MARKET, BY COMMUNICATION, 2022-2032 ($MILLION)
- TABLE 39. SPAIN IOT IN AUTOMOTIVE MARKET, BY APPLICATION, 2022-2032 ($MILLION)
- TABLE 40. SPAIN IOT IN AUTOMOTIVE MARKET, BY CONNECTIVITY, 2022-2032 ($MILLION)
- TABLE 41. FRANCE IOT IN AUTOMOTIVE MARKET, BY COMMUNICATION, 2022-2032 ($MILLION)
- TABLE 42. FRANCE IOT IN AUTOMOTIVE MARKET, BY APPLICATION, 2022-2032 ($MILLION)
- TABLE 43. FRANCE IOT IN AUTOMOTIVE MARKET, BY CONNECTIVITY, 2022-2032 ($MILLION)
- TABLE 44. REST OF EUROPE IOT IN AUTOMOTIVE MARKET, BY COMMUNICATION, 2022-2032 ($MILLION)
- TABLE 45. REST OF EUROPE IOT IN AUTOMOTIVE MARKET, BY APPLICATION, 2022-2032 ($MILLION)
- TABLE 46. REST OF EUROPE IOT IN AUTOMOTIVE MARKET, BY CONNECTIVITY, 2022-2032 ($MILLION)
- TABLE 47. ASIA-PACIFIC IOT IN AUTOMOTIVE MARKET, BY COMMUNICATION, 2022-2032 ($MILLION)
- TABLE 48. ASIA-PACIFIC IOT IN AUTOMOTIVE MARKET, BY APPLICATION, 2022-2032 ($MILLION)
- TABLE 49. ASIA-PACIFIC IOT IN AUTOMOTIVE MARKET, BY CONNECTIVITY, 2022-2032 ($MILLION)
- TABLE 50. ASIA-PACIFIC IOT IN AUTOMOTIVE MARKET, BY COUNTRY, 2022-2032 ($MILLION)
- TABLE 51. CHINA IOT IN AUTOMOTIVE MARKET, BY COMMUNICATION, 2022-2032 ($MILLION)
- TABLE 52. CHINA IOT IN AUTOMOTIVE MARKET, BY APPLICATION, 2022-2032 ($MILLION)
- TABLE 53. CHINA IOT IN AUTOMOTIVE MARKET, BY CONNECTIVITY, 2022-2032 ($MILLION)
- TABLE 54. INDIA IOT IN AUTOMOTIVE MARKET, BY COMMUNICATION, 2022-2032 ($MILLION)
- TABLE 55. INDIA IOT IN AUTOMOTIVE MARKET, BY APPLICATION, 2022-2032 ($MILLION)
- TABLE 56. INDIA IOT IN AUTOMOTIVE MARKET, BY CONNECTIVITY, 2022-2032 ($MILLION)
- TABLE 57. JAPAN IOT IN AUTOMOTIVE MARKET, BY COMMUNICATION, 2022-2032 ($MILLION)
- TABLE 58. JAPAN IOT IN AUTOMOTIVE MARKET, BY APPLICATION, 2022-2032 ($MILLION)
- TABLE 59. JAPAN IOT IN AUTOMOTIVE MARKET, BY CONNECTIVITY, 2022-2032 ($MILLION)
- TABLE 60. SOUTH KOREA IOT IN AUTOMOTIVE MARKET, BY COMMUNICATION, 2022-2032 ($MILLION)
- TABLE 61. SOUTH KOREA IOT IN AUTOMOTIVE MARKET, BY APPLICATION, 2022-2032 ($MILLION)
- TABLE 62. SOUTH KOREA IOT IN AUTOMOTIVE MARKET, BY CONNECTIVITY, 2022-2032 ($MILLION)
- TABLE 63. REST OF ASIA-PACIFIC IOT IN AUTOMOTIVE MARKET, BY COMMUNICATION, 2022-2032 ($MILLION)
- TABLE 64. REST OF ASIA-PACIFIC IOT IN AUTOMOTIVE MARKET, BY APPLICATION, 2022-2032 ($MILLION)
- TABLE 65. REST OF ASIA-PACIFIC IOT IN AUTOMOTIVE MARKET, BY CONNECTIVITY, 2022-2032 ($MILLION)
- TABLE 66. LAMEA IOT IN AUTOMOTIVE MARKET, BY COMMUNICATION, 2022-2032 ($MILLION)
- TABLE 67. LAMEA IOT IN AUTOMOTIVE MARKET, BY APPLICATION, 2022-2032 ($MILLION)
- TABLE 68. LAMEA IOT IN AUTOMOTIVE MARKET, BY CONNECTIVITY, 2022-2032 ($MILLION)
- TABLE 69. LAMEA IOT IN AUTOMOTIVE MARKET, BY COUNTRY, 2022-2032 ($MILLION)
- TABLE 70. LATIN AMERICA IOT IN AUTOMOTIVE MARKET, BY COMMUNICATION, 2022-2032 ($MILLION)
- TABLE 71. LATIN AMERICA IOT IN AUTOMOTIVE MARKET, BY APPLICATION, 2022-2032 ($MILLION)
- TABLE 72. LATIN AMERICA IOT IN AUTOMOTIVE MARKET, BY CONNECTIVITY, 2022-2032 ($MILLION)
- TABLE 73. MIDDLE EAST IOT IN AUTOMOTIVE MARKET, BY COMMUNICATION, 2022-2032 ($MILLION)
- TABLE 74. MIDDLE EAST IOT IN AUTOMOTIVE MARKET, BY APPLICATION, 2022-2032 ($MILLION)
- TABLE 75. MIDDLE EAST IOT IN AUTOMOTIVE MARKET, BY CONNECTIVITY, 2022-2032 ($MILLION)
- TABLE 76. AFRICA IOT IN AUTOMOTIVE MARKET, BY COMMUNICATION, 2022-2032 ($MILLION)
- TABLE 77. AFRICA IOT IN AUTOMOTIVE MARKET, BY APPLICATION, 2022-2032 ($MILLION)
- TABLE 78. AFRICA IOT IN AUTOMOTIVE MARKET, BY CONNECTIVITY, 2022-2032 ($MILLION)
- TABLE 79. AT&T: KEY EXECUTIVES
- TABLE 80. AT&T: COMPANY SNAPSHOT
- TABLE 81. AT&T: PRODUCT SEGMENTS
- TABLE 82. AT&T: PRODUCT PORTFOLIO
- TABLE 83. AT&T: KEY STRATERGIES
- TABLE 84. CISCO SYSTEM, INC.: KEY EXECUTIVES
- TABLE 85. CISCO SYSTEM, INC.: COMPANY SNAPSHOT
- TABLE 86. CISCO SYSTEM, INC.: PRODUCT SEGMENTS
- TABLE 87. CISCO SYSTEM, INC.: SERVICE SEGMENTS
- TABLE 88. CISCO SYSTEM, INC.: PRODUCT PORTFOLIO
- TABLE 89. CISCO SYSTEM, INC.: KEY STRATERGIES
- TABLE 90. INTEL CORPORATION: KEY EXECUTIVES
- TABLE 91. INTEL CORPORATION: COMPANY SNAPSHOT
- TABLE 92. INTEL CORPORATION: PRODUCT SEGMENTS
- TABLE 93. INTEL CORPORATION: PRODUCT PORTFOLIO
- TABLE 94. INTEL CORPORATION: KEY STRATERGIES
- TABLE 95. MICROSOFT CORPORATION: KEY EXECUTIVES
- TABLE 96. MICROSOFT CORPORATION: COMPANY SNAPSHOT
- TABLE 97. MICROSOFT CORPORATION: PRODUCT SEGMENTS
- TABLE 98. MICROSOFT CORPORATION: PRODUCT PORTFOLIO
- TABLE 99. MICROSOFT CORPORATION: KEY STRATERGIES
- TABLE 100. NXP SEMICONDUCTORS: KEY EXECUTIVES
- TABLE 101. NXP SEMICONDUCTORS: COMPANY SNAPSHOT
- TABLE 102. NXP SEMICONDUCTORS: PRODUCT SEGMENTS
- TABLE 103. NXP SEMICONDUCTORS: PRODUCT PORTFOLIO
- TABLE 104. ROBERT BOSCH GMBH: KEY EXECUTIVES
- TABLE 105. ROBERT BOSCH GMBH: COMPANY SNAPSHOT
- TABLE 106. ROBERT BOSCH GMBH: PRODUCT SEGMENTS
- TABLE 107. ROBERT BOSCH GMBH: PRODUCT PORTFOLIO
- TABLE 108. ROBERT BOSCH GMBH: KEY STRATERGIES
- TABLE 109. TEXAS INSTRUMENTS INC.: KEY EXECUTIVES
- TABLE 110. TEXAS INSTRUMENTS INC.: COMPANY SNAPSHOT
- TABLE 111. TEXAS INSTRUMENTS INC.: SERVICE SEGMENTS
- TABLE 112. TEXAS INSTRUMENTS INC.: PRODUCT PORTFOLIO
- TABLE 113. TEXAS INSTRUMENTS INC.: KEY STRATERGIES
- TABLE 114. THALES: KEY EXECUTIVES
- TABLE 115. THALES: COMPANY SNAPSHOT
- TABLE 116. THALES: PRODUCT SEGMENTS
- TABLE 117. THALES: PRODUCT PORTFOLIO
- TABLE 118. TOMTOM INTERNATIONAL BV: KEY EXECUTIVES
- TABLE 119. TOMTOM INTERNATIONAL BV: COMPANY SNAPSHOT
- TABLE 120. TOMTOM INTERNATIONAL BV: PRODUCT SEGMENTS
- TABLE 121. TOMTOM INTERNATIONAL BV: PRODUCT PORTFOLIO
- TABLE 122. ALPHABET INC.: KEY EXECUTIVES
- TABLE 123. ALPHABET INC.: COMPANY SNAPSHOT
- TABLE 124. ALPHABET INC.: SERVICE SEGMENTS
- TABLE 125. ALPHABET INC.: PRODUCT PORTFOLIO
- TABLE 126. ALPHABET INC.: KEY STRATERGIES
LIST OF FIGURES
- FIGURE 01. IOT IN AUTOMOTIVE MARKET, 2022-2032
- FIGURE 02. SEGMENTATION OF IOT IN AUTOMOTIVE MARKET,2022-2032
- FIGURE 03. TOP INVESTMENT POCKETS IN IOT IN AUTOMOTIVE MARKET (2023-2032)
- FIGURE 04. LOW BARGAINING POWER OF SUPPLIERS
- FIGURE 05. LOW THREAT OF NEW ENTRANTS
- FIGURE 06. LOW THREAT OF SUBSTITUTES
- FIGURE 07. LOW INTENSITY OF RIVALRY
- FIGURE 08. LOW BARGAINING POWER OF BUYERS
- FIGURE 09. GLOBAL IOT IN AUTOMOTIVE MARKET:DRIVERS, RESTRAINTS AND OPPORTUNITIES
- FIGURE 10. IOT IN AUTOMOTIVE MARKET, BY COMMUNICATION, 2022(%)
- FIGURE 11. COMPARATIVE SHARE ANALYSIS OF IOT IN AUTOMOTIVE MARKET FOR VEHICLE TO VEHICLE, BY COUNTRY 2022 AND 2032(%)
- FIGURE 12. COMPARATIVE SHARE ANALYSIS OF IOT IN AUTOMOTIVE MARKET FOR IN VEHICLE COMMUNICATION, BY COUNTRY 2022 AND 2032(%)
- FIGURE 13. COMPARATIVE SHARE ANALYSIS OF IOT IN AUTOMOTIVE MARKET FOR VEHICLE TO INFRASTRUCTURE, BY COUNTRY 2022 AND 2032(%)
- FIGURE 14. IOT IN AUTOMOTIVE MARKET, BY APPLICATION, 2022(%)
- FIGURE 15. COMPARATIVE SHARE ANALYSIS OF IOT IN AUTOMOTIVE MARKET FOR NAVIGATION, BY COUNTRY 2022 AND 2032(%)
- FIGURE 16. COMPARATIVE SHARE ANALYSIS OF IOT IN AUTOMOTIVE MARKET FOR INFOTAINMENT, BY COUNTRY 2022 AND 2032(%)
- FIGURE 17. COMPARATIVE SHARE ANALYSIS OF IOT IN AUTOMOTIVE MARKET FOR TELEMATICS, BY COUNTRY 2022 AND 2032(%)
- FIGURE 18. COMPARATIVE SHARE ANALYSIS OF IOT IN AUTOMOTIVE MARKET FOR OTHERS, BY COUNTRY 2022 AND 2032(%)
- FIGURE 19. IOT IN AUTOMOTIVE MARKET, BY CONNECTIVITY, 2022(%)
- FIGURE 20. COMPARATIVE SHARE ANALYSIS OF IOT IN AUTOMOTIVE MARKET FOR EMBEDDED, BY COUNTRY 2022 AND 2032(%)
- FIGURE 21. COMPARATIVE SHARE ANALYSIS OF IOT IN AUTOMOTIVE MARKET FOR TETHERED, BY COUNTRY 2022 AND 2032(%)
- FIGURE 22. COMPARATIVE SHARE ANALYSIS OF IOT IN AUTOMOTIVE MARKET FOR INTEGRATED, BY COUNTRY 2022 AND 2032(%)
- FIGURE 23. IOT IN AUTOMOTIVE MARKET BY REGION, 2022(%)
- FIGURE 24. U.S. IOT IN AUTOMOTIVE MARKET, 2022-2032 ($MILLION)
- FIGURE 25. CANADA IOT IN AUTOMOTIVE MARKET, 2022-2032 ($MILLION)
- FIGURE 26. MEXICO IOT IN AUTOMOTIVE MARKET, 2022-2032 ($MILLION)
- FIGURE 27. UK IOT IN AUTOMOTIVE MARKET, 2022-2032 ($MILLION)
- FIGURE 28. GERMANY IOT IN AUTOMOTIVE MARKET, 2022-2032 ($MILLION)
- FIGURE 29. SPAIN IOT IN AUTOMOTIVE MARKET, 2022-2032 ($MILLION)
- FIGURE 30. FRANCE IOT IN AUTOMOTIVE MARKET, 2022-2032 ($MILLION)
- FIGURE 31. REST OF EUROPE IOT IN AUTOMOTIVE MARKET, 2022-2032 ($MILLION)
- FIGURE 32. CHINA IOT IN AUTOMOTIVE MARKET, 2022-2032 ($MILLION)
- FIGURE 33. INDIA IOT IN AUTOMOTIVE MARKET, 2022-2032 ($MILLION)
- FIGURE 34. JAPAN IOT IN AUTOMOTIVE MARKET, 2022-2032 ($MILLION)
- FIGURE 35. SOUTH KOREA IOT IN AUTOMOTIVE MARKET, 2022-2032 ($MILLION)
- FIGURE 36. REST OF ASIA-PACIFIC IOT IN AUTOMOTIVE MARKET, 2022-2032 ($MILLION)
- FIGURE 37. LATIN AMERICA IOT IN AUTOMOTIVE MARKET, 2022-2032 ($MILLION)
- FIGURE 38. MIDDLE EAST IOT IN AUTOMOTIVE MARKET, 2022-2032 ($MILLION)
- FIGURE 39. AFRICA IOT IN AUTOMOTIVE MARKET, 2022-2032 ($MILLION)
- FIGURE 40. TOP WINNING STRATEGIES, BY YEAR
- FIGURE 41. TOP WINNING STRATEGIES, BY DEVELOPMENT
- FIGURE 42. TOP WINNING STRATEGIES, BY COMPANY
- FIGURE 43. PRODUCT MAPPING OF TOP 10 PLAYERS
- FIGURE 44. COMPETITIVE DASHBOARD
- FIGURE 45. COMPETITIVE HEATMAP: IOT IN AUTOMOTIVE MARKET
- FIGURE 46. TOP PLAYER POSITIONING, 2022
- FIGURE 47. AT&T: NET REVENUE, 2020-2022 ($MILLION)
- FIGURE 48. AT&T: REVENUE SHARE BY REGION, 2022 (%)
- FIGURE 49. AT&T: REVENUE SHARE BY SEGMENT, 2022 (%)
- FIGURE 50. CISCO SYSTEM, INC.: RESEARCH & DEVELOPMENT EXPENDITURE, 2019-2021 ($MILLION)
- FIGURE 51. CISCO SYSTEM, INC.: NET REVENUE, 2019-2021 ($MILLION)
- FIGURE 52. CISCO SYSTEM, INC.: REVENUE SHARE BY SEGMENT, 2021 (%)
- FIGURE 53. CISCO SYSTEM, INC.: REVENUE SHARE BY REGION, 2021 (%)
- FIGURE 54. INTEL CORPORATION: NET REVENUE, 2019-2021 ($MILLION)
- FIGURE 55. INTEL CORPORATION: RESEARCH & DEVELOPMENT EXPENDITURE, 2019-2021 ($MILLION)
- FIGURE 56. INTEL CORPORATION: REVENUE SHARE BY REGION, 2021 (%)
- FIGURE 57. MICROSOFT CORPORATION: NET REVENUE, 2020-2022 ($MILLION)
- FIGURE 58. NXP SEMICONDUCTORS: RESEARCH & DEVELOPMENT EXPENDITURE, 2020-2022 ($MILLION)
- FIGURE 59. NXP SEMICONDUCTORS: NET REVENUE, 2020-2022 ($MILLION)
- FIGURE 60. NXP SEMICONDUCTORS: REVENUE SHARE BY SEGMENT, 2022 (%)
- FIGURE 61. NXP SEMICONDUCTORS: REVENUE SHARE BY REGION, 2022 (%)
- FIGURE 62. ROBERT BOSCH GMBH: NET REVENUE, 2020-2022 ($MILLION)
- FIGURE 63. ROBERT BOSCH GMBH: RESEARCH & DEVELOPMENT EXPENDITURE, 2020-2022 ($MILLION)
- FIGURE 64. ROBERT BOSCH GMBH: REVENUE SHARE BY REGION, 2022 (%)
- FIGURE 65. ROBERT BOSCH GMBH: REVENUE SHARE BY SEGMENT, 2022 (%)
- FIGURE 66. TEXAS INSTRUMENTS INCORPORATED: NET REVENUE, 2020-2022 ($MILLION)
- FIGURE 67. TEXAS INSTRUMENTS INCORPORATED: RESEARCH & DEVELOPMENT EXPENDITURE, 2020-2022 ($MILLION)
- FIGURE 68. TEXAS INSTRUMENTS INCORPORATED: REVENUE SHARE BY SEGMENT, 2021 (%)
- FIGURE 69. TEXAS INSTRUMENTS INCORPORATED: REVENUE SHARE BY REGION, 2021 (%)
- FIGURE 70. THALES: RESEARCH & DEVELOPMENT EXPENDITURE, 2020-2022 ($MILLION)
- FIGURE 71. THALES: NET REVENUE, 2020-2022 ($MILLION)
- FIGURE 72. THALES: REVENUE SHARE BY SEGMENT, 2022 (%)
- FIGURE 73. THALES: REVENUE SHARE BY SEGMENT, 2022 (%)
- FIGURE 74. TOMTOM INTERNATIONAL BV: NET SALES, 2020-2022 ($MILLION)
- FIGURE 75. TOMTOM INTERNATIONAL BV: RESEARCH & DEVELOPMENT EXPENDITURE, 2020-2022 ($MILLION)
- FIGURE 76. TOMTOM INTERNATIONAL BV: REVENUE SHARE BY SEGMENT, 2022 (%)
- FIGURE 77. TOMTOM INTERNATIONAL BV: REVENUE SHARE BY REGION, 2022 (%)
- FIGURE 78. ALPHABET INC.: NET REVENUE, 2020-2022 ($MILLION)
- FIGURE 79. ALPHABET INC.: RESEARCH & DEVELOPMENT EXPENDITURE, 2020-2022 ($MILLION)
- FIGURE 80. ALPHABET INC.: REVENUE SHARE BY SEGMENT, 2022 (%)
- FIGURE 81. ALPHABET INC.: REVENUE SHARE BY REGION, 2022 (%)
The IoT in Automotive is expected to experience a significant growth rate of 22.6% from 2023-2032 owing to the demand for IoT in automobiles, particularly for connected vehicles. - Allied Market Research
The demand for IoT in automobiles is increasing, particularly for connected vehicles. The market is expected to grow due to government initiatives aimed at developing smart cities. The utilization of IoT for traffic management is also projected to increase. Governments and authorities in various regions are consistently providing funding to boost the demand for autonomous vehicles. There is a growing demand for infotainment features in vehicles. Safety solutions for automobiles are also in high demand as they enhance driver safety. All these factors serve as driving forces for market growth.
Moreover, despite predictions of a major shift away from traditional car ownership, shared mobility's impact on the automotive industry has not yet resulted in the widespread abandonment of personal vehicle ownership. Initially, there were expectations that alternative transportation options would replace conventional models, particularly in densely populated urban areas. However, various offerings, including micro-mobility solutions such as scooters and vehicle-sharing services such as BMW's DriveNow, have emerged and faded over time. Nevertheless, the convergence of AI, autonomous vehicles, IoT app development, and IoT in automotive holds the potential to drive substantial transformation in this realm in the future.
For instance, services such as Uber and Lyft have gained significant popularity and disrupted traditional transportation models in many cities worldwide. They provide an alternative to car ownership by offering convenient and affordable on-demand transportation options. Many people now rely on ride-hailing services for their daily commuting needs, reducing the need for personal vehicle ownership.
Key Benefits For Stakeholders
- This report provides a quantitative analysis of the market segments, current trends, estimations, and dynamics of the iot in automotive market analysis from 2022 to 2032 to identify the prevailing iot in automotive market opportunities.
- The market research is offered along with information related to key drivers, restraints, and opportunities.
- Porter's five forces analysis highlights the potency of buyers and suppliers to enable stakeholders make profit-oriented business decisions and strengthen their supplier-buyer network.
- In-depth analysis of the iot in automotive market segmentation assists to determine the prevailing market opportunities.
- Major countries in each region are mapped according to their revenue contribution to the global market.
- Market player positioning facilitates benchmarking and provides a clear understanding of the present position of the market players.
- The report includes the analysis of the regional as well as global iot in automotive market trends, key players, market segments, application areas, and market growth strategies.
Additional benefits you will get with this purchase are:
- Quarterly Update and* (only available with a corporate license, on listed price)
- 5 additional Company Profile of client Choice pre- or Post-purchase, as a free update.
- Free Upcoming Version on the Purchase of Five and Enterprise User License.
- 16 analyst hours of support* (post-purchase, if you find additional data requirements upon review of the report, you may receive support amounting to 16 analyst hours to solve questions, and post-sale queries)
- 15% Free Customization* (in case the scope or segment of the report does not match your requirements, 20% is equivalent to 3 working days of free work, applicable once)
- Free data Pack on the Five and Enterprise User License. (Excel version of the report)
- Free Updated report if the report is 6-12 months old or older.
- 24-hour priority response*
- Free Industry updates and white papers.
Possible Customization with this report (with additional cost and timeline talk to the sales executive to know more)
- Additional company profiles with specific to client's interest
- Additional country or region analysis- market size and forecast
- SWOT Analysis
Key Market Segments
By Communication
- Vehicle to Vehicle
- In vehicle communication
- Vehicle to infrastructure
By Application
- Navigation
- Infotainment
- Telematics
- Others
By Connectivity
- Embedded
- Tethered
- Integrated
By Region
- North America
- U.S.
- Canada
- Mexico
- Europe
- UK
- Germany
- Spain
- France
- Rest of Europe
- Asia-Pacific
- China
- India
- Japan
- South Korea
- Rest of Asia-Pacific
- LAMEA
- Latin America
- Middle East
- Africa
Key Market Players:
- Intel Corporation
- Robert Bosch GmbH
- Cisco System, Inc.
- Thales
- Microsoft Corporation
- Alphabet Inc.
- AT&T
- NXP Semiconductors
- Texas Instruments Inc.
- TomTom International BV
TABLE OF CONTENTS
CHAPTER 1: INTRODUCTION
- 1.1. Report description
- 1.2. Key market segments
- 1.3. Key benefits to the stakeholders
- 1.4. Research Methodology
- 1.4.1. Primary research
- 1.4.2. Secondary research
- 1.4.3. Analyst tools and models
CHAPTER 2: EXECUTIVE SUMMARY
- 2.1. CXO Perspective
CHAPTER 3: MARKET OVERVIEW
- 3.1. Market definition and scope
- 3.2. Key findings
- 3.2.1. Top impacting factors
- 3.2.2. Top investment pockets
- 3.3. Porter's five forces analysis
- 3.3.1. Low bargaining power of suppliers
- 3.3.2. Low threat of new entrants
- 3.3.3. Low threat of substitutes
- 3.3.4. Low intensity of rivalry
- 3.3.5. Low bargaining power of buyers
- 3.4. Market dynamics
- 3.4.1. Drivers
- 3.4.1.1. Increasing demand for connected car services and features
- 3.4.1.2. Rising focus on improving road safety and reducing accidents
- 3.4.1.3. The emergence of autonomous vehicles
- 3.4.1. Drivers
- 3.4.2. Restraints
- 3.4.2.1. Data privacy and security concerns
- 3.4.2.2. Infrastructure limitations and interoperability challenges
- 3.4.3. Opportunities
- 3.4.3.1. Vehicle-to-Everything (V2X) Communication
- 3.4.3.2. Data-driven services and monetization
- 3.5. COVID-19 Impact Analysis on the market
CHAPTER 4: IOT IN AUTOMOTIVE MARKET, BY COMMUNICATION
- 4.1. Overview
- 4.1.1. Market size and forecast
- 4.2. Vehicle to Vehicle
- 4.2.1. Key market trends, growth factors and opportunities
- 4.2.2. Market size and forecast, by region
- 4.2.3. Market share analysis by country
- 4.3. In vehicle communication
- 4.3.1. Key market trends, growth factors and opportunities
- 4.3.2. Market size and forecast, by region
- 4.3.3. Market share analysis by country
- 4.4. Vehicle to infrastructure
- 4.4.1. Key market trends, growth factors and opportunities
- 4.4.2. Market size and forecast, by region
- 4.4.3. Market share analysis by country
CHAPTER 5: IOT IN AUTOMOTIVE MARKET, BY APPLICATION
- 5.1. Overview
- 5.1.1. Market size and forecast
- 5.2. Navigation
- 5.2.1. Key market trends, growth factors and opportunities
- 5.2.2. Market size and forecast, by region
- 5.2.3. Market share analysis by country
- 5.3. Infotainment
- 5.3.1. Key market trends, growth factors and opportunities
- 5.3.2. Market size and forecast, by region
- 5.3.3. Market share analysis by country
- 5.4. Telematics
- 5.4.1. Key market trends, growth factors and opportunities
- 5.4.2. Market size and forecast, by region
- 5.4.3. Market share analysis by country
- 5.5. Others
- 5.5.1. Key market trends, growth factors and opportunities
- 5.5.2. Market size and forecast, by region
- 5.5.3. Market share analysis by country
CHAPTER 6: IOT IN AUTOMOTIVE MARKET, BY CONNECTIVITY
- 6.1. Overview
- 6.1.1. Market size and forecast
- 6.2. Embedded
- 6.2.1. Key market trends, growth factors and opportunities
- 6.2.2. Market size and forecast, by region
- 6.2.3. Market share analysis by country
- 6.3. Tethered
- 6.3.1. Key market trends, growth factors and opportunities
- 6.3.2. Market size and forecast, by region
- 6.3.3. Market share analysis by country
- 6.4. Integrated
- 6.4.1. Key market trends, growth factors and opportunities
- 6.4.2. Market size and forecast, by region
- 6.4.3. Market share analysis by country
CHAPTER 7: IOT IN AUTOMOTIVE MARKET, BY REGION
- 7.1. Overview
- 7.1.1. Market size and forecast By Region
- 7.2. North America
- 7.2.1. Key trends and opportunities
- 7.2.2. Market size and forecast, by Communication
- 7.2.3. Market size and forecast, by Application
- 7.2.4. Market size and forecast, by Connectivity
- 7.2.5. Market size and forecast, by country
- 7.2.5.1. U.S.
- 7.2.5.1.1. Key market trends, growth factors and opportunities
- 7.2.5.1.2. Market size and forecast, by Communication
- 7.2.5.1.3. Market size and forecast, by Application
- 7.2.5.1.4. Market size and forecast, by Connectivity
- 7.2.5.2. Canada
- 7.2.5.2.1. Key market trends, growth factors and opportunities
- 7.2.5.2.2. Market size and forecast, by Communication
- 7.2.5.2.3. Market size and forecast, by Application
- 7.2.5.2.4. Market size and forecast, by Connectivity
- 7.2.5.3. Mexico
- 7.2.5.3.1. Key market trends, growth factors and opportunities
- 7.2.5.3.2. Market size and forecast, by Communication
- 7.2.5.3.3. Market size and forecast, by Application
- 7.2.5.3.4. Market size and forecast, by Connectivity
- 7.3. Europe
- 7.3.1. Key trends and opportunities
- 7.3.2. Market size and forecast, by Communication
- 7.3.3. Market size and forecast, by Application
- 7.3.4. Market size and forecast, by Connectivity
- 7.3.5. Market size and forecast, by country
- 7.3.5.1. UK
- 7.3.5.1.1. Key market trends, growth factors and opportunities
- 7.3.5.1.2. Market size and forecast, by Communication
- 7.3.5.1.3. Market size and forecast, by Application
- 7.3.5.1.4. Market size and forecast, by Connectivity
- 7.3.5.2. Germany
- 7.3.5.2.1. Key market trends, growth factors and opportunities
- 7.3.5.2.2. Market size and forecast, by Communication
- 7.3.5.2.3. Market size and forecast, by Application
- 7.3.5.2.4. Market size and forecast, by Connectivity
- 7.3.5.3. Spain
- 7.3.5.3.1. Key market trends, growth factors and opportunities
- 7.3.5.3.2. Market size and forecast, by Communication
- 7.3.5.3.3. Market size and forecast, by Application
- 7.3.5.3.4. Market size and forecast, by Connectivity
- 7.3.5.4. France
- 7.3.5.4.1. Key market trends, growth factors and opportunities
- 7.3.5.4.2. Market size and forecast, by Communication
- 7.3.5.4.3. Market size and forecast, by Application
- 7.3.5.4.4. Market size and forecast, by Connectivity
- 7.3.5.5. Rest of Europe
- 7.3.5.5.1. Key market trends, growth factors and opportunities
- 7.3.5.5.2. Market size and forecast, by Communication
- 7.3.5.5.3. Market size and forecast, by Application
- 7.3.5.5.4. Market size and forecast, by Connectivity
- 7.4. Asia-Pacific
- 7.4.1. Key trends and opportunities
- 7.4.2. Market size and forecast, by Communication
- 7.4.3. Market size and forecast, by Application
- 7.4.4. Market size and forecast, by Connectivity
- 7.4.5. Market size and forecast, by country
- 7.4.5.1. China
- 7.4.5.1.1. Key market trends, growth factors and opportunities
- 7.4.5.1.2. Market size and forecast, by Communication
- 7.4.5.1.3. Market size and forecast, by Application
- 7.4.5.1.4. Market size and forecast, by Connectivity
- 7.4.5.2. India
- 7.4.5.2.1. Key market trends, growth factors and opportunities
- 7.4.5.2.2. Market size and forecast, by Communication
- 7.4.5.2.3. Market size and forecast, by Application
- 7.4.5.2.4. Market size and forecast, by Connectivity
- 7.4.5.3. Japan
- 7.4.5.3.1. Key market trends, growth factors and opportunities
- 7.4.5.3.2. Market size and forecast, by Communication
- 7.4.5.3.3. Market size and forecast, by Application
- 7.4.5.3.4. Market size and forecast, by Connectivity
- 7.4.5.4. South Korea
- 7.4.5.4.1. Key market trends, growth factors and opportunities
- 7.4.5.4.2. Market size and forecast, by Communication
- 7.4.5.4.3. Market size and forecast, by Application
- 7.4.5.4.4. Market size and forecast, by Connectivity
- 7.4.5.5. Rest of Asia-Pacific
- 7.4.5.5.1. Key market trends, growth factors and opportunities
- 7.4.5.5.2. Market size and forecast, by Communication
- 7.4.5.5.3. Market size and forecast, by Application
- 7.4.5.5.4. Market size and forecast, by Connectivity
- 7.5. LAMEA
- 7.5.1. Key trends and opportunities
- 7.5.2. Market size and forecast, by Communication
- 7.5.3. Market size and forecast, by Application
- 7.5.4. Market size and forecast, by Connectivity
- 7.5.5. Market size and forecast, by country
- 7.5.5.1. Latin America
- 7.5.5.1.1. Key market trends, growth factors and opportunities
- 7.5.5.1.2. Market size and forecast, by Communication
- 7.5.5.1.3. Market size and forecast, by Application
- 7.5.5.1.4. Market size and forecast, by Connectivity
- 7.5.5.2. Middle East
- 7.5.5.2.1. Key market trends, growth factors and opportunities
- 7.5.5.2.2. Market size and forecast, by Communication
- 7.5.5.2.3. Market size and forecast, by Application
- 7.5.5.2.4. Market size and forecast, by Connectivity
- 7.5.5.3. Africa
- 7.5.5.3.1. Key market trends, growth factors and opportunities
- 7.5.5.3.2. Market size and forecast, by Communication
- 7.5.5.3.3. Market size and forecast, by Application
- 7.5.5.3.4. Market size and forecast, by Connectivity
CHAPTER 8: COMPETITIVE LANDSCAPE
- 8.1. Introduction
- 8.2. Top winning strategies
- 8.3. Product Mapping of Top 10 Player
- 8.4. Competitive Dashboard
- 8.5. Competitive Heatmap
- 8.6. Top player positioning, 2022
CHAPTER 9: COMPANY PROFILES
- 9.1. AT&T
- 9.1.1. Company overview
- 9.1.2. Key Executives
- 9.1.3. Company snapshot
- 9.1.4. Operating business segments
- 9.1.5. Product portfolio
- 9.1.6. Business performance
- 9.1.7. Key strategic moves and developments
- 9.2. Cisco System, Inc.
- 9.2.1. Company overview
- 9.2.2. Key Executives
- 9.2.3. Company snapshot
- 9.2.4. Operating business segments
- 9.2.5. Product portfolio
- 9.2.6. Business performance
- 9.2.7. Key strategic moves and developments
- 9.3. Intel Corporation
- 9.3.1. Company overview
- 9.3.2. Key Executives
- 9.3.3. Company snapshot
- 9.3.4. Operating business segments
- 9.3.5. Product portfolio
- 9.3.6. Business performance
- 9.3.7. Key strategic moves and developments
- 9.4. Microsoft Corporation
- 9.4.1. Company overview
- 9.4.2. Key Executives
- 9.4.3. Company snapshot
- 9.4.4. Operating business segments
- 9.4.5. Product portfolio
- 9.4.6. Business performance
- 9.4.7. Key strategic moves and developments
- 9.5. NXP Semiconductors
- 9.5.1. Company overview
- 9.5.2. Key Executives
- 9.5.3. Company snapshot
- 9.5.4. Operating business segments
- 9.5.5. Product portfolio
- 9.5.6. Business performance
- 9.6. Robert Bosch GmbH
- 9.6.1. Company overview
- 9.6.2. Key Executives
- 9.6.3. Company snapshot
- 9.6.4. Operating business segments
- 9.6.5. Product portfolio
- 9.6.6. Business performance
- 9.6.7. Key strategic moves and developments
- 9.7. Texas Instruments Inc.
- 9.7.1. Company overview
- 9.7.2. Key Executives
- 9.7.3. Company snapshot
- 9.7.4. Operating business segments
- 9.7.5. Product portfolio
- 9.7.6. Business performance
- 9.7.7. Key strategic moves and developments
- 9.8. Thales
- 9.8.1. Company overview
- 9.8.2. Key Executives
- 9.8.3. Company snapshot
- 9.8.4. Operating business segments
- 9.8.5. Product portfolio
- 9.8.6. Business performance
- 9.9. TomTom International BV
- 9.9.1. Company overview
- 9.9.2. Key Executives
- 9.9.3. Company snapshot
- 9.9.4. Operating business segments
- 9.9.5. Product portfolio
- 9.9.6. Business performance
- 9.10. Alphabet Inc.
- 9.10.1. Company overview
- 9.10.2. Key Executives
- 9.10.3. Company snapshot
- 9.10.4. Operating business segments
- 9.10.5. Product portfolio
- 9.10.6. Business performance
- 9.10.7. Key strategic moves and developments