|
|
市場調査レポート
商品コード
1674555
PCR技術の世界市場:製品別、技術別、用途別、エンドユーザー別、地域別 - 2030年までの予測PCR Technologies Market by Product (Instruments, Reagents & Consumables, Software), Application (Genotyping, Diagnostic Applications), Technique (Reverse Transcription PCR, qPCR), End-user (Hospital Labs, Diagnostic Labs) - Global Forecasts to 2030 |
||||||
|
|||||||
カスタマイズ可能
|
|||||||

| PCR技術の世界市場:製品別、技術別、用途別、エンドユーザー別、地域別 - 2030年までの予測 |
|
出版日: 2025年03月01日
発行: MarketsandMarkets
ページ情報: 英文 312 Pages
納期: 即納可能
|

全表示
- 概要
- 図表
- 目次
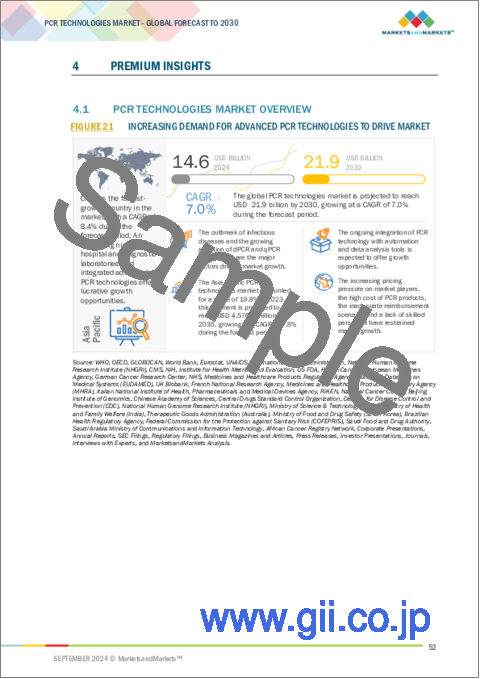
PCR技術の市場規模は、2024年の146億1,000万米ドルから2030年には218億9,000万米ドルに達し、予測期間中のCAGRは7.0%になると予測されています。
感染症患者の増加とPCR技術の定期的な進歩がこの市場を牽引しています。研究開発への支出の増加や、病気を検出するためのバイオマーカープロファイリングの応用拡大も一因となっています。さらに、市場成長はPCR技術と人工知能の包含によって影響されます。
| 調査範囲 | |
|---|---|
| 調査対象年 | 2022年~2030年 |
| 基準年 | 2023年 |
| 予測期間 | 2024年~2030年 |
| 検討単位 | 金額(100万米ドル/10億米ドル) |
| セグメント別 | 製品別、技術別、用途別、エンドユーザー別、地域別 |
| 対象地域 | 北米、欧州、アジア太平洋、ラテンアメリカ、中東・アフリカ |
定量的PCR(qPCR)と呼ばれるポリメラーゼ連鎖反応(PCR)の変種は、リアルタイムPCRと呼ばれることもあり、特定のDNAまたはRNA配列の同時増幅と定量化を可能にします。qPCRは、反応終了後に遺伝物質の存在のみを特定する従来のPCRとは対照的に、反応が進行するのをリアルタイムで追跡し、標的核酸の量に関する定量的情報を提供します。市場は、qPCR装置に対する需要の高まり、病気の蔓延の増加、技術の進歩によって牽引されています。さらに、qPCRは核酸を同定・測定するための非常に特異的で感度の高い方法であるため、感染性疾患の診断に必要です。
様々な重要な要因が、マイクロフルイディクス産業における病院や診断センターの成長を促進しています。重要な要因の一つは、ポイントオブケア診断に対する要求が高まっていることです。さらに、COVID-19のような感染症の増加により、臨床現場における効率的な診断への要求が高まっています。これらの機器はコストを削減し、検査方法を迅速化し、診断の精度と正確さを向上させる。診断ラボでは、PCRを用いて様々な病気を特定し、診断する必要があります。これらのラボは、遺伝子異常や感染症の診断において、その精度、感度、スピードからPCRを広範囲に使用しています。
成長を支えているのは、ゲノミクスに関連した医薬品開発の増加です。それとは別に、政府主導のイニシアティブと資金調達と助成金の増加が成長を支えています。この地域はまた、戦略的提携、共同研究、拡大、買収を行うことでこの市場の成長を支える著名な参入企業の存在も強いです。この地域の病院や診断ラボでPCR法が広く応用されていることも、北米のマイクロ流体への需要を高めています。
当レポートでは、世界のPCR技術市場について調査し、製品別、技術別、用途別、エンドユーザー別、地域別動向、および市場に参入する企業のプロファイルなどをまとめています。
目次
第1章 イントロダクション
第2章 調査手法
第3章 エグゼクティブサマリー
第4章 重要考察
第5章 市場概要
- イントロダクション
- 市場力学
- バリューチェーン分析
- ポーターのファイブフォース分析
- 主な利害関係者と購入基準
- 特許分析
- 2024年~2025年の主な会議とイベント
- 貿易データ分析
- 価格分析
- アンメットニーズと主な問題点
- エコシステム分析
- サプライチェーン分析
- 顧客ビジネスに影響を与える動向/混乱
- 技術分析
- 規制状況
- 投資と資金調達のシナリオ
- 償還シナリオ分析
- AI/生成AIがPCR技術市場に与える影響
第6章 PCR技術市場(製品別)
- イントロダクション
- 試薬および消耗品
- 機器
- ソフトウェアとサービス
第7章 PCR技術市場(技術別)
- イントロダクション
- リアルタイムPCR
- 従来型PCR
- デジタルPCR
- 逆転写PCR
- ホットスタートPCR
- マルチプレックスPCR
- その他
第8章 PCR技術市場(用途別)
- イントロダクション
- 診断
- ジェノタイピング
- 核酸検出
- 遺伝子発現解析
- 核酸合成
- 遺伝子配列解析
- 環境
- 標準の妥当性確認/検証
- その他
第9章 PCR技術市場(エンドユーザー別)
- イントロダクション
- 病院検査室
- 診断検査室
- 学術機関および政府機関
- 製薬バイオテクノロジー企業
- その他
第10章 PCR技術市場(地域別)
- イントロダクション
- 北米
- 北米のマクロ経済見通し
- 米国
- カナダ
- 欧州
- 欧州のマクロ経済見通し
- ドイツ
- フランス
- 英国
- イタリア
- スペイン
- その他
- アジア太平洋
- アジア太平洋のマクロ経済見通し
- 中国
- 日本
- インド
- オーストラリア
- 韓国
- その他
- ラテンアメリカ
- ラテンアメリカのマクロ経済見通し
- ブラジル
- メキシコ
- その他
- 中東・アフリカ
- 中東・アフリカのマクロ経済見通し
- GCC諸国
- その他
第11章 競合情勢
- イントロダクション
- 主要参入企業の戦略/強み
- 収益分析、2019年~2023年
- 市場シェア分析、2023年
- 企業評価マトリックス:主要参入企業、2023年
- 企業評価マトリックス:スタートアップ/中小企業、2023年
- 企業価値評価と財務指標、2025年
- 製品/ブランド比較
- 競合シナリオ
第12章 企業プロファイル
- 主要参入企業
- THERMO FISHER SCIENTIFIC INC.
- F. HOFFMANN-LA ROCHE LTD.
- AGILENT TECHNOLOGIES, INC.
- BIO-RAD LABORATORIES, INC.
- QIAGEN
- DANAHER CORPORATION
- ABBOTT
- TAKARA BIO INC.
- ANALYTIK JENA GMBH+CO. KG
- EPPENDORF SE
- MERCK KGAA
- BIONEER CORPORATION
- REVVITY
- BECTON, DICKINSON AND COMPANY
- BIOMERIEUX
- STANDARD BIOTOOLS
- HOLOGIC, INC.
- LONZA
- ILLUMINA, INC.
- SANSURE BIOTECH INC.
- その他の企業
- PROMEGA CORPORATION
- LIMING BIO
- TRANSGEN BIOTECH CO., LTD.
- DAAN GENE CO., LTD.
- BIOBASE GROUP
- NIPPON GENETICS EUROPE
- STILLA
- GENSCRIPT
- NEW ENGLAND BIOLABS
第13章 付録
List of Tables
- TABLE 1 PCR TECHNOLOGIES MARKET: STUDY ASSUMPTIONS
- TABLE 2 PCR TECHNOLOGIES MARKET: RISK ASSESSMENT
- TABLE 3 ADVANTAGES AND DISADVANTAGES OF REAL-TIME POINT-OF-CARE RT-PCR DEVICES
- TABLE 4 PCR TECHNOLOGIES MARKET: PORTER'S FIVE FORCES
- TABLE 5 INFLUENCE OF KEY STAKEHOLDERS ON BUYING PROCESS (%)
- TABLE 6 PCR TECHNOLOGIES MARKET: LIST OF MAJOR PATENTS, JUNE 2022-DECEMBER 2024
- TABLE 7 PCR TECHNOLOGIES MARKET: LIST OF KEY CONFERENCES AND EVENTS, JANUARY 2024-DECEMBER 2025
- TABLE 8 IMPORT DATA FOR HS CODE 3822, BY COUNTRY, 2019-2023 (USD THOUSAND)
- TABLE 9 EXPORT DATA FOR HS CODE 3822, BY COUNTRY, 2019-2023 (USD THOUSAND)
- TABLE 10 INDICATIVE PRICING OF REAL-TIME PCR INSTRUMENTS, BY KEY PLAYER, 2024 (USD)
- TABLE 11 INDICATIVE PRICING OF PCR TECHNOLOGY-BASED PRODUCTS, BY REGION, 2022-2024 (USD)
- TABLE 12 PCR TECHNOLOGIES MARKET: CURRENT UNMET NEEDS
- TABLE 13 PCR TECHNOLOGIES MARKET: ROLE IN ECOSYSTEM
- TABLE 14 US: CLASSIFICATION OF PCR TECHNOLOGY-ASSOCIATED DIAGNOSTIC DEVICES
- TABLE 15 CANADA: TIME, COST, AND COMPLEXITY OF REGISTRATION PROCESS
- TABLE 16 EUROPE: RISK, TIME, COST, AND COMPLEXITY OF REGISTRATION PROCESS
- TABLE 17 JAPAN: TIME, COST, AND COMPLEXITY OF REGISTRATION PROCESS
- TABLE 18 CHINA: TIME, COST, AND COMPLEXITY OF REGISTRATION PROCESS
- TABLE 19 NORTH AMERICA: REGULATORY BODIES, GOVERNMENT AGENCIES, AND OTHER ORGANIZATIONS
- TABLE 20 EUROPE: REGULATORY BODIES, GOVERNMENT AGENCIES, AND OTHER ORGANIZATIONS
- TABLE 21 ASIA PACIFIC: REGULATORY BODIES, GOVERNMENT AGENCIES, AND OTHER ORGANIZATIONS
- TABLE 22 LATIN AMERICA: REGULATORY BODIES, GOVERNMENT AGENCIES, AND OTHER ORGANIZATIONS
- TABLE 23 REST OF THE WORLD: REGULATORY BODIES, GOVERNMENT AGENCIES, AND OTHER ORGANIZATIONS
- TABLE 24 REIMBURSEMENT CODES FOR PCR TESTING, 2024
- TABLE 25 PCR TECHNOLOGIES MARKET, BY PRODUCT, 2022-2030 (USD MILLION)
- TABLE 26 PCR TECHNOLOGIES MARKET FOR REAGENTS AND CONSUMABLES, BY REGION, 2022-2030 (USD MILLION)
- TABLE 27 PCR TECHNOLOGIES MARKET FOR INSTRUMENTS, BY REGION, 2022-2030 (USD MILLION)
- TABLE 28 PCR TECHNOLOGIES MARKET FOR SOFTWARE AND SERVICES, BY REGION, 2022-2030 (USD MILLION)
- TABLE 29 PCR TECHNOLOGIES MARKET, BY TECHNIQUE, 2022-2030 (USD MILLION)
- TABLE 30 REAL-TIME PCR MARKET, BY REGION, 2022-2030 (USD MILLION)
- TABLE 31 REAL-TIME PCR MARKET, BY PRODUCT, 2022-2030 (USD MILLION)
- TABLE 32 REAL-TIME PCR MARKET, BY APPLICATION, 2022-2030 (USD MILLION)
- TABLE 33 REAL-TIME PCR MARKET, BY END USER, 2022-2030 (USD MILLION)
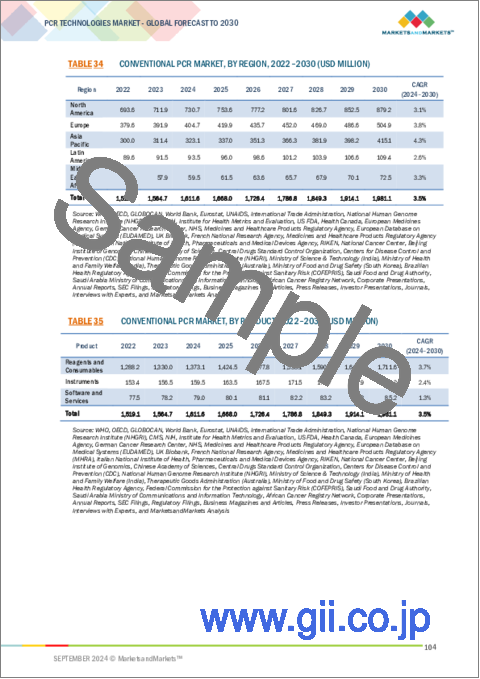
- TABLE 34 CONVENTIONAL PCR MARKET, BY REGION, 2022-2030 (USD MILLION)
- TABLE 35 CONVENTIONAL PCR MARKET, BY PRODUCT, 2022-2030 (USD MILLION)
- TABLE 36 CONVENTIONAL PCR MARKET, BY APPLICATION, 2022-2030 (USD MILLION)
- TABLE 37 CONVENTIONAL PCR MARKET, BY END USER, 2022-2030 (USD MILLION)
- TABLE 38 DIGITAL PCR MARKET, BY REGION, 2022-2030 (USD MILLION)
- TABLE 39 DIGITAL PCR MARKET, BY PRODUCT, 2022-2030 (USD MILLION)
- TABLE 40 DIGITAL PCR MARKET, BY APPLICATION, 2022-2030 (USD MILLION)
- TABLE 41 DIGITAL PCR MARKET, BY END USER, 2022-2030 (USD MILLION)
- TABLE 42 ONE-STEP RT-PCR VS. TWO-STEP RT-PCR
- TABLE 43 REVERSE TRANSCRIPTION PCR MARKET, BY REGION, 2022-2030 (USD MILLION)
- TABLE 44 REVERSE TRANSCRIPTION PCR MARKET, BY PRODUCT, 2022-2030 (USD MILLION)
- TABLE 45 REVERSE TRANSCRIPTION PCR MARKET, BY APPLICATION, 2022-2030 (USD MILLION)
- TABLE 46 REVERSE TRANSCRIPTION PCR MARKET, BY END USER, 2022-2030 (USD MILLION)
- TABLE 47 BENEFITS AND CONSIDERATIONS OF HOT-START PCR TECHNOLOGY
- TABLE 48 HOT-START PCR MARKET, BY REGION, 2022-2030 (USD MILLION)
- TABLE 49 HOT-START PCR MARKET, BY PRODUCT, 2022-2030 (USD MILLION)
- TABLE 50 HOT-START PCR MARKET, BY APPLICATION, 2022-2030 (USD MILLION)
- TABLE 51 HOT-START PCR MARKET, BY END USER, 2022-2030 (USD MILLION)
- TABLE 52 MULTIPLEX PCR MARKET, BY REGION, 2022-2030 (USD MILLION)
- TABLE 53 MULTIPLEX PCR MARKET, BY PRODUCT, 2022-2030 (USD MILLION)
- TABLE 54 MULTIPLEX PCR MARKET, BY APPLICATION, 2022-2030 (USD MILLION)
- TABLE 55 MULTIPLEX PCR MARKET, BY END USER, 2022-2030 (USD MILLION)
- TABLE 56 OTHER PCR TECHNIQUES MARKET, BY REGION, 2022-2030 (USD MILLION)
- TABLE 57 OTHER PCR TECHNIQUES MARKET, BY PRODUCT, 2022-2030 (USD MILLION)
- TABLE 58 OTHER PCR TECHNIQUES MARKET, BY APPLICATION, 2022-2030 (USD MILLION)
- TABLE 59 OTHER PCR TECHNIQUES MARKET, BY END USER, 2022-2030 (USD MILLION)
- TABLE 60 PCR TECHNOLOGIES MARKET, BY APPLICATION, 2022-2030 (USD MILLION)
- TABLE 61 PCR TECHNOLOGIES MARKET FOR DIAGNOSTIC APPLICATIONS, BY REGION, 2022-2030 (USD MILLION)
- TABLE 62 PCR TECHNOLOGIES MARKET FOR GENOTYPING, BY REGION, 2022-2030 (USD MILLION)
- TABLE 63 PCR TECHNOLOGIES MARKET FOR NUCLEIC ACID DETECTION, BY REGION, 2022-2030 (USD MILLION)
- TABLE 64 PCR TECHNOLOGIES MARKET FOR GENE EXPRESSION ANALYSIS, BY REGION, 2022-2030 (USD MILLION)
- TABLE 65 PCR TECHNOLOGIES MARKET FOR NUCLEIC ACID SYNTHESIS, BY REGION, 2022-2030 (USD MILLION)
- TABLE 66 PCR TECHNOLOGIES MARKET FOR GENETIC SEQUENCING, BY REGION, 2022-2030 (USD MILLION)
- TABLE 67 PCR TECHNOLOGIES MARKET FOR ENVIRONMENTAL APPLICATIONS, BY REGION, 2022-2030 (USD MILLION)
- TABLE 68 PCR TECHNOLOGIES MARKET FOR STANDARD VALIDATION/VERIFICATION, BY REGION, 2022-2030 (USD MILLION)
- TABLE 69 PCR TECHNOLOGIES MARKET FOR OTHER APPLICATIONS, BY REGION, 2022-2030 (USD MILLION)
- TABLE 70 PCR TECHNOLOGIES MARKET, BY END USER, 2022-2030 (USD MILLION)
- TABLE 71 PCR TECHNOLOGIES MARKET FOR HOSPITAL LABORATORIES, BY REGION, 2022-2030 (USD MILLION)
- TABLE 72 PCR TECHNOLOGIES MARKET FOR DIAGNOSTIC LABORATORIES, BY REGION, 2022-2030 (USD MILLION)
- TABLE 73 PCR TECHNOLOGIES MARKET FOR ACADEMIC AND GOVERNMENT ORGANIZATIONS, BY REGION, 2022-2030 (USD MILLION)
- TABLE 74 PCR TECHNOLOGIES MARKET FOR PHARMA-BIOTECH COMPANIES, BY REGION, 2022-2030 (USD MILLION)
- TABLE 75 PCR TECHNOLOGIES MARKET FOR OTHER END USERS, BY REGION, 2022-2030 (USD MILLION)
- TABLE 76 PCR TECHNOLOGIES MARKET, BY REGION, 2022-2030 (USD MILLION)
- TABLE 77 NORTH AMERICA: KEY MACROINDICATORS
- TABLE 78 NORTH AMERICA: PCR TECHNOLOGIES MARKET, BY COUNTRY, 2022-2030 (USD MILLION)
- TABLE 79 NORTH AMERICA: PCR TECHNOLOGIES MARKET, BY PRODUCT, 2022-2030 (USD MILLION)
- TABLE 80 NORTH AMERICA: PCR TECHNOLOGIES MARKET, BY TECHNIQUE, 2022-2030 (USD MILLION)
- TABLE 81 NORTH AMERICA: PCR TECHNOLOGIES MARKET, BY APPLICATION, 2022-2030 (USD MILLION)
- TABLE 82 NORTH AMERICA: PCR TECHNOLOGIES MARKET, BY END USER, 2022-2030 (USD MILLION)
- TABLE 83 US: KEY MACROINDICATORS
- TABLE 84 US: PCR TECHNOLOGIES MARKET, BY PRODUCT, 2022-2030 (USD MILLION)
- TABLE 85 US: PCR TECHNOLOGIES MARKET, BY TECHNIQUE, 2022-2030 (USD MILLION)
- TABLE 86 CANADA: KEY MACROINDICATORS
- TABLE 87 CANADA: PCR TECHNOLOGIES MARKET, BY PRODUCT, 2022-2030 (USD MILLION)
- TABLE 88 CANADA: PCR TECHNOLOGIES MARKET, BY TECHNIQUE, 2022-2030 (USD MILLION)
- TABLE 89 EUROPE: KEY MACROINDICATORS
- TABLE 90 EUROPE: PCR TECHNOLOGIES MARKET, BY COUNTRY, 2022-2030 (USD MILLION)
- TABLE 91 EUROPE: PCR TECHNOLOGIES MARKET, BY PRODUCT, 2022-2030 (USD MILLION)
- TABLE 92 EUROPE: PCR TECHNOLOGIES MARKET, BY TECHNIQUE, 2022-2030 (USD MILLION)
- TABLE 93 EUROPE: PCR TECHNOLOGIES MARKET, BY APPLICATION, 2022-2030 (USD MILLION)
- TABLE 94 EUROPE: PCR TECHNOLOGIES MARKET, BY END USER, 2022-2030 (USD MILLION)
- TABLE 95 GERMANY: KEY MACROINDICATORS
- TABLE 96 GERMANY: PCR TECHNOLOGIES MARKET, BY PRODUCT, 2022-2030 (USD MILLION)
- TABLE 97 GERMANY: PCR TECHNOLOGIES MARKET, BY TECHNIQUE, 2022-2030 (USD MILLION)
- TABLE 98 FRANCE: KEY MACROINDICATORS
- TABLE 99 FRANCE: PCR TECHNOLOGIES MARKET, BY PRODUCT, 2022-2030 (USD MILLION)
- TABLE 100 FRANCE: PCR TECHNOLOGIES MARKET, BY TECHNIQUE, 2022-2030 (USD MILLION)
- TABLE 101 UK: KEY MACROINDICATORS
- TABLE 102 UK: PCR TECHNOLOGIES MARKET, BY PRODUCT, 2022-2030 (USD MILLION)
- TABLE 103 UK: PCR TECHNOLOGIES MARKET, BY TECHNIQUE, 2022-2030 (USD MILLION)
- TABLE 104 ITALY: KEY MACROINDICATORS
- TABLE 105 ITALY: PCR TECHNOLOGIES MARKET, BY PRODUCT, 2022-2030 (USD MILLION)
- TABLE 106 ITALY: PCR TECHNOLOGIES MARKET, BY TECHNIQUE, 2022-2030 (USD MILLION)
- TABLE 107 SPAIN: KEY MACROINDICATORS
- TABLE 108 SPAIN: PCR TECHNOLOGIES MARKET, BY PRODUCT, 2022-2030 (USD MILLION)
- TABLE 109 SPAIN: PCR TECHNOLOGIES MARKET, BY TECHNIQUE, 2022-2030 (USD MILLION)
- TABLE 110 REST OF EUROPE: PCR TECHNOLOGIES MARKET, BY PRODUCT, 2022-2030 (USD MILLION)
- TABLE 111 REST OF EUROPE: PCR TECHNOLOGIES MARKET, BY TECHNIQUE, 2022-2030 (USD MILLION)
- TABLE 112 ASIA PACIFIC: MACROECONOMIC INDICATORS
- TABLE 113 ASIA PACIFIC: PCR TECHNOLOGIES MARKET, BY COUNTRY, 2022-2030 (USD MILLION)
- TABLE 114 ASIA PACIFIC: PCR TECHNOLOGIES MARKET, BY PRODUCT, 2022-2030 (USD MILLION)
- TABLE 115 ASIA PACIFIC: PCR TECHNOLOGIES MARKET, BY TECHNIQUE, 2022-2030 (USD MILLION)
- TABLE 116 ASIA PACIFIC: PCR TECHNOLOGIES MARKET, BY APPLICATION, 2022-2030 (USD MILLION)
- TABLE 117 ASIA PACIFIC: PCR TECHNOLOGIES MARKET, BY END USER, 2022-2030 (USD MILLION)
- TABLE 118 CHINA: KEY MACROINDICATORS
- TABLE 119 CHINA: PCR TECHNOLOGIES MARKET, BY PRODUCT, 2022-2030 (USD MILLION)
- TABLE 120 CHINA: PCR TECHNOLOGIES MARKET, BY TECHNIQUE, 2022-2030 (USD MILLION)
- TABLE 121 JAPAN: KEY MACROINDICATORS
- TABLE 122 JAPAN: PCR TECHNOLOGIES MARKET, BY PRODUCT, 2022-2030 (USD MILLION)
- TABLE 123 JAPAN: PCR TECHNOLOGIES MARKET, BY TECHNIQUE, 2022-2030 (USD MILLION)
- TABLE 124 INDIA: KEY MACROINDICATORS
- TABLE 125 INDIA: PCR TECHNOLOGIES MARKET, BY PRODUCT, 2022-2030 (USD MILLION)
- TABLE 126 INDIA: PCR TECHNOLOGIES MARKET, BY TECHNIQUE, 2022-2030 (USD MILLION)
- TABLE 127 AUSTRALIA: KEY MACROINDICATORS
- TABLE 128 AUSTRALIA: PCR TECHNOLOGIES MARKET, BY PRODUCT, 2022-2030 (USD MILLION)
- TABLE 129 AUSTRALIA: PCR TECHNOLOGIES MARKET, BY TECHNIQUE, 2022-2030 (USD MILLION)
- TABLE 130 SOUTH KOREA: KEY MACROINDICATORS
- TABLE 131 SOUTH KOREA: PCR TECHNOLOGIES MARKET, BY PRODUCT, 2022-2030 (USD MILLION)
- TABLE 132 SOUTH KOREA: PCR TECHNOLOGIES MARKET, BY TECHNIQUE, 2022-2030 (USD MILLION)
- TABLE 133 REST OF ASIA PACIFIC: PCR TECHNOLOGIES MARKET, BY PRODUCT, 2022-2030 (USD MILLION)
- TABLE 134 REST OF ASIA PACIFIC: PCR TECHNOLOGIES MARKET, BY TECHNIQUE, 2022-2030 (USD MILLION)
- TABLE 135 LATIN AMERICA: KEY MACROINDICATORS
- TABLE 136 LATIN AMERICA: PCR TECHNOLOGIES MARKET, BY COUNTRY, 2022-2030 (USD MILLION)
- TABLE 137 LATIN AMERICA: PCR TECHNOLOGIES MARKET, BY PRODUCT, 2022-2030 (USD MILLION)
- TABLE 138 LATIN AMERICA: PCR TECHNOLOGIES MARKET, BY TECHNIQUE, 2022-2030 (USD MILLION)
- TABLE 139 LATIN AMERICA: PCR TECHNOLOGIES MARKET, BY APPLICATION, 2022-2030 (USD MILLION)
- TABLE 140 LATIN AMERICA: PCR TECHNOLOGIES MARKET, BY END USER, 2022-2030 (USD MILLION)
- TABLE 141 BRAZIL: KEY MACROINDICATORS
- TABLE 142 BRAZIL: PCR TECHNOLOGIES MARKET, BY PRODUCT, 2022-2030 (USD MILLION)
- TABLE 143 BRAZIL: PCR TECHNOLOGIES MARKET, BY TECHNIQUE, 2022-2030 (USD MILLION)
- TABLE 144 MEXICO: KEY MACROINDICATORS
- TABLE 145 MEXICO: PCR TECHNOLOGIES MARKET, BY PRODUCT, 2022-2030 (USD MILLION)
- TABLE 146 MEXICO: PCR TECHNOLOGIES MARKET, BY TECHNIQUE, 2022-2030 (USD MILLION)
- TABLE 147 REST OF LATIN AMERICA: PCR TECHNOLOGIES MARKET, BY PRODUCT, 2022-2030 (USD MILLION)
- TABLE 148 REST OF LATIN AMERICA: PCR TECHNOLOGIES MARKET, BY TECHNIQUE, 2022-2030 (USD MILLION)
- TABLE 149 MIDDLE EAST & AFRICA: PCR TECHNOLOGIES MARKET, BY REGION, 2022-2030 (USD MILLION)
- TABLE 150 MIDDLE EAST & AFRICA: KEY MACROINDICATORS
- TABLE 151 MIDDLE EAST & AFRICA: PCR TECHNOLOGIES MARKET, BY PRODUCT, 2022-2030 (USD MILLION)
- TABLE 152 MIDDLE EAST & AFRICA: PCR TECHNOLOGIES MARKET, BY TECHNIQUE, 2022-2030 (USD MILLION)
- TABLE 153 MIDDLE EAST & AFRICA: PCR TECHNOLOGIES MARKET, BY APPLICATION, 2022-2030 (USD MILLION)
- TABLE 154 MIDDLE EAST & AFRICA: PCR TECHNOLOGIES MARKET, BY END USER, 2022-2030 (USD MILLION)
- TABLE 155 GCC COUNTRIES: PCR TECHNOLOGIES MARKET, BY PRODUCT, 2022-2030 (USD MILLION)
- TABLE 156 GCC COUNTRIES: PCR TECHNOLOGIES MARKET, BY TECHNIQUE, 2022-2030 (USD MILLION)
- TABLE 157 REST OF MIDDLE EAST & AFRICA: PCR TECHNOLOGIES MARKET, BY PRODUCT, 2022-2030 (USD MILLION)
- TABLE 158 REST OF MIDDLE EAST & AFRICA: PCR TECHNOLOGIES MARKET, BY TECHNIQUE, 2022-2030 (USD MILLION)
- TABLE 159 OVERVIEW OF STRATEGIES DEPLOYED BY KEY PLAYERS IN PCR TECHNOLOGIES MARKET
- TABLE 160 PCR TECHNOLOGIES MARKET: DEGREE OF COMPETITION
- TABLE 161 PCR TECHNOLOGIES MARKET: PRODUCT FOOTPRINT
- TABLE 162 PCR TECHNOLOGIES MARKET: APPLICATION FOOTPRINT
- TABLE 163 PCR TECHNOLOGIES MARKET: TECHNIQUE FOOTPRINT
- TABLE 164 PCR TECHNOLOGIES MARKET: END USER FOOTPRINT
- TABLE 165 PCR TECHNOLOGIES MARKET: REGION FOOTPRINT
- TABLE 166 PCR TECHNOLOGIES MARKET: DETAILED LIST OF KEY STARTUPS/SMES PLAYERS
- TABLE 167 PCR TECHNOLOGIES MARKET: COMPETITIVE BENCHMARKING OF KEY STARTUPS/SMES
- TABLE 168 PCR TECHNOLOGIES MARKET: PRODUCT LAUNCHES AND APPROVALS, JANUARY 2021-DECEMBER 2024
- TABLE 169 PCR TECHNOLOGIES MARKET: DEALS, JANUARY 2021-DECEMBER 2024
- TABLE 170 THERMO FISHER SCIENTIFIC INC.: COMPANY OVERVIEW
- TABLE 171 THERMO FISHER SCIENTIFIC INC.: PRODUCTS/SERVICES/SOLUTIONS OFFERED
- TABLE 172 THERMO FISHER SCIENTIFIC INC.: PRODUCT LAUNCHES AND APPROVALS, JANUARY 2021-DECEMBER 2024
- TABLE 173 THERMO FISHER SCIENTIFIC INC.: DEALS, JANUARY 2021-DECEMBER 2024
- TABLE 174 F. HOFFMANN-LA ROCHE LTD.: COMPANY OVERVIEW
- TABLE 175 F. HOFFMANN-LA ROCHE LTD.: PRODUCTS/SERVICES/SOLUTIONS OFFERED
- TABLE 176 F. HOFFMANN-LA ROCHE LTD.: PRODUCT LAUNCHES AND APPROVALS, JANUARY 2021-DECEMBER 2024
- TABLE 177 F. HOFFMANN-LA ROCHE LTD.: DEALS, JANUARY 2021-DECEMBER 2024
- TABLE 178 AGILENT TECHNOLOGIES, INC.: COMPANY OVERVIEW
- TABLE 179 AGILENT TECHNOLOGIES, INC.: PRODUCTS/SERVICES/SOLUTIONS OFFERED
- TABLE 180 AGILENT TECHNOLOGIES, INC.: PRODUCT LAUNCHES, JANUARY 2021-DECEMBER 2024
- TABLE 181 AGILENT TECHNOLOGIES, INC.: OTHER DEVELOPMENTS, JANUARY 2021-DECEMBER 2024
- TABLE 182 BIO-RAD LABORATORIES, INC.: COMPANY OVERVIEW
- TABLE 183 BIO-RAD LABORATORIES, INC.: PRODUCTS/SERVICES/SOLUTIONS OFFERED
- TABLE 184 BIO-RAD LABORATORIES, INC.: PRODUCT LAUNCHES, JANUARY 2021-DECEMBER 2024
- TABLE 185 BIO-RAD LABORATORIES, INC.: DEALS, JANUARY 2021-DECEMBER 2024
- TABLE 186 QIAGEN: COMPANY OVERVIEW
- TABLE 187 QIAGEN: PRODUCTS/SERVICES/SOLUTIONS OFFERED
- TABLE 188 QIAGEN: PRODUCT LAUNCHES AND APPROVALS, JANUARY 2021-DECEMBER 2024
- TABLE 189 QIAGEN: DEALS, JANUARY 2021-DECEMBER 2024
- TABLE 190 DANAHER CORPORATION: COMPANY OVERVIEW
- TABLE 191 DANAHER CORPORATION: PRODUCTS/SERVICES/SOLUTIONS OFFERED
- TABLE 192 DANAHER CORPORATION: PRODUCT APPROVALS, JANUARY 2021-DECEMBER 2024
- TABLE 193 DANAHER CORPORATION: DEALS, JANUARY 2021- AUGUST 2024
- TABLE 194 DANAHER CORPORATION: EXPANSIONS, JANUARY 2021-DECEMBER 2024
- TABLE 195 ABBOTT: COMPANY OVERVIEW
- TABLE 196 ABBOTT: PRODUCTS/SERVICES/SOLUTIONS OFFERED
- TABLE 197 ABBOTT: PRODUCT APPROVALS, JANUARY 2021-DECEMBER 2024
- TABLE 198 TAKARA BIO INC.: COMPANY OVERVIEW
- TABLE 199 TAKARA BIO INC.: PRODUCTS/SERVICES/SOLUTIONS OFFERED
- TABLE 200 TAKARA BIO INC.: PRODUCT LAUNCHES, JANUARY 2021-DECEMBER 2024
- TABLE 201 TAKARA BIO INC.: DEALS, JANUARY 2021-DECEMBER 2024
- TABLE 202 ANALYTIK JENA GMBH+CO. KG: COMPANY OVERVIEW
- TABLE 203 ANALYTIK JENA GMBH+CO. KG: PRODUCTS/SERVICES/SOLUTIONS OFFERED
- TABLE 204 ANALYTIK JENA GMBH+CO. KG: PRODUCT LAUNCHES, JANUARY 2021-DECEMBER 2024
- TABLE 205 ANALYTIK JENA GMBH+CO. KG: DEALS, JANUARY 2021-DECEMBER 2024
- TABLE 206 EPPENDORF SE: COMPANY OVERVIEW
- TABLE 207 EPPENDORF SE: PRODUCTS/SERVICES/SOLUTIONS OFFERED
- TABLE 208 EPPENDORF SE: PRODUCT LAUNCHES, JANUARY 2021-DECEMBER 2024
- TABLE 209 MERCK KGAA: COMPANY OVERVIEW
- TABLE 210 MERCK KGAA: PRODUCTS/SERVICES/SOLUTIONS OFFERED
- TABLE 211 BIONEER CORPORATION: COMPANY OVERVIEW
- TABLE 212 BIONEER CORPORATION: PRODUCTS/SERVICES/SOLUTIONS OFFERED
- TABLE 213 BIONEER CORPORATION: OTHER DEVELOPMENTS, JANUARY 2021-DECEMBER 2024
- TABLE 214 REVVITY: COMPANY OVERVIEW
- TABLE 215 REVVITY: PRODUCTS/SERVICES/SOLUTIONS OFFERED
- TABLE 216 REVVITY: PRODUCT LAUNCHES, JANUARY 2021-DECEMBER 2024
- TABLE 217 REVVITY: OTHER DEVELOPMENTS, JANUARY 2021-DECEMBER 2024
- TABLE 218 BECTON, DICKINSON AND COMPANY: COMPANY OVERVIEW
- TABLE 219 BECTON, DICKINSON AND COMPANY: PRODUCTS/SERVICES/SOLUTIONS OFFERED
- TABLE 220 BECTON, DICKINSON AND COMPANY: PRODUCT LAUNCHES AND APPROVALS, JANUARY 2021-DECEMBER 2024
- TABLE 221 BECTON, DICKINSON AND COMPANY: DEALS, JANUARY 2021-DECEMBER 2024
- TABLE 222 BIOMERIEUX: COMPANY OVERVIEW
- TABLE 223 BIOMERIEUX: PRODUCTS/SERVICES/SOLUTIONS OFFERED
- TABLE 224 BIOMERIEUX: PRODUCT LAUNCHES AND APPROVALS, JANUARY 2021-DECEMBER 2024
- TABLE 225 STANDARD BIOTOOLS: COMPANY OVERVIEW
- TABLE 226 STANDARD BIOTOOLS: PRODUCTS/SERVICES/SOLUTIONS OFFERED
- TABLE 227 HOLOGIC, INC.: COMPANY OVERVIEW
- TABLE 228 HOLOGIC, INC.: PRODUCTS/SERVICES/SOLUTIONS OFFERED
- TABLE 229 HOLOGIC, INC.: PRODUCT LAUNCHES, JANUARY 2021-DECEMBER 2024
- TABLE 230 LONZA: COMPANY OVERVIEW
- TABLE 231 LONZA: PRODUCTS/SERVICES/SOLUTIONS OFFERED
- TABLE 232 ILLUMINA, INC.: COMPANY OVERVIEW
- TABLE 233 ILLUMINA, INC.: PRODUCTS/SERVICES/SOLUTIONS OFFERED
- TABLE 234 SANSURE BIOTECH INC.: COMPANY OVERVIEW
- TABLE 235 SANSURE BIOTECH INC.: PRODUCTS/SERVICES/SOLUTIONS OFFERED
- TABLE 236 PROMEGA CORPORATION: COMPANY OVERVIEW
- TABLE 237 LIMINGBIO: COMPANY OVERVIEW
- TABLE 238 TRANSGEN BIOTECH CO., LTD.: COMPANY OVERVIEW
- TABLE 239 DAAN GENE CO., LTD.: COMPANY OVERVIEW
- TABLE 240 BIOBASE GROUP: COMPANY OVERVIEW
- TABLE 241 NIPPON GENETICS EUROPE: COMPANY OVERVIEW
- TABLE 242 STILLA: COMPANY OVERVIEW
- TABLE 243 GENSCRIPT: COMPANY OVERVIEW
- TABLE 244 NEW ENGLAND BIOLABS: COMPANY OVERVIEW
List of Figures
- FIGURE 1 PCR TECHNOLOGIES MARKET: SEGMENTS CONSIDERED
- FIGURE 2 PCR TECHNOLOGIES MARKET: YEARS CONSIDERED
- FIGURE 3 PCR TECHNOLOGIES MARKET: RESEARCH DATA
- FIGURE 4 PCR TECHNOLOGIES MARKET: RESEARCH DESIGN
- FIGURE 5 PCR TECHNOLOGIES MARKET: KEY DATA FROM SECONDARY SOURCES
- FIGURE 6 PCR TECHNOLOGIES MARKET: KEY PRIMARY SOURCES (DEMAND AND SUPPLY SIDES)
- FIGURE 7 PCR TECHNOLOGIES MARKET: KEY INSIGHTS FROM INDUSTRY EXPERTS
- FIGURE 8 BREAKDOWN OF PRIMARIES: SUPPLY- AND DEMAND-SIDE PARTICIPANTS
- FIGURE 9 BREAKDOWN OF PRIMARIES: BY COMPANY TYPE, DESIGNATION, AND REGION
- FIGURE 10 RESEARCH METHODOLOGY: HYPOTHESIS BUILDING
- FIGURE 11 PCR TECHNOLOGIES MARKET SIZE ESTIMATION: COMPANY REVENUE ESTIMATION
- FIGURE 12 PCR TECHNOLOGIES MARKET: BOTTOM-UP APPROACH
- FIGURE 13 PCR TECHNOLOGIES MARKET: TOP-DOWN APPROACH
- FIGURE 14 DATA TRIANGULATION METHODOLOGY
- FIGURE 15 GROWTH PROJECTIONS ON REVENUE IMPACT OF KEY MACROINDICATORS
- FIGURE 16 PCR TECHNOLOGIES MARKET, BY PRODUCT, 2024 VS. 2030 (USD MILLION)
- FIGURE 17 PCR TECHNOLOGIES MARKET, BY TECHNIQUE, 2024 VS. 2030 (USD MILLION)
- FIGURE 18 PCR TECHNOLOGIES MARKET, BY APPLICATION, 2024 VS. 2030 (USD MILLION)
- FIGURE 19 PCR TECHNOLOGIES MARKET, BY END USER, 2024 VS. 2030 (USD MILLION)
- FIGURE 20 PCR TECHNOLOGIES MARKET: REGIONAL SNAPSHOT
- FIGURE 21 INCREASING DEMAND FOR ADVANCED PCR TECHNOLOGIES TO DRIVE MARKET
- FIGURE 22 ASIA PACIFIC TO REGISTER HIGHEST CAGR DURING STUDY PERIOD
- FIGURE 23 US AND DIAGNOSTIC LABORATORIES COMMANDED LARGEST MARKET SHARE IN 2023
- FIGURE 24 CHINA TO REGISTER HIGHEST GROWTH RATE FROM 2024 TO 2030
- FIGURE 25 PCR TECHNOLOGIES MARKET: DRIVERS, RESTRAINTS, OPPORTUNITIES, AND CHALLENGES
- FIGURE 26 PCR TECHNOLOGIES MARKET: VALUE CHAIN ANALYSIS
- FIGURE 27 PCR TECHNOLOGIES MARKET: PORTER'S FIVE FORCES ANALYSIS
- FIGURE 28 INFLUENCE OF KEY STAKEHOLDERS ON BUYING PROCESS
- FIGURE 29 KEY BUYING CRITERIA FOR TOP FOUR END USERS
- FIGURE 30 PCR TECHNOLOGY-RELATED PATENT APPLICATIONS AND PUBLICATIONS, JANUARY 2014-DECEMBER 2024
- FIGURE 31 AVERAGE SELLING PRICE OF REAL-TIME PCR INSTRUMENTS, BY KEY PLAYER, 2024
- FIGURE 32 AVERAGE SELLING PRICE OF PCR TECHNOLOGY-BASED PRODUCTS, BY REGION, 2022-2024
- FIGURE 33 PCR TECHNOLOGIES MARKET: ECOSYSTEM ANALYSIS
- FIGURE 34 PCR TECHNOLOGIES MARKET: SUPPLY CHAIN ANALYSIS
- FIGURE 35 PCR TECHNOLOGIES MARKET: TRENDS/DISRUPTIONS IMPACTING CUSTOMER BUSINESS
- FIGURE 36 INVESTMENT AND FUNDING SCENARIO, 2019-2023
- FIGURE 37 NUMBER OF INVESTOR DEALS, BY KEY PLAYER, 2019-2023
- FIGURE 38 VALUE OF INVESTOR DEALS, BY KEY PLAYER, 2019-2023 (USD MILLION)
- FIGURE 39 PCR TECHNOLOGIES MARKET: IMPACT OF AI/GEN AI
- FIGURE 40 NORTH AMERICA: PCR TECHNOLOGIES MARKET SNAPSHOT
- FIGURE 41 ASIA PACIFIC: PCR TECHNOLOGIES MARKET SNAPSHOT
- FIGURE 42 REVENUE ANALYSIS OF KEY PLAYERS IN PCR TECHNOLOGIES MARKET, 2019-2023
- FIGURE 43 PCR INSTRUMENTS MARKET SHARE ANALYSIS, 2023
- FIGURE 44 PCR REAGENTS AND CONSUMABLES MARKET SHARE ANALYSIS, 2023
- FIGURE 45 PCR SOFTWARE AND SERVICES MARKET SHARE ANALYSIS (2023)
- FIGURE 46 PCR TECHNOLOGIES MARKET: COMPANY EVALUATION MATRIX (KEY PLAYERS), 2023
- FIGURE 47 PCR TECHNOLOGIES MARKET: COMPANY FOOTPRINT
- FIGURE 48 PCR TECHNOLOGIES MARKET: COMPANY EVALUATION MATRIX (STARTUPS/SMES), 2023
- FIGURE 49 EV/EBITDA OF KEY VENDORS, 2025
- FIGURE 50 YTD TOTAL RETURN AND 5-YEAR STOCK BETA VALUE FOR KEY PCR TECHNOLOGY VENDORS
- FIGURE 51 PCR TECHNOLOGIES MARKET: BRAND/PRODUCT COMPARATIVE ANALYSIS
- FIGURE 52 THERMO FISHER SCIENTIFIC INC.: COMPANY SNAPSHOT
- FIGURE 53 F. HOFFMANN-LA ROCHE LTD.: COMPANY SNAPSHOT
- FIGURE 54 AGILENT TECHNOLOGIES, INC.: COMPANY SNAPSHOT
- FIGURE 55 BIO-RAD LABORATORIES, INC.: COMPANY SNAPSHOT
- FIGURE 56 QIAGEN: COMPANY SNAPSHOT
- FIGURE 57 DANAHER CORPORATION: COMPANY SNAPSHOT
- FIGURE 58 ABBOTT: COMPANY SNAPSHOT
- FIGURE 59 TAKARA BIO INC.: COMPANY SNAPSHOT
- FIGURE 60 EPPENDORF SE: COMPANY SNAPSHOT
- FIGURE 61 MERCK KGAA: COMPANY SNAPSHOT
- FIGURE 62 BIONEER CORPORATION: COMPANY SNAPSHOT
- FIGURE 63 REVVITY: COMPANY SNAPSHOT
- FIGURE 64 BECTON, DICKINSON AND COMPANY: COMPANY SNAPSHOT
- FIGURE 65 BIOMERIEUX: COMPANY SNAPSHOT
- FIGURE 66 STANDARD BIOTOOLS: COMPANY SNAPSHOT
- FIGURE 67 HOLOGIC, INC.: COMPANY SNAPSHOT
- FIGURE 68 LONZA: COMPANY SNAPSHOT
- FIGURE 69 ILLUMINA, INC.: COMPANY SNAPSHOT
- FIGURE 70 SANSURE BIOTECH INC.: COMPANY SNAPSHOT
The PCR technologies market is projected to reach USD 21.89 Billion by 2030 from USD 14.61 in 2024, growing at a CAGR of 7.0% during the forecast period. The market is growing due to numerous factors.Increasing cases of infectious diseases, and regular advancements in PCR technologies drives this market. Rising expenditure in research and development and increase in application of biomarker profiling to detect diseases are other factors. Additionally, the market growth is affected by inclusion of PCR technology with artificial intelligence.
| Scope of the Report | |
|---|---|
| Years Considered for the Study | 2022-2030 |
| Base Year | 2023 |
| Forecast Period | 2024-2030 |
| Units Considered | Value (USD Million/USD Billion) |
| Segments | By Product, Technique, Application, End User, and Region |
| Regions covered | North America, Europe, Asia Pacific, Latin America, and the Middle East & Africa |
"qPCR to account for largest market share in 2023."
A variant of the Polymerase Chain Reaction (PCR) called quantitative PCR (qPCR), sometimes referred to as real-time PCR, enables the simultaneous amplification and quantification of a particular DNA or RNA sequence. qPCR tracks the reaction in real time as it develops and provides quantitative information on the amount of target nucleic acid, in contrast to traditional PCR, which only identifies the presence of genetic material after the reaction is finished. The market is driven by the rising demand for qPCR instruments, the increasing prevalence of illnesses, and technical advances. Moreover, qPCR is a very specific and sensitive method for identifying and measuring nucleic acids, which makes it necessary for the diagnosis of infectious disorders.
"Diagnostic Laboratories to hold largest share in the market."
Various significant factors are propelling the growth of hospitals and diagnostic centers in the microfluidics industry. One important factor is the rising requirement for point-of-care diagnostics, as they provides quick, on-site testing that improves patient outcomes. Moreover, the requirement for efficacious diagnostics in clinical settings has risen due to the increase in infectious diseases like COVID-19. These equipment decrease cost, expedites testing methods, and improve precision and accuracy of diagnosis. Diagnostic labs require PCR identify and diagnose a variety of illnesses. These labs use PCR extensively because of its precision, sensitivity, and speed in diagnosing genetic abnormalities, and infectious diseases.
"North America to register largest share in 2023."
The largest share was hold by North America in 2023. North America comprise US and Canada.
The growth is supported by increase in drug development associated with genomics. Apart from that, government led initiatives and increase in funding and grants supports growth. The region also has strong presence of prominent players who support the growth of this market by carrying out strategic partnerships, collaborations, expansion and acquisitions. Wide application of PCR methods in hospitals and diagnostic labs of this region is also increasing the demand for microfluidics in North America.
A breakdown of the primary participants referred to for this report is provided below:
- By Company Type: Tier 1-35%, Tier 2-45%, and Tier 3- 20%
- By Designation: C-level-- 35%, Director-level-25%, and Others-40%
- By Region: North America-40%, Europe-30%, Asia Pacific-20%, Latin America- 5%, Middle East and Africa- 5%
Prominent players in the PCR technologies market include F. Hoffman-La Roche Ltd. (Switzerland), Thermo Fisher Scientific, Inc. (US), Bio-Rad Laboratories, Inc. (US), QIAGEN (Germany), Sansure Biotech Inc. (China) Becton, Dickinson and Company (US) and Analytik Jena AG (Germany), Takara Bio, Inc. (Japan), Agilent Technologies, Inc. (US), Standard Biotools (US), Danaher Corporation (US), Abbott Laboratories (US), Merck KGaA (Germany), Illumina, Inc. (US), Bioneer Corporation (South Korea), PerkinElmer Inc. (US), Hologic Inc. (US),.
Research Coverage
The report comprise segmentation that includes end users, products, applications, and geographic regions. It also discusses the key drivers, restraints, opportunities, and challenges affecting the growth of the PCR technologies market. The research offers stakeholders an assessment of market potential and challenges, with a focus on key players and competitive landscapes. Additionally, micromarkets are assessed according to their overall to the microfluidics sector, growth patterns, and potential. The analysis estimates increase in market segment revenues, focusing on five regions.
Key Benefits of Buying the Report:
This research aids new and existing players in the PCR technologies market to assess the sustainability of their investments by offering detailed information. It offers a dataset to assist in making key decisions. The main advantage of this report includes risk evaluation and offering direction for investment decisions. Market segmentation as per the end-users and geographical areas is offered in the study, that provides analysis and insights. It also provides trends, obstacles, opportunities, and drivers, giving stakeholders the information they need to make strategic decisions.
The report provides the insights on the following pointers:
Analysis of the key drivers, restraints, opportunities, and challenges impacting the PCR technologies market growth: advanced technology and rise in prevalence of infectious diseases ; premium price of devices and strict regulations ; rise in number of diagnostic centers/labs.
Product Development/Innovation: Overview of technologies, research & development ventures and launch of innovative product & service for the microfluidics industry.
Market Development: Details related to profitable markets: this research discussees the PCR technologies business in numerous regions.
Market Diversification: Detailed understanding of advanced products, unexplored areas, latest developments, and investment in the market.
Competitive Assessment: Detailed analysis of market share, services and products offered and key strategies adopted by prominent players such as Danaher Corporation (US), Agilent Technologies, Inc. (US), biomerieux (France), Thermo Fisher Scientific Inc. (US) and Abbott laboratories (US).
TABLE OF CONTENTS
1 INTRODUCTION
- 1.1 STUDY OBJECTIVES
- 1.2 MARKET DEFINITION
- 1.3 STUDY SCOPE
- 1.3.1 SEGMENTS CONSIDERED
- 1.3.2 INCLUSIONS & EXCLUSIONS
- 1.3.3 YEARS CONSIDERED
- 1.3.4 CURRENCY CONSIDERED
- 1.4 STAKEHOLDERS
- 1.5 SUMMARY OF CHANGES
2 RESEARCH METHODOLOGY
- 2.1 RESEARCH DATA
- 2.2 RESEARCH DESIGN
- 2.2.1 SECONDARY RESEARCH
- 2.2.1.1 Key secondary sources
- 2.2.1.2 Key objectives of secondary research
- 2.2.1.3 Key data from secondary sources
- 2.2.2 PRIMARY RESEARCH
- 2.2.2.1 Key primary sources
- 2.2.2.2 Key objectives of primary research
- 2.2.2.3 Key industry insights
- 2.2.2.4 Breakdown of primaries
- 2.2.1 SECONDARY RESEARCH
- 2.3 MARKET SIZE ESTIMATION
- 2.3.1 BOTTOM-UP APPROACH
- 2.3.1.1 Company revenue estimation approach
- 2.3.1.2 Customer-based market estimation
- 2.3.1.3 Top-down approach
- 2.3.1.4 Primary interviews
- 2.3.2 GROWTH FORECAST
- 2.3.1 BOTTOM-UP APPROACH
- 2.4 DATA TRIANGULATION
- 2.5 MARKET SHARE ASSESSMENT
- 2.6 STUDY ASSUMPTIONS
- 2.7 GROWTH ASSUMPTIONS
- 2.8 RISK ASSESSMENT
- 2.9 RESEARCH LIMITATIONS
3 EXECUTIVE SUMMARY
4 PREMIUM INSIGHTS
- 4.1 PCR TECHNOLOGIES MARKET OVERVIEW
- 4.2 PCR TECHNOLOGIES MARKET, BY REGION, 2024 VS. 2030 (USD MILLION)
- 4.3 NORTH AMERICA: PCR TECHNOLOGIES MARKET, BY COUNTRY AND END USER, 2023 (USD MILLION)
- 4.4 PCR TECHNOLOGIES MARKET: GEOGRAPHIC SNAPSHOT
5 MARKET OVERVIEW
- 5.1 INTRODUCTION
- 5.2 MARKET DYNAMICS
- 5.2.1 DRIVERS
- 5.2.1.1 Increasing outbreaks of infectious diseases/viral persistence
- 5.2.1.2 Development of miniaturized and portable point-of-care testing devices
- 5.2.1.3 Integration of PCR technology with automation and data analysis tools
- 5.2.1.4 High demand for technologically advanced molecular diagnostics
- 5.2.2 RESTRAINTS
- 5.2.2.1 Premium product pricing
- 5.2.2.2 Dearth of skilled healthcare professionals
- 5.2.3 OPPORTUNITIES
- 5.2.3.1 Increased investments in laboratory infrastructure
- 5.2.3.2 Rising number of applications in rare sequence detection
- 5.2.4 CHALLENGES
- 5.2.4.1 Technical limitations
- 5.2.4.2 Increased pricing pressure on market players
- 5.2.1 DRIVERS
- 5.3 VALUE CHAIN ANALYSIS
- 5.3.1 RESEARCH & DEVELOPMENT
- 5.3.2 RAW MATERIAL PROCUREMENT AND MANUFACTURING
- 5.3.3 DISTRIBUTION, MARKETING & SALES, AND POST-SALES SERVICES
- 5.4 PORTER'S FIVE FORCES ANALYSIS
- 5.4.1 THREAT OF NEW ENTRANTS
- 5.4.2 THREAT OF SUBSTITUTES
- 5.4.3 BARGAINING POWER OF SUPPLIERS
- 5.4.4 BARGAINING POWER OF BUYERS
- 5.4.5 INTENSITY OF COMPETITIVE RIVALRY
- 5.5 KEY STAKEHOLDERS AND BUYING CRITERIA
- 5.5.1 KEY STAKEHOLDERS IN BUYING PROCESS
- 5.5.2 KEY BUYING CRITERIA
- 5.6 PATENT ANALYSIS
- 5.6.1 LIST OF MAJOR PATENTS
- 5.7 KEY CONFERENCES AND EVENTS, 2024-2025
- 5.8 TRADE DATA ANALYSIS
- 5.8.1 IMPORT DATA FOR HS CODE 3822
- 5.8.2 EXPORT DATA FOR HS CODE 3822
- 5.9 PRICING ANALYSIS
- 5.9.1 AVERAGE SELLING PRICE OF REAL-TIME PCR INSTRUMENTS, BY KEY PLAYER, 2024
- 5.9.2 INDICATIVE PRICING OF REAL-TIME PCR INSTRUMENTS, BY KEY PLAYER, 2024
- 5.9.3 INDICATIVE PRICING OF PCR TECHNOLOGY-BASED PRODUCTS, BY REGION, 2022-2024
- 5.9.4 AVERAGE SELLING PRICE OF PCR TECHNOLOGY-BASED PRODUCTS, BY REGION, 2022-2024
- 5.10 UNMET NEEDS AND KEY PAIN POINTS
- 5.11 ECOSYSTEM ANALYSIS
- 5.12 SUPPLY CHAIN ANALYSIS
- 5.12.1 MANUFACTURING COMPANIES
- 5.12.2 SALES & DISTRIBUTION AGENTS
- 5.12.3 END USERS
- 5.13 TRENDS/DISRUPTIONS IMPACTING CUSTOMER BUSINESS
- 5.14 TECHNOLOGY ANALYSIS
- 5.14.1 KEY TECHNOLOGIES
- 5.14.1.1 Thermal cyclers
- 5.14.1.2 Real-time quantitative PCR
- 5.14.1.3 Portable and point-of-care PCR
- 5.14.2 COMPLEMENTARY TECHNOLOGIES
- 5.14.2.1 Next-generation sequencing
- 5.14.2.2 Microarrays
- 5.14.2.3 Lab-on-a-chip devices
- 5.14.2.4 Robotics and automation
- 5.14.3 ADJACENT TECHNOLOGIES
- 5.14.3.1 Mass spectrometry
- 5.14.3.2 Single-cell sequencing
- 5.14.3.3 Fluorescence in situ hybridization
- 5.14.1 KEY TECHNOLOGIES
- 5.15 REGULATORY LANDSCAPE
- 5.15.1 REGULATORY ANALYSIS
- 5.15.1.1 North America
- 5.15.1.1.1 US
- 5.15.1.1.2 Canada
- 5.15.1.2 Europe
- 5.15.1.3 Asia Pacific
- 5.15.1.3.1 Japan
- 5.15.1.3.2 China
- 5.15.1.3.3 India
- 5.15.1.1 North America
- 5.15.2 REGULATORY BODIES, GOVERNMENT AGENCIES, AND OTHER ORGANIZATIONS
- 5.15.1 REGULATORY ANALYSIS
- 5.16 INVESTMENT AND FUNDING SCENARIO
- 5.17 REIMBURSEMENT SCENARIO ANALYSIS
- 5.18 IMPACT OF AI/GEN AI ON PCR TECHNOLOGIES MARKET
6 PCR TECHNOLOGIES MARKET, BY PRODUCT
- 6.1 INTRODUCTION
- 6.2 REAGENTS AND CONSUMABLES
- 6.2.1 INCREASING USE OF DPCR-BASED ANALYTICAL PROCEDURES IN GENETIC RESEARCH AND FORENSICS TO DRIVE MARKET
- 6.3 INSTRUMENTS
- 6.3.1 RISING AVAILABILITY OF TECHNOLOGICALLY ADVANCED AND INNOVATIVE PCR INSTRUMENTS TO FUEL MARKET GROWTH
- 6.4 SOFTWARE AND SERVICES
- 6.4.1 GROWING DEMAND FOR SPECIALIZED PCR ANALYSIS SOFTWARE FOR ONCOLOGY STUDIES AND FORENSICS TO SPUR MARKET GROWTH
7 PCR TECHNOLOGIES MARKET, BY TECHNIQUE
- 7.1 INTRODUCTION
- 7.2 REAL-TIME PCR
- 7.2.1 RISING ADOPTION OF REAL-TIME PCR AMONG RESEARCHERS AND HEALTHCARE PROFESSIONALS TO PROPEL MARKET GROWTH
- 7.3 CONVENTIONAL PCR
- 7.3.1 COST-EFFECTIVENESS AND EASE OF USAGE IN ROUTINE CLONING, GENOTYPING, AND MUTATION ANALYSIS TO FUEL MARKET GROWTH
- 7.4 DIGITAL PCR
- 7.4.1 FASTER RESULTS WITH LOWER MARGIN ERRORS TO DRIVE ADOPTION
- 7.5 REVERSE TRANSCRIPTION PCR
- 7.5.1 HIGHER SENSITIVITY FOR MEASURING CHANGES IN GENE EXPRESSION TO AUGMENT MARKET GROWTH
- 7.6 HOT-START PCR
- 7.6.1 BETTER REACTION SPECIFICITY WITH LOWER ERROR RATES TO FAVOR MARKET GROWTH
- 7.7 MULTIPLEX PCR
- 7.7.1 COST-EFFECTIVENESS AND HIGH THROUGHPUT TO AID MARKET GROWTH
- 7.8 OTHER PCR TECHNIQUES
8 PCR TECHNOLOGIES MARKET, BY APPLICATION
- 8.1 INTRODUCTION
- 8.2 DIAGNOSTIC APPLICATIONS
- 8.2.1 UNAVAILABILITY OF REIMBURSEMENTS FOR CLINICAL DIAGNOSTIC TESTS TO LIMIT MARKET GROWTH
- 8.3 GENOTYPING
- 8.3.1 LARGE TARGET PATIENT POPULATION FOR CANCER DIAGNOSIS TO AUGMENT MARKET GROWTH
- 8.4 NUCLEIC ACID DETECTION
- 8.4.1 RISING PREVALENCE OF INFECTIOUS DISEASES TO BOOST MARKET GROWTH
- 8.5 GENE EXPRESSION ANALYSIS
- 8.5.1 INCREASED R&D FUNDING AND GRANTS FOR PCR TO FAVOR MARKET GROWTH
- 8.6 NUCLEIC ACID SYNTHESIS
- 8.6.1 INCREASED FOCUS ON PERSONALIZED AND PRECISE MEDICINES TO SUPPORT MARKET GROWTH
- 8.7 GENETIC SEQUENCING
- 8.7.1 TECHNOLOGICAL IMPROVEMENTS AND REDUCED COSTS OF SEQUENCING TO FUEL MARKET GROWTH
- 8.8 ENVIRONMENTAL APPLICATIONS
- 8.8.1 STRICT GOVERNMENT ENVIRONMENTAL POLICIES TO PROMOTE USE OF PCR
- 8.9 STANDARD VALIDATION/VERIFICATION
- 8.9.1 NEED FOR REGIONAL/GLOBAL VALIDATION FOR COMMERCIAL/NON-COMMERCIAL GUIDELINE FRAMING TO DRIVE MARKET
- 8.10 OTHER APPLICATIONS
9 PCR TECHNOLOGIES MARKET, BY END USER
- 9.1 INTRODUCTION
- 9.2 HOSPITAL LABORATORIES
- 9.2.1 RISING PUBLIC AWARENESS OF ROUTINE CHECKUPS TO SUPPORT MARKET GROWTH
- 9.3 DIAGNOSTIC LABORATORIES
- 9.3.1 ESTABLISHMENT OF INDEPENDENT SPECIALIZED DIAGNOSTIC LABORATORIES TO PROPEL MARKET GROWTH
- 9.4 ACADEMIC AND GOVERNMENT ORGANIZATIONS
- 9.4.1 INCREASED GOVERNMENT SUPPORT FOR GENOME-BASED RESEARCH TO DRIVE MARKET
- 9.5 PHARMA-BIOTECH COMPANIES
- 9.5.1 INCREASING R&D INITIATIVES BY PHARMA-BIOTECH COMPANIES TO DRIVE ADOPTION OF PCR TECHNOLOGIES
- 9.6 OTHER END USERS
10 PCR TECHNOLOGIES MARKET, BY REGION
- 10.1 INTRODUCTION
- 10.2 NORTH AMERICA
- 10.2.1 MACROECONOMIC OUTLOOK FOR NORTH AMERICA
- 10.2.2 US
- 10.2.2.1 US to dominate North American PCR technologies market during study period
- 10.2.3 CANADA
- 10.2.3.1 Supportive government initiatives for genomics research to aid market growth
- 10.3 EUROPE
- 10.3.1 MACROECONOMIC OUTLOOK FOR EUROPE
- 10.3.2 GERMANY
- 10.3.2.1 Presence of well-established pharmaceutical and R&D industry to augment market growth
- 10.3.3 FRANCE
- 10.3.3.1 Increasing investments in life science R&D for infrastructural development to favor market growth
- 10.3.4 UK
- 10.3.4.1 Rising acceptance of genome-based diagnosis by clinicians and healthcare professionals to spur market growth
- 10.3.5 ITALY
- 10.3.5.1 Supportive government policies and high healthcare expenditure to boost market growth
- 10.3.6 SPAIN
- 10.3.6.1 Increasing funding for life science research and pharmaceutical drug development to boost market growth
- 10.3.7 REST OF EUROPE
- 10.4 ASIA PACIFIC
- 10.4.1 MACROECONOMIC OUTLOOK FOR ASIA PACIFIC
- 10.4.2 CHINA
- 10.4.2.1 Improved public access to modern healthcare facilities and advanced genomics research to fuel market growth
- 10.4.3 JAPAN
- 10.4.3.1 Well-established healthcare infrastructure and advanced cancer research activities to support market growth
- 10.4.4 INDIA
- 10.4.4.1 Presence of large target patient population and high government healthcare expenditure to support market growth
- 10.4.5 AUSTRALIA
- 10.4.5.1 High healthcare expenditure to drive adoption of advanced PCR technologies
- 10.4.6 SOUTH KOREA
- 10.4.6.1 Improved medical tourism and prevalence of chronic diseases to propel market growth
- 10.4.7 REST OF ASIA PACIFIC
- 10.5 LATIN AMERICA
- 10.5.1 MACROECONOMIC OUTLOOK FOR LATIN AMERICA
- 10.5.2 BRAZIL
- 10.5.2.1 Growing focus on proteomics and genomics research to drive market
- 10.5.3 MEXICO
- 10.5.3.1 Favorable trade agreements to support imports and improve accessibility to PCR instruments
- 10.5.4 REST OF LATIN AMERICA
- 10.6 MIDDLE EAST & AFRICA
- 10.6.1 MACROECONOMIC OUTLOOK FOR MIDDLE EAST & AFRICA
- 10.6.2 GCC COUNTRIES
- 10.6.2.1 Advancements in healthcare infrastructure and increased focus on personalized medicines to fuel market growth
- 10.6.3 REST OF MIDDLE EAST & AFRICA
11 COMPETITIVE LANDSCAPE
- 11.1 INTRODUCTION
- 11.2 KEY PLAYER STRATEGY/RIGHT TO WIN
- 11.2.1 OVERVIEW OF STRATEGIES ADOPTED BY KEY PLAYERS IN PCR TECHNOLOGIES MARKET
- 11.3 REVENUE ANALYSIS, 2019-2023
- 11.4 MARKET SHARE ANALYSIS, 2023
- 11.4.1 GLOBAL PCR INSTRUMENTS MARKET SHARE, BY KEY PLAYER, 2023
- 11.4.2 GLOBAL PCR REAGENTS AND CONSUMABLES MARKET SHARE, BY KEY PLAYER, 2023
- 11.4.3 GLOBAL PCR SOFTWARE AND SERVICES MARKET SHARE, BY KEY PLAYER, 2023
- 11.5 COMPANY EVALUATION MATRIX: KEY PLAYERS, 2023
- 11.5.1 STARS
- 11.5.2 EMERGING LEADERS
- 11.5.3 PERVASIVE PLAYERS
- 11.5.4 PARTICIPANTS
- 11.5.5 COMPANY FOOTPRINT: KEY PLAYERS, 2023
- 11.5.5.1 Company footprint
- 11.5.5.2 Product footprint
- 11.5.5.3 Application footprint
- 11.5.5.4 Technique footprint
- 11.5.5.5 End user footprint
- 11.5.5.6 Region footprint
- 11.6 COMPANY EVALUATION MATRIX: STARTUPS/SMES, 2023
- 11.6.1 PROGRESSIVE COMPANIES
- 11.6.2 RESPONSIVE COMPANIES
- 11.6.3 DYNAMIC COMPANIES
- 11.6.4 STARTING BLOCKS
- 11.6.5 COMPANY BENCHMARKING: STARTUPS/SMES, 2023
- 11.6.5.1 DETAILED LIST OF KEY startups/SMEs players
- 11.6.5.2 Competitive benchmarking of key startups/SMEs
- 11.7 COMPANY VALUATION AND FINANCIAL METRICS, 2025
- 11.8 PRODUCT/BRAND COMPARISON
- 11.9 COMPETITIVE SCENARIO
- 11.9.1 PRODUCT LAUNCHES AND APPROVALS
- 11.9.2 DEALS
12 COMPANY PROFILES
- 12.1 KEY PLAYERS
- 12.1.1 THERMO FISHER SCIENTIFIC INC.
- 12.1.1.1 Business overview
- 12.1.1.2 Products/Services/Solutions offered
- 12.1.1.3 Recent developments
- 12.1.1.3.1 Product launches and approvals
- 12.1.1.3.2 Deals
- 12.1.1.4 MnM view
- 12.1.1.4.1 Key strengths
- 12.1.1.4.2 Strategic choices
- 12.1.1.4.3 Weaknesses and competitive threats
- 12.1.2 F. HOFFMANN-LA ROCHE LTD.
- 12.1.2.1 Business overview
- 12.1.2.2 Products/Services/Solutions offered
- 12.1.2.3 Recent developments
- 12.1.2.3.1 Product launches and approvals
- 12.1.2.3.2 Deals
- 12.1.2.4 MnM view
- 12.1.2.4.1 Key strengths
- 12.1.2.4.2 Strategic choices
- 12.1.2.4.3 Weaknesses and competitive threats
- 12.1.3 AGILENT TECHNOLOGIES, INC.
- 12.1.3.1 Business overview
- 12.1.3.2 Products/Services/Solutions offered
- 12.1.3.3 Recent developments
- 12.1.3.3.1 Product launches
- 12.1.3.3.2 Other developments
- 12.1.3.4 MnM view
- 12.1.3.4.1 Key strengths
- 12.1.3.4.2 Strategic choices
- 12.1.3.4.3 Weaknesses and competitive threats
- 12.1.4 BIO-RAD LABORATORIES, INC.
- 12.1.4.1 Business overview
- 12.1.4.2 Products/Services/Solutions offered
- 12.1.4.3 Recent developments
- 12.1.4.3.1 Product launches
- 12.1.4.3.2 Deals
- 12.1.4.4 MnM view
- 12.1.4.4.1 Key strengths
- 12.1.4.4.2 Strategic choices
- 12.1.4.4.3 Weaknesses and competitive threats
- 12.1.5 QIAGEN
- 12.1.5.1 Business overview
- 12.1.5.2 Products/Services/Solutions offered
- 12.1.5.3 Recent developments
- 12.1.5.3.1 Product launches and approvals
- 12.1.5.3.2 Deals
- 12.1.5.4 MnM view
- 12.1.5.4.1 Key strengths
- 12.1.5.4.2 Strategic choices
- 12.1.5.4.3 Weaknesses and competitive threats
- 12.1.6 DANAHER CORPORATION
- 12.1.6.1 Business overview
- 12.1.6.2 Products/Services/Solutions offered
- 12.1.6.3 Recent developments
- 12.1.6.3.1 Product approvals
- 12.1.6.3.2 Deals
- 12.1.6.3.3 Expansions
- 12.1.7 ABBOTT
- 12.1.7.1 Business overview
- 12.1.7.2 Products/Services/Solutions offered
- 12.1.7.3 Recent developments
- 12.1.7.3.1 Product approvals
- 12.1.8 TAKARA BIO INC.
- 12.1.8.1 Business overview
- 12.1.8.2 Products/Services/Solutions offered
- 12.1.8.3 Recent developments
- 12.1.8.3.1 Product launches
- 12.1.8.3.2 Deals
- 12.1.9 ANALYTIK JENA GMBH+CO. KG
- 12.1.9.1 Business overview
- 12.1.9.2 Products/Services/Solutions offered
- 12.1.9.3 Recent developments
- 12.1.9.3.1 Product launches
- 12.1.9.3.2 Deals
- 12.1.10 EPPENDORF SE
- 12.1.10.1 Business overview
- 12.1.10.2 Products/Services/Solutions offered
- 12.1.10.3 Recent developments
- 12.1.10.3.1 Product launches and approvals
- 12.1.11 MERCK KGAA
- 12.1.11.1 Business overview
- 12.1.11.2 Products/Services/Solutions offered
- 12.1.12 BIONEER CORPORATION
- 12.1.12.1 Business overview
- 12.1.12.2 Products/Services/Solutions offered
- 12.1.12.3 Recent developments
- 12.1.12.3.1 Other developments
- 12.1.13 REVVITY
- 12.1.13.1 Business overview
- 12.1.13.2 Products/Services/Solutions offered
- 12.1.13.3 Recent developments
- 12.1.13.3.1 Product launches
- 12.1.13.3.2 Other developments
- 12.1.14 BECTON, DICKINSON AND COMPANY
- 12.1.14.1 Business overview
- 12.1.14.2 Products/Services/Solutions offered
- 12.1.14.3 Recent developments
- 12.1.14.3.1 Product launches and approvals
- 12.1.14.3.2 Deals
- 12.1.15 BIOMERIEUX
- 12.1.15.1 Business overview
- 12.1.15.2 Products/Services/Solutions offered
- 12.1.15.3 Recent developments
- 12.1.15.3.1 Product launches and approvals
- 12.1.16 STANDARD BIOTOOLS
- 12.1.16.1 Business overview
- 12.1.16.2 Products/Services/Solutions offered
- 12.1.17 HOLOGIC, INC.
- 12.1.17.1 Business overview
- 12.1.17.2 Products/Services/Solutions offered
- 12.1.17.3 Recent developments
- 12.1.17.3.1 Product launches
- 12.1.18 LONZA
- 12.1.18.1 Business overview
- 12.1.18.2 Products/Services/Solutions offered
- 12.1.19 ILLUMINA, INC.
- 12.1.19.1 Business overview
- 12.1.19.2 Products/Services/Solutions offered
- 12.1.20 SANSURE BIOTECH INC.
- 12.1.20.1 Business overview
- 12.1.20.2 Products/Services/Solutions offered
- 12.1.1 THERMO FISHER SCIENTIFIC INC.
- 12.2 OTHER PLAYERS
- 12.2.1 PROMEGA CORPORATION
- 12.2.2 LIMING BIO
- 12.2.3 TRANSGEN BIOTECH CO., LTD.
- 12.2.4 DAAN GENE CO., LTD.
- 12.2.5 BIOBASE GROUP
- 12.2.6 NIPPON GENETICS EUROPE
- 12.2.7 STILLA
- 12.2.8 GENSCRIPT
- 12.2.9 NEW ENGLAND BIOLABS
13 APPENDIX
- 13.1 DISCUSSION GUIDE
- 13.2 KNOWLEDGESTORE: MARKETSANDMARKETS' SUBSCRIPTION PORTAL
- 13.3 CUSTOMIZATION OPTIONS
- 13.4 RELATED REPORTS
- 13.5 AUTHOR DETAILS

