|
|
市場調査レポート
商品コード
1388514
ペプチド治療薬の世界市場、薬剤投与量、価格、臨床試験インサイト 2029年Global Peptide Therapeutics Market, Drug Dosage, Price & Clinical Trials Insight 2029 |
||||||
|
|
|||||||
|
|||||||

| ペプチド治療薬の世界市場、薬剤投与量、価格、臨床試験インサイト 2029年 |
|
出版日: 2023年11月01日
発行: KuicK Research
ページ情報: 英文 1800 Pages
納期: 即日から翌営業日
|

全表示
- 概要
- 図表
- 目次
世界のペプチド治療薬の市場規模は、2029年までに600億米ドルに達する見通しです。
ダイナミックな製薬業界において、ペプチド医薬品はイノベーションと治療の可能性を示す指標として際立っています。これらの例外的な治療薬は、その応用範囲の広さと明確な利点により、多くの関心を集めています。ペプチド医薬品は、代謝異常の治療から、がんのような複雑な疾患への取り組みに至るまで、治療に正確で個別化されたアプローチを提供します。その結果、製薬業界にとって、ペプチドの潜在能力を最大限に活用するために、市場におけるペプチドの重要性の高まりを理解することが重要になってきており、また、絶えず進化する医療環境においてペプチドが持つ革命的な影響力を理解することも重要になってきています。
かつては低分子や大型タンパク質ベースの治療薬の影に隠れていたペプチドは、近年、医薬品分野の新たな成長フロンティアとして台頭してきました。ペプチドは治療、診断、治療効果を示し、精密医療の新時代を切り開きました。これらの適応性のある分子は、標的を絞った治療的介入を提供することにより、幅広い病状を治療する上で重要な役割を果たしています。ペプチドは、その治療能力を超えて、特定のバイオマーカーや疾患の検出におけるビーコンの役割を果たし、診断の展望を照らしています。治療能力と診断能力の融合は、ペプチドがヒーラーであると同時にガイドとして機能し、個別化された効果的なヘルスケアソリューションへの道をナビゲートする、セラノスティックスという進化的な概念を生み出します。
ペプチド医薬品開発の絶え間ない進化は、研究と技術の進歩によって後押しされています。コンビナトリアルケミストリーとハイスループットスクリーニングは、医薬品として有望な新しいペプチド配列の発見に役立っています。さらに、ペプチド合成プロセスの進歩は、製造効率を高め、スケーラビリティと費用対効果に関する過去の問題に対処しています。ペプチド設計における計算ツールと構造生物学の統合は、リード化合物の同定を早め、医薬品開発に要する時間を短縮しました。
ペプチド医薬品開発に人工知能を取り入れることで、効率性と革新性の新時代が到来しました。機械学習アルゴリズムは膨大なデータセットを分析し、結合親和性の高いペプチド構造を予測し、医薬品候補の成功率を高める。さらに、AIは潜在的な有害事象の特定や薬物動態特性の最適化にも役立ち、ペプチド治療薬の全体的な品質向上に貢献しています。ProteinQureのような製薬会社は、計算ツールを使用してペプチド治療薬の広範なポートフォリオを開発しており、Space Peptidesのような他の会社は、高品質のペプチド医薬品を設計・製造するための機械学習とAIツールへのアクセスを許可する契約サービスを提供しています。
ペプチド医薬品に対する大手製薬会社の関心が高まっていることは、ペプチド治療薬の世界のパイプラインが急速に拡大していることからも明らかです。さらに、製薬業界ではここ数カ月で共同研究や戦略的提携が急増しており、その中にはイーライリリーやアストラゼネカなど著名な製薬会社が関与しているものもあります。医療上のアンメットニーズを解決するペプチドの可能性を認識している大手企業は、合弁事業、ライセンス契約、買収を通じてペプチド・ポートフォリオを積極的に拡大しようとしており、これによりリソースのプールや統合された知識の活用が可能になり、ペプチド医薬品の開発と商業化が加速されます。
ペプチド医薬品は、世界の医薬品市場の将来展望において重要な役割を果たすと期待されています。分子レベルでの疾病原因の解明が進むと同時に、ペプチドの精密なターゲティング能力が発揮され、個別化医療の礎石となります。ペプチド工学の絶え間ない進歩は、AIの導入と相まって、非常に有効で忍容性の高い治療法の開発につながることはほぼ間違いないと思われます。製薬業界が患者中心のパラダイムに移行する中、ペプチド医薬品の適応性と特異性は、移り変わる医療情勢に対応するフロントランナーとして位置づけられます。ペプチドの治療領域に対する適応性と安全性の高さは、患者の多様な医療ニーズに応えようとする製薬企業にとって魅力的な選択肢です。
結論として、ペプチド医薬品の領域を旅してみると、広範なイノベーションと可能性が見えてくる。医薬の新時代に近づくにつれ、ペプチドは単なる治療薬や診断薬にとどまらず、ヘルスケアのパラダイムシフトの先駆けとして登場します。ペプチドは今後、個別化医療、標的治療薬、そして拡大し続けるプレシジョン・ヘルスケアのパノラマにおいて重要な役割を果たすと思われます。AIのような最先端技術とペプチド固有の多様性が組み合わさることで、類まれな発展への扉が開かれます。拡大するペプチド医薬の物語は、これらの分子が医学的可能性の限界を押し広げ続け、革新的な治療法と楽観的な展望をもたらす未来の魅惑的なビジョンを描いています。
当レポートでは、世界のペプチド治療薬市場について分析し、世界全体および各地域の市場規模の動向予測 (年間/四半期間ベース) や、各種ペプチドの治験の進行状況 (国別・適応症別・相別)、上市済みの主要ペプチド製品の概略 (特許、入手可能性、コスト、用量、売上高など)、主な開発プラットフォーム、主要企業のプロファイルなどを調査しております。
目次
第1章 ペプチド医薬品の概要
- 歴史、発展、進化
- 承認されたペプチド医薬品
第2章 ペプチド医薬品:治療・診断・セラノスティクスの可能性と市場への影響
- 治療の可能性と市場への影響
- 診断の可能性と市場への影響
- セラノスティックの可能性と市場への影響
第3章 世界のペプチド医薬品の治験・市場動向:適応症別
- 遺伝性疾患
- がん
- 微生物感染症
- 自己免疫疾患
- 代謝障害
- 神経変性疾患
第4章 ペプチドベースの治療アプローチ
- ペプチドホルモン剤
- ペプチド薬物複合体
- ペプチドワクチン
- ペプチド作動薬
- ペプチドアプタマー
- ペプチド抗体
第5章 世界のペプチド治療薬市場の見通し
- 現在の市場動向と促進要因
- 将来の成長経路
第6章 ペプチド治療薬市場の情勢:地域別
- 米国
- 欧州連合
- 中国
- 日本
- 韓国
- 英国
- インド
- 中東
- カナダ
- オーストラリア
第7章 世界のペプチド治療薬の治験の概況
- 国別
- 適応症
- フェーズ (相)
- 優先状況
- 治療法クラス
第8章 上市済みペプチド医薬品に関する考察:特許・入手可能性・コスト・投与量・売上高に関する洞察
- Bylvay
- 概要
- 価格動向・投与量の分析
- 売上高の分析
- Parsabiv
- Bydureon BCise
- Linzess
- Increlex
- Terlivaz
- Empaveli
- Voxzogo
- Imcivree
- Trulicity
- Ozempic
- Wegovy
- Tresiba
- Rybelsus
- Xultophy
- Victoza
- Ryzodeg
- Fiasp
- Lantus
- Toujeo
第9章 ペプチド治療薬の開発技術・プラットフォーム
- Biodrug Design Accelerator - Fujitsu/PeptiDream
- T-Win (R) Technology - IO Biotech
- Numatech - Numaferm
- ProteinStudio - ProteinQure
- The Magnifier NφΦ (TM) - Nuritas
- PepPower - GenScript
- Unnamed Peptide Platform - Zealand Pharma
- PDPS (Peptide Discovery Platform System) - PeptiDream
- Veneno Suite - Veneno Technologies
- SmartDepot (TM) Technology - Peptron
- Bicycles - Bicycle Therapeutics
- RALA Technolgy - pHion Therapeutics
- Discovery Platform - Orbit Discovery
- Imotopes - Imcyse
- Nautilus - Peptilogics
- Swarm Intelligence 2.0 - Pepticom
- streaMLine Platform - Gubra
- Precision Endocrine Peptides (PEPs) - MBX Biosciences
- pHLIP (pH-Low Insertion Peptides) - pHLIP
- alphalex - Cybrexa
第10章 環状ペプチドの治験の分析:国別・適応症別・相別
- 調査
- 前臨床
- 第I相
- 第I/II相
- 第Ⅱ相
- 第II/III相
- 第III相
- 登録前
- 登録済み
- 上市済み
第11章 ペプチドホルモンの治験の分析:国別・適応症別・相別
第12章 ペプチドの治験の分析:国別・適応症別・相別
第13章 グルカゴン様ペプチドの治験の分析:国別・適応症別・相別
第14章 オリゴペプチドの治験の分析:国別・適応症別・相別
第15章 リポペプチドの治験の分析:国別・適応症別・相別
第16章 ジペプチドの治験の分析:国別・適応症別・相別
第17章 デプシペプチドの治験の分析:国別・適応症別・相別
第18章 糖ペプチドの治験の分析:国別・適応症別・相別
第19章 ペプチドワクチンの治験の分析:国別・適応症別・相別
第20章 ペプチドフラグメントの治験の分析:国別・適応症別・相別
第21章 オピオイドペプチドの治験の分析:国別・適応症別・相別
第22章 ナトリウム利尿ペプチドの治験の分析:国別・適応症別・相別
第23章 神経ペプチドの治験の分析:国別・適応症別・相別
第24章 抗菌性カチオン性ペプチドの治験の分析:国別・適応症別・相別
第25章 ペプチド加水分解酵素の治験の分析:国別・適応症別・相別
第26章 ペプチドアプタマー
第27章 細胞間シグナル伝達ペプチドの治験の分析:国別・適応症別・相別
第28章 ペプチド抗生物質の治験の分析:国別・適応症別・相別
第29章 ペプチド薬物複合体の治験の分析:国別・適応症別・相別
第30章 二環式ペプチドの治験の分析:国別・適応症別・相別
第31章 複数ペプチドの治験の分析:国別・適応症別・相別
第32章 競合情勢
- AbbVie
- Adocia
- Amgen
- Antlia Bioscience
- AsclepiX Therapeutics
- AstraZeneca
- Bicycle Therapeutics
- Biohaven Labs
- Bristol-Myers Squibb
- Carmot Therapeutics
- Eli Lilly and Company
- Ferring Pharmaceuticals
- Gan&Lee Pharmaceuticals
- GEROPHARM
- Hanmi Pharmaceutical
- HEC Pharm
- Heidelberg Pharma AG
- ImCyse
- Janux Therapeutics
- Kine Sciences
- Lactocore
- Maxwell Biosciences
- Merck & Co
- Novartis
- Novo Nordisk
- Oryn Therapeutics
- Palatin Technologies
- PeptiDream
- Pfizer
- Priavoid
- Primary Peptides
- Protagonist Therapeutics
- Roche
- Sanofi
- Sapience Therapeutics
- Seagen
- Shaanxi Micot Technology Co
- Stuart Therapeutics
- Takeda
- Zealand Pharma
List of Figures
- Figure 1-1: Landmarks in Peptides Drugs Market
- Figure 3-1: Pro00013585 Phase II Study - Initiation & Completion Years
- Figure 3-2: STUDY0000567 Phase II Study - Initiation & Completion Years
- Figure 3-3: NCT05378672 Phase III Study - Initiation & Completion Years
- Figure 3-4: ZP4207-21052 Phase III Study - Initiation & Completion Years
- Figure 3-5: GLSI-21-01 Phase III Study - Initiation & Completion Years
- Figure 3-6: IO102-IO103-013 Phase III Study - Initiation & Completion Years
- Figure 3-7: NCT06091748 Phase II Study - Initiation & Completion Years
- Figure 3-8: PMC67199 Phase I Study - Initiation & Completion Years
- Figure 3-9: ACW-1221958-1 Phase II Study - Initiation & Completion Years
- Figure 3-10: NCT05841095 Phase I/II Study - Initiation & Completion Years
- Figure 3-11: NCT05340790 Phase I Study - Initiation & Completion Years
- Figure 3-12: IR902-007 Phase I Study - Initiation & Completion Years
- Figure 3-13: ISEMIS Phase I/II Study - Initiation & Completion Years
- Figure 3-14: YN011-301 Phase II/III Study - Initiation & Completion Years
- Figure 3-15: SCW0502-1031 Phase III Study - Initiation & Completion Years
- Figure 3-16: NCT05202353 Phase I Study - Initiation & Completion Years
- Figure 3-17: NCT04305002 Phase II Study - Initiation & Completion Years
- Figure 3-18: NCT05189210 Phase II Study - Initiation & Completion Years
- Figure 3-19: ALZ-C-001 Phase II Study - Initiation & Completion Years
- Figure 3-20: ELViS-FA Phase I/II Study - Initiation & Completion Years
- Figure 3-21: NCT05634876 Phase II Study - Initiation & Completion Years
- Figure 4-1: CUV104 Phase II Study - Initiation & Completion Years
- Figure 4-2: CUV152 Phase II Study - Initiation & Completion Years
- Figure 4-3: Peptide-Drug Conjugate Structure
- Figure 4-4: NCT04706962 Phase I Study - Initiation & Completion Years
- Figure 4-5: MLB-PK-001 Early Phase I Study - Initiation & Completion Year
- Figure 4-6: ANGLeD Phase III Study - Initiation & Completion Years
- Figure 4-7: CA209-8TX Phase I/II Study - Initiation & Completion Years
- Figure 4-8: CLAUDE/EOCRC1-22 Phase II Study - Initiation & Completion Years
- Figure 4-9: COVENANT Phase III Study - Initiation & Completion Years
- Figure 4-10: EGRABIS1 Phase II Study - Initiation & Completion Years
- Figure 4-11: GLIMP Phase II Study - Initiation & Completion Years
- Figure 4-12: NCT05530577 Phase II Study - Initiation & Completion Years
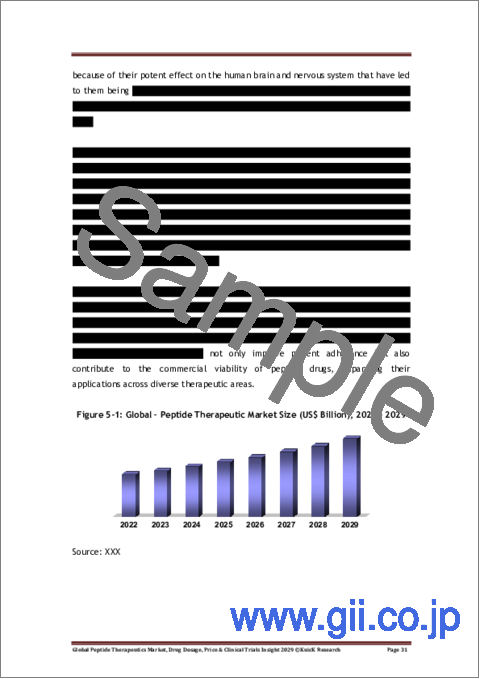
- Figure 5-1: Global - Peptide Therapeutic Market Size (US$ Billion), 2022 - 2029
- Figure 5-2: Global - Peptide Oncology Drugs Market Size (US$ Billion), 2022 - 2029
- Figure 5-3: Ongoing Trends in Peptide Drugs Market
- Figure 5-4: Future Growth Avenues in Peptide Drugs Market
- Figure 6-1: China - Estimated Diabetes Population (Million), 2021 & 2030
- Figure 6-2: India - Estimated Diabetes Population (Million), 2021 & 2030
- Figure 6-3: ME - Estimated Diabetes Population in Saudi Arabia & UAE (Million), 2021 & 2030
- Figure 6-4: Canada - Estimated Diabetes Population (Million), 2021 & 2030
- Figure 7-1: Global - Peptides Clinical Trials by Country (Numbers), 2023 Till 2029
- Figure 7-2: Global - Peptides Clinical Trials by Indication (Numbers), 2023 Till 2029
- Figure 7-3: Global - Peptide Clinical Trials by Phase (Numbers), 2023 till 2029
- Figure 7-4: Global - Cyclic Peptide Clinical Trials by Phase (Numbers), 2023 till 2029
- Figure 7-5: Global - Peptide Hormones Clinical Trials by Phase (Numbers), 2023 till 2029
- Figure 7-6: Global - Glucagon-Like Peptides Clinical Trials by Phase (Numbers), 2023 till 2029
- Figure 7-7: Global - Oligopeptides Clinical Trials by Phase (Numbers), 2023 till 2029
- Figure 7-8: Global - Lipopeptides Clinical Trials by Phase (Numbers), 2023 till 2029
- Figure 7-9: Global - Dipeptides Clinical Trials by Phase (Numbers), 2023 till 2029
- Figure 7-10: Global - Depsipeptides Clinical Trials by Phase (Numbers), 2023 till 2029
- Figure 7-11: Global - Glycopeptides Clinical Trials by Phase (Numbers), 2023 till 2029
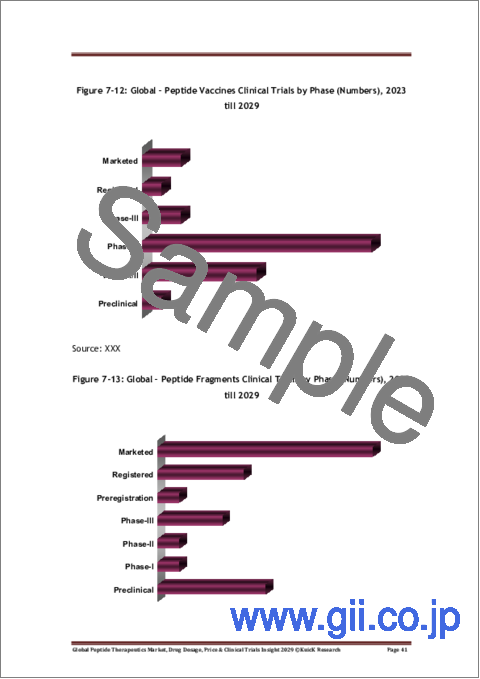
- Figure 7-12: Global - Peptide Vaccines Clinical Trials by Phase (Numbers), 2023 till 2029
- Figure 7-13: Global - Peptide Fragments Clinical Trials by Phase (Numbers), 2023 till 2029
- Figure 7-14: Global - Opioid Peptides Clinical Trials by Phase (Numbers), 2023 till 2029
- Figure 7-15: Global - Natriuretic Peptides Clinical Trials by Phase (Numbers), 2023 till 2029
- Figure 7-16: Global - Neuropeptides Clinical Trials by Phase (Numbers), 2023 till 2029
- Figure 7-17: Global - Antimicrobial Cationic Peptides Clinical Trials by Phase (Numbers), 2023 till 2029
- Figure 7-18: Global - Peptide Aptamers Clinical Trials by Phase (Numbers), 2023 till 2029
- Figure 7-19: Global - Peptides Clinical Trials by Priority Status (Numbers), 2023 Till 2029
- Figure 7-20: Global - Peptides Clinical Trials by Therapy Class (Numbers), 2023 Till 2029
- Figure 8-1: US - Cost per Unit & Supply of Bylvay Oral Capsules (US$), November'2023
- Figure 8-2: US - Cost per Unit & Supply of Bylvay Oral Pellets (US$), November'2023
- Figure 8-3: EU - Cost per Unit & Supply of Bylvay Oral Capsules & Pellets (Eur/US$), November'2023
- Figure 8-4: Global - Quarterly Bylvay Sales (US$ Million), 2023
- Figure 8-5: NA - Quarterly Bylvay Sales (US$ Million), 2023
- Figure 8-6: Europe - Quarterly Bylvay Sales (US$ Million), 2023
- Figure 8-7: ROW - Quarterly Bylvay Sales (US$ Million), 2023
- Figure 8-8: Parsabiv - US Patents Expiration Years
- Figure 8-9: Parsabiv - Europe Patents Expiration Years
- Figure 8-10: Parsabiv - Cost per Unit & Supply (US$), November'2023
- Figure 8-11: Global - Annual Parsabiv Sales (US$ Million), 2019-2023
- Figure 8-12: US - Annual Parsabiv Sales (US$ Million), 2019-2023
- Figure 8-13: ROW - Annual Parsabiv Sales (US$ Million), 2019-2023
- Figure 8-14: Global - Quarterly Parsabiv Sales (US$ Million), 2023
- Figure 8-15: US - Quarterly Parsabiv Sales (US$ Million), 2023
- Figure 8-16: ROW - Quarterly Parsabiv Sales (US$ Million), 2023
- Figure 8-17: Global - Quarterly Parsabiv Sales (US$ Million), 2022
- Figure 8-18: US - Quarterly Parsabiv Sales (US$ Million), 2022
- Figure 8-19: ROW - Quarterly Parsabiv Sales (US$ Million), 2022
- Figure 8-20: Bydureon - Year of Approval and Expiry of Patents for Injection
- Figure 8-21: Bydureon - Year of Approval and Expiry of Patents for Injection
- Figure 8-22: Bydureon BCise - Cost per Unit & Supply (US$), November'2023
- Figure 8-23: Global - Annual Bydureon Sales (US$ Million), 2019-2023
- Figure 8-24: US - Annual Bydureon Sales (US$ Million), 2019-2023
- Figure 8-25: Europe - Annual Bydureon Sales (US$ Million), 2019-2023
- Figure 8-26: EM - Annual Bydureon Sales (US$ Million), 2019-2023
- Figure 8-27: ROW - Annual Bydureon Sales (US$ Million), 2019-2023
- Figure 8-28: Global - Quarterly Bydureon Sales (US$ Million), 2023
- Figure 8-29: US - Quarterly Bydureon Sales (US$ Million), 2023
- Figure 8-30: Europe - Quarterly Bydureon Sales (US$ Million), 2023
- Figure 8-31: EM - Quarterly Bydureon Sales (US$ Million), 2023
- Figure 8-32: Global - Quarterly Bydureon Sales (US$ Million), 2022
- Figure 8-33: US - Quarterly Bydureon Sales (US$ Million), 2022
- Figure 8-34: Europe - Quarterly Bydureon Sales (US$ Million), 2022
- Figure 8-35: EM - Quarterly Bydureon Sales (US$ Million), 2022
- Figure 8-36: Linzess - Cost per Unit & Supply (US$), November'2023
- Figure 8-37: Linzess - Dosage by Indication (mcg)
- Figure 8-38: Global - Annual Linzess Sales (US$ Million), 2020-2023
- Figure 8-39: US - Annual Linzess Sales (US$ Million), 2020-2023
- Figure 8-40: ROW - Annual Linzess Sales (US$ Million), 2019-2023
- Figure 8-41: Global - Quarterly Linzess Sales (US$ Million), 2023
- Figure 8-42: US - Quarterly Linzess Sales (US$ Million), 2023
- Figure 8-43: ROW - Quarterly Linzess Sales (US$ Million), 2023
- Figure 8-44: Global - Quarterly Linzess Sales (US$ Million), 2022
- Figure 8-45: US - Quarterly Linzess Sales (US$ Million), 2022
- Figure 8-46: ROW - Quarterly Linzess Sales (US$ Million), 2022
- Figure 8-47: Increlex - US & EU Patent Expiry Years
- Figure 8-48: Increlex - Cost per Unit & Supply (US$), November'2023
- Figure 8-49: Global - Annual Increlex Sales (US$ Million), 2019-2023
- Figure 8-50: Global - Quarterly Increlex Sales (US$ Million), 2023
- Figure 8-51: Global - Quarterly Increlex Sales (US$ Million), 2022
- Figure 8-52 : Terlivaz - Dosing Chart
- Figure 8-53: Global - Quarterly Terlivaz Sales (US$ Million), 2023
- Figure 8-54: Empaveli - Cost per Unit & Supply (US$), November'2023
- Figure 8-55: Empaveli - Cost of Monthly & Yearly Treatment (US$), November'2023
- Figure 8-56: Global - Annual Empaveli Sales (US$ Million), 2021-2023
- Figure 8-57: US - Annual Empaveli Sales (US$ Million), 2021-2023
- Figure 8-58: ROW - Annual Empaveli Sales (US$ Million), 2021-2023
- Figure 8-59: Global - Quarterly Increlex Sales (US$ Million), 2023
- Figure 8-60: US - Quarterly Empaveli Sales (US$ Million), 2023
- Figure 8-61: ROW - Quarterly Empaveli Sales (US$ Million), 2023
- Figure 8-62: Global - Quarterly Increlex Sales (US$ Million), 2022
- Figure 8-63: US - Annual Empaveli Sales (US$ Million), 2022
- Figure 8-64: ROW - Annual Empaveli Sales (US$ Million), 2022
- Figure 8-65: Voxzogo - Cost per Unit & Supply (US$), November'2023
- Figure 8-66: Global - Annual Voxzogo Sales (US$ Million), 2021-2023
- Figure 8-67: Global - Quarterly Voxzogo Sales (US$ Million), 2023
- Figure 8-68: Global - Quarterly Voxzogo Sales (US$ Million), 2022
- Figure 8-69: Global - Annual Imcivree Sales (US$ Million), 2021-2023
- Figure 8-70: Global - Quarterly Imcivree Sales (US$ Million), 2023
- Figure 8-71: Global - Quarterly Imcivree Sales (US$ Million), 2022
- Figure 8-72: Voxzogo - Cost per Unit & Supply (US$), November'2023
- Figure 8-73: Global - Annual Trulicity Sales (US$ Million), 2019-2023
- Figure 8-74: Global - Quarterly Trulicity Sales (US$ Million), 2023
- Figure 8-75: Global - Quarterly Trulicity Sales (US$ Million), 2022
- Figure 8-76: Ozempic - Cost per Unit & Supply (US$), November'2023
- Figure 8-77: Ozempic - Initiation and Increment Doses (mg/week)
- Figure 8-78: Global - Annual Ozempic Sales (US$ Million), 2019-2023
- Figure 8-79: NA - Annual Ozempic Sales (US$ Million), 2019-2023
- Figure 8-80: EMEA - Annual Ozempic Sales (US$ Million), 2019-2023
- Figure 8-81: China - Annual Ozempic Sales (US$ Million), 2019-2023
- Figure 8-82: ROW - Annual Ozempic Sales (US$ Million), 2019-2023
- Figure 8-83: Global - Quarterly Ozempic Sales (US$ Million), 2023
- Figure 8-84: NA - Quarterly Ozempic Sales (US$ Million), 2023
- Figure 8-85: EMEA - Quarterly Ozempic Sales (US$ Million), 2023
- Figure 8-86: China - Quarterly Ozempic Sales (US$ Million), 2023
- Figure 8-87: ROW - Quarterly Ozempic Sales (US$ Million), 2023
- Figure 8-88: Global - Quarterly Ozempic Sales (US$ Million), 2022
- Figure 8-89: NA - Quarterly Ozempic Sales (US$ Million), 2022
- Figure 8-90: EMEA - Quarterly Ozempic Sales (US$ Million), 2022
- Figure 8-91: China - Quarterly Ozempic Sales (US$ Million), 2022
- Figure 8-92: ROW - Quarterly Ozempic Sales (US$ Million), 2022
- Figure 8-93: Wegovy - Cost per Unit & Supply of 0.25mg, 0.5mg and 1mg Solutions (US$), November'2023
- Figure 8-94: Wegovy - Cost per Unit & Supply of 1.7mg, and 2.4mg Solutions (US$), November'2023
- Figure 8-95: Global - Annual Wegovy Sales (US$ Million), 2021-2023
- Figure 8-96: NA - Annual Wegovy Sales (US$ Million), 2021-2023
- Figure 8-97: EMEA - Annual Wegovy Sales (US$ Million), 2021-2023
- Figure 8-98: Global - Quarterly Wegovy Sales (US$ Million), 2023
- Figure 8-99: NA - Quarterly Wegovy Sales (US$ Million), 2023
- Figure 8-100: EMEA - Quarterly Wegovy Sales (US$ Million), 2023
- Figure 8-101: Global - Quarterly Wegovy Sales (US$ Million), 2022
- Figure 8-102: NA - Quarterly Wegovy Sales (US$ Million), 2022
- Figure 8-103: EMEA - Quarterly Wegovy Sales (US$ Million), 2022
- Figure 8-104: Tresiba - Cost per Unit & Supply of 100 units/mL Solution (US$), November'2023
- Figure 8-105: Tresiba - Cost per Unit & Supply of 200 units/mL Solution (US$), November'2023
- Figure 8-106: Insulin degludec - Cost per Unit & Supply of 100 units/mL Solution (US$), November'2023
- Figure 8-107: Global - Annual Tresiba Sales (US$ Million), 2019-2023
- Figure 8-108: NA - Annual Tresiba Sales (US$ Million), 2019-2023
- Figure 8-109: EMEA - Annual Tresiba Sales (US$ Million), 2019-2023
- Figure 8-110: China - Annual Tresiba Sales (US$ Million), 2019-2023
- Figure 8-111: ROW - Annual Tresiba Sales (US$ Million), 2019-2023
- Figure 8-112: Global - Quarterly Tresiba Sales (US$ Million), 2023
- Figure 8-113: NA - Quarterly Tresiba Sales (US$ Million), 2023
- Figure 8-114: EMEA - Quarterly Tresiba Sales (US$ Million), 2023
- Figure 8-115: China - Quarterly Tresiba Sales (US$ Million), 2023
- Figure 8-116: ROW - Quarterly Tresiba Sales (US$ Million), 2023
- Figure 8-117: Global - Quarterly Tresiba Sales (US$ Million), 2022
- Figure 8-118: NA - Quarterly Tresiba Sales (US$ Million), 2022
- Figure 8-119: EMEA - Quarterly Tresiba Sales (US$ Million), 2022
- Figure 8-120: China - Quarterly Tresiba Sales (US$ Million), 2022
- Figure 8-121: ROW - Quarterly Tresiba Sales (US$ Million), 2022
- Figure 8-122: Rybelsus - Cost per Unit & Supply (US$), November'2023
- Figure 8-123: Global - Annual Rybelsus Sales (US$ Million), 2019-2023
- Figure 8-124: NA - Annual Rybelsus Sales (US$ Million), 2019-2023
- Figure 8-125: EMEA - Annual Rybelsus Sales (US$ Million), 2019-2023
- Figure 8-126: China - Annual Rybelsus Sales (US$ Million), 2019-2023
- Figure 8-127: ROW - Annual Rybelsus Sales (US$ Million), 2019-2023
- Figure 8-128: Global - Quarterly Rybelsus Sales (US$ Million), 2023
- Figure 8-129: NA - Quarterly Rybelsus Sales (US$ Million), 2023
- Figure 8-130: EMEA - Quarterly Rybelsus Sales (US$ Million), 2023
- Figure 8-131: China - Quarterly Rybelsus Sales (US$ Million), 2023
- Figure 8-132: ROW - Quarterly Rybelsus Sales (US$ Million), 2023
- Figure 8-133: Global - Quarterly Rybelsus Sales (US$ Million), 2022
- Figure 8-134: NA - Quarterly Rybelsus Sales (US$ Million), 2022
- Figure 8-135: EMEA - Quarterly Rybelsus Sales (US$ Million), 2022
- Figure 8-136: China - Quarterly Rybelsus Sales (US$ Million), 2022
- Figure 8-137: ROW - Quarterly Rybelsus Sales (US$ Million), 2022
- Figure 8-138: Xultophy - Cost per Unit & Supply (US$), November'2023
- Figure 8-139: Global - Annual Xultophy Sales (US$ Million), 2019-2023
- Figure 8-140: NA - Annual Xultophy Sales (US$ Million), 2019-2023
- Figure 8-141: EMEA - Annual Xultophy Sales (US$ Million), 2019-2023
- Figure 8-142: China - Annual Xultophy Sales (US$ Million), 2019-2023
- Figure 8-143: ROW - Annual Xultophy Sales (US$ Million), 2019-2023
- Figure 8-144: Global - Quarterly Xultophy Sales (US$ Million), 2023
- Figure 8-145: NA - Quarterly Xultophy Sales (US$ Million), 2023
- Figure 8-146: EMEA - Quarterly Xultophy Sales (US$ Million), 2023
- Figure 8-147: China - Quarterly Xultophy Sales (US$ Million), 2023
- Figure 8-148: ROW - Quarterly Xultophy Sales (US$ Million), 2023
- Figure 8-149: Global - Quarterly Xultophy Sales (US$ Million), 2022
- Figure 8-150: NA - Quarterly Xultophy Sales (US$ Million), 2022
- Figure 8-151: EMEA - Quarterly Xultophy Sales (US$ Million), 2022
- Figure 8-152: China - Quarterly Xultophy Sales (US$ Million), 2022
- Figure 8-153: ROW - Quarterly Xultophy Sales (US$ Million), 2022
- Figure 8-154: Victoza - Cost per Unit & Supply (US$), November'2023
- Figure 8-155: Global - Annual Victoza Sales (US$ Million), 2019-2023
- Figure 8-156: North America - Annual Victoza Sales (US$ Million), 2019-2023
- Figure 8-157: EMEA - Annual Victoza Sales (US$ Million), 2019-2023
- Figure 8-158: China - Annual Victoza Sales (US$ Million), 2019-2023
- Figure 8-159: ROW - Annual Victoza Sales (US$ Million), 2019-2023
- Figure 8-160: Global - Quarterly Victoza Sales (US$ Million), 2023
- Figure 8-161: North America - Quarterly Victoza Sales (US$ Million), 2023
- Figure 8-162: EMEA - Quarterly Victoza Sales (US$ Million), 2023
- Figure 8-163: China - Quarterly Victoza Sales (US$ Million), 2023
- Figure 8-164: ROW - Quarterly Victoza Sales (US$ Million), 2023
- Figure 8-165: Global - Quarterly Victoza Sales (US$ Million), 2022
- Figure 8-166: North America - Quarterly Victoza Sales (US$ Million), 2022
- Figure 8-167: EMEA - Quarterly Victoza Sales (US$ Million), 2022
- Figure 8-168: China - Quarterly Victoza Sales (US$ Million), 2022
- Figure 8-169: ROW - Quarterly Victoza Sales (US$ Million), 2022
- Figure 8-170: Global - Annual Victoza Sales (US$ Million), 2019-2023
- Figure 8-171: EMEA - Annual Victoza Sales (US$ Million), 2019-2023
- Figure 8-172: China - Annual Victoza Sales (US$ Million), 2019-2023
- Figure 8-173: ROW - Annual Victoza Sales (US$ Million), 2019-2023
- Figure 8-174: Global - Quarterly Victoza Sales (US$ Million), 2023
- Figure 8-175: EMEA - Quarterly Victoza Sales (US$ Million), 2023
- Figure 8-176: China - Quarterly Victoza Sales (US$ Million), 2023
- Figure 8-177: ROW - Quarterly Victoza Sales (US$ Million), 2023
- Figure 8-178: Global - Quarterly Victoza Sales (US$ Million), 2022
- Figure 8-179: EMEA - Quarterly Victoza Sales (US$ Million), 2022
- Figure 8-180: China - Quarterly Victoza Sales (US$ Million), 2022
- Figure 8-181: ROW - Quarterly Victoza Sales (US$ Million), 2022
- Figure 8-182: Fiasp - Cost per Unit & Supply (US$), November'2023
- Figure 8-183: Global - Annual Fiasp Sales (US$ Million), 2019-2023
- Figure 8-184: NA - Annual Fiasp Sales (US$ Million), 2019-2023
- Figure 8-185: EMEA - Annual Fiasp Sales (US$ Million), 2019-2023
- Figure 8-186: ROW - Annual Fiasp Sales (US$ Million), 2019-2023
- Figure 8-187: Global - Quarterly Fiasp Sales (US$ Million), 2023
- Figure 8-188: NA - Quarterly Fiasp Sales (US$ Million), 2023
- Figure 8-189: EMEA - Quarterly Fiasp Sales (US$ Million), 2023
- Figure 8-190: ROW - Quarterly Fiasp Sales (US$ Million), 2023
- Figure 8-191: Global - Quarterly Fiasp Sales (US$ Million), 2022
- Figure 8-192: NA - Quarterly Fiasp Sales (US$ Million), 2022
- Figure 8-193: EMEA - Quarterly Fiasp Sales (US$ Million), 2022
- Figure 8-194: ROW - Quarterly Fiasp Sales (US$ Million), 2022
- Figure 8-195: Lantus - Cost per Unit & Supply (US$), November'2023
- Figure 8-196: Insulin Glargine & Insulin Glargine-yfgn - Cost per Unit & Supply (US$), November'2023
- Figure 8-197: Global - Annual Lantus Sales (US$ Million), 2019-2023
- Figure 8-198: US - Annual Lantus Sales (US$ Million), 2019-2023
- Figure 8-199: Europe - Annual Lantus Sales (US$ Million), 2019-2023
- Figure 8-200: ROW - Annual Lantus Sales (US$ Million), 2019-2023
- Figure 8-201: Global - Quarterly Lantus Sales (US$ Million), 2023
- Figure 8-202: US - Quarterly Lantus Sales (US$ Million), 2023
- Figure 8-203: Europe - Quarterly Lantus Sales (US$ Million), 2023
- Figure 8-204: ROW - Quarterly Lantus Sales (US$ Million), 2023
- Figure 8-205: Global - Quarterly Lantus Sales (US$ Million), 2022
- Figure 8-206: US - Quarterly Lantus Sales (US$ Million), 2022
- Figure 8-207: Europe - Quarterly Lantus Sales (US$ Million), 2022
- Figure 8-208: ROW - Quarterly Lantus Sales (US$ Million), 2022
- Figure 8-209: Toujeo - US Patent Acceptance & Expiration Years
- Figure 8-210: Toujeo - Cost per Unit & Supply (US$), November'2023
- Figure 8-211: Global - Annual Toujeo Sales (US$ Million), 2019-2023
- Figure 8-212: US - Annual Toujeo Sales (US$ Million), 2019-2023
- Figure 8-213: Europe - Annual Toujeo Sales (US$ Million), 2019-2023
- Figure 8-214: ROW - Annual Toujeo Sales (US$ Million), 2019-2023
- Figure 8-215: Global - Quarterly Toujeo Sales (US$ Million), 2023
- Figure 8-216: US - Quarterly Toujeo Sales (US$ Million), 2023
- Figure 8-217: Europe - Quarterly Toujeo Sales (US$ Million), 2023
- Figure 8-218: ROW - Quarterly Toujeo Sales (US$ Million), 2023
- Figure 8-219: Global - Quarterly Toujeo Sales (US$ Million), 2022
- Figure 8-220: US - Quarterly Toujeo Sales (US$ Million), 2022
- Figure 8-221: Europe - Quarterly Toujeo Sales (US$ Million), 2022
- Figure 8-222: ROW - Quarterly Toujeo Sales (US$ Million), 2022
- Figure 9-1: Biodrug Design Accelerator - Technical Benefits
- Figure 9-2: Biodrug Design Accelerator - Technical Benefits
- Figure 9-3: IO Biotech - T-win Technology
- Figure 9-4: Numatech - Numaferm Platform
- Figure 9-5: Nuritas - Scientific Achievements of Magnifier NφΦ Bioactive Peptide Discovery Platform
- Figure 9-6: Nuritas - The Magnifier NφΦ Bioactive Peptide Discovery Process
- Figure 9-7: Nuritas - The Magnifier NφΦ Bioactive Peptide Results
- Figure 9-8: GenScript - PepPower Technology
- Figure 9-9: PeptiDream - PDPS Outline
- Figure 9-10: PeptiDream - PDPS Outline
- Figure 9-11: PeptiDream - PDPS Features
- Figure 9-12: Benefits of DRPs as Drug Molecule Scaffold
- Figure 9-13: Veneno Technologies - Veneno Suite Components
- Figure 9-14: Veneno Technologies - Veneno Suite Process
- Figure 9-15: Peptron - SmartDepot™ Features
- Figure 9-16: Peptron - SmartDepot™ Manufacturing Scheme
- Figure 9-17: Bicycle Therapeutics - Bicycles Key Properties
- Figure 9-18: Bicycle Therapeutics - Bicycles Key Properties
- Figure 9-19: pHion Therapeutics - RALA Nanoparticles Advantages
- Figure 9-20: pHion Therapeutics - RALA Nanoparticles BENEFITS
- Figure 9-21: Orbit Discovery - Orbit Peptide Display Engine
- Figure 9-22: Benefits of Imotopes over Current Therapies
- Figure 9-23: Peptilogics - Peptide Development Process
- Figure 9-24: Peptilogics - Nautilus Features
- Figure 9-25: Pepticom - Swarm Intelligence 2.0 AI platform
- Figure 9-26: Cybrexa - alphalex Selective Tumor Cell Targeting
List of Tables
- Table 1-1: Landmarks in Peptides Drugs Market
- Table 6-1: US - Recent FDA Designations for Peptide Drug Candidates
- Table 8-1: Bylvay - Recommended Dosage for 40 mcg/kg/day
- Table 8-2: Parsabiv - Recommended Schedule for Monitoring Corrected Serum Calcium and Parathyroid Hormone Levels during Treatment
- Table 8-3: Voxzogo - Recommended Daily Dosage and Injection Volume
- Table 8-4: Wegovy - Recommended Dosage Regimen for Adults
- Table 8-5: Wegovy - Recommended Dosage Regimen for Pediatric Patients Aged 12 Years and Older
- Table 9-1: GenScript - PepPower™ Platform Advantages
“Global Peptide Therapeutics Market, Drug Dosage, Price & Clinical Trials Insight 2029” Reports Findings & Highlights:
- Global Peptide Therapeutics Market Opportunity: > USD 80 Billion By 2029
- Global & Regional Peptide Therapeutics Market Outlook
- Insight On Peptides In Clinical Trials By Country, Indication & Phase: > 900 Peptides In Trials
- Comprehensive Insight On Peptides Drugs Available in Market: > 200 Peptides
- Marketed Peptide Drugs Insight: Patent, Availability, Cost, Dosage, & Sales Insight
- Global, Regional, Annual & Quarterly Sales Insights
- Peptide Therapeutics Development Technologies Platform
- Global Peptide Drugs Clinical Research & Market Trends by Indication
In the dynamic pharmaceutical landscape, peptide drugs stand out as an indicator of innovation and therapeutic potential. These exception therapeutic agents have received a lot of interest due to their wide range of applications and distinct advantages. Peptide drugs provide a precise and personalized approach to therapy, from treating metabolic abnormalities to tackling complex diseases like cancer. As a result, it has become important for the pharmaceutical industry to understand the growing significance of peptides in the market to exploit their full potential, and also the revolutionary influence they are poised to have in the constantly evolving environment of healthcare.
Once overshadowed by small molecule and large protein based therapeutics, peptides have emerged as the new growth frontier of the pharmaceutical realm in the recent years. They have demonstrated therapeutic, diagnostic and theranostic properties, ushering in a new era of precision medicine. These adaptable molecules serve a critical role in treating a wide range of medical conditions by providing targeted therapeutic interventions. Beyond their treatment prowess, peptides illuminate the diagnostic landscape, serving as beacons in the detection of specific biomarkers and diseases. The convergence of therapeutic and diagnostic capabilities gives rise to the evolutionary concept of theranostics, where peptides act as both healers and guides, navigating the path toward personalized and effective healthcare solutions.
The continuous evolution of peptide drug development is fuelled by advancements in research and technology. Combinatorial chemistry and high-throughput screening have aided in the discovery of new peptide sequences with medicinal promise. Furthermore, advances in peptide synthesis processes have increased manufacturing efficiency, addressing historical issues with scalability and cost-effectiveness. The integration of computational tools and structure biology in peptide design has sped up the identification of lead compounds, reducing the time required for drug development.
The incorporation of artificial intelligence in peptide drug development has ushered in a new era of efficiency and innovation. Machine learning algorithms analyze vast datasets, predicting peptide structures with high binding affinities and enhancing the success rate of drug candidates. Additionally, AI helps in the identification of potential adverse events and optimization of pharmacokinetic properties, contributing to the overall quality of peptide therapeutics. Pharmaceutical companies such as ProteinQure have developed an extensive portfolio of peptide therapeutics using computational tools, while others like Space Peptides provide contract services to grant access to their machine learning and AI tools to design and produce premium peptide drugs.
The escalating interest of large pharmaceutical companies in peptide drugs is evident from the rapidly expanding global pipeline of peptide therapeutics. In addition, a surge of collaborations and strategic partnerships has been observed in the recent months within the pharmaceutical industry, some of these involving prominent pharmaceutical companies including Eli Lilly and AstraZeneca. Recognizing the potential of peptides to address unmet medical needs, prominent companies are aggressively seeking to expand their peptide portfolios through joint ventures, licensing agreements and acquisitions, which allow resource pooling and utilization of combined knowledge, thereby accelerating the development and commercialization of peptide drugs.
Peptide drugs are expected to play a significant role in the future landscape of the global pharmaceutical market. The growing understanding of disease causes at molecular levels coincides with the precision targeting abilities of peptides, making them a cornerstone in personalized medicine. Continuous advances in peptide engineering, together with the incorporation of AI, will almost certainly result in the development of highly effective and well-tolerated treatments. As the pharmaceutical industry move toward patient-centric paradigm, the adaptability and specificity of peptide drugs positions them as frontrunners in addressing the shifting healthcare landscape. Peptides' adaptability across therapeutic areas, paired with their good safety rating, makes them an appealing choice for pharmaceutical companies seeking to fulfil patients' medical diverse needs.
In conclusion, the journey through the realm of peptide drugs reveals an extensive array of innovation and potential. As we approach a new era in pharmaceuticals, peptides appear as more than merely therapeutic and diagnostic agents, but also as forerunners of a paradigm shift in healthcare. Peptides will play a crucial role in personalized medicine, targeted therapeutics, and the ever-expanding panorama of precision healthcare in the future. The combination of cutting-edge technology like AI with the inherent versatility of peptides opens the door to exceptional developments. The expanding peptide drugs narrative pains a captivating vision of a future in which these molecules continue to push the bounds of medical possibility, delivering innovative treatments and optimisms on the horizon.
Table of Contents
1. Introduction to Peptide Drugs
- 1.1. History, Development & Evolution
- 1.2. Approved Peptide Drugs
2. Peptide Drugs - Therapeutic, Diagnostic & Theranostic Potential & Market Implications
- 2.1. Therapeutic Potential & Market Implications
- 2.2. Diagnostic Potential & Market Implications
- 2.3. Theranostic Potential & Market Implications
3. Global Peptide Drugs Clinical Research & Market Trends by Indication
- 3.1. Inheritable Genetic Diseases
- 3.2. Cancer
- 3.3. Microbial Infections
- 3.4. Autoimmune Disorders
- 3.5. Metabolic Disorders
- 3.6. Neurodegenerative Diseases
4. Peptide Based Therapeutic Approaches
- 4.1. Peptide Hormone Drugs
- 4.2. Peptide Drug Conjugates
- 4.3. Peptide Vaccines
- 4.4. Peptide Agonists
- 4.5. Peptide Aptamers
- 4.6. Peptide Antibody
5. Global Peptide Therapeutics Market Outlook
- 5.1. Current Market Trends & Drivers
- 5.2. Future Growth Avenues
6. Peptide Therapeutics Market Landscape by Region
- 6.1. US
- 6.2. EU
- 6.3. China
- 6.4. Japan
- 6.5. South Korea
- 6.6. UK
- 6.7. India
- 6.8. Middle East
- 6.9. Canada
- 6.10. Australia
7. Global Peptide Therapeutics Clinical Trials Overview
- 7.1. By Country
- 7.2. Indication
- 7.3. Phase
- 7.4. Priority Status
- 7.5. Therapy Class
8. Marketed Peptide Drugs Insight - Patent, Availability, Cost, Dosage, & Sales Insight
- 8.1. Bylvay
- 8.1.1. Overview
- 8.1.2. Pricing & Dosage Analysis
- 8.1.3. Sales Insight
- 8.2. Parsabiv
- 8.2.1. Overview & PatentS Insight
- 8.2.2. Pricing & Dosage Analysis
- 8.2.3. Sales Insight
- 8.3. Bydureon BCise
- 8.3.1. Overview & Patent Insight
- 8.3.2. Pricing & Dosage Analysis
- 8.3.3. Sales Insight
- 8.4. Linzess
- 8.4.1. Overview & Patent Insight
- 8.4.2. Pricing & Dosage Insight
- 8.4.3. Sales Insight
- 8.5. Increlex
- 8.5.1. Overview & Patent Insight
- 8.5.2. Pricing & Dosage Insight
- 8.5.3. Sales Analysis
- 8.6. Terlivaz
- 8.6.1. Overview & Patent Insight
- 8.6.2. Pricing & Dosage Insight
- 8.6.3. Sales Analysis
- 8.7. Empaveli
- 8.7.1. Overview & Patent Insight
- 8.7.2. Pricing & Dosage Insight
- 8.7.3. Sales Analysis
- 8.8. Voxzogo
- 8.8.1. Overview & Patent Insight
- 8.8.2. Pricing & Dosage Insight
- 8.8.3. Sales Analysis
- 8.9. Imcivree
- 8.9.1. Overview & Patent Insight
- 8.9.2. Pricing & Dosage Insight
- 8.9.3. Sales Analysis
- 8.10. Trulicity
- 8.10.1. Overview & Patent Insight
- 8.10.2. Pricing & Dosage Insight
- 8.10.3. Sales Analysis
- 8.11. Ozempic
- 8.11.1. Overview & Patent Insight
- 8.11.2. Pricing & Dosage Insight
- 8.11.3. Sales Analysis
- 8.12. Wegovy
- 8.12.1. Overview & Patent Insight
- 8.12.2. Pricing & Dosage Insight
- 8.12.3. Sales Analysis
- 8.13. Tresiba
- 8.13.1. Overview & Patent Insight
- 8.13.2. Pricing & Dosage Insight
- 8.13.3. Sales Analysis
- 8.14. Rybelsus
- 8.14.1. Overview & Patent Insight
- 8.14.2. Pricing & Dosage Insight
- 8.14.3. Sales Analysis
- 8.15. Xultophy
- 8.15.1. Overview & Patent Insight
- 8.15.2. Pricing & Dosage Insight
- 8.15.3. Sales Analysis
- 8.16. Victoza
- 8.16.1. Overview & Patent Insight
- 8.16.2. Pricing & Dosage Insight
- 8.16.3. Sales Analysis
- 8.17. Ryzodeg
- 8.17.1. Overview & Patent Insight
- 8.17.2. Pricing & Dosage Insight
- 8.17.3. Sales Analysis
- 8.18. Fiasp
- 8.18.1. Overview & Patent Insight
- 8.18.2. Pricing & Dosage Insight
- 8.18.3. Sales Analysis
- 8.19. Lantus
- 8.19.1. Overview & Patent Insight
- 8.19.2. Pricing & Dosage Insight
- 8.19.3. Sales Analysis
- 8.20. Toujeo
- 8.20.1. Overview & Patent Insight
- 8.20.2. Pricing & Dosage Insight
- 8.20.3. Sales Analysis
9. Peptide Therapeutics Development Technologies Platform
- 9.1. Biodrug Design Accelerator - Fujitsu/PeptiDream
- 9.2. T-Win® Technology - IO Biotech
- 9.3. Numatech - Numaferm
- 9.4. ProteinStudio - ProteinQure
- 9.5. The Magnifier NφΦ™ - Nuritas
- 9.6. PepPower - GenScript
- 9.7. Unnamed Peptide Platform - Zealand Pharma
- 9.8. PDPS (Peptide Discovery Platform System) - PeptiDream
- 9.9. Veneno Suite - Veneno Technologies
- 9.10. SmartDepot™ Technology - Peptron
- 9.11. Bicycles - Bicycle Therapeutics
- 9.12. RALA Technolgy - pHion Therapeutics
- 9.13. Discovery Platform - Orbit Discovery
- 9.14. Imotopes - Imcyse
- 9.15. Nautilus - Peptilogics
- 9.16. Swarm Intelligence 2.0 - Pepticom
- 9.17. streaMLine Platform - Gubra
- 9.18. Precision Endocrine Peptides (PEPs) - MBX Biosciences
- 9.19. pHLIP (pH-Low Insertion Peptides) - pHLIP
- 9.20. alphalex - Cybrexa
10. Cyclic Peptides Clinical Trials Insight By Country, Indication & Phase
- 10.1. Research
- 10.2. Preclinical
- 10.3. Phase-I
- 10.4. Phase-I/II
- 10.5. Phase-II
- 10.6. Phase-II/III
- 10.7. Phase-III
- 10.8. Preregistration
- 10.9. Registered
- 10.10. Marketed
11. Peptide Hormones Clinical Trials Insight By Country, Indication & Phase
- 11.1. Research
- 11.2. Preclinical
- 11.3. Phase-I
- 11.5. Phase-I/II
- 11.6. Phase-II
- 11.7. Phase-II/III
- 11.8. Phase-III
- 11.9. Preregistration
- 11.10. Registered
- 11.11. Marketed
12. Peptides Clinical Trials Insight By Country, Indication & Phase
- 12.1. Research
- 12.2. Preclinical
- 12.3. Phase-I
- 12.4. Phase-I/II
- 12.5. Phase-II
- 12.6. Phase-II/III
- 12.7. Phase-III
- 12.8. Preregistration
- 12.9. Registered
- 12.10. Marketed
13. Glucagon-Like Peptides Clinical Trials Insight By Country, Indication & Phase
- 13.1. Preclinical
- 13.2. Phase-I
- 13.3. Phase-I/II
- 13.4. Phase-II
- 13.5. Phase-III
- 13.6. Marketed
14. Oligopeptides Clinical Trials Insight By Country, Indication & Phase
- 14.1. Research
- 14.2. Preclinical
- 14.3. Phase-I
- 14.4. Phase-I/II
- 14.5. Phase-II
- 14.6. Phase-II/III
- 14.7. Phase-III
- 14.8. Registered
- 14.9. Marketed
15. Lipopeptides Clinical Trials Insight By Country, Indication & Phase
- 15.1. Research
- 15.2. Preclinical
- 15.3. Phase-II
- 15.4. Marketed
16. Dipeptides Clinical Trials Insight By Country, Indication & Phase
- 16.1. Research
- 16.2. Preclinical
- 16.3. Phase-I
- 16.4. Phase-II
- 16.5. Phase-III
- 16.6. Registered
- 16.7. Marketed
17. Depsipeptides Clinical Trials Insight By Country, Indication & Phase
- 17.1. Preclinical
- 17.2. Phase-I
- 17.3. Phase-II
- 17.4. Marketed
18. Glycopeptides Clinical Trials Insight By Country, Indication & Phase
- 18.1. Preclinical
- 18.2. Phase-I
- 18.3. Phase-I/II
- 18.5. Phase-II
- 18.6. Phase-III
- 18.8. Marketed
19. Peptide Vaccines Clinical Trials Insight By Country, Indication & Phase
- 19.1. Preclinical
- 19.2. Phase-I/II
- 19.3. Phase-II
- 19.4. Phase-III
- 19.5. Registered
- 19.6. Marketed
20. Peptide Fragments Clinical Trials Insight By Country, Indication & Phase
- 20.1. Preclinical
- 20.2. Phase-I
- 20.3. Phase-II
- 20.4. Phase-III
- 20.5. Preregistration
- 20.6. Registered
- 20.7. Marketed
21. Opioid Peptides Clinical Trials Insight By Country, Indication & Phase
- 21.1. Research
- 21.2. Preclinical
- 21.3. Phase-I
- 21.4. Phase-II
- 21.5. Preregistration
- 21.6. Registered
- 21.7. Marketed
22. Natriuretic Peptides Clinical Trials Insight By Country, Indication & Phase
- 22.1. Preclinical
- 22.2. Phase-I
- 22.3. Phase-II
- 22.4. Phase-II/III
- 22.5. Phase-III
- 22.6. Marketed
23. Neuropeptides Clinical Trials Insight By Country, Indication & Phase
- 23.1. Research
- 23.2. Preclinical
- 23.3. Phase-I
- 23.4. Phase-I/II
- 23.5. Phase-II
- 23.6. Marketed
24. Antimicrobial Cationic Peptides Clinical Trials Insight By Country, Indication & Phase
- 24.1. Preclinical
- 24.2. Phase-I
- 24.3. Phase-III
25. Peptide Hydrolases Clinical Trials Insight By Country, Indication & Phase
- 25.1. Phase-II
26. Peptide Aptamers
- 26.1. Research
- 26.2. Preclinical
- 26.3. Phase-I
- 26.4. Phase-II
27. Intercellular Signalling Peptides Clinical Trials Insight By Country, Indication & Phase
- 27.1. Phase-II
28. Peptide Antibiotics Clinical Trials Insight By Country, Indication & Phase
- 28.1. Phase-I
29. Peptide Drug Conjugates Clinical Trials Insight By Country, Indication & Phase
- 29.1. Preclinical
30. Bicyclic Peptides Clinical Trials Insight By Country, Indication & Phase
- 30.1. Preclinical
31. Multiple Peptides Clinical Trials Insight By Country, Indication & Phase
- 31.1. Research
- 31.2. Preclinical
- 31.3. Phase-I
- 31.4. Phase-I/II
- 31.5. Phase-II
- 31.6. Preregistration
- 31.7. Registered
- 31.8. Marketed
32. Competitive Landscape
- 32.1. AbbVie
- 32.2. Adocia
- 32.3. Amgen
- 32.4. Antlia Bioscience
- 32.5. AsclepiX Therapeutics
- 32.6. AstraZeneca
- 32.7. Bicycle Therapeutics
- 32.8. Biohaven Labs
- 32.9. Bristol-Myers Squibb
- 32.10. Carmot Therapeutics
- 32.11. Eli Lilly and Company
- 32.12. Ferring Pharmaceuticals
- 32.13. Gan&Lee Pharmaceuticals
- 32.14. GEROPHARM
- 32.15. Hanmi Pharmaceutical
- 32.16. HEC Pharm
- 32.17. Heidelberg Pharma AG
- 32.18. ImCyse
- 32.19. Janux Therapeutics
- 32.20. Kine Sciences
- 32.21. Lactocore
- 32.22. Maxwell Biosciences
- 32.23. Merck & Co
- 32.24. Novartis
- 32.25. Novo Nordisk
- 32.26. Oryn Therapeutics
- 32.27. Palatin Technologies
- 32.28. PeptiDream
- 32.29. Pfizer
- 32.30. Priavoid
- 32.31. Primary Peptides
- 32.32. Protagonist Therapeutics
- 32.33. Roche
- 32.34. Sanofi
- 32.35. Sapience Therapeutics
- 32.36. Seagen
- 32.37. Shaanxi Micot Technology Co
- 32.38. Stuart Therapeutics
- 32.39. Takeda
- 32.40. Zealand Pharma

