|
|
市場調査レポート
商品コード
1473649
水素燃料電池市場:2024-2034年Hydrogen Fuel Cell Market Report 2024-2034 |
||||||
|
|
|||||||
|
● お客様のご希望に応じて、既存データの加工や未掲載情報(例:国別セグメント)の追加などの対応が可能です。 詳細はお問い合わせください。 |
|||||||

| 水素燃料電池市場:2024-2034年 |
|
出版日: 2024年05月03日
発行: Visiongain Reports Ltd.
ページ情報: 英文 394 Pages
納期: 即日から翌営業日
|
- 全表示
- 概要
- 図表
- 目次
世界の水素燃料電池の市場規模は、2034年にかけてCAGR 21.7%で成長すると予測されています。
さまざまな分野でクリーンで持続可能なエネルギーソリューションへの需要が増加:
世界の水素燃料電池市場は、さまざまな分野におけるクリーンで持続可能なエネルギーソリューションへの需要の高まりにより、大幅な成長を遂げています。水素燃料電池は、従来の化石燃料に代わる有望な選択肢であり、定置用および輸送用用途に効率的で環境に優しい発電を提供します。
水素燃料電池市場の成長を後押ししている要因はいくつかあります。第一に、環境への関心の高まりと二酸化炭素排出量削減を目的とした厳しい規制が、クリーンエネルギー技術の採用を促進しています。水素燃料電池は、そのゼロエミッション特性と汎用性により、これらの課題に対処するための実行可能なソリューションとして支持を集めています。さらに、効率、耐久性、費用対効果の改善といった燃料電池技術の進歩が、さまざまなエンドユーザー産業で市場の可能性を広げています。さらに、水素インフラ開拓に対する政府の取り組みや投資が、民間セクターの関与の増加と相まって、市場の成長をさらに促進しています。
水素自動車よりも電池式電気自動車への好感度が高いため、市場成長が抑制される:
水素自動車にとって重要な市場抑制要因のひとつは、電池式電気自動車(BEV)への高い嗜好性です。近年、BEVはいくつかの要因から自動車市場で大きな支持を得ています。第一に、BEVは電池技術の著しい進歩を目の当たりにし、エネルギー密度の向上、走行距離の延長、充電時間の短縮につながっています。これにより、電気自動車に関する主な懸念事項のひとつである、航続距離の制限と充電時間の長さが緩和されました。第二に、充電ステーションやネットワークといったBEVのためのインフラが、特に野心的な脱炭素化目標を掲げている地域において、急速に拡大した。政府や民間企業は、充電インフラの整備に多額の投資を行っており、消費者にとってBEVがより身近で便利なものとなっています。その結果、消費者は、異なる燃料補給インフラを必要とする水素自動車と比較して、BEVをより実用的で容易に入手可能な選択肢として認識する可能性があります。
当レポートでは、世界の水素燃料電池の市場を調査し、市場概要、市場成長への影響因子および市場機会の分析、市場規模の推移・予測、各種区分・地域別の詳細分析、競合情勢、主要企業のプロファイルなどをまとめています。
目次
第1章 レポートの概要
第2章 エグゼクティブサマリー
第3章 市場概要
- 主な調査結果
- 市場力学
- 市場推進要因
- 市場抑制要因
- 市場機会
- ポーターのファイブフォース分析
- COVID-19の影響分析
- PEST分析
第4章 水素燃料電池市場の分析:用途別
- 主要調査結果
- 市場魅力度指数
- 市場規模の推移・予測
- 定置型発電
- 輸送
- ポータブルデバイス
- その他
- 市場規模の推移・予測:地域別
- 市場シェア:地域別
第5章 水素燃料電池市場の分析:タイプ別
- 主要調査結果
- 市場魅力度指数
- 市場規模の推移・予測
- プロトン交換膜燃料電池
- 高分子電解質膜燃料電池(PEMFC)
- 固体酸化物燃料電池
- 溶融炭酸塩燃料電池
- その他
- 市場規模の推移・予測:地域別
- 市場シェア:地域別
第6章 水素燃料電池市場の分析:エンドユーザー別
- 主要調査結果
- 市場魅力度指数
- 市場規模の推移・予測
- 商業・工業
- 輸送
- データセンター
- 軍事・防衛
- 公共事業・政府
- その他
- 市場規模の推移・予測:地域別
- 市場シェア:地域別
第7章 水素燃料電池市場の分析:地域別
- 主要調査結果
- 市場規模の推移・予測
第8章 北米の水素燃料電池市場の分析
第9章 欧州の水素燃料電池市場の分析
第10章 アジア太平洋の水素燃料電池市場の分析
第11章 中東・アフリカの水素燃料電池市場の分析
第12章 ラテンアメリカの水素燃料電池市場の分析
第13章 企業プロファイル
- 競合情勢
- 戦略的展望
- Ballard Power Systems Inc
- Toyota Motor Corporation
- Plug Power Inc.
- Air Liquide S.A.
- Nikola Corporation
- Hyundai Motor Company
- Mitsubishi Heavy Industries, Ltd
- Nel ASA
- Cummins Inc.
- Toshiba Energy Systems &Solutions Corporation
- Aisin Corporation
- ITM Power plc
- Panasonic Holdings Corporation
- Bloom Energy
- Fuel Cell Energy, Inc.
第14章 総論・提言
- Visiongainからの総論
- 参入企業への推奨事項
List of Tables
- Table 1 Hydrogen Fuel Cell Market Snapshot, 2024 & 2034 (US$ Million, CAGR %)
- Table 2 Global Hydrogen Fuel Cell Market by Region, 2024-2034 (US$ Mn, AGR (%), CAGR (%)) (V-Shaped Recovery Scenario)
- Table 3 Global Hydrogen Fuel Cell Market by Region, 2024-2034 (US$ Mn, AGR (%), CAGR (%)) (U-Shaped Recovery Scenario)
- Table 4 Global Hydrogen Fuel Cell Market by Region, 2024-2034 (US$ Mn, AGR (%), CAGR (%)) (W-Shaped Recovery Scenario)
- Table 5 Global Hydrogen Fuel Cell Market by Region, 2024-2034 (US$ Mn, AGR (%), CAGR (%)) (L-Shaped Recovery Scenario)
- Table 6 Global Hydrogen Fuel Cell Market by Application, 2024-2034 (US$ Mn, AGR (%), CAGR (%))
- Table 7 Stationary Power Generation Market by Region, 2024-2034 (US$ Mn, AGR (%), CAGR (%))
- Table 8 Transportation Market by Region, 2024-2034 (US$ Mn, AGR (%), CAGR (%))
- Table 9 Portable Devices Market by Region, 2024-2034 (US$ Mn, AGR (%), CAGR (%))
- Table 10 Other Applications Market by Region, 2024-2034 (US$ Mn, AGR (%), CAGR (%))
- Table 11 Other Applications Market by Region, 2024-2034 (US$ Mn, AGR (%), CAGR (%))
- Table 12 Global Hydrogen Fuel Cell Market by Type, 2024-2034 (US$ Mn, AGR (%), CAGR (%))
- Table 13 Proton Exchange Membrane Fuel Cells Market by Region, 2024-2034 (US$ Mn, AGR (%), CAGR (%))
- Table 14 Polymer Electrolyte Membrane Fuel Cells (PEMFC) Market by Region, 2024-2034 (US$ Mn, AGR (%), CAGR (%))
- Table 15 Solid Oxide Fuel Cells Market by Region, 2024-2034 (US$ Mn, AGR (%), CAGR (%))
- Table 16 Molten Carbonate Fuel Cells Market by Region, 2024-2034 (US$ Mn, AGR (%), CAGR (%))
- Table 17 Other Types Market by Region, 2024-2034 (US$ Mn, AGR (%), CAGR (%))
- Table 18 Global Hydrogen Fuel Cell Market by End-User, 2024-2034 (US$ Mn, AGR (%), CAGR (%))
- Table 19 Commercial & Industrial Market by Region, 2024-2034 (US$ Mn, AGR (%), CAGR (%))
- Table 20 Transport Industry Market by Region, 2024-2034 (US$ Mn, AGR (%), CAGR (%))
- Table 21 Data Centers Market by Region, 2024-2034 (US$ Mn, AGR (%), CAGR (%))
- Table 22 Military & Defense Market by Region, 2024-2034 (US$ Mn, AGR (%), CAGR (%))
- Table 23 Utilities & Government Market by Region, 2024-2034 (US$ Mn, AGR (%), CAGR (%))
- Table 24 Other End-Users Market by Region, 2024-2034 (US$ Mn, AGR (%), CAGR (%))
- Table 25 Global Hydrogen Fuel Cell Market by Region, 2024-2034 (US$ Mn, AGR (%), CAGR (%))
- Table 26 North America Hydrogen Fuel Cell Market by Value, 2024-2034 (US$ Mn, AGR (%), CAGR (%))
- Table 27 North America Hydrogen Fuel Cell Market by Country, 2024-2034 (US$ Mn, AGR (%), CAGR (%))
- Table 28 North America Hydrogen Fuel Cell Market by Application, 2024-2034 (US$ Mn, AGR (%), CAGR (%))
- Table 29 North America Hydrogen Fuel Cell Market by Type, 2024-2034 (US$ Mn, AGR (%), CAGR (%))
- Table 30 North America Hydrogen Fuel Cell Market by End-User, 2024-2034 (US$ Mn, AGR (%), CAGR (%))
- Table 31 US Hydrogen Fuel Cell Market by Value, 2024-2034 (US$ Mn, AGR (%), CAGR (%))
- Table 32 Canada Hydrogen Fuel Cell Market by Value, 2024-2034 (US$ Mn, AGR (%), CAGR (%))
- Table 33 Europe Hydrogen Fuel Cell Market by Value, 2024-2034 (US$ Mn, AGR (%), CAGR (%))
- Table 34 Europe Hydrogen Fuel Cell Market by Country, 2024-2034 (US$ Mn, AGR (%), CAGR (%))
- Table 35 Europe Hydrogen Fuel Cell Market by Application, 2024-2034 (US$ Mn, AGR (%), CAGR (%))
- Table 36 Europe Hydrogen Fuel Cell Market by Type, 2024-2034 (US$ Mn, AGR (%), CAGR (%))
- Table 37 Europe Hydrogen Fuel Cell Market by End-User, 2024-2034 (US$ Mn, AGR (%), CAGR (%))
- Table 38 Germany Hydrogen Fuel Cell Market by Value, 2024-2034 (US$ Mn, AGR (%), CAGR (%))
- Table 39 UK Hydrogen Fuel Cell Market by Value, 2024-2034 (US$ Mn, AGR (%), CAGR (%))
- Table 40 France Hydrogen Fuel Cell Market by Value, 2024-2034 (US$ Mn, AGR (%), CAGR (%))
- Table 41 Norway Hydrogen Fuel Cell Market by Value, 2024-2034 (US$ Mn, AGR (%), CAGR (%))
- Table 42 Denmark Hydrogen Fuel Cell Market by Value, 2024-2034 (US$ Mn, AGR (%), CAGR (%))
- Table 43 Rest of Europe Hydrogen Fuel Cell Market by Value, 2024-2034 (US$ Mn, AGR (%), CAGR (%))
- Table 44 Asia-Pacific Hydrogen Fuel Cell Market by Value, 2024-2034 (US$ Mn, AGR (%), CAGR (%))
- Table 45 Asia-Pacific Hydrogen Fuel Cell Market by Country, 2024-2034 (US$ Mn, AGR (%), CAGR (%))
- Table 46 Asia-Pacific Hydrogen Fuel Cell Market by Application, 2024-2034 (US$ Mn, AGR (%), CAGR (%))
- Table 47 Asia-Pacific Hydrogen Fuel Cell Market by Type, 2024-2034 (US$ Mn, AGR (%), CAGR (%))
- Table 48 Asia-Pacific Hydrogen Fuel Cell Market by End-User, 2024-2034 (US$ Mn, AGR (%), CAGR (%))
- Table 49 China Hydrogen Fuel Cell Market by Value, 2024-2034 (US$ Mn, AGR (%), CAGR (%))
- Table 50 India Hydrogen Fuel Cell Market by Value, 2024-2034 (US$ Mn, AGR (%), CAGR (%))
- Table 51 Japan Hydrogen Fuel Cell Market by Value, 2024-2034 (US$ Mn, AGR (%), CAGR (%))
- Table 52 South Korea Hydrogen Fuel Cell Market by Value, 2024-2034 (US$ Mn, AGR (%), CAGR (%))
- Table 53 Australia Hydrogen Fuel Cell Market by Value, 2024-2034 (US$ Mn, AGR (%), CAGR (%))
- Table 54 Rest of Asia-Pacific Hydrogen Fuel Cell Market by Value, 2024-2034 (US$ Mn, AGR (%), CAGR (%))
- Table 55 Middle East & Africa Hydrogen Fuel Cell Market by Value, 2024-2034 (US$ Mn, AGR (%), CAGR (%))
- Table 56 Middle East & Africa Hydrogen Fuel Cell Market by Country, 2024-2034 (US$ Mn, AGR (%), CAGR (%))
- Table 57 Middle East & Africa Hydrogen Fuel Cell Market by Application, 2024-2034 (US$ Mn, AGR (%), CAGR (%))
- Table 58 Middle East & Africa Hydrogen Fuel Cell Market by Type, 2024-2034 (US$ Mn, AGR (%), CAGR (%))
- Table 59 Middle East & Africa Hydrogen Fuel Cell Market by End-User, 2024-2034 (US$ Mn, AGR (%), CAGR (%))
- Table 60 GCC Hydrogen Fuel Cell Market by Value, 2024-2034 (US$ Mn, AGR (%), CAGR (%))
- Table 61 South Africa Hydrogen Fuel Cell Market by Value, 2024-2034 (US$ Mn, AGR (%), CAGR (%))
- Table 62 Rest of Middle East & Africa Hydrogen Fuel Cell Market by Value, 2024-2034 (US$ Mn, AGR (%), CAGR (%))
- Table 63 Latin America Hydrogen Fuel Cell Market by Value, 2024-2034 (US$ Mn, AGR (%), CAGR (%))
- Table 64 Latin America Hydrogen Fuel Cell Market by Country, 2024-2034 (US$ Mn, AGR (%), CAGR (%))
- Table 65 Latin America Hydrogen Fuel Cell Market by Application, 2024-2034 (US$ Mn, AGR (%), CAGR (%))
- Table 66 Latin America Hydrogen Fuel Cell Market by Type, 2024-2034 (US$ Mn, AGR (%), CAGR (%))
- Table 67 Latin America Hydrogen Fuel Cell Market by End-User, 2024-2034 (US$ Mn, AGR (%), CAGR (%))
- Table 68 Brazil Hydrogen Fuel Cell Market by Value, 2024-2034 (US$ Mn, AGR (%), CAGR (%))
- Table 69 Mexico Hydrogen Fuel Cell Market by Value, 2024-2034 (US$ Mn, AGR (%), CAGR (%))
- Table 70 Rest of Latin America Hydrogen Fuel Cell Market by Value, 2024-2034 (US$ Mn, AGR (%), CAGR (%))
- Table 71 Strategic Outlook - Contract
- Table 72 Ballard Power Systems Inc: Key Details, (CEO, HQ, Revenue, Founded, No. of Employees, Company Type, Website, Business Segment)
- Table 73 Ballard Power Systems Inc: Product Benchmarking
- Table 74 Ballard Power Systems Inc: Strategic Outlook
- Table 75 Toyota Motor Corporation: Key Details, (CEO, HQ, Revenue, Founded, No. of Employees, Company Type, Website, Business Segment)
- Table 76 Toyota Motor Corporation: Product Benchmarking
- Table 77 Toyota Motor Corporation: Strategic Outlook
- Table 78 Plug Power Inc.: Key Details, (CEO, HQ, Revenue, Founded, No. of Employees, Company Type, Website, Business Segment)
- Table 79 Plug Power Inc.: Product Benchmarking
- Table 80 Plug Power Inc.: Strategic Outlook
- Table 81 Air Liquide S.A.: Key Details, (CEO, HQ, Revenue, Founded, No. of Employees, Company Type, Website, Business Segment)
- Table 82 Air Liquide S.A.: Product Benchmarking
- Table 83 Air Liquide S.A.: Strategic Outlook
- Table 84 Nikola Corporation: Key Details, (CEO, HQ, Revenue, Founded, No. of Employees, Company Type, Website, Business Segment)
- Table 85 Nikola Corporation: Product Benchmarking
- Table 86 Nikola Corporation: Strategic Outlook
- Table 87 Hyundai Motor Company: Key Details, (CEO, HQ, Revenue, Founded, No. of Employees, Company Type, Website, Business Segment)
- Table 88 Hyundai Motor Company: Product Benchmarking
- Table 89 Hyundai Motor Company: Strategic Outlook
- Table 90 Mitsubishi Heavy Industries, Ltd: Key Details, (CEO, HQ, Revenue, Founded, No. of Employees, Company Type, Website, Business Segment)
- Table 91 Mitsubishi Heavy Industries, Ltd: Product Benchmarking
- Table 92 Nel ASA: Key Details, (CEO, HQ, Revenue, Founded, No. of Employees, Company Type, Website, Business Segment)
- Table 93 Nel ASA: Product Benchmarking
- Table 94 Nel ASA: Strategic Outlook
- Table 95 Cummins Inc: Key Details, (CEO, HQ, Revenue, Founded, No. of Employees, Company Type, Website, Business Segment)
- Table 96 Cummins Inc: Product Benchmarking
- Table 97 Cummins Inc: Strategic Outlook
- Table 98 Toshiba Energy Systems & Solutions Corporation: Key Details, (CEO, HQ, Revenue, Founded, No. of Employees, Company Type, Website, Business Segment)
- Table 99 Toshiba Energy Systems & Solutions Corporation: Product Benchmarking
- Table 100 Toshiba Energy Systems & Solutions Corporation: Strategic Outlook
- Table 101 Aisin Corporation.: Key Details, (CEO, HQ, Revenue, Founded, No. of Employees, Company Type, Website, Business Segment)
- Table 102 Aisin Corporation.: Product Benchmarking
- Table 103 Aisin Corporation.: Strategic Outlook
- Table 104 ITM Power plc: Key Details, (CEO, HQ, Revenue, Founded, No. of Employees, Company Type, Website, Business Segment)
- Table 105 ITM Power plc: Product Benchmarking
- Table 106 ITM Power plc: Strategic Outlook
- Table 107 Panasonic Holdings Corporation: Key Details, (CEO, HQ, Revenue, Founded, No. of Employees, Company Type, Website, Business Segment)
- Table 108 Panasonic Holdings Corporation: Product Benchmarking
- Table 109 Panasonic Holdings Corporation: Strategic Outlook
- Table 110 Bloom Energy: Key Details, (CEO, HQ, Revenue, Founded, No. of Employees, Company Type, Website, Business Segment)
- Table 111 Bloom Energy: Product Benchmarking
- Table 112 Bloom Energy: Strategic Outlook
- Table 113 Fuel Cell Energy, Inc.: Key Details, (CEO, HQ, Revenue, Founded, No. of Employees, Company Type, Website, Business Segment)
- Table 114 Fuel Cell Energy, Inc.: Product Benchmarking
- Table 115 Fuel Cell Energy, Inc.: Strategic Outlook
List of Figures
- Figure 1 Hydrogen Fuel Cell Market Segmentation
- Figure 2 Hydrogen Fuel Cell Market by Application: Market Attractiveness Index
- Figure 3 Hydrogen Fuel Cell Market by Type: Market Attractiveness Index
- Figure 4 Hydrogen Fuel Cell Market by End-User: Market Attractiveness Index
- Figure 5 Hydrogen Fuel Cell Market Attractiveness Index by Region
- Figure 6 Hydrogen Fuel Cell Market: Market Dynamics
- Figure 7 Electric Car Sales, 2019-2023
- Figure 8 Comparison Hydrogen-Powered and Electric-Powered Cars
- Figure 9 Hydrogen Fuel Cell Market: Porter's Five Forces Analysis
- Figure 10 Global Hydrogen Fuel Cell Market Share Forecast by COVID, 2024-2034 (%)
- Figure 11 Global Hydrogen Fuel Cell Market by Region, 2024-2034 (US$ Mn, AGR (%)) (V-Shaped Recovery Scenario)
- Figure 12 Global Hydrogen Fuel Cell Market by Region, 2024-2034 (US$ Mn, AGR (%)) (U-Shaped Recovery Scenario)
- Figure 13 Global Hydrogen Fuel Cell Market by Region, 2024-2034 (US$ Mn, AGR (%)) (W-Shaped Recovery Scenario)
- Figure 14 Global Hydrogen Fuel Cell Market by Region, 2024-2034 (US$ Mn, AGR (%)) (L-Shaped Recovery Scenario)
- Figure 15 Hydrogen Fuel Cell Market: PEST Analysis
- Figure 16 Hydrogen Fuel Cell Market by Application: Market Attractiveness Index
- Figure 17 Global Hydrogen Fuel Cell Market by Application, 2024-2034 (US$ Mn, AGR (%))
- Figure 18 Hydrogen Fuel Cell Market Share Forecast by Application, 2024, 2029, 2034 (%)
- Figure 19 Stationary Power Generation Market by Region, 2024-2034 (US$ Mn, AGR (%))
- Figure 20 Stationary Power Generation Market Share Forecast by Region, 2024 & 2034 (%)
- Figure 21 Transportation Market by Region, 2024-2034 (US$ Mn, AGR (%))
- Figure 22 Transportation Market Share Forecast by Region, 2024 & 2034 (%)
- Figure 23 Portable Devices Market by Region, 2024-2034 (US$ Mn, AGR (%))
- Figure 24 Portable Devices Market Share Forecast by Region, 2024 & 2034 (%)
- Figure 25 Other Applications Market by Region, 2024-2034 (US$ Mn, AGR (%))
- Figure 26 Other Applications Market by Region, 2024-2034 (US$ Mn, AGR (%))
- Figure 27 Others Market Share Forecast by Region, 2024 & 2034 (%)
- Figure 28 Hydrogen Fuel Cell Market by Type: Market Attractiveness Index
- Figure 29 Global Hydrogen Fuel Cell Market by Type, 2024-2034 (US$ Mn, AGR (%))
- Figure 30 Hydrogen Fuel Cell Market Share Forecast by Type, 2024, 2029, 2034 (%)
- Figure 31 Proton Exchange Membrane Fuel Cells Market by Region, 2024-2034 (US$ Mn, AGR (%))
- Figure 32 Proton Exchange Membrane Fuel Cells Market Share Forecast by Region, 2024 & 2034 (%)
- Figure 33 Polymer Electrolyte Membrane Fuel Cells (PEMFC) Market by Region, 2024-2034 (US$ Mn, AGR (%))
- Figure 34 Polymer Electrolyte Membrane Fuel Cells (PEMFC) Market Share Forecast by Region, 2024 & 2034 (%)
- Figure 35 Solid Oxide Fuel Cells Market by Region, 2024-2034 (US$ Mn, AGR (%))
- Figure 36 Solid Oxide Fuel Cells Market Share Forecast by Region, 2024 & 2034 (%)
- Figure 37 Molten Carbonate Fuel Cells Market by Region, 2024-2034 (US$ Mn, AGR (%))
- Figure 38 Molten Carbonate Fuel Cells Market Share Forecast by Region, 2024 & 2034 (%)
- Figure 39 Other Types Market by Region, 2024-2034 (US$ Mn, AGR (%))
- Figure 40 Others Types Market Share Forecast by Region, 2024 & 2034 (%)
- Figure 41 Hydrogen Fuel Cell Market by End-User: Market Attractiveness Index
- Figure 42 Global Hydrogen Fuel Cell Market by End-User, 2024-2034 (US$ Mn, AGR (%))
- Figure 43 Hydrogen Fuel Cell Market Share Forecast by End-User, 2024, 2029, 2034 (%)
- Figure 44 Commercial & Industrial Market by Region, 2024-2034 (US$ Mn, AGR (%))
- Figure 45 Commercial & Industrial Market Share Forecast by Region, 2024 & 2034 (%)
- Figure 46 Transport Industry Market by Region, 2024-2034 (US$ Mn, AGR (%))
- Figure 47 Transport Industry Market Share Forecast by Region, 2024 & 2034 (%)
- Figure 48 Data Centers Market by Region, 2024-2034 (US$ Mn, AGR (%))
- Figure 49 Data Centers Market Share Forecast by Region, 2024 & 2034 (%)
- Figure 50 Military & Defense Market by Region, 2024-2034 (US$ Mn, AGR (%))
- Figure 51 Military & Defense Market Share Forecast by Region, 2024 & 2034 (%)
- Figure 52 Utilities & Government Market by Region, 2024-2034 (US$ Mn, AGR (%))
- Figure 53 Utilities & Government Market Share Forecast by Region, 2024 & 2034 (%)
- Figure 54 Other End-Users Market by Region, 2024-2034 (US$ Mn, AGR (%))
- Figure 55 Other End-Users Market Share Forecast by Region, 2024 & 2034 (%)
- Figure 56 Hydrogen Fuel Cell Market Forecast by Region 2024 and 2034 (Revenue, CAGR%)
- Figure 57 Hydrogen Fuel Cell Market Share Forecast by Region 2024, 2029, 2034 (%)
- Figure 58 Global Hydrogen Fuel Cell Market by Region, 2024-2034 (US$ Mn, AGR (%))
- Figure 59 North America Hydrogen Fuel Cell Market Attractiveness Index
- Figure 60 North America Hydrogen Fuel Cell Market by Region, 2024, 2029 & 2034 (US$ Million)
- Figure 61 North America Hydrogen Fuel Cell Market by Value, 2024-2034 (US$ Mn, AGR (%))
- Figure 62 North America Hydrogen Fuel Cell Market by Country, 2024-2034 (US$ Mn, AGR (%))
- Figure 63 North America Hydrogen Fuel Cell Market Share Forecast by Country, 2024 & 2034 (%)
- Figure 64 North America Hydrogen Fuel Cell Market by Application, 2024-2034 (US$ Mn, AGR (%))
- Figure 65 North America Hydrogen Fuel Cell Market Share Forecast Application, 2024 & 2034 (%)
- Figure 66 North America Hydrogen Fuel Cell Market by Type, 2024-2034 (US$ Mn, AGR (%))
- Figure 67 North America Hydrogen Fuel Cell Market Share Forecast by Type, 2024 & 2034 (%)
- Figure 68 North America Hydrogen Fuel Cell Market by End-User, 2024-2034 (US$ Mn, AGR (%))
- Figure 69 North America Hydrogen Fuel Cell Market Share Forecast by End-User, 2024 & 2034 (%)
- Figure 70 US Hydrogen Fuel Cell Market by Value, 2024-2034 (US$ Mn, AGR (%))
- Figure 71 Canada Hydrogen Fuel Cell Market by Value, 2024-2034 (US$ Mn, AGR (%))
- Figure 72 Europe Hydrogen Fuel Cell Market Attractiveness Index
- Figure 73 Europe Hydrogen Fuel Cell Market by Region, 2024, 2029 & 2034 (US$ Million)
- Figure 74 Europe Hydrogen Fuel Cell Market by Value, 2024-2034 (US$ Mn, AGR (%))
- Figure 75 Europe Hydrogen Fuel Cell Market by Country, 2024-2034 (US$ Mn, AGR (%))
- Figure 76 Europe Hydrogen Fuel Cell Market Share Forecast by Country, 2024 & 2034 (%)
- Figure 77 Europe Hydrogen Fuel Cell Market by Application, 2024-2034 (US$ Mn, AGR (%))
- Figure 78 Europe Hydrogen Fuel Cell Market Share Forecast Application, 2024 & 2034 (%)
- Figure 79 Europe Hydrogen Fuel Cell Market by Type, 2024-2034 (US$ Mn, AGR (%))
- Figure 80 Europe Hydrogen Fuel Cell Market Share Forecast by Type, 2024 & 2034 (%)
- Figure 81 Europe Hydrogen Fuel Cell Market by End-user, 2024-2034 (US$ Mn, AGR (%))
- Figure 82 Europe Hydrogen Fuel Cell Market Share Forecast by End-User, 2024 & 2034 (%)
- Figure 83 Germany Hydrogen Fuel Cell Market by Value, 2024-2034 (US$ Mn, AGR (%))
- Figure 84 UK Hydrogen Fuel Cell Market by Value, 2024-2034 (US$ Mn, AGR (%))
- Figure 85 France Hydrogen Fuel Cell Market by Value, 2024-2034 (US$ Mn, AGR (%))
- Figure 86 Norway Hydrogen Fuel Cell Market by Value, 2024-2034 (US$ Mn, AGR (%))
- Figure 87 Denmark Hydrogen Fuel Cell Market by Value, 2024-2034 (US$ Mn, AGR (%))
- Figure 88 Rest of Europe Hydrogen Fuel Cell Market by Value, 2024-2034 (US$ Mn, AGR (%))
- Figure 89 Asia-Pacific Hydrogen Fuel Cell Market Attractiveness Index
- Figure 90 Asia-Pacific Hydrogen Fuel Cell Market by Region, 2024, 2029 & 2034 (US$ Million)
- Figure 91 Asia-Pacific Hydrogen Fuel Cell Market by Value, 2024-2034 (US$ Mn, AGR (%))
- Figure 92 Asia-Pacific Hydrogen Fuel Cell Market by Country, 2024-2034 (US$ Mn, AGR (%))
- Figure 93 Asia-Pacific Hydrogen Fuel Cell Market Share Forecast by Country, 2024 & 2034 (%)
- Figure 94 Asia-Pacific Hydrogen Fuel Cell Market by Application, 2024-2034 (US$ Mn, AGR (%))
- Figure 95 Asia-Pacific Hydrogen Fuel Cell Market Share Forecast Application, 2024 & 2034 (%)
- Figure 96 Asia-Pacific Hydrogen Fuel Cell Market by Type, 2024-2034 (US$ Mn, AGR (%))
- Figure 97 Asia-Pacific Hydrogen Fuel Cell Market Share Forecast by Type, 2024 & 2034 (%)
- Figure 98 Asia-Pacific Hydrogen Fuel Cell Market by End-User, 2024-2034 (US$ Mn, AGR (%))
- Figure 99 Asia-Pacific Hydrogen Fuel Cell Market Share Forecast by End-User, 2024 & 2034 (%)
- Figure 100 China Hydrogen Fuel Cell Market by Value, 2024-2034 (US$ Mn, AGR (%))
- Figure 101 India Hydrogen Fuel Cell Market by Value, 2024-2034 (US$ Mn, AGR (%))
- Figure 102 Japan Hydrogen Fuel Cell Market by Value, 2024-2034 (US$ Mn, AGR (%))
- Figure 103 South Korea Hydrogen Fuel Cell Market by Value, 2024-2034 (US$ Mn, AGR (%))
- Figure 104 Australia Hydrogen Fuel Cell Market by Value, 2024-2034 (US$ Mn, AGR (%))
- Figure 105 Rest of Asia-Pacific Hydrogen Fuel Cell Market by Value, 2024-2034 (US$ Mn, AGR (%))
- Figure 106 Middle East and Africa Hydrogen Fuel Cell Market Attractiveness Index
- Figure 107 Middle East and Africa Hydrogen Fuel Cell Market by Region, 2024, 2029 & 2034 (US$ Million)
- Figure 108 Middle East & Africa Hydrogen Fuel Cell Market by Value, 2024-2034 (US$ Mn, AGR (%))
- Figure 109 Middle East & Africa Hydrogen Fuel Cell Market by Country, 2024-2034 (US$ Mn, AGR (%))
- Figure 110 Middle East and Africa Hydrogen Fuel Cell Market Share Forecast by Country, 2024 & 2034 (%)
- Figure 111 Middle East & Africa Hydrogen Fuel Cell Market by Application, 2024-2034 (US$ Mn, AGR (%))
- Figure 112 Middle East and Africa Hydrogen Fuel Cell Market Share Forecast Application, 2024 & 2034 (%)
- Figure 113 Middle East & Africa Hydrogen Fuel Cell Market by Type, 2024-2034 (US$ Mn, AGR (%))
- Figure 114 Middle East and Africa Hydrogen Fuel Cell Market Share Forecast by Type, 2024 & 2034 (%)
- Figure 115 Middle East & Africa Hydrogen Fuel Cell Market by End-User, 2024-2034 (US$ Mn, AGR (%))
- Figure 116 Middle East and Africa Hydrogen Fuel Cell Market Share Forecast by End-User, 2024 & 2034 (%)
- Figure 117 GCC Hydrogen Fuel Cell Market by Value, 2024-2034 (US$ Mn, AGR (%))
- Figure 118 South Africa Hydrogen Fuel Cell Market by Value, 2024-2034 (US$ Mn, AGR (%))
- Figure 119 Rest of Middle East & Africa Hydrogen Fuel Cell Market by Value, 2024-2034 (US$ Mn, AGR (%))
- Figure 120 Latin America Hydrogen Fuel Cell Market Attractiveness Index
- Figure 121 Latin America Hydrogen Fuel Cell Market by Region, 2024, 2029 & 2034 (US$ Million)
- Figure 122 Latin America Hydrogen Fuel Cell Market by Value, 2024-2034 (US$ Mn, AGR (%))
- Figure 123 Latin America Hydrogen Fuel Cell Market by Country, 2024-2034 (US$ Mn, AGR (%))
- Figure 124 Latin America Hydrogen Fuel Cell Market Share Forecast by Country, 2024 & 2034 (%)
- Figure 125 Latin America Hydrogen Fuel Cell Market by Application, 2024-2034 (US$ Mn, AGR (%))
- Figure 126 Latin America Hydrogen Fuel Cell Market Share Forecast Application, 2024 & 2034 (%)
- Figure 127 Latin America Hydrogen Fuel Cell Market by Type, 2024-2034 (US$ Mn, AGR (%))
- Figure 128 Latin America Hydrogen Fuel Cell Market Share Forecast by Type, 2024 & 2034 (%)
- Figure 129 Latin America Hydrogen Fuel Cell Market by End-User, 2024-2034 (US$ Mn, AGR (%))
- Figure 130 Latin America Hydrogen Fuel Cell Market Share Forecast by End-User, 2024 & 2034 (%)
- Figure 131 Brazil Hydrogen Fuel Cell Market by Value, 2024-2034 (US$ Mn, AGR (%))
- Figure 132 Mexico Hydrogen Fuel Cell Market by Value, 2024-2034 (US$ Mn, AGR (%))
- Figure 133 Rest of Latin America Hydrogen Fuel Cell Market by Value, 2024-2034 (US$ Mn, AGR (%))
- Figure 134 Hydrogen Fuel Cell Market: Company Share, 2023
- Figure 135 Ballard Power Systems Inc.: Net Revenue, 2019-2023 (US$ Million, AGR%)
- Figure 136 Ballard Power Systems Inc.: R&D, 2019-2023 (US$ Million, AGR%)
- Figure 137 Ballard Power Systems Inc.: Regional Revenue Share, 2023 (%)
- Figure 138 Toyota Motor Corporation.: Net Revenue, 2019-2023 (US$ Million, AGR%)
- Figure 139 Toyota Motor Corporation.: R&D, 2019-2023 (US$ Million, AGR%)
- Figure 140 Toyota Motor Corporation.: Regional Revenue Share, 2023 (%)
- Figure 141 Toyota Motor Corporation.: Business Segment Revenue Share, 2023 (%)
- Figure 142 Plug Power Inc..: Net Revenue, 2019-2023 (US$ Million, AGR%)
- Figure 143 Plug Power Inc..: R&D, 2019-2023 (US$ Million, AGR%)
- Figure 144 Plug Power Inc.: Regional Revenue Share, 2023 (%)
- Figure 145 Air Liquide S.A..: Net Revenue, 2019-2023 (US$ Million, AGR%)
- Figure 146 Air Liquide S.A..: R&D, 2019-2023 (US$ Million, AGR%)
- Figure 147 Air Liquide S.A..: Regional Revenue Share, 2023 (%)
- Figure 148 Air Liquide S.A..: Business Segment Revenue Share, 2023 (%)
- Figure 149 Nikola Corporation.: Net Revenue, 2019-2023 (US$ Million, AGR%)
- Figure 150 Nikola Corporation.: R&D, 2019-2023 (US$ Million, AGR%)
- Figure 151 Hyundai Motor Company.: Net Revenue, 2019-2023 (US$ Million, AGR%)
- Figure 152 Hyundai Motor Company.: R&D, 2019-2023 (US$ Million, AGR%)
- Figure 153 Hyundai Motor Company.: Regional Revenue Share, 2023 (%)
- Figure 154 Hyundai Motor Company.: Business Segment Revenue Share, 2023 (%)
- Figure 155 Mitsubishi Heavy Industries, Ltd.: Net Revenue, 2019-2023 (US$ Million, AGR%)
- Figure 156 Mitsubishi Heavy Industries, Ltd.: R&D, 2019-2023 (US$ Million, AGR%)
- Figure 157 Mitsubishi Heavy Industries, Ltd.: Regional Revenue Share, 2023 (%)
- Figure 158 Mitsubishi Heavy Industries, Ltd.: Business Segment Revenue Share, 2023 (%)
- Figure 159 Nel ASA.: Net Revenue, 2019-2023 (US$ Million, AGR%)
- Figure 160 Nel ASA.: R&D, 2019-2023 (US$ Million, AGR%)
- Figure 161 Nel ASA.: Regional Revenue Share, 2023 (%)
- Figure 162 Nel ASA.: Business Segment Revenue Share, 2023 (%)
- Figure 163 Cummins Inc.: Net Revenue, 2019-2023 (US$ Million, AGR%)
- Figure 164 Cummins Inc.: R&D, 2019-2023 (US$ Million, AGR%)
- Figure 165 Toshiba Energy Systems & Solutions Corporation.: Net Revenue, 2019-2023 (US$ Million, AGR%)
- Figure 166 Toshiba Energy Systems & Solutions Corporation.: R&D, 2019-2023 (US$ Million, AGR%)
- Figure 167 Toshiba Energy Systems & Solutions Corporation.: Regional Revenue Share, 2023 (%)
- Figure 168 Toshiba Energy Systems & Solutions Corporation.: Business Segment Revenue Share, 2023 (%)
- Figure 169 Aisin Corporation.: Net Revenue, 2019-2023 (US$ Million, AGR%)
- Figure 170 Aisin Corporation.: R&D, 2019-2023 (US$ Million, AGR%)
- Figure 171 ITM Power plc.: Net Revenue, 2019-2023 (US$ Million, AGR%)
- Figure 172 ITM Power plc.: R&D, 2019-2023 (US$ Million, AGR%)
- Figure 173 ITM Power plc.: Regional Revenue Share, 2023 (%)
- Figure 174 ITM Power plc.: Business Segment Revenue Share, 2023 (%)
- Figure 175 Panasonic Holdings Corporation.: Net Revenue, 2019-2023 (US$ Million, AGR%)
- Figure 176 Panasonic Holdings Corporation.: R&D, 2019-2023 (US$ Million, AGR%)
- Figure 177 Panasonic Holdings Corporation.: Regional Revenue Share, 2023 (%)
- Figure 178 Panasonic Holdings Corporation.: Business Segment Revenue Share, 2023 (%)
- Figure 179 Bloom Energy.: Net Revenue, 2019-2023 (US$ Million, AGR%)
- Figure 180 Bloom Energy.: R&D, 2019-2023 (US$ Million, AGR%)
- Figure 181 Bloom Energy.: Business Segment Revenue Share, 2023 (%)
- Figure 182 Fuel Cell Energy, Inc..: Net Revenue, 2019-2023 (US$ Million, AGR%)
- Figure 183 Fuel Cell Energy, Inc..: R&D, 2019-2023 (US$ Million, AGR%)
- Figure 184 Fuel Cell Energy, Inc..: Regional Revenue Share, 2023 (%)
The global Hydrogen Fuel Cell market is projected to grow at a CAGR of 21.7% by 2034
The Hydrogen Fuel Cell Market Report 2024-2034: This report will prove invaluable to leading firms striving for new revenue pockets if they wish to better understand the industry and its underlying dynamics. It will be useful for companies that would like to expand into different industries or to expand their existing operations in a new region.
Increasing Demand for Clean and Sustainable Energy Solutions Across Various Sectors
The global hydrogen fuel cell market is witnessing substantial growth, driven by the increasing demand for clean and sustainable energy solutions across various sectors. Hydrogen fuel cells offer a promising alternative to traditional fossil fuels, providing efficient and environmentally friendly power generation for stationery and transportation applications. This executive summary provides an overview of the market landscape, highlighting key drivers, opportunities, challenges, and competitive dynamics shaping the industry.
Several factors are propelling the growth of the hydrogen fuel cell market. Firstly, rising environmental concerns and stringent regulations aimed at reducing carbon emissions are driving the adoption of clean energy technologies. Hydrogen fuel cells, with their zero-emission characteristics and versatility, are gaining traction as a viable solution to address these challenges. Additionally, advancements in fuel cell technology, such as improvements in efficiency, durability, and cost-effectiveness, are expanding the market's potential across various end-user industries. Furthermore, government initiatives and investments in hydrogen infrastructure development, coupled with increasing private sector involvement, are further fuelling market growth.
High Preference for Battery Electric Vehicles Over Hydrogen Vehicle to Restrain Market Growth
One significant market restraining factor for hydrogen vehicles is the high preference for battery electric vehicles (BEVs) over hydrogen-powered vehicles. In recent years, BEVs have gained considerable traction in the automotive market due to several factors. Firstly, BEVs have witnessed significant advancements in battery technology, leading to improved energy density, longer driving ranges, and reduced charging times. This has alleviated one of the primary concerns regarding electric vehicles-their limited range and lengthy charging periods. Secondly, the infrastructure for BEVs, such as charging stations and networks, has expanded rapidly, especially in regions with ambitious decarbonization goals. Governments and private entities have invested heavily in establishing charging infrastructure, making BEVs more accessible and convenient for consumers. As a result, consumers may perceive BEVs as a more practical and readily available option compared to hydrogen vehicles, which require a different refuelling infrastructure.
What Questions Should You Ask before Buying a Market Research Report?
How is the hydrogen fuel cell market evolving?
What is driving and restraining the hydrogen fuel cell market?
How will each hydrogen fuel cell submarket segment grow over the forecast period and how much revenue will these submarkets account for in 2034?
How will the market shares for each hydrogen fuel cell submarket develop from 2024 to 2034?
What will be the main driver for the overall market from 2024 to 2034?
Will leading hydrogen fuel cell markets broadly follow the macroeconomic dynamics, or will individual national markets outperform others?
How will the market shares of the national markets change by 2034 and which geographical region will lead the market in 2034?
Who are the leading players and what are their prospects over the forecast period?
What are the hydrogen fuel cell projects for these leading companies?
How will the industry evolve during the period between 2024 and 2034? What are the implications of hydrogen fuel cell projects taking place now and over the next 10 years?
Is there a greater need for product commercialisation to further scale the hydrogen fuel cell market?
Where is the hydrogen fuel cell market heading and how can you ensure you are at the forefront of the market?
What are the best investment options for new product and service lines?
What are the key prospects for moving companies into a new growth path and C-suite?
You need to discover how this will impact the hydrogen fuel cell market today, and over the next 10 years:
Our 394-page report provides 115 tables and 184 charts/graphs exclusively to you.
The report highlights key lucrative areas in the industry so you can target them - NOW.
It contains in-depth analysis of global, regional and national sales and growth.
It highlights for you the key successful trends, changes and revenue projections made by your competitors.
This report tells you TODAY how the hydrogen fuel cell market will develop in the next 10 years, and in line with the variations in COVID-19 economic recession and bounce. This market is more critical now than at any point over the last 10 years.
Forecasts to 2034 and other analyses reveal commercial prospects
In addition to revenue forecasting to 2034, our new study provides you with recent results, growth rates, and market shares.
You will find original analyses, with business outlooks and developments.
Discover qualitative analyses (including market dynamics, drivers, opportunities, restraints and challenges), cost structure, impact of rising hydrogen fuel cell prices and recent developments.
This report includes data analysis and invaluable insight into how COVID-19 will affect the industry and your company. Four COVID-19 recovery patterns and their impact, namely, "V", "L", "W" and "U" are discussed in this report.
Segments Covered in the Report
Market Segment by Application
Stationary Power Generation
Transportation
Portable Devices
Other Applications
Market Segment by Type
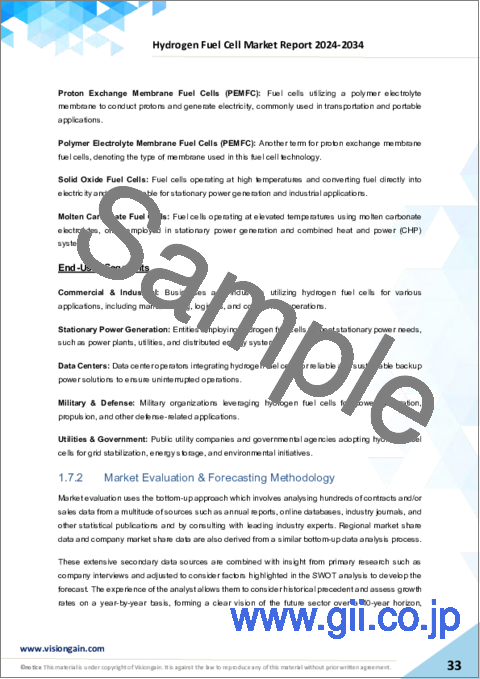
Proton Exchange Membrane Fuel Cells
Polymer Electrolyte Membrane Fuel Cells (PEMFC)
Solid Oxide Fuel Cells
Molten Carbonate Fuel Cells
Other Types
Market Segment by End-User
Commercial & Industrial
Transport Industry
Data Centres
Military & Defence
Utilities & Government
Other End-Users
In addition to the revenue predictions for the overall world market and segments, you will also find revenue forecasts for four regional and 20 leading national markets:
North America
U.S.
Canada
Europe
Germany
UK
France
Norway
Denmark
Rest of Europe
Asia Pacific
China
Japan
India
Australia
South Korea
Rest of Asia Pacific
Latin America
Brazil
Mexico
Rest of Latin America
Middle East & Africa
GCC
South Africa
Rest of Middle East & Africa
The report also includes profiles and for some of the leading companies in the Hydrogen Fuel Cell Market, 2024 to 2034, with a focus on this segment of these companies' operations.
Leading companies profiled in the report
Air Liquide S.A.
Aisin Corporation
Ballard Power Systems Inc.
Bloom Energy
Cummins Inc.
Fuel Cell Energy, Inc.
Hyundai Motor Company
ITM Power plc
Mitsubishi Heavy Industries, Ltd
Nel ASA
Nikola Corporation
Panasonic Holdings Corporation
Plug Power Inc.
Toshiba Energy Systems & Solutions Corporation
Toyota Motor Corporation
Overall world revenue for Hydrogen Fuel Cell Market, 2024 to 2034 in terms of value the market will surpass US$2,338.5 million in 2024, our work calculates. We predict strong revenue growth through to 2034. Our work identifies which organizations hold the greatest potential. Discover their capabilities, progress, and commercial prospects, helping you stay ahead.
How will the Hydrogen Fuel Cell Market, 2024 to 2034 report help you?
In summary, our 390+ page report provides you with the following knowledge:
Revenue forecasts to 2034 for Hydrogen Fuel Cell Market, 2024 to 2034 Market, with forecasts for application, type, and end-user, each forecast at a global and regional level - discover the industry's prospects, finding the most lucrative places for investments and revenues.
Revenue forecasts to 2034 for four regional and 20 key national markets - See forecasts for the Hydrogen Fuel Cell Market, 2024 to 2034 market in North America, Europe, Asia-Pacific, Latin America and Middle East & Africa. Also forecasted is the market in the US, Canada, Brazil, Germany, France, UK, Norway, Denmark, China, India, Japan, and Australia among other prominent economies.
Prospects for established firms and those seeking to enter the market - including company profiles for 15 of the major companies involved in the Hydrogen Fuel Cell Market, 2024 to 2034.
Find quantitative and qualitative analyses with independent predictions. Receive information that only our report contains, staying informed with invaluable business intelligence.
Information found nowhere else
With our new report, you are less likely to fall behind in knowledge or miss out on opportunities. See how our work could benefit your research, analyses, and decisions. Visiongain's study is for everybody needing commercial analyses for the Hydrogen Fuel Cell Market, 2024 to 2034, market-leading companies. You will find data, trends and predictions.
Table of Contents
1 Report Overview
- 1.1 Objectives of the Study
- 1.2 Introduction to Hydrogen Fuel Cell Market
- 1.3 What This Report Delivers
- 1.4 Why You Should Read This Report
- 1.5 Key Questions Answered by This Analytical Report
- 1.6 Who Is This Report for?
- 1.7 Methodology
- 1.7.1 Market Definitions
- 1.7.2 Market Evaluation & Forecasting Methodology
- 1.7.3 Data Validation
- 1.7.3.1 Primary Research
- 1.7.3.2 Secondary Research
- 1.8 Frequently Asked Questions (FAQs)
- 1.9 Associated Visiongain Reports
- 1.10 About Visiongain
2 Executive Summary
3 Market Overview
- 3.1 Key Findings
- 3.2 Market Dynamics
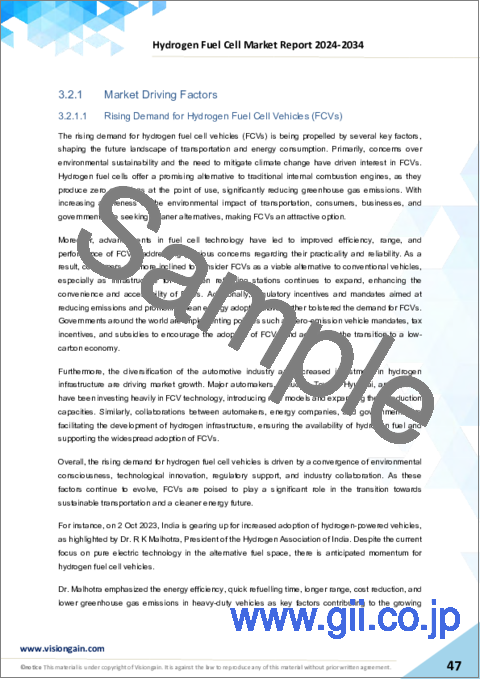
- 3.2.1 Market Driving Factors
- 3.2.1.1 Rising Demand for Hydrogen Fuel Cell Vehicles (FCVs)
- 3.2.1.2 Rising Investment in Hydrogen Fuel Cell Vehicle Driving the Market Growth
- 3.2.1.3 Global Efforts to Reduce Greenhouse Gas Emissions Driving the Market Growth
- 3.2.2 Market Restraining Factors
- 3.2.2.1 High Preference for Battery Electric Vehicles Over Hydrogen Vehicle Restrain Market Growth
- 3.2.2.2 High Cost of Platinum Catalyst for Fuel Cells Hinder the Market Growth
- 3.2.2.3 Increasing Generation of Distributed Power Using Low-Carbon Fuels
- 3.2.3 Market Opportunities
- 3.2.3.1 Expansion of Market on International Level Opportunities for the Market Players
- 3.2.3.2 Government Initiatives and Policies Opportunities for the Market Growth
- 3.2.3.3 Collaboration and Partnership Between Market Players
- 3.2.1 Market Driving Factors
- 3.3 Porter's Five Forces Analysis
- 3.3.1 Bargaining Power of Suppliers (Medium to High)
- 3.3.2 Bargaining Power of Buyers (Low)
- 3.3.3 Competitive Rivalry (Low)
- 3.3.4 Threat from Substitutes (High)
- 3.3.5 Threat of New Entrants (Low)
- 3.4 COVID-19 Impact Analysis
- 3.4.1 "V-Shaped Recovery"
- 3.4.2 "U-Shaped Recovery"
- 3.4.3 "W-Shaped Recovery"
- 3.4.4 "L-Shaped Recovery"
- 3.5 PEST Analysis
4 Hydrogen Fuel Cell Market Analysis by Application
- 4.1 Key Findings
- 4.2 Application Segment: Market Attractiveness Index
- 4.3 Hydrogen Fuel Cell Market Size Estimation and Forecast by Application
- 4.4 Stationary Power Generation
- 4.4.1 Market Size by Region, 2024-2034 (US$ Million)
- 4.4.2 Market Share by Region, 2024 & 2034 (%)
- 4.5 Transportation
- 4.5.1 Market Size by Region, 2024-2034 (US$ Million)
- 4.5.2 Market Share by Region, 2024 & 2034 (%)
- 4.6 Portable Devices
- 4.6.1 Market Size by Region, 2024-2034 (US$ Million)
- 4.6.2 Market Share by Region, 2024 & 2034 (%)
- 4.7 Others
- 4.7.1 Market Size by Region, 2024-2034 (US$ Million)
- 4.7.2 Market Share by Region, 2024 & 2034 (%)
5 Hydrogen Fuel Cell Market Analysis by Type
- 5.1 Key Findings
- 5.2 Type Segment: Market Attractiveness Index
- 5.3 Hydrogen Fuel Cell Market Size Estimation and Forecast by Type
- 5.4 Proton Exchange Membrane Fuel Cells
- 5.4.1 Market Size by Region, 2024-2034 (US$ Million)
- 5.4.2 Market Share by Region, 2024 & 2034 (%)
- 5.5 Polymer Electrolyte Membrane Fuel Cells (PEMFC)
- 5.5.1 Market Size by Region, 2024-2034 (US$ Million)
- 5.5.2 Market Share by Region, 2024 & 2034 (%)
- 5.6 Solid Oxide Fuel Cells
- 5.6.1 Market Size by Region, 2024-2034 (US$ Million)
- 5.6.2 Market Share by Region, 2024 & 2034 (%)
- 5.7 Molten Carbonate Fuel Cells
- 5.7.1 Market Size by Region, 2024-2034 (US$ Million)
- 5.7.2 Market Share by Region, 2024 & 2034 (%)
- 5.8 Others Types
- 5.8.1 Market Size by Region, 2024-2034 (US$ Million)
- 5.8.2 Market Share by Region, 2024 & 2034 (%)
6 Hydrogen Fuel Cell Market Analysis by End-User
- 6.1 Key Findings
- 6.2 End-User Segment: Market Attractiveness Index
- 6.3 Hydrogen Fuel Cell Market Size Estimation and Forecast by End-User
- 6.4 Commercial & Industrial
- 6.4.1 Market Size by Region, 2024-2034 (US$ Million)
- 6.4.2 Market Share by Region, 2024 & 2034 (%)
- 6.5 Transport Industry
- 6.5.1 Market Size by Region, 2024-2034 (US$ Million)
- 6.5.2 Market Share by Region, 2024 & 2034 (%)
- 6.6 Data Centers
- 6.6.1 Market Size by Region, 2024-2034 (US$ Million)
- 6.6.2 Market Share by Region, 2024 & 2034 (%)
- 6.7 Military & Defense
- 6.7.1 Market Size by Region, 2024-2034 (US$ Million)
- 6.7.2 Market Share by Region, 2024 & 2034 (%)
- 6.8 Utilities & Government
- 6.8.1 Market Size by Region, 2024-2034 (US$ Million)
- 6.8.2 Market Share by Region, 2024 & 2034 (%)
- 6.9 Other End-Users
- 6.9.1 Market Size by Region, 2024-2034 (US$ Million)
- 6.9.2 Market Share by Region, 2024 & 2034 (%)
7 Hydrogen Fuel Cell Market Analysis by Region
- 7.1 Key Findings
- 7.2 Regional Market Size Estimation and Forecast
8 North America Hydrogen Fuel Cell Market Analysis
- 8.1 Key Findings
- 8.2 North America Hydrogen Fuel Cell Market Attractiveness Index
- 8.3 North America Hydrogen Fuel Cell Market by Country, 2024, 2029 & 2034 (US$ Million)
- 8.4 North America Hydrogen Fuel Cell Market Size Estimation and Forecast
- 8.5 North America Hydrogen Fuel Cell Market Size Estimation and Forecast by Country
- 8.6 North America Hydrogen Fuel Cell Market Size Estimation and Forecast by Application
- 8.7 North America Hydrogen Fuel Cell Market Size Estimation and Forecast by Type
- 8.8 North America Hydrogen Fuel Cell Market Size Estimation and Forecast by End-User
- 8.9 U.S. Hydrogen Fuel Cell Market Analysis
- 8.10 Canada Hydrogen Fuel Cell Market Analysis
9 Europe Hydrogen Fuel Cell Market Analysis
- 9.1 Key Findings
- 9.2 Europe Hydrogen Fuel Cell Market Attractiveness Index
- 9.3 Europe Hydrogen Fuel Cell Market by Country, 2024, 2029 & 2034 (US$ Million)
- 9.4 Europe Hydrogen Fuel Cell Market Size Estimation and Forecast
- 9.5 Europe Hydrogen Fuel Cell Market Size Estimation and Forecast by Country
- 9.6 Europe Hydrogen Fuel Cell Market Size Estimation and Forecast by Application
- 9.7 Europe Hydrogen Fuel Cell Market Size Estimation and Forecast by Type
- 9.8 Europe Hydrogen Fuel Cell Market Size Estimation and Forecast by End-User
- 9.9 Germany Hydrogen Fuel Cell Market Analysis
- 9.10 UK Hydrogen Fuel Cell Market Analysis
- 9.11 France Hydrogen Fuel Cell Market Analysis
- 9.12 Norway Hydrogen Fuel Cell Market Analysis
- 9.13 Denmark Hydrogen Fuel Cell Market Analysis
- 9.14 Rest of Europe Hydrogen Fuel Cell Market Analysis
10 Asia-Pacific Hydrogen Fuel Cell Market Analysis
- 10.1 Key Findings
- 10.2 Asia-Pacific Hydrogen Fuel Cell Market Attractiveness Index
- 10.3 Asia-Pacific Hydrogen Fuel Cell Market by Country, 2024, 2029 & 2034 (US$ Million)
- 10.4 Asia-Pacific Hydrogen Fuel Cell Market Size Estimation and Forecast
- 10.5 Asia-Pacific Hydrogen Fuel Cell Market Size Estimation and Forecast by Country
- 10.6 Asia-Pacific Hydrogen Fuel Cell Market Size Estimation and Forecast by Application
- 10.7 Asia-Pacific Hydrogen Fuel Cell Market Size Estimation and Forecast by Type
- 10.8 Asia-Pacific Hydrogen Fuel Cell Market Size Estimation and Forecast by End-User
- 10.9 China Hydrogen Fuel Cell Market Analysis
- 10.10 India Hydrogen Fuel Cell Market Analysis
- 10.11 Japan Hydrogen Fuel Cell Market Analysis
- 10.12 South Korea Hydrogen Fuel Cell Market Analysis
- 10.13 Australia Hydrogen Fuel Cell Market Analysis
- 10.14 Rest of Asia-Pacific Hydrogen Fuel Cell Market Analysis
11 Middle East and Africa Hydrogen Fuel Cell Market Analysis
- 11.1 Key Findings
- 11.2 Middle East and Africa Hydrogen Fuel Cell Market Attractiveness Index
- 11.3 Middle East and Africa Hydrogen Fuel Cell Market by Country, 2024, 2029 & 2034 (US$ Million)
- 11.4 Middle East and Africa Hydrogen Fuel Cell Market Size Estimation and Forecast
- 11.5 Middle East and Africa Hydrogen Fuel Cell Market Size Estimation and Forecast by Country
- 11.6 Middle East and Africa Hydrogen Fuel Cell Market Size Estimation and Forecast by Application
- 11.7 Middle East and Africa Hydrogen Fuel Cell Market Size Estimation and Forecast by Type
- 11.8 Middle East and Africa Hydrogen Fuel Cell Market Size Estimation and Forecast by End-User
- 11.9 GCC Hydrogen Fuel Cell Market Analysis
- 11.10 South Africa Hydrogen Fuel Cell Market Analysis
- 11.11 Rest of Middle East & Africa Hydrogen Fuel Cell Market Analysis
12 Latin America Hydrogen Fuel Cell Market Analysis
- 12.1 Key Findings
- 12.2 Latin America Hydrogen Fuel Cell Market Attractiveness Index
- 12.3 Latin America Hydrogen Fuel Cell Market by Country, 2024, 2029 & 2034 (US$ Million)
- 12.4 Latin America Hydrogen Fuel Cell Market Size Estimation and Forecast
- 12.5 Latin America Hydrogen Fuel Cell Market Size Estimation and Forecast by Country
- 12.6 Latin America Hydrogen Fuel Cell Market Size Estimation and Forecast by Application
- 12.7 Latin America Hydrogen Fuel Cell Market Size Estimation and Forecast by Type
- 12.8 Latin America Hydrogen Fuel Cell Market Size Estimation and Forecast by End-User
- 12.9 Brazil Hydrogen Fuel Cell Market Analysis
- 12.10 Mexico Hydrogen Fuel Cell Market Analysis
- 12.11 Rest of Latin America Hydrogen Fuel Cell Market Analysis
13 Company Profiles
- 13.1 Competitive Landscape, 2023
- 13.2 Strategic Outlook
- 13.3 Ballard Power Systems Inc
- 13.3.1 Company Snapshot
- 13.3.2 Company Overview
- 13.3.3 Financial Analysis
- 13.3.3.1 Net Revenue, 2019-2023
- 13.3.3.2 R&D, 2019-2023
- 13.3.3.3 Regional Revenue Share, 2023 (%)
- 13.3.4 Product Benchmarking
- 13.3.5 Strategic Outlook
- 13.4 Toyota Motor Corporation
- 13.4.1 Company Snapshot
- 13.4.2 Company Overview
- 13.4.3 Financial Analysis
- 13.4.3.1 Net Revenue, 2019-2023
- 13.4.3.2 R&D, 2019-2023
- 13.4.3.3 Regional Revenue Share, 2023 (%)
- 13.4.3.4 Business Segment Revenue Share, 2023 (%)
- 13.4.4 Product Benchmarking
- 13.4.5 Strategic Outlook
- 13.5 Plug Power Inc.
- 13.5.1 Company Snapshot
- 13.5.2 Company Overview
- 13.5.3 Financial Analysis
- 13.5.3.1 Net Revenue, 2019-2023
- 13.5.3.2 R&D, 2019-2023
- 13.5.3.3 Regional Revenue Share, 2023 (%)
- 13.5.4 Product Benchmarking
- 13.5.5 Strategic Outlook
- 13.6 Air Liquide S.A.
- 13.6.1 Company Snapshot
- 13.6.2 Company Overview
- 13.6.3 Financial Analysis
- 13.6.3.1 Net Revenue, 2019-2023
- 13.6.3.2 R&D, 2019-2023
- 13.6.3.3 Regional Revenue Share, 2023 (%)
- 13.6.3.4 Business Segment Revenue Share, 2023 (%)
- 13.6.4 Product Benchmarking
- 13.6.5 Strategic Outlook
- 13.7 Nikola Corporation
- 13.7.1 Company Snapshot
- 13.7.2 Company Overview
- 13.7.3 Financial Analysis
- 13.7.3.1 Net Revenue, 2019-2023
- 13.7.3.2 R&D, 2019-2023
- 13.7.4 Product Benchmarking
- 13.7.5 Strategic Outlook
- 13.8 Hyundai Motor Company
- 13.8.1 Company Snapshot
- 13.8.2 Company Overview
- 13.8.3 Financial Analysis
- 13.8.3.1 Net Revenue, 2019-2023
- 13.8.3.2 R&D, 2019-2023
- 13.8.3.3 Regional Revenue Share, 2023 (%)
- 13.8.3.4 Business Segment Revenue Share, 2023 (%)
- 13.8.4 Product Benchmarking
- 13.8.5 Strategic Outlook
- 13.9 Mitsubishi Heavy Industries, Ltd
- 13.9.1 Company Snapshot
- 13.9.2 Company Overview
- 13.9.3 Financial Analysis
- 13.9.3.1 Net Revenue, 2019-2023
- 13.9.3.2 R&D, 2019-2023
- 13.9.3.3 Regional Revenue Share, 2023 (%)
- 13.9.3.4 Business Segment Revenue Share, 2023 (%)
- 13.9.4 Product Benchmarking
- 13.10 Nel ASA
- 13.10.1 Company Snapshot
- 13.10.2 Company Overview
- 13.10.3 Financial Analysis
- 13.10.3.1 Net Revenue, 2019-2023
- 13.10.3.2 R&D, 2019-2023
- 13.10.3.3 Regional Revenue Share, 2023 (%)
- 13.10.3.4 Business Segment Revenue Share, 2023 (%)
- 13.10.4 Product Benchmarking
- 13.10.5 Strategic Outlook
- 13.11 Cummins Inc.
- 13.11.1 Company Snapshot
- 13.11.2 Company Overview
- 13.11.3 Financial Analysis
- 13.11.3.1 Net Revenue, 2019-2023
- 13.11.3.2 R&D, 2019-2023
- 13.11.4 Product Benchmarking
- 13.11.5 Strategic Outlook
- 13.12 Toshiba Energy Systems & Solutions Corporation
- 13.12.1 Company Snapshot
- 13.12.2 Company Overview
- 13.12.3 Financial Analysis
- 13.12.3.1 Net Revenue, 2019-2023
- 13.12.3.2 R&D, 2019-2023
- 13.12.3.3 Regional Revenue Share, 2023 (%)
- 13.12.3.4 Business Segment Revenue Share, 2023 (%)
- 13.12.4 Product Benchmarking
- 13.12.5 Strategic Outlook
- 13.13 Aisin Corporation
- 13.13.1 Company Snapshot
- 13.13.2 Company Overview
- 13.13.3 Financial Analysis
- 13.13.3.1 Net Revenue, 2019-2023
- 13.13.3.2 R&D, 2019-2023
- 13.13.4 Product Benchmarking
- 13.13.5 Strategic Outlook
- 13.14 ITM Power plc
- 13.14.1 Company Snapshot
- 13.14.2 Company Overview
- 13.14.3 Financial Analysis
- 13.14.3.1 Net Revenue, 2019-2023
- 13.14.3.2 R&D, 2019-2023
- 13.14.3.3 Regional Revenue Share, 2023 (%)
- 13.14.3.4 Business Segment Revenue Share, 2023 (%)
- 13.14.4 Product Benchmarking
- 13.14.5 Strategic Outlook
- 13.15 Panasonic Holdings Corporation
- 13.15.1 Company Snapshot
- 13.15.2 Company Overview
- 13.15.3 Financial Analysis
- 13.15.3.1 Net Revenue, 2019-2023
- 13.15.3.2 R&D, 2019-2023
- 13.15.3.3 Regional Revenue Share, 2023 (%)
- 13.15.3.4 Business Segment Revenue Share, 2023 (%)
- 13.15.4 Product Benchmarking
- 13.15.5 Strategic Outlook
- 13.16 Bloom Energy
- 13.16.1 Company Snapshot
- 13.16.2 Company Overview
- 13.16.3 Financial Analysis
- 13.16.3.1 Net Revenue, 2019-2023
- 13.16.3.2 R&D, 2019-2023
- 13.16.3.3 Business Segment Revenue Share, 2023 (%)
- 13.16.4 Product Benchmarking
- 13.16.5 Strategic Outlook
- 13.17 Fuel Cell Energy, Inc.
- 13.17.1 Company Snapshot
- 13.17.2 Company Overview
- 13.17.3 Financial Analysis
- 13.17.3.1 Net Revenue, 2019-2023
- 13.17.3.2 R&D, 2019-2023
- 13.17.3.3 Regional Revenue Share, 2023 (%)
- 13.17.4 Product Benchmarking
- 13.17.5 Strategic Outlook
14 Conclusion and Recommendations
- 14.1 Concluding Remarks from Visiongain
- 14.2 Recommendations for Market Players