|
|
市場調査レポート
商品コード
1473647
グリーンセメント市場:2024-2034年Green Cement Market Report 2024-2034 |
||||||
|
|
|||||||
|
● お客様のご希望に応じて、既存データの加工や未掲載情報(例:国別セグメント)の追加などの対応が可能です。 詳細はお問い合わせください。 |
|||||||

| グリーンセメント市場:2024-2034年 |
|
出版日: 2024年05月01日
発行: Visiongain Reports Ltd.
ページ情報: 英文 254 Pages
納期: 即日から翌営業日
|
- 全表示
- 概要
- 図表
- 目次
世界のグリーンセメントの市場規模は、2034年にかけてCAGR 7.7%で成長すると予測されています。
連邦政府によるプログラムと補助金がグリーンセメントの消費を促進:
世界中の政府が環境に優しい建設資材の使用を奨励するためにさまざまな施策を打ち出しています。英国では、政府がGreen Construction BoardやClean Growth Strategyなどのプログラムを設立し、グリーンセメントなどの持続可能な建設資材を使用するプロジェクトに財政的な優遇措置や支援を行っています。
インド政府は、National Mission for Enhanced Energy Efficiency やGreen Highways Policyなどのイニシアチブを実施し、グリーンセメントを含むインフラ建設におけるグリーン技術の使用を奨励しています。補助金や税制優遇措置は、建築部門がより持続可能な方法を採用することを奨励するために提供されています。
UAEも、UAE Vision 2021やDubai Clean Energy Strategy 2050などのプロジェクトで、持続可能性へのコミットメントを示しています。政府が資金を提供するプロジェクトでは、持続可能な建設資材の使用を促進しており、デベロッパーはグリーンセメントをプロジェクトに取り入れるための補助金やインセンティブを提供しています。
2022年、バンクーバーとトロントは、2030年までにすべての新築ビルで温室効果ガス排出量をネットゼロにする目標を設定し、モントリオールは2025年までにネットゼロを達成しなければなりません。また、ほとんどの建築物に使用される主要材料であるコンクリートの、より環境に優しい製造方法を発見するための取り組みも進行中です。ハリファックスを拠点とするCarbonCure Technologiesが開発したコンクリートミックスにリサイクルCO2を組み入れる斬新なソリューションもそのひとつです。
米国では、デンバー、ボストン、ニューヨーク市を含む3つの管轄区域が、二酸化炭素削減目標を達成できなかった物件に金銭的ペナルティを課すことになっています。例えば、デンバーのEnergize Denverコードでは、25,000平方フィート以上の建物は2030年までにEUIの最終目標を達成しなければならないと定めています。Building Emissions Reduction and Disclosure Ordinance (BERDO) は、ボストンが制定した重要な環境プログラムです。同市は、2050年までに炭素排出量をネットゼロまで着実に削減することを目指しています。ニューヨーク市のLocal Law 97 (LL97) は、ボストンと同様に罰金を課しますが、少しひねりが加えられています。2024年から、25,000平方フィート以上のすべての商業施設はLL97に準拠することが義務付けられます。市の目的は、温室効果ガスの排出を最小限に抑えることです。
当レポートでは、世界のグリーンセメントの市場を調査し、市場概要、市場成長への影響因子および市場機会の分析、市場規模の推移・予測、各種区分・地域別の詳細分析、競合情勢、主要企業のプロファイルなどをまとめています。
目次
第1章 レポートの概要
第2章 エグゼクティブサマリー
第3章 市場概要
- 主な調査結果
- 市場力学
- 市場推進要因
- 市場機会
- 市場課題
- 市場抑制要因
- SWOT分析
- ポーターのファイブフォース分析
- PEST分析
- COVID-19の影響分析
第4章 グリーンセメント市場の分析:タイプ別
- 主要調査結果
- 市場魅力度指数
- 市場規模の推移・予測
- フライアッシュ
- スラグ
- リサイクル骨材
- その他
- 市場規模の推移・予測:地域別
- 市場シェア:地域別
第5章 グリーンセメント市場の分析:用途別
- 主要調査結果
- 市場魅力度指数
- 市場規模の推移・予測
- 住宅
- 商業
- 産業
- 市場規模の推移・予測:地域別
- 市場シェア:地域別
第6章 グリーンセメント市場の分析:地域別
- 主要調査結果
- 市場規模の推移・予測
第7章 北米のグリーンセメント市場の分析
第8章 欧州のグリーンセメント市場の分析
第9章 アジア太平洋のグリーンセメント市場の分析
第10章 ラテンアメリカのグリーンセメント市場の分析
第11章 中東・アフリカのグリーンセメント市場の分析
第12章 企業プロファイル
- 競合情勢
- 戦略的展望
- UltraTech Cement Limited
- CEMEX S.A.B. de C.V.
- Heidelberg Materials AG
- JSW Cement
- Holcim Ltd.
- ACC Limited
- Anhui Conch Cement
- CRH plc
- Green Cement Inc.
- CarbonCure Technologies Inc.
第13章 総論・提言
- Visiongainからの総論
- 参入企業への推奨事項
List of Tables
- Table 1 Green Cement Market Snapshot, 2024 & 2034 (US$ Billion, CAGR %)
- Table 2 Green Cement Market Forecast by Region, 2024-2034 (US$ Billion, AGR%, CAGR%): "V" Shaped Recovery
- Table 3 Green Cement Market Forecast by Region, 2024-2034 (US$ Billion, AGR%, CAGR%): "U" Shaped Recovery
- Table 4 Green Cement Market Forecast by Region, 2024-2034 (US$ Billion, AGR%, CAGR%): "W" Shaped Recovery
- Table 5 Green Cement Market Forecast by Region, 2024-2034 (US$ Billion, AGR%, CAGR%): "L" Shaped Recovery
- Table 6 Green Cement Market Forecast by Type, 2024-2034 (US$ Billion, AGR%, CAGR %)
- Table 7 Fly Ash Segment Market Forecast by Region, 2024-2034 (US$ Billion, AGR%, CAGR %)
- Table 8 Slag Segment Market Forecast by Region, 2024-2034 (US$ Billion, AGR%, CAGR %)
- Table 9 Recycled Aggregate Market Forecast by Region, 2024-2034 (US$ Billion, AGR%, CAGR %)
- Table 10 Others Segment Market Forecast by Region, 2024-2034 (US$ Billion, AGR%, CAGR %)
- Table 11 Green Cement Market Forecast by Application, 2024-2034 (US$ Billion, AGR%, CAGR %)
- Table 12 Residential Segment Market Forecast by Region, 2024-2034 (US$ Billion, AGR%, CAGR %)
- Table 13 Commercial Segment Market Forecast by Region, 2024-2034 (US$ Billion, AGR%, CAGR %)
- Table 14 Industrial Segment Market Forecast by Region, 2024-2034 (US$ Billion, AGR%, CAGR %)
- Table 15 Green Cement Market Forecast by Region, 2024-2034 (US$ Billion, AGR%, CAGR %)
- Table 16 North America Green Cement Market Forecast by Country, 2024-2034 (US$ Billion, AGR%, CAGR %)
- Table 17 North America Green Cement Market Forecast by Type, 2024-2034 (US$ Billion, AGR%, CAGR %)
- Table 18 North America Green Cement Market Forecast by Application, 2024-2034 (US$ Billion, AGR%, CAGR %)
- Table 19 U.S. Green Cement Market Forecast, 2024-2034 (US$ Billion, AGR%, CAGR %)
- Table 20 Canada Green Cement Market Forecast, 2024-2034 (US$ Billion, AGR%, CAGR %)
- Table 21 Europe Green Cement Market Forecast by Country, 2024-2034 (US$ Billion, AGR%, CAGR %)
- Table 22 Europe Green Cement Market Forecast by Type, 2024-2034 (US$ Billion, AGR%, CAGR %)
- Table 23 Europe Green Cement Market Forecast by Application, 2024-2034 (US$ Billion, AGR%, CAGR %)
- Table 24 Turkey Green Cement Market Forecast, 2024-2034 (US$ Billion, AGR%, CAGR %)
- Table 25 Russia Green Cement Market Forecast, 2024-2034 (US$ Billion, AGR%, CAGR %)
- Table 26 Germany Green Cement Market Forecast, 2024-2034 (US$ Billion, AGR%, CAGR %)
- Table 27 Italy Green Cement Market Forecast, 2024-2034 (US$ Billion, AGR%, CAGR %)
- Table 28 France Green Cement Market Forecast, 2024-2034 (US$ Billion, AGR%, CAGR %)
- Table 29 UK Green Cement Market Forecast, 2024-2034 (US$ Billion, AGR%, CAGR %)
- Table 30 Rest of Europe Green Cement Market Forecast, 2024-2034 (US$ Billion, AGR%, CAGR %)
- Table 31 Asia Pacific Green Cement Market Forecast by Country, 2024-2034 (US$ Billion, AGR%, CAGR %)
- Table 32 Asia Pacific Green Cement Market Forecast by Type, 2024-2034 (US$ Billion, AGR%, CAGR %)
- Table 33 Asia Pacific Green Cement Market Forecast by Application, 2024-2034 (US$ Billion, AGR%, CAGR %)
- Table 34 Japan Green Cement Market Forecast, 2024-2034 (US$ Billion, AGR%, CAGR %)
- Table 35 China Green Cement Market Forecast, 2024-2034 (US$ Billion, AGR%, CAGR %)
- Table 36 India Green Cement Market Forecast, 2024-2034 (US$ Billion, AGR%, CAGR %)
- Table 37 Vietnam Green Cement Market Forecast, 2024-2034 (US$ Billion, AGR%, CAGR %)
- Table 38 South Korea Green Cement Market Forecast, 2024-2034 (US$ Billion, AGR%, CAGR %)
- Table 39 Indonesia Green Cement Market Forecast, 2024-2034 (US$ Billion, AGR%, CAGR %)
- Table 40 Rest of Asia Pacific Green Cement Market Forecast, 2024-2034 (US$ Billion, AGR%, CAGR %)
- Table 41 Latin America Green Cement Market Forecast by Country, 2024-2034 (US$ Billion, AGR%, CAGR %)
- Table 42 Latin America Green Cement Market Forecast by Type, 2024-2034 (US$ Billion, AGR%, CAGR %)
- Table 43 Latin America Green Cement Market Forecast by Application, 2024-2034 (US$ Billion, AGR%, CAGR %)
- Table 44 Brazil Green Cement Market Forecast, 2024-2034 (US$ Billion, AGR%, CAGR %)
- Table 45 Mexico Green Cement Market Forecast, 2024-2034 (US$ Billion, AGR%, CAGR %)
- Table 46 Argentina Green Cement Market Forecast, 2024-2034 (US$ Billion, AGR%, CAGR %)
- Table 47 Colombia Green Cement Market Forecast, 2024-2034 (US$ Billion, AGR%, CAGR %)
- Table 48 Rest of Latin America Green Cement Market Forecast, 2024-2034 (US$ Billion, AGR%, CAGR %)
- Table 49 Middle East & Africa Green Cement Market Forecast by Country, 2024-2034 (US$ Billion, AGR%, CAGR %)
- Table 50 Middle East & Africa Green Cement Market Forecast by Type, 2024-2034 (US$ Billion, AGR%, CAGR %)
- Table 51 Middle East & Africa Green Cement Market Forecast by Application, 2024-2034 (US$ Billion, AGR%, CAGR %)
- Table 52 GCC Green Cement Market Forecast, 2024-2034 (US$ Billion, AGR%, CAGR %)
- Table 53 South Africa Green Cement Market Forecast, 2024-2034 (US$ Billion, AGR%, CAGR %)
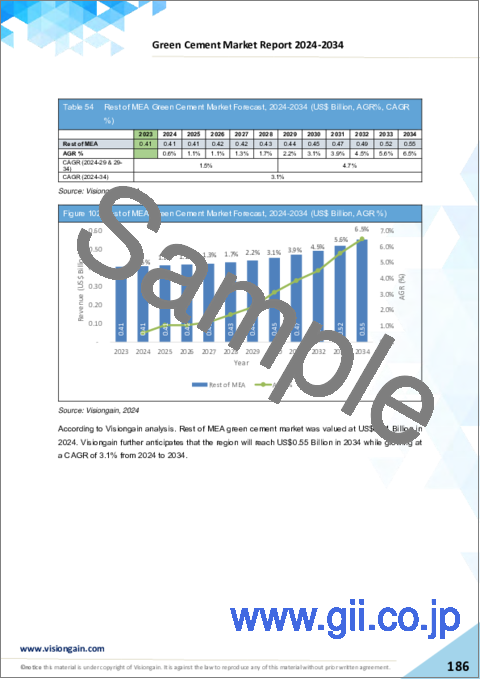
- Table 54 Rest of MEA Green Cement Market Forecast, 2024-2034 (US$ Billion, AGR%, CAGR %)
- Table 55 Strategic Outlook
- Table 56 UltraTech Cement Limited: Key Details, (CEO, HQ, Revenue, Founded, No. of Employees, Company Type, Website, Business Segment)
- Table 57 UltraTech Cement Limited: Product Benchmarking
- Table 58 UltraTech Cement Limited: Strategic Outlook
- Table 59 CEMEX S.A.B. de C.V.: Key Details, (CEO, HQ, Revenue, Founded, No. of Employees, Company Type, Website, Business Segment)
- Table 60 CEMEX S.A.B. de C.V.: Product Benchmarking
- Table 61 CEMEX S.A.B. de C.V.: Strategic Outlook
- Table 62 Heidelberg Materials AG: Key Details, (CEO, HQ, Revenue, Founded, No. of Employees, Company Type, Website, Business Segment)
- Table 63 Heidelberg Materials AG: Product Benchmarking
- Table 64 Heidelberg Materials AG: Strategic Outlook
- Table 65 JSW Cement: Key Details, (CEO, HQ, Revenue, Founded, No. of Employees, Company Type, Website, Business Segment)
- Table 66 JSW Cement: Product Benchmarking
- Table 67 JSW Cement: Strategic Outlook
- Table 68 Holcim Ltd.: Key Details, (CEO, HQ, Revenue, Founded, No. of Employees, Company Type, Website, Business Segment)
- Table 69 Holcim Ltd.: Product Benchmarking
- Table 70 Holcim Ltd.: Strategic Outlook
- Table 71 ACC Limited: Key Details, (CEO, HQ, Revenue, Founded, No. of Employees, Company Type, Website, Business Segment)
- Table 72 ACC Limited: Product Benchmarking
- Table 73 ACC Limited: Strategic Outlook
- Table 74 Anhui Conch Cement: Key Details, (CEO, HQ, Revenue, Founded, No. of Employees, Company Type, Website, Business Segment)
- Table 75 Anhui Conch Cement: Product Benchmarking
- Table 76 Anhui Conch Cement: Strategic Outlook
- Table 77 CRH plc: Key Details, (CEO, HQ, Revenue, Founded, No. of Employees, Company Type, Website, Business Segment)
- Table 78 CRH plc: Product Benchmarking
- Table 79 CRH plc: Strategic Outlook
- Table 80 Green Cement Inc.: Key Details, (CEO, HQ, Revenue, Founded, No. of Employees, Company Type, Website, Business Segment)
- Table 81 Green Cement Inc.: Product Benchmarking
- Table 82 Green Cement Inc.: Strategic Outlook
- Table 83 CarbonCure Technologies Inc.: Key Details, (CEO, HQ, Revenue, Founded, No. of Employees, Company Type, Website, Business Segment)
- Table 84 CarbonCure Technologies Inc.: Product Benchmarking
- Table 85 CarbonCure Technologies Inc.: Strategic Outlook
List of Figures
- Figure 1 Green Cement Market Segmentation
- Figure 2 Green Cement Market by Type: Market Attractiveness Index
- Figure 3 Green Cement Market by Application: Market Attractiveness Index
- Figure 4 Green Cement Market by Region: Market Attractiveness Index
- Figure 5 Green Cement Market: Market Dynamics
- Figure 6 Global Top Construction Market for the Next 10 Years (%)
- Figure 7 Global CO2 emission by category, 2022 (%)
- Figure 8 Country breakdown of global carbon emission, 2023 (%)
- Figure 9 SWOT Analysis
- Figure 10 Green Cement Market: Porter's Five Forces Analysis
- Figure 11 Green Cement Market: PEST Analysis
- Figure 12 Green Cement Market by Region, 2024-2034 (US$ Billion, AGR %): "V" Shaped Recovery
- Figure 13 Green Cement Market by Region, 2024-2034 (US$ Billion, AGR %): "U" Shaped Recovery
- Figure 14 Green Cement Market by Region, 2024-2034 (US$ Billion, AGR %): "W" Shaped Recovery
- Figure 15 Green Cement Market by Region, 2024-2034 (US$ Billion, AGR %): "L" Shaped Recovery
- Figure 16 Green Cement Market by Type: Market Attractiveness Index
- Figure 17 Green Cement Market Forecast by Type, 2024-2034 (US$ Billion, AGR %)
- Figure 18 Green Cement Market Share Forecast by Type, 2024, 2029, 2034 (%)
- Figure 19 Fly Ash Segment Market Forecast by Region, 2024-2034 (US$ Billion, AGR %)
- Figure 20 Fly Ash Segment Market Share Forecast by Region, 2024 & 2034 (%)
- Figure 21 Slag Segment Market Forecast by Region, 2024-2034 (US$ Billion, AGR %)
- Figure 22 Slag Segment Market Share Forecast by Region, 2024 & 2034 (%)
- Figure 23 Recycled Aggregate Segment Market Forecast by Region, 2024-2034 (US$ Billion, AGR %)
- Figure 24 Recycled Aggregate Segment Market Share Forecast by Region, 2024 & 2034 (%)
- Figure 25 Others Segment Market Forecast by Region, 2024-2034 (US$ Billion, AGR %)
- Figure 26 Others Segment Market Share Forecast by Region, 2024 & 2034 (%)
- Figure 27 Green Cement Market by Application: Market Attractiveness Index
- Figure 28 Green Cement Market Forecast by Application, 2024-2034 (US$ Billion, AGR %)
- Figure 29 Green Cement Market Share Forecast by Application, 2024, 2029, 2034 (%)
- Figure 30 Residential Segment Market Forecast by Region, 2024-2034 (US$ Billion, AGR %)
- Figure 31 Residential Segment Market Share Forecast by Region, 2024 & 2034 (%)
- Figure 32 Commercial Segment Market Forecast by Region, 2024-2034 (US$ Billion, AGR %)
- Figure 33 Commercial Segment Market Share Forecast by Region, 2024 & 2034 (%)
- Figure 34 Industrial Segment Market Forecast by Region, 2024-2034 (US$ Billion, AGR %)
- Figure 35 Industrial Segment Market Share Forecast by Region, 2024 & 2034 (%)
- Figure 36 Green Cement Market Forecast by Region 2024 and 2034 (Revenue, CAGR %)
- Figure 37 Green Cement Market Share Forecast by Region 2024, 2029, 2034 (%)
- Figure 38 Green Cement Market by Region, 2024-2034 (US$ Billion, AGR %)
- Figure 39 North America Green Cement Market Attractiveness Index
- Figure 40 North America Green Cement Market by Region, 2024, 2029 & 2034 (US$ Billion)
- Figure 41 North America Green Cement Market Forecast by Country, 2024-2034 (US$ Billion, AGR %)
- Figure 42 North America Green Cement Market Value Share Forecast by Country, 2024 & 2034 (%)
- Figure 43 North America Green Cement Market Forecast by Type, 2024-2034 (US$ Billion, AGR %)
- Figure 44 North America Green Cement Market Share Forecast by Type, 2024 & 2034 (%)
- Figure 45 North America Green Cement Market Forecast by Application, 2024-2034 (US$ Billion, AGR %)
- Figure 46 North America Green Cement Market Share Forecast by Application, 2024 & 2034 (%)
- Figure 47 U.S. Green Cement Market Forecast, 2024-2034 (US$ Billion, AGR %)
- Figure 48 Canada Green Cement Market Forecast, 2024-2034 (US$ Billion, AGR %)
- Figure 49 Europe Green Cement Market Attractiveness Index
- Figure 50 Europe Green Cement Market by Country, 2024, 2029 & 2034 (US$ Billion)
- Figure 51 Europe Green Cement Market Forecast by Country, 2024-2034 (US$ Billion, AGR %)
- Figure 52 Europe Green Cement Market Value Share Forecast by Country, 2024 & 2034 (%)
- Figure 53 Europe Green Cement Market Forecast by Type, 2024-2034 (US$ Billion, AGR %)
- Figure 54 Europe Green Cement Market Share Forecast by Type, 2024 & 2034 (%)
- Figure 55 Europe Green Cement Market Forecast by Application, 2024-2034 (US$ Billion, AGR %)
- Figure 56 Europe Green Cement Market Share Forecast by Application, 2024 & 2034 (%)
- Figure 57 Turkey Green Cement Market Forecast, 2024-2034 (US$ Billion, AGR %)
- Figure 58 Russia Green Cement Market Forecast, 2024-2034 (US$ Billion, AGR %)
- Figure 59 Germany Green Cement Market Forecast, 2024-2034 (US$ Billion, AGR %)
- Figure 60 Italy Green Cement Market Forecast, 2024-2034 (US$ Billion, AGR %)
- Figure 61 France Green Cement Market Forecast, 2024-2034 (US$ Billion, AGR %)
- Figure 62 UK Green Cement Market Forecast, 2024-2034 (US$ Billion, AGR %)
- Figure 63 Rest of Europe Green Cement Market Forecast, 2024-2034 (US$ Billion, AGR %)
- Figure 64 Asia Pacific Green Cement Market Attractiveness Index
- Figure 65 Asia Pacific Green Cement Market by Region, 2024, 2029 & 2034 (US$ Billion)
- Figure 66 Asia Pacific Green Cement Market Forecast by Country, 2024-2034 (US$ Billion, AGR %)
- Figure 67 Asia Pacific Green Cement Market Value Share Forecast by Country, 2024 & 2034 (%)
- Figure 68 Asia Pacific Green Cement Market Forecast by Type, 2024-2034 (US$ Billion, AGR %)
- Figure 69 Asia Pacific Green Cement Market Share Forecast by Type, 2024 & 2034 (%)
- Figure 70 Asia Pacific Green Cement Market Forecast by Application, 2024-2034 (US$ Billion, AGR %)
- Figure 71 Asia Pacific Green Cement Market Share Forecast by Application, 2024 & 2034 (%)
- Figure 72 Japan Green Cement Market Forecast, 2024-2034 (US$ Billion, AGR %)
- Figure 73 China Green Cement Market Forecast, 2024-2034 (US$ Billion, AGR %)
- Figure 74 India Green Cement Market Forecast, 2024-2034 (US$ Billion, AGR %)
- Figure 75 Vietnam Green Cement Market Forecast, 2024-2034 (US$ Billion, AGR %)
- Figure 76 South Korea Green Cement Market Forecast, 2024-2034 (US$ Billion, AGR %)
- Figure 77 Indonesia Green Cement Market Forecast, 2024-2034 (US$ Billion, AGR %)
- Figure 78 Rest of Asia Pacific Green Cement Market Forecast, 2024-2034 (US$ Billion, AGR %)
- Figure 79 Latin America Green Cement Market Attractiveness Index
- Figure 80 Latin America Green Cement Market by Region, 2024, 2029 & 2034 (US$ Billion)
- Figure 81 Latin America Green Cement Market Forecast by Country, 2024-2034 (US$ Billion, AGR %)
- Figure 82 Latin America Green Cement Market Value Share Forecast by Country, 2024 & 2034 (%)
- Figure 83 Latin America Green Cement Market Forecast by Type, 2024-2034 (US$ Billion, AGR %)
- Figure 84 Latin America Green Cement Market Share Forecast by Type, 2024 & 2034 (%)
- Figure 85 Latin America Green Cement Market Forecast by Application, 2024-2034 (US$ Billion, AGR %)
- Figure 86 Latin America Green Cement Market Share Forecast by Application, 2024 & 2034 (%)
- Figure 87 Brazil Green Cement Market Forecast, 2024-2034 (US$ Billion, AGR %)
- Figure 88 Mexico Green Cement Market Forecast, 2024-2034 (US$ Billion, AGR %)
- Figure 89 Argentina Green Cement Market Forecast, 2024-2034 (US$ Billion, AGR %)
- Figure 90 Colombia Green Cement Market Forecast, 2024-2034 (US$ Billion, AGR %)
- Figure 91 Rest of Latin America Green Cement Market Forecast, 2024-2034 (US$ Billion, AGR %)
- Figure 92 Middle East & Africa Green Cement Market Attractiveness Index
- Figure 93 Middle East & Africa Green Cement Market by Region, 2024, 2029 & 2034 (US$ Billion)
- Figure 94 Middle East & Africa Green Cement Market Forecast by Country, 2024-2034 (US$ Billion, AGR %)
- Figure 95 Middle East & Africa Green Cement Market Value Share Forecast by Country, 2024 & 2034 (%)
- Figure 96 Middle East & Africa Green Cement Market Forecast by Type, 2024-2034 (US$ Billion, AGR %)
- Figure 97 Middle East & Africa Green Cement Market Share Forecast by Type, 2024 & 2034 (%)
- Figure 98 Middle East & Africa Green Cement Market Forecast by Application, 2024-2034 (US$ Billion, AGR %)
- Figure 99 Middle East & Africa Green Cement Market Share Forecast by Application, 2024 & 2034 (%)
- Figure 100 GCC Green Cement Market Forecast, 2024-2034 (US$ Billion, AGR %)
- Figure 101 South Africa Green Cement Market Forecast, 2024-2034 (US$ Billion, AGR %)
- Figure 102 Rest of MEA Green Cement Market Forecast, 2024-2034 (US$ Billion, AGR %)
- Figure 103 Green Cement Market: Company Share, 2024 (%)
- Figure 104 UltraTech Cement Limited: Net Revenue, 2018-2023 (US$ Billion, AGR %)
- Figure 105 UltraTech Cement Limited: Gross Profit, 2018-2023 (US$ Billion, AGR%)
- Figure 106 UltraTech Cement Limited: Segment Market Volume Shares, 2023
- Figure 107 UltraTech Cement Limited: Regional Market Shares, 2023
- Figure 108 UltraTech Cement Limited: R&D, 2018-2023 (US$ Million, AGR%)
- Figure 109 CEMEX S.A.B. de C.V.: Net Revenue, 2018-2023 (US$ Billion, AGR%)
- Figure 110 CEMEX S.A.B. de C.V: Gross Profit, 2018-2023 (US$ Billion, AGR%)
- Figure 111 CEMEX S.A.B. de C.V: Segment Market Shares, 2023
- Figure 112 CEMEX S.A.B. de C.V: Regional Market Shares, 2023
- Figure 113 CEMEX S.A.B. de C.V: R&D, 2018-2023 (US$ Million, AGR%)
- Figure 114 Heidelberg Materials AG: Net Revenue, 2018-2023 (US$ Billion, AGR%)
- Figure 115 Heidelberg Materials AG: Gross Profit, 2018-2023 (US$ Billion, AGR%)
- Figure 116 Heidelberg Materials AG: Segment Market Volume Shares, 2023
- Figure 117 Heidelberg Materials AG: Regional Market Shares, 2023
- Figure 118 JSW Cement: Net Revenue, 2018-2023 (US$ Million, AGR%)
- Figure 119 JSW Cement: Segment Market Shares, 2023
- Figure 120 JSW Cement: Regional Market Shares, 2023
- Figure 121 Holcim Ltd.: Net Revenue, 2018-2023 (US$ Billion, AGR%)
- Figure 122 Holcim Ltd.: Gross Profit, 2018-2023 (US$ Billion, AGR%)
- Figure 123 Holcim Ltd: Segment Market Shares, 2023
- Figure 124 Holcim Ltd.: Regional Market Shares, 2023
- Figure 125 Holcim Ltd.: R&D, 2018-2023 (US$ Million, AGR%)
- Figure 126 ACC Limited: Net Revenue, 2018-2023 (US$ Billion, AGR%)
- Figure 127 ACC Limited: Gross Profit, 2018-2023 (US$ Million, AGR%)
- Figure 128 ACC Limited: Segment Market Shares, 2023
- Figure 129 ACC Limited: Regional Market Shares, 2023
- Figure 130 ACC Limited: R&D, 2018-2023 (US$ Million, AGR%)
- Figure 131 Anhui Conch Cement: Net Revenue, 2018-2023 (US$ Billion, AGR%)
- Figure 132 Anhui Conch Cement: Gross Profit, 2018-2023 (US$ Billion, AGR%)
- Figure 133 Anhui Conch Cement: Segment Market Shares, 2023
- Figure 134 Anhui Conch Cement: Regional Market Shares, 2022 (%)
- Figure 135 Anhui Conch Cement: R&D, 2018-2022 (US$ Million, AGR%)
- Figure 136 CRH plc: Net Revenue, 2018-2023 (US$ Billion, AGR%)
- Figure 137 CRH plc: Gross Profit, 2018-2023 (US$ Billion, AGR%)
- Figure 138 CRH plc: Segment Market Shares, 2023
- Figure 139 CRH plc: Regional Market Shares, 2023 (%)
The global Green Cement market is projected to grow at a CAGR of 7.7% by 2034
The Green Cement Market Report 2024-2034: This report will prove invaluable to leading firms striving for new revenue pockets if they wish to better understand the industry and its underlying dynamics. It will be useful for companies that would like to expand into different industries or to expand their existing operations in a new region.
Federal programs and subsidies are driving the consumption for green cement.
Federal programs and subsidies play a critical role in increasing green cement usage, with governments throughout the world launching a variety of measures to encourage the use of environmentally friendly construction materials. In the United Kingdom (UK), the government has established programs such as the Green Construction Board and the Clean Growth Strategy, which offer financial incentives and support for projects that use sustainable construction materials such as green cement.
Similarly, in India, the government has implemented initiatives like the National Mission for Enhanced Energy Efficiency and the Green Highways Policy to encourage the use of green technology in infrastructure building, including green cement. Subsidies and tax breaks are offered to encourage the building sector to adopt more sustainable methods.
The United Arab Emirates (UAE) has also shown a commitment to sustainability with projects like the UAE Vision 2021 and the Dubai Clean Energy Strategy 2050. Government-funded projects promote the use of sustainable construction materials, with developers providing subsidies and incentives for incorporating green cement into their projects.
In 2022, Vancouver and Toronto have set net-zero greenhouse gas emissions objectives for all new buildings by 2030, while Montreal must achieve net zero by 2025. There are also ongoing initiatives to discover a greener way to produce concrete, which is the primary material used in most building. They include a novel solution from Halifax-based CarbonCure Technologies that incorporates recycled CO2 into the concrete mix.
In US, Three jurisdictions, including Denver, Boston, and New York City, will impose financial penalties on properties that fail to reach carbon reduction targets. For example, the municipal Energize Denver code specifies that buildings 25,000 square feet or greater must reach a final EUI objective by 2030. The Building Emissions Reduction and Disclosure Ordinance (BERDO) is an important environmental program enacted by the City of Boston. The city intends to steadily reduce carbon emissions to net zero by 2050. New York City's Local Law 97 (LL97) will assess fines similarly to Boston, but with a small twist. Beginning in 2024, all commercial structures 25,000 square feet or bigger will be required to comply with LL97. The city's objective is to minimize greenhouse gas emissions.
The High Costs Compared to Traditional Cement Pose a Challenge
Green cement manufacturing faces greater costs since it relies on more complex procedures and different resources than standard Portland cement. This intricacy frequently results in a higher starting cost per tonne for green cement. While the environmental benefits of green cement provide significant long-term value, economic restrictions in construction projects usually lead stakeholders to choose more cheap conventional alternatives.
The pricing of green cement varies considerably based on factors such as brand, location, production methods, and market demand. Generally, green cement tends to be slightly pricier than Portland cement due to the expenses associated with its raw materials. Despite this disparity, many builders prioritize sustainability and are willing to pay a premium for the environmental advantages offered by green cement. For example, in the United States, prices can range from $80 to $160 per ton, with variations across states like California and Texas.
In India, where the building sector contributes significantly to economic growth, the high cost of green cement has hampered its adoption, despite rising awareness of sustainability problems. Traditional cement remains the chosen choice for many developers owing to its cheaper initial costs, despite the fact that green cement may provide long-term environmental advantages and durability.
In Europe, where environmental regulations are often more stringent, prices can range from €90 to €150 per ton. However, as the demand for eco-friendly construction materials continues to grow, it is anticipated that the price of green cement will decrease over time.
Despite rising environmental consciousness and a trend toward sustainable construction techniques in the United States, the high cost of green cement continues to be a barrier to wider implementation. While certain jurisdictions, such as California, provide incentives and rebates for green construction projects, the general market penetration of green cement is restricted by its cost competitiveness with traditional options.
Similarly, in rising economies such as Brazil and South Africa, where infrastructure development is a crucial engine of economic growth, the cost of construction materials is an important concern. Green cement's higher prices can provide hurdles for government-funded infrastructure projects and private developers operating on tight budgets, restricting its adoption despite the potential long-term advantages for sustainability and environmental protection.
Research and development activities are continuing to improve manufacturing methods and reduce prices in order to make green cement more competitive in the market. Despite the problems created by their high costs, the rising demand for sustainable construction materials emphasizes the significance of breaking down this barrier in order to hasten the transition to a more ecologically friendly built environment.
What Questions Should You Ask before Buying a Market Research Report?
How is green cement market evolving?
What is driving and restraining green cement market?
How will each green cement submarket segment grow over the forecast period and how much revenue will these submarkets account for in 2034?
How will the market shares for each green cement submarket develop from 2024 to 2034?
What will be the main driver for the overall market from 2024 to 2034?
Will leading green cement markets broadly follow the macroeconomic dynamics, or will individual national markets outperform others?
How will the market shares of the national markets change by 2034 and which geographical region will lead the market in 2034?
Who are the leading players and what are their prospects over the forecast period?
What is green cement projects for these leading companies?
How will the industry evolve during the period between 2024 and 2034? What are the implications of green cement projects taking place now and over the next 10 years?
Is there a greater need for product commercialisation to further scale green cement market?
Where is green cement market heading and how can you ensure you are at the forefront of the market?
What are the best investment options for new product and service lines?
What are the key prospects for moving companies into a new growth path and C-suite?
You need to discover how this will impact green cement market today, and over the next 10 years:
Our 254-page report provides 85 tables and 139 charts/graphs exclusively to you.
The report highlights key lucrative areas in the industry so you can target them - NOW.
It contains in-depth analysis of global, regional, and national sales and growth.
It highlights for you the key successful trends, changes and revenue projections made by your competitors.
This report tells you TODAY how green cement market will develop in the next 10 years, and in line with the variations in COVID-19 economic recession and bounce. This market is more critical now than at any point over the last 10 years.
Forecasts to 2034 and other analyses reveal commercial prospects
In addition to revenue forecasting to 2034, our new study provides you with recent results, growth rates, and market shares.
You will find original analyses, with business outlooks and developments.
Discover qualitative analyses (including market dynamics, drivers, opportunities, restraints, and challenges), cost structure, impact of rising green cement prices and recent developments.
This report includes data analysis and invaluable insight into how COVID-19 will affect the industry and your company. Four COVID-19 recovery patterns and their impact, namely, "V", "L", "W" and "U" are discussed in this report.
Segments Covered in the Report
Green Cement Type Outlook
Fly Ash
Slag
Recycled Aggregate
Others
Green Cement Application Outlook
Residential
Commercial
Industrial
In addition to the revenue predictions for the overall world market and segments, you will also find revenue forecasts for five regional and 21 leading national markets:
North America
U.S.
Canada
Europe
Turkey
Russia
Germany
Italy
France
UK
Rest of Europe
Asia Pacific
Japan
China
India
Vietnam
South Korea
Indonesia
Rest of Asia Pacific
Latin America
Brazil
Mexico
Argentina
Colombia
Rest of Latin America
MEA
GCC
South Africa
Rest of MEA
The report also includes profiles and for some of the leading companies in Green Cement Market, 2024 to 2034, with a focus on this segment of these companies' operations.
Leading companies profiled in the report
ACC Limited
Anhui Conch Cement
CEMEX S.A.B. de C.V.
CRH plc
CarbonCure Technologies Inc.
Green Cement Inc.
Heidelberg Materials AG
Holcim Ltd.
JSW Cement
UltraTech Cement Limited
Overall world revenue for Green Cement Market, 2024 to 2034 in terms of value the market will surpass US$1.8 billion in 2024, our work calculates. We predict strong revenue growth through to 2034. Our work identifies which organizations hold the greatest potential. Discover their capabilities, progress, and commercial prospects, helping you stay ahead.
How will Green Cement Market, 2024 to 2034 report help you?
In summary, our 250+ page report provides you with the following knowledge:
Revenue forecasts to 2034 for Green cement Market, 2024 to 2034 Market, with forecasts for type, and application, each forecast at a global and regional level - discover the industry's prospects, finding the most lucrative places for investments and revenues.
Revenue forecasts to 2034 for five regional and 21 key national markets - See forecasts for green cement Market, 2024 to 2034 market in North America, Europe, Asia-Pacific, Latin America, and MEA. Also forecasted is the market in the US, Canada, Mexico, Brazil, Germany, France, UK, Italy, China, India, Japan, and Australia among other prominent economies.
Prospects for established firms and those seeking to enter the market - including company profiles for 10 of the major companies involved in green cement Market, 2024 to 2034.
Find quantitative and qualitative analyses with independent predictions. Receive information that only our report contains, staying informed with invaluable business intelligence.
Information found nowhere else
With our new report, you are less likely to fall behind in knowledge or miss out on opportunities. See how our work could benefit your research, analyses, and decisions. Visiongain's study is for everybody needing commercial analyses for green cement Market, 2024 to 2034, market-leading companies. You will find data, trends and predictions.
Table of Contents
1 Report Overview
- 1.1 Objectives of the Study
- 1.2 Introduction to Green Cement Market
- 1.3 What This Report Delivers
- 1.4 Why You Should Read This Report
- 1.5 Key Questions Answered by This Analytical Report
- 1.6 Who is This Report for?
- 1.7 Methodology
- 1.7.1 Market Definitions
- 1.7.2 Market Evaluation & Forecasting Methodology
- 1.7.3 Data Validation
- 1.7.3.1 Primary Research
- 1.7.3.2 Secondary Research
- 1.8 Frequently Asked Questions (FAQs)
- 1.9 Associated Visiongain Reports
- 1.10 About Visiongain
2 Executive Summary
3 Market Overview
- 3.1 Key Findings
- 3.2 Market Dynamics
- 3.2.1 Market Driving Factors
- 3.2.1.1 Real Estate Sector's Surge Spurs Growth in Green Cement Market
- 3.2.1.2 Increasing Concern of GHG Emissions from Cement Production might Boost Market Growth
- 3.2.1.3 Government Policies and Incentives are Fuelling the Demand for Green Cement
- 3.2.2 Market Opportunities
- 3.2.2.1 Expansion into Niche Applications Presents a Significant Opportunity
- 3.2.2.2 Carbon Capture, Utilization, and Storage (CCUS) Technologies and Green Cement: A Powerful Combination
- 3.2.2.3 Integration with Circular Economy Practices
- 3.2.2.4 Growing Focus on Bio-based Binders
- 3.2.3 Market Challenges
- 3.2.3.1 The High Costs Compared to Traditional Cement Pose a Challenge
- 3.2.3.2 Limited Awareness and Education
- 3.2.3.3 Need for More Research & Development
- 3.2.4 Market Restraining Factors
- 3.2.4.1 Established Alternatives is Likely to Hinder Product Adoption
- 3.2.4.2 Supply Chain Constraints
- 3.2.1 Market Driving Factors
- 3.3 SWOT Analysis
- 3.3.1 Strengths:
- 3.3.2 Weaknesses:
- 3.3.3 Opportunities:
- 3.3.4 Threats:
- 3.4 Porter's Five Forces Analysis
- 3.4.1 Bargaining Power of Suppliers
- 3.4.2 Bargaining Power of Buyers
- 3.4.3 Competitive Rivalry
- 3.4.4 Threat from Substitutes
- 3.4.5 Threat of New Entrants
- 3.5 PEST Analysis
- 3.6 COVID-19 Impact Analysis
4 Green Cement Market Analysis by Type
- 4.1 Key Findings
- 4.2 Type Segment: Market Attractiveness Index
- 4.3 Green Cement Market Size Estimation and Forecast by Type
- 4.4 Fly Ash
- 4.4.1 Market Size by Region, 2024-2034 (US$ Billion)
- 4.4.2 Market Share by Region, 2024 & 2034 (%)
- 4.5 Slag
- 4.5.1 Market Size by Region, 2024-2034 (US$ Billion)
- 4.5.2 Market Share by Region, 2024 & 2034 (%)
- 4.6 Recycled Aggregate
- 4.6.1 Market Size by Region, 2024-2034 (US$ Billion)
- 4.6.2 Market Share by Region, 2024 & 2034 (%)
- 4.7 Others
- 4.7.1 Market Size by Region, 2024-2034 (US$ Billion)
- 4.7.2 Market Share by Region, 2024 & 2034 (%)
5 Green Cement Market Analysis by Application
- 5.1 Key Findings
- 5.2 Application Segment: Market Attractiveness Index
- 5.3 Green Cement Market Size Estimation and Forecast by Application
- 5.4 Residential
- 5.4.1 Market Size by Region, 2024-2034 (US$ Billion)
- 5.4.2 Market Share by Region, 2024 & 2034 (%)
- 5.5 Commercial
- 5.5.1 Market Size by Region, 2024-2034 (US$ Billion)
- 5.5.2 Market Share by Region, 2024 & 2034 (%)
- 5.6 Industrial
- 5.6.1 Market Size by Region, 2024-2034 (US$ Billion)
- 5.6.2 Market Share by Region, 2024 & 2034 (%)
6 Green Cement Market Analysis by Region
- 6.1 Key Findings
- 6.2 Regional Market Size Estimation and Forecast
7 North America Green Cement Market Analysis
- 7.1 Key Findings
- 7.2 North America Green Cement Market Attractiveness Index
- 7.3 North America Green Cement Market by Country, 2023, 2028 & 2033 (US$ Billion)
- 7.4 North America Green Cement Market Size Estimation and Forecast by Country
- 7.5 North America Green Cement Market Size Estimation and Forecast by Type
- 7.6 North America Green Cement Market Size Estimation and Forecast by Application
- 7.7 U.S. Green Cement Market Analysis
- 7.8 Canada Green Cement Market Analysis
8 Europe Green Cement Market Analysis
- 8.1 Key Findings
- 8.2 Europe Green Cement Market Attractiveness Index
- 8.3 Europe Green Cement Market by Country, 2024, 2029 & 2034 (US$ Billion)
- 8.4 Europe Green Cement Market Size Estimation and Forecast by Country
- 8.5 Europe Green Cement Market Size Estimation and Forecast by Type
- 8.6 Europe Green Cement Market Size Estimation and Forecast by Application
- 8.7 Turkey Green Cement Market Analysis
- 8.8 Russia Green Cement Market Analysis
- 8.9 Germany Green Cement Market Analysis
- 8.10 Italy Green Cement Market Analysis
- 8.11 France Green Cement Market Analysis
- 8.12 UK Green Cement Market Analysis
- 8.13 Rest of Europe Green Cement Market Analysis
9 Asia Pacific Green Cement Market Analysis
- 9.1 Key Findings
- 9.2 Asia Pacific Green Cement Market Attractiveness Index
- 9.3 Asia Pacific Green Cement Market by Country, 2024, 2029 & 2034 (US$ Billion)
- 9.4 Asia Pacific Green Cement Market Size Estimation and Forecast by Country
- 9.5 Asia Pacific Green Cement Market Size Estimation and Forecast by Type
- 9.6 Asia Pacific Green Cement Market Size Estimation and Forecast by Application
- 9.7 Japan Green Cement Market Analysis
- 9.8 China Green Cement Market Analysis
- 9.9 India Green Cement Market Analysis
- 9.10 Vietnam Green Cement Market Analysis
- 9.11 South Korea Green Cement Market Analysis
- 9.12 Indonesia Green Cement Market Analysis
- 9.13 Rest of Asia Pacific Green Cement Market Analysis
10 Latin America Green Cement Market Analysis
- 10.1 Key Findings
- 10.2 Latin America Green Cement Market Attractiveness Index
- 10.3 Latin America Green Cement Market by Country, 2024, 2029 & 2034 (US$ Billion)
- 10.4 Latin America Green Cement Market Size Estimation and Forecast by Country
- 10.5 Latin America Green Cement Market Size Estimation and Forecast by Type
- 10.6 Latin America Green Cement Market Size Estimation and Forecast by Application
- 10.7 Brazil Green Cement Market Analysis
- 10.8 Mexico Green Cement Market Analysis
- 10.9 Argentina Green Cement Market Analysis
- 10.10 Colombia Green Cement Market Analysis
- 10.11 Rest of Latin America Green Cement Market Analysis
11 Middle East & Africa Green Cement Market Analysis
- 11.1 Key Findings
- 11.2 Middle East & Africa Green Cement Market Attractiveness Index
- 11.3 Middle East & Africa Green Cement Market by Country, 2024, 2029 & 2034 (US$ Billion)
- 11.4 Middle East & Africa Green Cement Market Size Estimation and Forecast by Country
- 11.5 Middle East & Africa Green Cement Market Size Estimation and Forecast by Type
- 11.6 Middle East & Africa Green Cement Market Size Estimation and Forecast by Application
- 11.7 GCC Green Cement Market Analysis
- 11.8 South Africa Green Cement Market Analysis
- 11.9 Rest of MEA Green Cement Market Analysis
12 Company Profiles
- 12.1 Competitive Landscape, 2024
- 12.2 Strategic Outlook
- 12.3 UltraTech Cement Limited
- 12.3.1 Company Snapshot
- 12.3.2 Company Overview
- 12.3.3 Financial Analysis
- 12.3.3.1 Net Revenue, 2018-2023
- 12.3.3.2 Gross Profit, 2018-2023
- 12.3.3.3 Segment Market Shares, 2023
- 12.3.3.4 Regional Market Shares, 2023
- 12.3.3.5 R&D, 2018-2023
- 12.3.4 Product Benchmarking
- 12.3.5 Strategic Outlook
- 12.4 CEMEX S.A.B. de C.V.
- 12.4.1 Company Snapshot
- 12.4.2 Company Overview
- 12.4.3 Financial Analysis
- 12.4.3.1 Net Revenue, 2018-2023
- 12.4.3.2 Gross Profit, 2018-2023
- 12.4.3.3 Segment Market Shares, 2023
- 12.4.3.4 Regional Market Shares, 2023
- 12.4.3.5 R&D, 2018-2023
- 12.4.4 Product Benchmarking
- 12.4.5 Strategic Outlook
- 12.5 Heidelberg Materials AG
- 12.5.1 Company Snapshot
- 12.5.2 Company Overview
- 12.5.3 Financial Analysis
- 12.5.3.1 Net Revenue, 2018-2023
- 12.5.3.2 Gross Profit, 2018-2023
- 12.5.3.3 Segment Market Shares, 2023
- 12.5.3.4 Regional Market Shares, 2023
- 12.5.4 Product Benchmarking
- 12.5.5 Strategic Outlook
- 12.6 JSW Cement
- 12.6.1 Company Snapshot
- 12.6.2 Company Overview
- 12.6.3 Financial Analysis
- 12.6.3.1 Net Revenue, 2018-2023
- 12.6.3.2 Segment Market Shares, 2023
- 12.6.3.3 Regional Market Shares, 2023
- 12.6.4 Product Benchmarking
- 12.6.5 Strategic Outlook
- 12.7 Holcim Ltd.
- 12.7.1 Company Snapshot
- 12.7.2 Company Overview
- 12.7.3 Financial Analysis
- 12.7.3.1 Net Revenue, 2018-2023
- 12.7.3.2 Gross Profit, 2018-2023
- 12.7.3.3 Segment Market Shares, 2023
- 12.7.3.4 Regional Market Shares, 2023
- 12.7.3.5 R&D, 2018-2023
- 12.7.4 Product Benchmarking
- 12.7.5 Strategic Outlook
- 12.8 ACC Limited
- 12.8.1 Company Snapshot
- 12.8.2 Company Overview
- 12.8.3 Financial Analysis
- 12.8.3.1 Net Revenue, 2018-2023
- 12.8.3.2 Gross Profit, 2018-2023
- 12.8.3.3 Segment Market Shares, 2023
- 12.8.3.4 Regional Market Shares, 2023
- 12.8.3.5 R&D, 2018-2023
- 12.8.4 Product Benchmarking
- 12.8.5 Strategic Outlook
- 12.9 Anhui Conch Cement
- 12.9.1 Company Snapshot
- 12.9.2 Company Overview
- 12.9.3 Financial Analysis
- 12.9.3.1 Net Revenue, 2018-2023
- 12.9.3.2 Gross Profit, 2018-2023
- 12.9.3.3 Segment Market Shares, 2023
- 12.9.3.4 Regional Market Shares, 2022
- 12.9.3.5 R&D, 2018-2022
- 12.9.4 Product Benchmarking
- 12.9.5 Strategic Outlook
- 12.10 CRH plc
- 12.10.1 Company Snapshot
- 12.10.2 Company Overview
- 12.10.3 Financial Analysis
- 12.10.3.1 Net Revenue, 2018-2023
- 12.10.3.2 Gross Profit, 2018-2023
- 12.10.3.3 Segment Market Shares, 2023
- 12.10.3.4 Regional Market Shares, 2023
- 12.10.4 Product Benchmarking
- 12.10.5 Strategic Outlook
- 12.11 Green Cement Inc.
- 12.11.1 Company Snapshot
- 12.11.2 Company Overview
- 12.11.3 Product Benchmarking
- 12.11.4 Strategic Outlook
- 12.12 CarbonCure Technologies Inc.
- 12.12.1 Company Snapshot
- 12.12.2 Company Overview
- 12.12.3 Product Benchmarking
- 12.12.4 Strategic Outlook
13 Conclusion and Recommendations
- 13.1 Concluding Remarks from Visiongain
- 13.2 Recommendation