|
|
市場調査レポート
商品コード
1532917
砂糖の世界市場 - 2024年~2029年までの予測Global Sugar Market - Forecasts from 2024 to 2029 |
||||||
|
|||||||
カスタマイズ可能
|
|||||||

| 砂糖の世界市場 - 2024年~2029年までの予測 |
|
出版日: 2024年07月15日
発行: Knowledge Sourcing Intelligence
ページ情報: 英文 105 Pages
納期: 即日から翌営業日
|

全表示
- 概要
- 目次
世界の砂糖市場は、CAGR2.58%で成長し、2024年の662億2,900万米ドルから、2029年までには752億4,300万米ドルに達すると予測されています。
砂糖は世界中で最も基本的な食品成分の一つです。砂糖は、甘味料、保存料、発酵物質、香料、着色料など様々な用途があります。砂糖は通常、主にサトウキビやテンサイに含まれるショ糖から得られます。砂糖の用途は基本的に医薬品と食品・飲料産業です。粉砂糖は一般的にパン屋でベーキングや風味付けに利用されます。対照的に、グラニュー糖は世界的に最も使用されている砂糖の形態で、住宅や様々な商業店舗で使用されています。液糖は一般的に食品加工業者が製品に風味や食感を加えるために使用します。
世界の砂糖業界の市場拡大促進要因の一つは、砂糖の世界の取引の増加です。砂糖は食品、飲料、製薬業界など様々な分野で使用されているため、世界の砂糖需要の増加は著しいです。米国農務省対外農務局のデータによると、砂糖の世界貿易は、特にブラジル、インド、タイ、オーストラリアなどの国々で一貫して増加しています。2021年から2022年、ブラジルの粗糖輸出量は2,595万トンを記録し、2022年から2023年には約2,820万トンに増加します。
同様に、タイとインドの粗糖輸出も同様の期間で増加しています。2022年から2023年のタイの粗糖輸出総量は約68億7,100万トン、インドは83億300万トンでした。
さらに、世界の砂糖市場は、世界の砂糖生産量の増加、菓子や加工品の消費量の増加に後押しされ、緩やかに成長すると推定されます。これが市場拡大の需要を後押ししています。また、砂糖農家に対する政府の有利な規制やガイドラインは、砂糖産業の成長を促進し、将来の市場拡大への道を開くと予想されます。
世界の砂糖市場の促進要因:
- 世界の食品・飲料需要の高まりが砂糖需要を押し上げると予想されます。
世界砂糖市場拡大の主要な要因は、世界の食品・飲料需要の高まりです。食品・飲料業界では、砂糖は製品の味、甘さ、食感を向上させるなど、多様な目的で利用されています。また、保存料としても機能し、商品の保存性を高めます。さらに、食品・飲料に対する世界の需要は、世界の人口増加に伴い、倍増します。
世界の食品・飲料製造の増加は、予想される期間において砂糖の需要を押し上げると予想されます。カナダの農業・農産食料省のデータによると、食品・飲料加工産業はカナダ最大の製造業のひとつであり、カナダ国内の製造業売上高全体の約18.2%を占めています。カナダでは、飲料製造業が2022年に約149億米ドルを占めるのに対し、砂糖・菓子類製造業は2022年に約52億米ドルを占めました。さらに、果物と野菜の保存と製造は、同年に約102億米ドルを構成しています。さまざまな甘味料ベースの製品が含まれることで、砂糖・菓子類のシェアは上昇し、それによって今後数年間の砂糖産業の成長を促進すると予想されます。
世界の砂糖市場の地理的展望
- 米国地域が市場成長に大きく貢献すると予測されます。
米国のような新興経済諸国における砂糖産業の発展は、国内の様々な政府イニシアチブの拡大によって大きな影響を受けると考えられています。例えば、2023年の米国政府説明責任局(GAO)の報告書によると、米国農務省の管理下にある米国の砂糖プログラムは、全国の砂糖生産者に様々な利益をもたらしています。これは主に、このプログラムが国内の砂糖生産に高いコストを農家に提供しているためであり、このようにして、砂糖農場の下で運営される事業は、地域の他の農場と比べて長期的に有益なものとなっています。
さらに、国内では砂糖ローンのような施策が推進されており、国内のサトウキビやテンサイの加工業者にとって有利な展望をもたらすと予想されます。これは、これらのカテゴリーにおける総売上高を押し上げ、それによって市場の成長を支えることになります。例えば、米国農務省によると、2021年の作付年における総売上高は、テンサイで18億米ドル、サトウキビで約15億米ドルでした。
さらに、国内の大手企業が提供する先進的な製品は、今後数年間の市場拡大を後押しすると予想されます。例えば、U.S.Sugarは南フロリダの有名企業で、スイートコーン、サトウキビ、柑橘類でよく知られています。米国で生産される砂糖の約10%を供給しています。さらに、戦略的な合併や提携も市場成長の一助となっています。例えば、U.S.Sugarは2021年3月、ジョージア州とケンタッキー州で事業を展開する港湾精製業者、Imperial Sugar Companyの事業と資源をLouis Dreyfus Companyから買収することで合意したと発表しました。
さらに、USDAの予測によると、砂糖の輸入は何倍にも増加しており、予測期間中の砂糖市場に大きく貢献しています。例えば、砂糖の輸入量は2020年の2922(1,000メトリックトン)から2023年には3119(1,000メトリックトン)に達します。したがって、輸出入貿易は、国内の砂糖需要の増加に後押しされて、今後数年間で成長すると思われます。
世界の砂糖市場の主要企業:
- Cargill, Incorporated-Cargill, Incorporatedは砂糖業界の世界リーダーの1つであり、あらゆるエンドユーザーの要求を満たす幅広い製品を提供しています。
- Raizan SA-Raizan SAは砂糖および関連製品の主要生産者で、ブラジルおよび国際市場で大きな存在感を示しています。
- Archer Daniels Midland(ADM)-Archer Daniels Midlandは砂糖および甘味料の総合的な製品を提供する大手メーカーです。同社の製品は、その信頼性と品質パラメーターでよく知られています。
目次
第1章 イントロダクション
- 市場概要
- 市場の定義
- 調査範囲
- 市場セグメンテーション
- 通貨
- 前提条件
- 基準年と予測年のタイムライン
- 利害利害関係者にとっての主要なメリット
第2章 調査手法
- 調査デザイン
- 調査プロセス
第3章 エグゼクティブサマリー
- 主要な調査結果
第4章 市場力学
- 市場促進要因
- 市場抑制要因
- ポーターのファイブフォース分析
- 業界バリューチェーン分析
- アナリストビュー
第5章 世界の砂糖市場:製品タイプ別
- イントロダクション
- 粒状
- 粉末
- 液体
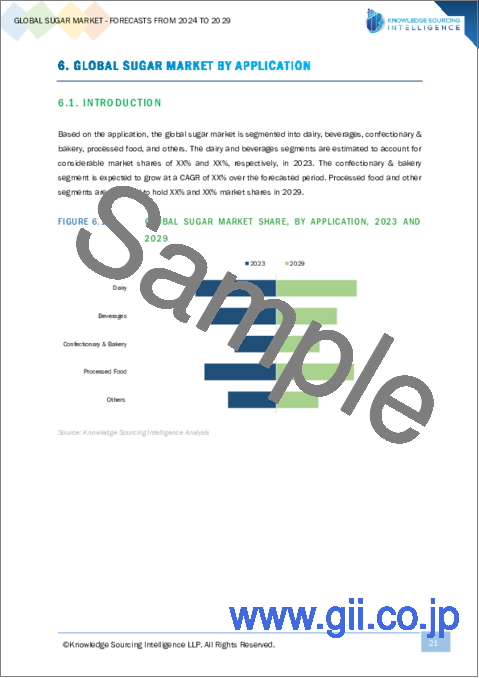
第6章 世界の砂糖市場:用途別
- イントロダクション
- 乳製品
- 飲料
- 菓子・ベーカリー
- 加工食品
- その他
第7章 世界の砂糖市場:地域別
- イントロダクション
- 北米
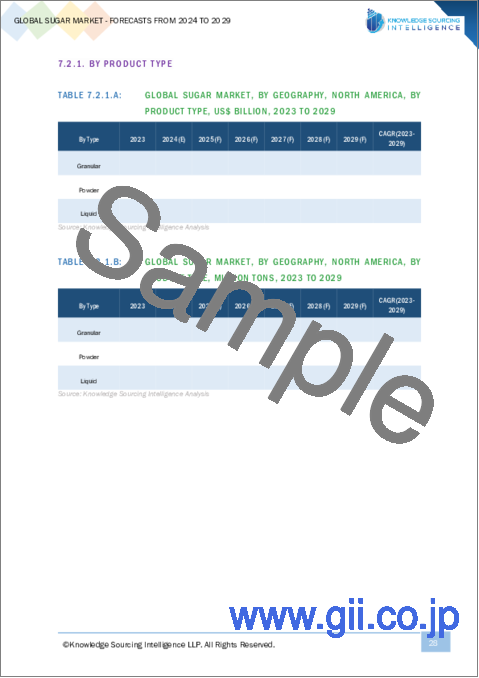
- 製品タイプ別
- 用途別
- 国別
- 南米
- 製品タイプ別
- 用途別
- 国別
- 欧州
- 製品タイプ別
- 用途別
- 国別
- 中東・アフリカ
- 製品タイプ別
- 用途別
- 国別
- アジア太平洋
- 製品タイプ別
- 用途別
- 国別
第8章 競合環境と分析
- 主要企業と戦略分析
- 新興企業とMarkeyの収益性
- 合併、買収、合意、コラボレーション
- 競合ダッシュボード
第9章 企業プロファイル
- Cargill, Incorporated
- Archer Daniels Midland
- Raizan SA
- Sudzucker AG
- Tereos
- Nordzucker Holding AG
- Tongaat Hulett Group
- Illovo Sugar(Pty)Ltd(Associated British Foods Plc.)
- Dangote Group
- E.I.D Parry Limited(Murugappa Group)
- Shree Renuka Sugars Ltd.(Wilmar Sugar Holdings)
- Dhampur Bio Organics Limited
- K.C.P Sugar and Industries Corporation Ltd
- NSL Sugar
- Central Sugars Refinery Sdn Bhd
The global sugar market is projected to grow at a CAGR of 2.58% to reach US$75.243 billion by 2029 from US$66.229 billion in 2024.
Sugar is among the foremost fundamental food components around the world. Universally, sugar has various applications, such as a sweetener, preservative, fermentation substance, flavoring & coloring agent, and numerous more. It is usually obtained from sucrose, which is primarily concentrated in sugarcane plants or sugar beets. The application of sugar is basically in the pharmaceutical and food & beverages industry. Powdered sugar is generally utilized for baking and flavoring by the bakeries. In contrast, granulated sugar is the most used sugar form globally, used in residential populations and various commercial outlets. The liquid sugar is commonly used by food processors, for adding flavors and texture to products.
One of the major drivers for the increasing market measure of the global sugar industry can be the increment in the global trade of sugar. With its application across different businesses like food, beverages, and the pharmaceutical industry, the demand for sugar globally has moreover witnessed an enormous increment. The US Department of Agriculture, Foreign Agricultural Service data on the export of raw sugar from different nations expressed that the worldwide trade of raw sugar saw a consistent rise, particularly in nations like Brazil, India, Thailand, and Australia, among others. In 2021-22, the export of raw sugar in Brazil was recorded at 25,950 thousand million tons, which developed to approximately 28,200 thousand million tons in 2022-23.
Similarly, Thailand's and India's raw sugar exports increased in a similar time period. In 2022-23, Thailand's total export of raw sugar was about 6,871 million tons, and India's was 8,303 million tons.
Moreover, the global sugar market is estimated to grow moderately, fueled by the growing sugar production and the increasing consumption of confectionary and processed products worldwide. This fuels the demand for market expansion. In addition, favorable government regulations and guidelines for sugar farmers will propel the sugar industry's growth and are expected to pave the way for future market expansion.
GLOBAL SUGAR MARKET DRIVERS:
- The rising global demand for food and beverages is anticipated to boost the demand for sugar globally.
The major factor for the increment within the worldwide sugar market is the rising requirements for food and beverage items globally. In the food and beverage industry, sugars are utilized for diverse purposes, like to progress the taste, sweetness, and texture of the products. They moreover act as a preservative that increments the shelf life of the items. Additionally, the global demand for food and beverage items will grow multifold with the rise in the population worldwide.
The growth in the global manufacturing of food and beverage items is anticipated to push the requirement for sugar forward in the anticipated period. The Canadian Agriculture and Agri-Food data stated that the food and beverage processing industry is among the largest manufacturing industries in the country, which accounts for around 18.2% of the total manufacturing sales within the country. In Canada, beverage manufacturing accounted for about US$14.9 billion in 2022, whereas sugar and confectionery manufacturing in 2022 accounted for about US$5.2 billion in 2022. Additionally, fruit and vegetable preservation and manufacturing comprised about US$10.2 billion in the same year. With the inclusion of different sweetener-based products, the share of sugar and confectionery is anticipated to rise, thereby propelling the growth of the sugar industry in the coming years.
Global Sugar Market Geographical Outlook
- The United States region is predicted to contribute significantly to market growth.
The development of the sugar industry in developed economies such as the United States will be affected in a substantial way by the expansion of various government initiatives within the nation. For instance, as per the report of the United States Government Accountability Office (GAO) in 2023, the U.S. sugar program under the administration of the USDA has resulted in various benefits for sugar producers nationwide. This is primarily due to the program offering high costs to farmers for domestic sugar production, in this manner making businesses operated under the sugar farms more beneficial in the long term compared to other farms in the region.
Further, measures such as sugar loans are promoted in the country, which is anticipated to provide lucrative prospects for domestic sugarcane and sugar beet processors. This will propel the total sales under these categories, thereby supporting market growth. For instance, in the 2021 crop year, according to USDA, the total sales stood at US$1.8 billion for sugar beet and around US$1.5 billion for sugarcane, respectively.
Moreover, the advanced products provided by major companies in the nation are anticipated to boost market expansion in the years ahead. For example, U.S. Sugar is a well-known company in South Florida, well known for its sweet corn, sugarcane, and citrus items. It gives about 10% of all the sugar produced in the United States regions. Further, strategic mergers and collaborations are also aiding in the market growth. For instance, U.S. Sugar announced in March 2021 that it had agreed to buy the business and resources of Imperial Sugar Company, a port refiner with business in Georgia and Kentucky, from Louis Dreyfus Company.
Additionally, according to USDA estimates, sugar imports have increased multifold, contributing significantly to the sugar market during the forecast period. For instance, in 2023, the sugar imports reached around 3119 (thousand metric tons) from 2922 (thousand metric tons) in 2020. Therefore, the import-export trade will grow in the coming years, fuelled by rising sugar demand in the country.
Global Sugar Market Key Players:
- Cargill, Incorporated- Cargill, Incorporated is one of the global leaders in the sugar industry, providing a wide range of products to meet the requirements of all end users. It strives to emerge as a strategic business partner for various key Industries to supply as per their sugar needs.
- Raizan SA - Raizan SA is a key producer of sugar and related products, with a major presence in Brazilian and international markets.
- Archer Daniels Midland (ADM) - Archer Daniels Midland is a leading manufacturer, providing a comprehensive range of sugar and sweetener products. The company's products are well known for their reliability and quality parameters.
Market Segmentation:
The Global Sugar Market is segmented and analyzed as below:
By Product Type
- Granular
- Powder
- Liquid
By Application
- Dairy
- Beverages
- Confectionary & Bakery
- Processed Food
- Others
By Geography
- North America
- United States
- Canada
- Mexico
- South America
- Brazil
- Argentina
- Columbia
- Venezuela
- Ecuador
- Peru
- Others
- Europe
- Austria
- Belgium
- Bulgaria
- Czech Republic
- Denmark
- Finland
- France
- Germany
- Hungary
- Ireland
- Italy
- Netherlands
- Poland
- Portugal
- Romania
- Russia
- Slovakia
- Slovenia
- Spain
- Sweden
- UK
- Middle East and Africa
- Saudi Arabia
- Israel
- UAE
- Turkey
- Morocco
- Ethiopia
- Algeria
- Egypt
- Others
- Asia Pacific
- China
- India
- Japan
- South Korea
- Australia
- Philippines
- Indonesia
- Vietnam
- Malaysia
- Thailand
TABLE OF CONTENTS
1. INTRODUCTION
- 1.1. Market Overview
- 1.2. Market Definition
- 1.3. Scope of the Study
- 1.4. Market Segmentation
- 1.5. Currency
- 1.6. Assumptions
- 1.7. Base and Forecast Years Timeline
- 1.8. Key benefits for the stakeholders
2. RESEARCH METHODOLOGY
- 2.1. Research Design
- 2.2. Research Process
3. EXECUTIVE SUMMARY
- 3.1. Key Findings
4. MARKET DYNAMICS
- 4.1. Market Drivers
- 4.2. Market Restraints
- 4.3. Porter's Five Forces Analysis
- 4.3.1. Bargaining Power of Suppliers
- 4.3.2. Bargaining Power of Buyers
- 4.3.3. Threat of New Entrants
- 4.3.4. Threat of Substitutes
- 4.3.5. Competitive Rivalry in the Industry
- 4.4. Industry Value Chain Analysis
- 4.5. Analyst view
5. GLOBAL SUGAR MARKET BY PRODUCT TYPE
- 5.1. Introduction
- 5.2. Granular
- 5.3. Powder
- 5.4. Liquid
6. GLOBAL SUGAR MARKET BY APPLICATION
- 6.1. Introduction
- 6.2. Dairy
- 6.3. Beverages
- 6.4. Confectionary & Bakery
- 6.5. Processed Food
- 6.6. Others
7. GLOBAL SUGAR MARKET BY GEOGRAPHY
- 7.1. Introduction
- 7.2. North America
- 7.2.1. By Product Type
- 7.2.2. By Application
- 7.2.3. By Country
- 7.2.3.1. USA
- 7.2.3.2. Canada
- 7.2.3.3. Mexico
- 7.3. South America
- 7.3.1. By Product Type
- 7.3.2. By Application
- 7.3.3. By Country
- 7.3.3.1. Brazil
- 7.3.3.2. Argentina
- 7.3.3.3. Columbia
- 7.3.3.4. Venezuela
- 7.3.3.5. Ecuador
- 7.3.3.6. Peru
- 7.3.3.7. Others
- 7.4. Europe
- 7.4.1. By Product Type
- 7.4.2. By Application
- 7.4.3. By Country
- 7.4.3.1. Austria
- 7.4.3.2. Belgium
- 7.4.3.3. Bulgaria
- 7.4.3.4. Czech Republic
- 7.4.3.5. Denmark
- 7.4.3.6. Finland
- 7.4.3.7. France
- 7.4.3.8. Germany
- 7.4.3.9. Hungary
- 7.4.3.10. Ireland
- 7.4.3.11. Italy
- 7.4.3.12. Netherlands
- 7.4.3.13. Poland
- 7.4.3.14. Portugal
- 7.4.3.15. Romania
- 7.4.3.16. Russia
- 7.4.3.17. Slovakia
- 7.4.3.18. Slovenia
- 7.4.3.19. Spain
- 7.4.3.20. Sweden
- 7.4.3.21. UK
- 7.5. Middle East and Africa
- 7.5.1. By Product Type
- 7.5.2. By Application
- 7.5.3. By Country
- 7.5.3.1. Saudi Arabia
- 7.5.3.2. Israel
- 7.5.3.3. UAE
- 7.5.3.4. Turkey
- 7.5.3.5. Morocco
- 7.5.3.6. Ethiopia
- 7.5.3.7. Algeria
- 7.5.3.8. Egypt
- 7.5.3.9. Others
- 7.6. Asia Pacific
- 7.6.1. By Product Type
- 7.6.2. By Application
- 7.6.3. By Country
- 7.6.3.1. China
- 7.6.3.2. India
- 7.6.3.3. Japan
- 7.6.3.4. South Korea
- 7.6.3.5. Australia
- 7.6.3.6. Philippines
- 7.6.3.7. Indonesia
- 7.6.3.8. Vietnam
- 7.6.3.9. Malaysia
- 7.6.3.10. Thailand
8. COMPETITIVE ENVIRONMENT AND ANALYSIS
- 8.1. Major Players and Strategy Analysis
- 8.2. Emerging Players and Markey Lucrativeness
- 8.3. Mergers, Acquisitions, Agreements, and Collaborations
- 8.4. Competitive Dashboard
9. COMPANY PROFILES
- 9.1. Cargill, Incorporated
- 9.2. Archer Daniels Midland
- 9.3. Raizan SA
- 9.4. Sudzucker AG
- 9.5. Tereos
- 9.6. Nordzucker Holding AG
- 9.7. Tongaat Hulett Group
- 9.8. Illovo Sugar (Pty) Ltd (Associated British Foods Plc.)
- 9.9. Dangote Group
- 9.10. E.I.D Parry Limited (Murugappa Group)
- 9.11. Shree Renuka Sugars Ltd. (Wilmar Sugar Holdings)
- 9.12. Dhampur Bio Organics Limited
- 9.13. K.C.P Sugar and Industries Corporation Ltd
- 9.14. NSL Sugar
- 9.15. Central Sugars Refinery Sdn Bhd

