|
|
市場調査レポート
商品コード
1768573
ビジュアルインテリジェンスの世界市場:市場規模・シェア・動向分析 (技術別、最終用途別、用途別、地域別)・展望・将来予測 (2025年~2032年)Global Visual Intelligence Market Size, Share & Industry Analysis Report By Technology, By End-use, By Application, By Regional Outlook and Forecast, 2025 - 2032 |
||||||

|
|||||||
|
|||||||

| ビジュアルインテリジェンスの世界市場:市場規模・シェア・動向分析 (技術別、最終用途別、用途別、地域別)・展望・将来予測 (2025年~2032年) |
|
出版日: 2025年06月20日
発行: KBV Research
ページ情報: 英文 484 Pages
納期: 即納可能
|

全表示
- 概要
- 図表
- 目次
世界のビジュアルインテリジェンス市場規模は、予測期間中に18.8%のCAGRで市場成長し、2032年までに444億1,000万米ドルに達すると予想されています。
KBV Cardinal matrix:ビジュアルインテリジェンス市場競争分析
KBV Cardinal matrixに示された分析に基づくと、Google LLC、Microsoft Corporation、NVIDIA Corporationがビジュアルインテリジェンス市場の先駆者です。2024年11月、NVIDIA CorporationはITサービス管理会社であるGFT Technologiesと提携しました。GFTはNVIDIAと提携し、GFTのデジタル化の専門知識とNVIDIAのAIソフトウェアおよびコンピューティングプラットフォームを組み合わせた高度なAI製造ソリューションを提供しています。このコラボレーションにより、デジタルツインや視覚検査ツールなどのカスタマイズされたAIアプリケーションが可能になり、世界中の製造業における品質管理と運用効率が向上します。Meta Platforms、Inc.、Amazon Web Services、Inc.、Qualcomm Incorporatedなどの企業は、ビジュアルインテリジェンス市場の主要なイノベーターです。
COVID-19の影響分析
COVID-19の流行は、ビジュアルインテリジェンス市場の触媒となり、業界全体で導入が加速しました。短期的には、企業はパンデミックによる混乱に対処し、急速に変化する消費者行動、サプライチェーンの逼迫、そしてリモートワークの課題を理解するために、クラウドベースのビジュアル分析およびコンピュータービジョンプラットフォームへの迅速な転換を図りました。ヘルスケア、特に画像診断分野では、COVID-19肺炎のCTスキャン分析システムなどのAI搭載ツールが大規模に導入され、過負荷の放射線科医の負担を軽減し、遠隔での患者トリアージを可能にしました。このように、COVID-19はビジュアルインテリジェンス市場にプラスの影響を与えました。
市場成長要因
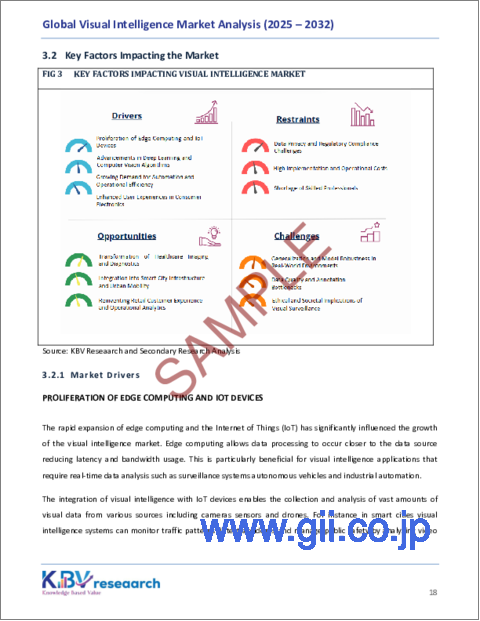
エッジコンピューティングとモノのインターネット(IoT)の急速な拡大は、ビジュアルインテリジェンス市場の成長に大きな影響を与えています。エッジコンピューティングは、データソースに近い場所でデータ処理を可能にするため、レイテンシと帯域幅の使用量を削減します。これは、監視システム、自律走行車、産業オートメーションなど、リアルタイムのデータ分析を必要とするビジュアルインテリジェンス・アプリケーションにとって特に有益です。これらの技術が進化を続けるにつれ、その相乗効果により、ビジュアルインテリジェンス市場の大幅な成長が促進されると予想されます。
さらに、ディープラーニングとコンピュータービジョンアルゴリズムの進化は、ビジュアルインテリジェンス技術の開発において礎石となってきました。これらの進歩により、機械が視覚データを解釈・分析する能力は、これまで達成不可能だったレベルの精度と効率性で向上しました。ディープラーニングモデル、特に畳み込みニューラルネットワーク(CNN)は、自動特徴抽出とパターン認識を可能にすることで、画像・動画分析に革命をもたらしました。これにより、顔認識、物体検出、シーン理解といった用途が大幅に向上しました。これらのアルゴリズムがより堅牢でアクセスしやすくなるにつれて、ビジュアルインテリジェンスソリューションの導入はさらに加速するでしょう。
市場抑制要因
しかし、顔認識や生体認証といったビジュアルインテリジェンス技術の統合は、データプライバシーと規制遵守に関する重大な懸念を引き起こしています。これらのシステムは機密性の高い個人情報を処理することが多いため、欧州連合の一般データ保護規則(GDPR)や米国州消費者プライバシー法(CCPA)といった厳格なデータ保護法の対象となります。これらの規制は、データの収集、保管、使用に関する厳格なガイドラインを義務付けており、組織は堅牢なデータガバナンスフレームワークを実装する必要があります。結論として、ビジュアルインテリジェンスは強力な機能を提供しますが、その導入は、複雑なプライバシー規制への対応、倫理的な使用の確保、そして社会の信頼の維持にかかっています。
バリューチェーン分析
ビジュアルインテリジェンス市場のバリューチェーンは、イノベーションと基盤の進歩を推進する研究開発(R&D)から始まります。これは、テクノロジープロバイダーとインフラプロバイダーによって支えられ、拡張性と効率性を実現します。データ収集とラベリングは、モデルのトレーニングと最適化のための高品質な入力を提供し、そこでインテリジェントモデルが洗練されます。これらのモデルは、製品開発と統合を通じて現実世界のソリューションに統合され、その後、マーケティングと営業活動によって導入が促進されます。流通と展開は市場へのリーチを確保し、エンドユーザーとフィードバックループは重要な洞察を提供します。これらの洞察は、R&Dとインフラ開発にフィードバックされ、動的で反復的なイノベーションループを完成させます。
市場シェア分析
テクノロジー展望
世界のビジュアルインテリジェンス市場は、テクノロジーに基づいて、コンピュータービジョン、ディープラーニング、機械学習、画像処理に分類されます。ディープラーニングセグメントは、2024年に市場の29%の収益シェアを獲得しました。ディープラーニングは、世界のビジュアルインテリジェンス市場における変革をもたらすセグメントであり、システムが視覚データ内の複雑なパターンを高精度で処理・解釈することを可能にします。人工ニューラルネットワークを基盤とするディープラーニングモデルは、人間の認知プロセスを模倣し、膨大なデータセットから学習することで複雑な特徴を検出し、予測を行い、継続的にパフォーマンスを向上させます。
最終用途別の展望
世界ビジュアルインテリジェンス市場は、エンドユーザーに基づいて、小売・Eコマース、製造、医療、防衛・セキュリティ、自動車、その他のエンドユーザーに分類されています。製造業セグメントは、2024年に市場の22%の収益シェアを獲得しました。製造業セグメントは、産業セクター全体における自動化、品質保証、予知保全の需要の高まりを背景に、世界ビジュアルインテリジェンス市場において重要な貢献者となっています。世界中の製造業者が複雑性の増大、サプライチェーンの不安定化、そして労働力の制約を乗り越える中で、ビジュアルインテリジェンス技術は、業務効率を高め、高い生産基準を維持するための中核ソリューションとして浮上しています。
用途別の展望
用途に基づいて、世界のビジュアルインテリジェンス市場は、監視とセキュリティ、品質検査と自動化、顔認識、画像とビデオ分析、予知保全、交通監視、小売分析に分類されます。品質検査と自動化セグメントは、2024年に市場における収益シェアの22%を記録しました。品質検査と自動化セグメントは、世界のビジュアルインテリジェンス市場の重要な柱であり、製品の信頼性、運用効率、製造精度の向上において変革的な役割を果たしています。産業界は、世界の需要に対応し、人的ミスを削減するために生産ラインの自動化を進めており、ビジュアルインテリジェンス技術、特にコンピュータービジョン、ディープラーニング、画像処理は、高速で正確かつスケーラブルな品質チェックを実行するために広く導入されています。
地域展望
地域別に見ると、市場は北米、欧州、アジア太平洋、LAMEA(ラ・メリア、ラテンアメリカ、中東・アフリカ)にわたって分析されています。北米セグメントは、2024年に市場収益シェアの37%を獲得しました。この成長は、この地域の強力な技術インフラ、高度な分析ソリューションの普及率の高さ、そしてデータ保護を強化しながらイノベーションを促進する支援的な規制枠組みによって牽引されました。主要な市場プレーヤーの存在と、AIおよび機械学習技術への投資の増加は、北米が世界市場において優位な地位を築く上でさらに貢献しました。
市場競争と特性
ビジュアルインテリジェンス市場は、AIを活用した画像・動画分析に注力するスタートアップ企業や地域企業が牽引する、熾烈な競争が繰り広げ競合ています。革新性、手頃な価格、そして小売、医療、セキュリティといったニッチな分野への応用が、競争を激化させています。これらの企業は、アジャイル開発と業界固有のカスタマイズを活用して市場セグメントを獲得し、世界展開やブランド影響力が限定的であるにもかかわらず、ダイナミックな市場環境を構築しています。
目次
第1章 市場の範囲と分析手法
- 市場の定義
- 目的
- 市場範囲
- セグメンテーション
- 分析手法
第2章 市場要覧
- 主なハイライト
第3章 市場概要
- イントロダクション
- 概要
- 市場構成とシナリオ
- 概要
- 市場に影響を与える主な要因
- 市場促進要因
- 市場抑制要因
- 市場機会
- 市場の課題
第4章 競争分析:世界市場
- KBV Cardinal Matrix
- 最近の業界全体の戦略的展開
- 事業提携・協力、契約
- 製品発売・拡大
- 企業合併・買収 (M&A)
- 市場シェア分析 (2024年)
- 主要な成功戦略
- 主な戦略
- 主要な戦略的動き
- ポーターのファイブフォース分析
第5章 ビジュアルインテリジェンス市場:バリューチェーン分析
- 研究開発(R&D)
- 技術・インフラプロバイダー
- データ収集・ラベリング
- モデルのトレーニングと最適化
- 製品開発・統合
- マーケティング・セールス
- 提供・実装
- 最終使用とフィードバックループ
第6章 主な顧客基準:ビジュアルインテリジェンス市場
第7章 世界のビジュアルインテリジェンス市場:技術別
- 世界のコンピュータービジョン市場:地域別
- 世界のディープラーニング市場:地域別
- 世界の機械学習市場:地域別
- 世界の画像処理市場:地域別
第8章 世界のビジュアルインテリジェンス市場:最終用途別
- 世界の小売業・eコマース市場:地域別
- 世界の製造業市場:地域別
- 世界の医療市場:地域別
- 世界の防衛・セキュリティ市場:地域別
- 世界の自動車市場:地域別
- 世界のその他の最終用途市場:地域別
第9章 世界のビジュアルインテリジェンス市場:用途別
- 世界の監視・セキュリティ市場:地域別
- 世界の品質検査・自動化市場:地域別
- 世界の顔認識市場:地域別
- 世界の画像・動画分析市場:地域別
- 世界の予知保全市場:地域別
- 世界の交通監視市場:地域別
- 世界の小売分析市場:地域別
第10章 世界のビジュアルインテリジェンス市場:地域別
- 北米
- 北米のビジュアルインテリジェンス市場:国別
- 米国
- カナダ
- メキシコ
- その他北米地域
- 北米のビジュアルインテリジェンス市場:国別
- 欧州
- 欧州のビジュアルインテリジェンス市場:国別
- ドイツ
- 英国
- フランス
- ロシア
- スペイン
- イタリア
- その他欧州地域
- 欧州のビジュアルインテリジェンス市場:国別
- アジア太平洋
- アジア太平洋のビジュアルインテリジェンス市場:国別
- 中国
- 日本
- インド
- 韓国
- シンガポール
- マレーシア
- その他アジア太平洋
- アジア太平洋のビジュアルインテリジェンス市場:国別
- ラテンアメリカ・中東・アフリカ
- ラテンアメリカ・中東・アフリカのビジュアルインテリジェンス市場:国別
- ブラジル
- アルゼンチン
- アラブ首長国連邦
- サウジアラビア
- 南アフリカ
- ナイジェリア
- その他ラテンアメリカ・中東・アフリカ地域
- ラテンアメリカ・中東・アフリカのビジュアルインテリジェンス市場:国別
第11章 企業プロファイル
- NVIDIA Corporation
- IBM Corporation
- Microsoft Corporation
- Amazon Web Services, Inc(Amazon.com, Inc.)
- Google LLC(Alphabet Inc)
- Omron Corporation
- Cognex Corporation
- Meta Platforms, Inc
- Qualcomm Incorporated(Qualcomm Technologies, Inc)
- Intel Corporation
第12章 ビジュアルインテリジェンス市場の成功必須条件
LIST OF TABLES
- TABLE 1 Global Visual Intelligence Market, 2021 - 2024, USD Million
- TABLE 2 Global Visual Intelligence Market, 2025 - 2032, USD Million
- TABLE 3 Partnerships, Collaborations and Agreements- Visual Intelligence Market
- TABLE 4 Product Launches And Product Expansions- Visual Intelligence Market
- TABLE 5 Acquisition and Mergers- Visual Intelligence Market
- TABLE 6 Global Ratings - Visual Intelligence Market
- TABLE 7 Global Visual Intelligence Market by Technology, 2021 - 2024, USD Million
- TABLE 8 Global Visual Intelligence Market by Technology, 2025 - 2032, USD Million
- TABLE 9 Global Computer Vision Market by Region, 2021 - 2024, USD Million
- TABLE 10 Global Computer Vision Market by Region, 2025 - 2032, USD Million
- TABLE 11 Global Deep Learning Market by Region, 2021 - 2024, USD Million
- TABLE 12 Global Deep Learning Market by Region, 2025 - 2032, USD Million
- TABLE 13 Global Machine Learning Market by Region, 2021 - 2024, USD Million
- TABLE 14 Global Machine Learning Market by Region, 2025 - 2032, USD Million
- TABLE 15 Global Image Processing Market by Region, 2021 - 2024, USD Million
- TABLE 16 Global Image Processing Market by Region, 2025 - 2032, USD Million
- TABLE 17 Global Visual Intelligence Market by End-use, 2021 - 2024, USD Million
- TABLE 18 Global Visual Intelligence Market by End-use, 2025 - 2032, USD Million
- TABLE 19 Global Retail & E-commerce Market by Region, 2021 - 2024, USD Million
- TABLE 20 Global Retail & E-commerce Market by Region, 2025 - 2032, USD Million
- TABLE 21 Global Manufacturing Market by Region, 2021 - 2024, USD Million
- TABLE 22 Global Manufacturing Market by Region, 2025 - 2032, USD Million
- TABLE 23 Global Healthcare Market by Region, 2021 - 2024, USD Million
- TABLE 24 Global Healthcare Market by Region, 2025 - 2032, USD Million
- TABLE 25 Global Defense & Security Market by Region, 2021 - 2024, USD Million
- TABLE 26 Global Defense & Security Market by Region, 2025 - 2032, USD Million
- TABLE 27 Global Automotive Market by Region, 2021 - 2024, USD Million
- TABLE 28 Global Automotive Market by Region, 2025 - 2032, USD Million
- TABLE 29 Global Other End-use Market by Region, 2021 - 2024, USD Million
- TABLE 30 Global Other End-use Market by Region, 2025 - 2032, USD Million
- TABLE 31 Global Visual Intelligence Market by Application, 2021 - 2024, USD Million
- TABLE 32 Global Visual Intelligence Market by Application, 2025 - 2032, USD Million
- TABLE 33 Global Surveillance & Security Market by Region, 2021 - 2024, USD Million
- TABLE 34 Global Surveillance & Security Market by Region, 2025 - 2032, USD Million
- TABLE 35 Global Quality Inspection & Automation Market by Region, 2021 - 2024, USD Million
- TABLE 36 Global Quality Inspection & Automation Market by Region, 2025 - 2032, USD Million
- TABLE 37 Global Facial Recognition Market by Region, 2021 - 2024, USD Million
- TABLE 38 Global Facial Recognition Market by Region, 2025 - 2032, USD Million
- TABLE 39 Global Image & Video Analytics Market by Region, 2021 - 2024, USD Million
- TABLE 40 Global Image & Video Analytics Market by Region, 2025 - 2032, USD Million
- TABLE 41 Global Predictive Maintenance Market by Region, 2021 - 2024, USD Million
- TABLE 42 Global Predictive Maintenance Market by Region, 2025 - 2032, USD Million
- TABLE 43 Global Traffic Monitoring Market by Region, 2021 - 2024, USD Million
- TABLE 44 Global Traffic Monitoring Market by Region, 2025 - 2032, USD Million
- TABLE 45 Global Retail Analytics Market by Region, 2021 - 2024, USD Million
- TABLE 46 Global Retail Analytics Market by Region, 2025 - 2032, USD Million
- TABLE 47 Global Visual Intelligence Market by Region, 2021 - 2024, USD Million
- TABLE 48 Global Visual Intelligence Market by Region, 2025 - 2032, USD Million
- TABLE 49 North America Visual Intelligence Market, 2021 - 2024, USD Million
- TABLE 50 North America Visual Intelligence Market, 2025 - 2032, USD Million
- TABLE 51 North America Visual Intelligence Market by Technology, 2021 - 2024, USD Million
- TABLE 52 North America Visual Intelligence Market by Technology, 2025 - 2032, USD Million
- TABLE 53 North America Computer Vision Market by Country, 2021 - 2024, USD Million
- TABLE 54 North America Computer Vision Market by Country, 2025 - 2032, USD Million
- TABLE 55 North America Deep Learning Market by Country, 2021 - 2024, USD Million
- TABLE 56 North America Deep Learning Market by Country, 2025 - 2032, USD Million
- TABLE 57 North America Machine Learning Market by Country, 2021 - 2024, USD Million
- TABLE 58 North America Machine Learning Market by Country, 2025 - 2032, USD Million
- TABLE 59 North America Image Processing Market by Country, 2021 - 2024, USD Million
- TABLE 60 North America Image Processing Market by Country, 2025 - 2032, USD Million
- TABLE 61 North America Visual Intelligence Market by End-use, 2021 - 2024, USD Million
- TABLE 62 North America Visual Intelligence Market by End-use, 2025 - 2032, USD Million
- TABLE 63 North America Retail & E-commerce Market by Country, 2021 - 2024, USD Million
- TABLE 64 North America Retail & E-commerce Market by Country, 2025 - 2032, USD Million
- TABLE 65 North America Manufacturing Market by Country, 2021 - 2024, USD Million
- TABLE 66 North America Manufacturing Market by Country, 2025 - 2032, USD Million
- TABLE 67 North America Healthcare Market by Country, 2021 - 2024, USD Million
- TABLE 68 North America Healthcare Market by Country, 2025 - 2032, USD Million
- TABLE 69 North America Defense & Security Market by Country, 2021 - 2024, USD Million
- TABLE 70 North America Defense & Security Market by Country, 2025 - 2032, USD Million
- TABLE 71 North America Automotive Market by Country, 2021 - 2024, USD Million
- TABLE 72 North America Automotive Market by Country, 2025 - 2032, USD Million
- TABLE 73 North America Other End-use Market by Country, 2021 - 2024, USD Million
- TABLE 74 North America Other End-use Market by Country, 2025 - 2032, USD Million
- TABLE 75 North America Visual Intelligence Market by Application, 2021 - 2024, USD Million
- TABLE 76 North America Visual Intelligence Market by Application, 2025 - 2032, USD Million
- TABLE 77 North America Surveillance & Security Market by Country, 2021 - 2024, USD Million
- TABLE 78 North America Surveillance & Security Market by Country, 2025 - 2032, USD Million
- TABLE 79 North America Quality Inspection & Automation Market by Country, 2021 - 2024, USD Million
- TABLE 80 North America Quality Inspection & Automation Market by Country, 2025 - 2032, USD Million
- TABLE 81 North America Facial Recognition Market by Country, 2021 - 2024, USD Million
- TABLE 82 North America Facial Recognition Market by Country, 2025 - 2032, USD Million
- TABLE 83 North America Image & Video Analytics Market by Country, 2021 - 2024, USD Million
- TABLE 84 North America Image & Video Analytics Market by Country, 2025 - 2032, USD Million
- TABLE 85 North America Predictive Maintenance Market by Country, 2021 - 2024, USD Million
- TABLE 86 North America Predictive Maintenance Market by Country, 2025 - 2032, USD Million
- TABLE 87 North America Traffic Monitoring Market by Country, 2021 - 2024, USD Million
- TABLE 88 North America Traffic Monitoring Market by Country, 2025 - 2032, USD Million
- TABLE 89 North America Retail Analytics Market by Country, 2021 - 2024, USD Million
- TABLE 90 North America Retail Analytics Market by Country, 2025 - 2032, USD Million
- TABLE 91 North America Visual Intelligence Market by Country, 2021 - 2024, USD Million
- TABLE 92 North America Visual Intelligence Market by Country, 2025 - 2032, USD Million
- TABLE 93 US Visual Intelligence Market, 2021 - 2024, USD Million
- TABLE 94 US Visual Intelligence Market, 2025 - 2032, USD Million
- TABLE 95 US Visual Intelligence Market by Technology, 2021 - 2024, USD Million
- TABLE 96 US Visual Intelligence Market by Technology, 2025 - 2032, USD Million
- TABLE 97 US Visual Intelligence Market by End-use, 2021 - 2024, USD Million
- TABLE 98 US Visual Intelligence Market by End-use, 2025 - 2032, USD Million
- TABLE 99 US Visual Intelligence Market by Application, 2021 - 2024, USD Million
- TABLE 100 US Visual Intelligence Market by Application, 2025 - 2032, USD Million
- TABLE 101 Canada Visual Intelligence Market, 2021 - 2024, USD Million
- TABLE 102 Canada Visual Intelligence Market, 2025 - 2032, USD Million
- TABLE 103 Canada Visual Intelligence Market by Technology, 2021 - 2024, USD Million
- TABLE 104 Canada Visual Intelligence Market by Technology, 2025 - 2032, USD Million
- TABLE 105 Canada Visual Intelligence Market by End-use, 2021 - 2024, USD Million
- TABLE 106 Canada Visual Intelligence Market by End-use, 2025 - 2032, USD Million
- TABLE 107 Canada Visual Intelligence Market by Application, 2021 - 2024, USD Million
- TABLE 108 Canada Visual Intelligence Market by Application, 2025 - 2032, USD Million
- TABLE 109 Mexico Visual Intelligence Market, 2021 - 2024, USD Million
- TABLE 110 Mexico Visual Intelligence Market, 2025 - 2032, USD Million
- TABLE 111 Mexico Visual Intelligence Market by Technology, 2021 - 2024, USD Million
- TABLE 112 Mexico Visual Intelligence Market by Technology, 2025 - 2032, USD Million
- TABLE 113 Mexico Visual Intelligence Market by End-use, 2021 - 2024, USD Million
- TABLE 114 Mexico Visual Intelligence Market by End-use, 2025 - 2032, USD Million
- TABLE 115 Mexico Visual Intelligence Market by Application, 2021 - 2024, USD Million
- TABLE 116 Mexico Visual Intelligence Market by Application, 2025 - 2032, USD Million
- TABLE 117 Rest of North America Visual Intelligence Market, 2021 - 2024, USD Million
- TABLE 118 Rest of North America Visual Intelligence Market, 2025 - 2032, USD Million
- TABLE 119 Rest of North America Visual Intelligence Market by Technology, 2021 - 2024, USD Million
- TABLE 120 Rest of North America Visual Intelligence Market by Technology, 2025 - 2032, USD Million
- TABLE 121 Rest of North America Visual Intelligence Market by End-use, 2021 - 2024, USD Million
- TABLE 122 Rest of North America Visual Intelligence Market by End-use, 2025 - 2032, USD Million
- TABLE 123 Rest of North America Visual Intelligence Market by Application, 2021 - 2024, USD Million
- TABLE 124 Rest of North America Visual Intelligence Market by Application, 2025 - 2032, USD Million
- TABLE 125 Europe Visual Intelligence Market, 2021 - 2024, USD Million
- TABLE 126 Europe Visual Intelligence Market, 2025 - 2032, USD Million
- TABLE 127 Europe Visual Intelligence Market by Technology, 2021 - 2024, USD Million
- TABLE 128 Europe Visual Intelligence Market by Technology, 2025 - 2032, USD Million
- TABLE 129 Europe Computer Vision Market by Country, 2021 - 2024, USD Million
- TABLE 130 Europe Computer Vision Market by Country, 2025 - 2032, USD Million
- TABLE 131 Europe Deep Learning Market by Country, 2021 - 2024, USD Million
- TABLE 132 Europe Deep Learning Market by Country, 2025 - 2032, USD Million
- TABLE 133 Europe Machine Learning Market by Country, 2021 - 2024, USD Million
- TABLE 134 Europe Machine Learning Market by Country, 2025 - 2032, USD Million
- TABLE 135 Europe Image Processing Market by Country, 2021 - 2024, USD Million
- TABLE 136 Europe Image Processing Market by Country, 2025 - 2032, USD Million
- TABLE 137 Europe Visual Intelligence Market by End-use, 2021 - 2024, USD Million
- TABLE 138 Europe Visual Intelligence Market by End-use, 2025 - 2032, USD Million
- TABLE 139 Europe Retail & E-commerce Market by Country, 2021 - 2024, USD Million
- TABLE 140 Europe Retail & E-commerce Market by Country, 2025 - 2032, USD Million
- TABLE 141 Europe Manufacturing Market by Country, 2021 - 2024, USD Million
- TABLE 142 Europe Manufacturing Market by Country, 2025 - 2032, USD Million
- TABLE 143 Europe Healthcare Market by Country, 2021 - 2024, USD Million
- TABLE 144 Europe Healthcare Market by Country, 2025 - 2032, USD Million
- TABLE 145 Europe Defense & Security Market by Country, 2021 - 2024, USD Million
- TABLE 146 Europe Defense & Security Market by Country, 2025 - 2032, USD Million
- TABLE 147 Europe Automotive Market by Country, 2021 - 2024, USD Million
- TABLE 148 Europe Automotive Market by Country, 2025 - 2032, USD Million
- TABLE 149 Europe Other End-use Market by Country, 2021 - 2024, USD Million
- TABLE 150 Europe Other End-use Market by Country, 2025 - 2032, USD Million
- TABLE 151 Europe Visual Intelligence Market by Application, 2021 - 2024, USD Million
- TABLE 152 Europe Visual Intelligence Market by Application, 2025 - 2032, USD Million
- TABLE 153 Europe Surveillance & Security Market by Country, 2021 - 2024, USD Million
- TABLE 154 Europe Surveillance & Security Market by Country, 2025 - 2032, USD Million
- TABLE 155 Europe Quality Inspection & Automation Market by Country, 2021 - 2024, USD Million
- TABLE 156 Europe Quality Inspection & Automation Market by Country, 2025 - 2032, USD Million
- TABLE 157 Europe Facial Recognition Market by Country, 2021 - 2024, USD Million
- TABLE 158 Europe Facial Recognition Market by Country, 2025 - 2032, USD Million
- TABLE 159 Europe Image & Video Analytics Market by Country, 2021 - 2024, USD Million
- TABLE 160 Europe Image & Video Analytics Market by Country, 2025 - 2032, USD Million
- TABLE 161 Europe Predictive Maintenance Market by Country, 2021 - 2024, USD Million
- TABLE 162 Europe Predictive Maintenance Market by Country, 2025 - 2032, USD Million
- TABLE 163 Europe Traffic Monitoring Market by Country, 2021 - 2024, USD Million
- TABLE 164 Europe Traffic Monitoring Market by Country, 2025 - 2032, USD Million
- TABLE 165 Europe Retail Analytics Market by Country, 2021 - 2024, USD Million
- TABLE 166 Europe Retail Analytics Market by Country, 2025 - 2032, USD Million
- TABLE 167 Europe Visual Intelligence Market by Country, 2021 - 2024, USD Million
- TABLE 168 Europe Visual Intelligence Market by Country, 2025 - 2032, USD Million
- TABLE 169 Germany Visual Intelligence Market, 2021 - 2024, USD Million
- TABLE 170 Germany Visual Intelligence Market, 2025 - 2032, USD Million
- TABLE 171 Germany Visual Intelligence Market by Technology, 2021 - 2024, USD Million
- TABLE 172 Germany Visual Intelligence Market by Technology, 2025 - 2032, USD Million
- TABLE 173 Germany Visual Intelligence Market by End-use, 2021 - 2024, USD Million
- TABLE 174 Germany Visual Intelligence Market by End-use, 2025 - 2032, USD Million
- TABLE 175 Germany Visual Intelligence Market by Application, 2021 - 2024, USD Million
- TABLE 176 Germany Visual Intelligence Market by Application, 2025 - 2032, USD Million
- TABLE 177 UK Visual Intelligence Market, 2021 - 2024, USD Million
- TABLE 178 UK Visual Intelligence Market, 2025 - 2032, USD Million
- TABLE 179 UK Visual Intelligence Market by Technology, 2021 - 2024, USD Million
- TABLE 180 UK Visual Intelligence Market by Technology, 2025 - 2032, USD Million
- TABLE 181 UK Visual Intelligence Market by End-use, 2021 - 2024, USD Million
- TABLE 182 UK Visual Intelligence Market by End-use, 2025 - 2032, USD Million
- TABLE 183 UK Visual Intelligence Market by Application, 2021 - 2024, USD Million
- TABLE 184 UK Visual Intelligence Market by Application, 2025 - 2032, USD Million
- TABLE 185 France Visual Intelligence Market, 2021 - 2024, USD Million
- TABLE 186 France Visual Intelligence Market, 2025 - 2032, USD Million
- TABLE 187 France Visual Intelligence Market by Technology, 2021 - 2024, USD Million
- TABLE 188 France Visual Intelligence Market by Technology, 2025 - 2032, USD Million
- TABLE 189 France Visual Intelligence Market by End-use, 2021 - 2024, USD Million
- TABLE 190 France Visual Intelligence Market by End-use, 2025 - 2032, USD Million
- TABLE 191 France Visual Intelligence Market by Application, 2021 - 2024, USD Million
- TABLE 192 France Visual Intelligence Market by Application, 2025 - 2032, USD Million
- TABLE 193 Russia Visual Intelligence Market, 2021 - 2024, USD Million
- TABLE 194 Russia Visual Intelligence Market, 2025 - 2032, USD Million
- TABLE 195 Russia Visual Intelligence Market by Technology, 2021 - 2024, USD Million
- TABLE 196 Russia Visual Intelligence Market by Technology, 2025 - 2032, USD Million
- TABLE 197 Russia Visual Intelligence Market by End-use, 2021 - 2024, USD Million
- TABLE 198 Russia Visual Intelligence Market by End-use, 2025 - 2032, USD Million
- TABLE 199 Russia Visual Intelligence Market by Application, 2021 - 2024, USD Million
- TABLE 200 Russia Visual Intelligence Market by Application, 2025 - 2032, USD Million
- TABLE 201 Spain Visual Intelligence Market, 2021 - 2024, USD Million
- TABLE 202 Spain Visual Intelligence Market, 2025 - 2032, USD Million
- TABLE 203 Spain Visual Intelligence Market by Technology, 2021 - 2024, USD Million
- TABLE 204 Spain Visual Intelligence Market by Technology, 2025 - 2032, USD Million
- TABLE 205 Spain Visual Intelligence Market by End-use, 2021 - 2024, USD Million
- TABLE 206 Spain Visual Intelligence Market by End-use, 2025 - 2032, USD Million
- TABLE 207 Spain Visual Intelligence Market by Application, 2021 - 2024, USD Million
- TABLE 208 Spain Visual Intelligence Market by Application, 2025 - 2032, USD Million
- TABLE 209 Italy Visual Intelligence Market, 2021 - 2024, USD Million
- TABLE 210 Italy Visual Intelligence Market, 2025 - 2032, USD Million
- TABLE 211 Italy Visual Intelligence Market by Technology, 2021 - 2024, USD Million
- TABLE 212 Italy Visual Intelligence Market by Technology, 2025 - 2032, USD Million
- TABLE 213 Italy Visual Intelligence Market by End-use, 2021 - 2024, USD Million
- TABLE 214 Italy Visual Intelligence Market by End-use, 2025 - 2032, USD Million
- TABLE 215 Italy Visual Intelligence Market by Application, 2021 - 2024, USD Million
- TABLE 216 Italy Visual Intelligence Market by Application, 2025 - 2032, USD Million
- TABLE 217 Rest of Europe Visual Intelligence Market, 2021 - 2024, USD Million
- TABLE 218 Rest of Europe Visual Intelligence Market, 2025 - 2032, USD Million
- TABLE 219 Rest of Europe Visual Intelligence Market by Technology, 2021 - 2024, USD Million
- TABLE 220 Rest of Europe Visual Intelligence Market by Technology, 2025 - 2032, USD Million
- TABLE 221 Rest of Europe Visual Intelligence Market by End-use, 2021 - 2024, USD Million
- TABLE 222 Rest of Europe Visual Intelligence Market by End-use, 2025 - 2032, USD Million
- TABLE 223 Rest of Europe Visual Intelligence Market by Application, 2021 - 2024, USD Million
- TABLE 224 Rest of Europe Visual Intelligence Market by Application, 2025 - 2032, USD Million
- TABLE 225 Asia Pacific Visual Intelligence Market, 2021 - 2024, USD Million
- TABLE 226 Asia Pacific Visual Intelligence Market, 2025 - 2032, USD Million
- TABLE 227 Asia Pacific Visual Intelligence Market by Technology, 2021 - 2024, USD Million
- TABLE 228 Asia Pacific Visual Intelligence Market by Technology, 2025 - 2032, USD Million
- TABLE 229 Asia Pacific Computer Vision Market by Country, 2021 - 2024, USD Million
- TABLE 230 Asia Pacific Computer Vision Market by Country, 2025 - 2032, USD Million
- TABLE 231 Asia Pacific Deep Learning Market by Country, 2021 - 2024, USD Million
- TABLE 232 Asia Pacific Deep Learning Market by Country, 2025 - 2032, USD Million
- TABLE 233 Asia Pacific Machine Learning Market by Country, 2021 - 2024, USD Million
- TABLE 234 Asia Pacific Machine Learning Market by Country, 2025 - 2032, USD Million
- TABLE 235 Asia Pacific Image Processing Market by Country, 2021 - 2024, USD Million
- TABLE 236 Asia Pacific Image Processing Market by Country, 2025 - 2032, USD Million
- TABLE 237 Asia Pacific Visual Intelligence Market by End-use, 2021 - 2024, USD Million
- TABLE 238 Asia Pacific Visual Intelligence Market by End-use, 2025 - 2032, USD Million
- TABLE 239 Asia Pacific Retail & E-commerce Market by Country, 2021 - 2024, USD Million
- TABLE 240 Asia Pacific Retail & E-commerce Market by Country, 2025 - 2032, USD Million
- TABLE 241 Asia Pacific Manufacturing Market by Country, 2021 - 2024, USD Million
- TABLE 242 Asia Pacific Manufacturing Market by Country, 2025 - 2032, USD Million
- TABLE 243 Asia Pacific Healthcare Market by Country, 2021 - 2024, USD Million
- TABLE 244 Asia Pacific Healthcare Market by Country, 2025 - 2032, USD Million
- TABLE 245 Asia Pacific Defense & Security Market by Country, 2021 - 2024, USD Million
- TABLE 246 Asia Pacific Defense & Security Market by Country, 2025 - 2032, USD Million
- TABLE 247 Asia Pacific Automotive Market by Country, 2021 - 2024, USD Million
- TABLE 248 Asia Pacific Automotive Market by Country, 2025 - 2032, USD Million
- TABLE 249 Asia Pacific Other End-use Market by Country, 2021 - 2024, USD Million
- TABLE 250 Asia Pacific Other End-use Market by Country, 2025 - 2032, USD Million
- TABLE 251 Asia Pacific Visual Intelligence Market by Application, 2021 - 2024, USD Million
- TABLE 252 Asia Pacific Visual Intelligence Market by Application, 2025 - 2032, USD Million
- TABLE 253 Asia Pacific Surveillance & Security Market by Country, 2021 - 2024, USD Million
- TABLE 254 Asia Pacific Surveillance & Security Market by Country, 2025 - 2032, USD Million
- TABLE 255 Asia Pacific Quality Inspection & Automation Market by Country, 2021 - 2024, USD Million
- TABLE 256 Asia Pacific Quality Inspection & Automation Market by Country, 2025 - 2032, USD Million
- TABLE 257 Asia Pacific Facial Recognition Market by Country, 2021 - 2024, USD Million
- TABLE 258 Asia Pacific Facial Recognition Market by Country, 2025 - 2032, USD Million
- TABLE 259 Asia Pacific Image & Video Analytics Market by Country, 2021 - 2024, USD Million
- TABLE 260 Asia Pacific Image & Video Analytics Market by Country, 2025 - 2032, USD Million
- TABLE 261 Asia Pacific Predictive Maintenance Market by Country, 2021 - 2024, USD Million
- TABLE 262 Asia Pacific Predictive Maintenance Market by Country, 2025 - 2032, USD Million
- TABLE 263 Asia Pacific Traffic Monitoring Market by Country, 2021 - 2024, USD Million
- TABLE 264 Asia Pacific Traffic Monitoring Market by Country, 2025 - 2032, USD Million
- TABLE 265 Asia Pacific Retail Analytics Market by Country, 2021 - 2024, USD Million
- TABLE 266 Asia Pacific Retail Analytics Market by Country, 2025 - 2032, USD Million
- TABLE 267 Asia Pacific Visual Intelligence Market by Country, 2021 - 2024, USD Million
- TABLE 268 Asia Pacific Visual Intelligence Market by Country, 2025 - 2032, USD Million
- TABLE 269 China Visual Intelligence Market, 2021 - 2024, USD Million
- TABLE 270 China Visual Intelligence Market, 2025 - 2032, USD Million
- TABLE 271 China Visual Intelligence Market by Technology, 2021 - 2024, USD Million
- TABLE 272 China Visual Intelligence Market by Technology, 2025 - 2032, USD Million
- TABLE 273 China Visual Intelligence Market by End-use, 2021 - 2024, USD Million
- TABLE 274 China Visual Intelligence Market by End-use, 2025 - 2032, USD Million
- TABLE 275 China Visual Intelligence Market by Application, 2021 - 2024, USD Million
- TABLE 276 China Visual Intelligence Market by Application, 2025 - 2032, USD Million
- TABLE 277 Japan Visual Intelligence Market, 2021 - 2024, USD Million
- TABLE 278 Japan Visual Intelligence Market, 2025 - 2032, USD Million
- TABLE 279 Japan Visual Intelligence Market by Technology, 2021 - 2024, USD Million
- TABLE 280 Japan Visual Intelligence Market by Technology, 2025 - 2032, USD Million
- TABLE 281 Japan Visual Intelligence Market by End-use, 2021 - 2024, USD Million
- TABLE 282 Japan Visual Intelligence Market by End-use, 2025 - 2032, USD Million
- TABLE 283 Japan Visual Intelligence Market by Application, 2021 - 2024, USD Million
- TABLE 284 Japan Visual Intelligence Market by Application, 2025 - 2032, USD Million
- TABLE 285 India Visual Intelligence Market, 2021 - 2024, USD Million
- TABLE 286 India Visual Intelligence Market, 2025 - 2032, USD Million
- TABLE 287 India Visual Intelligence Market by Technology, 2021 - 2024, USD Million
- TABLE 288 India Visual Intelligence Market by Technology, 2025 - 2032, USD Million
- TABLE 289 India Visual Intelligence Market by End-use, 2021 - 2024, USD Million
- TABLE 290 India Visual Intelligence Market by End-use, 2025 - 2032, USD Million
- TABLE 291 India Visual Intelligence Market by Application, 2021 - 2024, USD Million
- TABLE 292 India Visual Intelligence Market by Application, 2025 - 2032, USD Million
- TABLE 293 South Korea Visual Intelligence Market, 2021 - 2024, USD Million
- TABLE 294 South Korea Visual Intelligence Market, 2025 - 2032, USD Million
- TABLE 295 South Korea Visual Intelligence Market by Technology, 2021 - 2024, USD Million
- TABLE 296 South Korea Visual Intelligence Market by Technology, 2025 - 2032, USD Million
- TABLE 297 South Korea Visual Intelligence Market by End-use, 2021 - 2024, USD Million
- TABLE 298 South Korea Visual Intelligence Market by End-use, 2025 - 2032, USD Million
- TABLE 299 South Korea Visual Intelligence Market by Application, 2021 - 2024, USD Million
- TABLE 300 South Korea Visual Intelligence Market by Application, 2025 - 2032, USD Million
- TABLE 301 Singapore Visual Intelligence Market, 2021 - 2024, USD Million
- TABLE 302 Singapore Visual Intelligence Market, 2025 - 2032, USD Million
- TABLE 303 Singapore Visual Intelligence Market by Technology, 2021 - 2024, USD Million
- TABLE 304 Singapore Visual Intelligence Market by Technology, 2025 - 2032, USD Million
- TABLE 305 Singapore Visual Intelligence Market by End-use, 2021 - 2024, USD Million
- TABLE 306 Singapore Visual Intelligence Market by End-use, 2025 - 2032, USD Million
- TABLE 307 Singapore Visual Intelligence Market by Application, 2021 - 2024, USD Million
- TABLE 308 Singapore Visual Intelligence Market by Application, 2025 - 2032, USD Million
- TABLE 309 Malaysia Visual Intelligence Market, 2021 - 2024, USD Million
- TABLE 310 Malaysia Visual Intelligence Market, 2025 - 2032, USD Million
- TABLE 311 Malaysia Visual Intelligence Market by Technology, 2021 - 2024, USD Million
- TABLE 312 Malaysia Visual Intelligence Market by Technology, 2025 - 2032, USD Million
- TABLE 313 Malaysia Visual Intelligence Market by End-use, 2021 - 2024, USD Million
- TABLE 314 Malaysia Visual Intelligence Market by End-use, 2025 - 2032, USD Million
- TABLE 315 Malaysia Visual Intelligence Market by Application, 2021 - 2024, USD Million
- TABLE 316 Malaysia Visual Intelligence Market by Application, 2025 - 2032, USD Million
- TABLE 317 Rest of Asia Pacific Visual Intelligence Market, 2021 - 2024, USD Million
- TABLE 318 Rest of Asia Pacific Visual Intelligence Market, 2025 - 2032, USD Million
- TABLE 319 Rest of Asia Pacific Visual Intelligence Market by Technology, 2021 - 2024, USD Million
- TABLE 320 Rest of Asia Pacific Visual Intelligence Market by Technology, 2025 - 2032, USD Million
- TABLE 321 Rest of Asia Pacific Visual Intelligence Market by End-use, 2021 - 2024, USD Million
- TABLE 322 Rest of Asia Pacific Visual Intelligence Market by End-use, 2025 - 2032, USD Million
- TABLE 323 Rest of Asia Pacific Visual Intelligence Market by Application, 2021 - 2024, USD Million
- TABLE 324 Rest of Asia Pacific Visual Intelligence Market by Application, 2025 - 2032, USD Million
- TABLE 325 LAMEA Visual Intelligence Market, 2021 - 2024, USD Million
- TABLE 326 LAMEA Visual Intelligence Market, 2025 - 2032, USD Million
- TABLE 327 LAMEA Visual Intelligence Market by Technology, 2021 - 2024, USD Million
- TABLE 328 LAMEA Visual Intelligence Market by Technology, 2025 - 2032, USD Million
- TABLE 329 LAMEA Computer Vision Market by Country, 2021 - 2024, USD Million
- TABLE 330 LAMEA Computer Vision Market by Country, 2025 - 2032, USD Million
- TABLE 331 LAMEA Deep Learning Market by Country, 2021 - 2024, USD Million
- TABLE 332 LAMEA Deep Learning Market by Country, 2025 - 2032, USD Million
- TABLE 333 LAMEA Machine Learning Market by Country, 2021 - 2024, USD Million
- TABLE 334 LAMEA Machine Learning Market by Country, 2025 - 2032, USD Million
- TABLE 335 LAMEA Image Processing Market by Country, 2021 - 2024, USD Million
- TABLE 336 LAMEA Image Processing Market by Country, 2025 - 2032, USD Million
- TABLE 337 LAMEA Visual Intelligence Market by End-use, 2021 - 2024, USD Million
- TABLE 338 LAMEA Visual Intelligence Market by End-use, 2025 - 2032, USD Million
- TABLE 339 LAMEA Retail & E-commerce Market by Country, 2021 - 2024, USD Million
- TABLE 340 LAMEA Retail & E-commerce Market by Country, 2025 - 2032, USD Million
- TABLE 341 LAMEA Manufacturing Market by Country, 2021 - 2024, USD Million
- TABLE 342 LAMEA Manufacturing Market by Country, 2025 - 2032, USD Million
- TABLE 343 LAMEA Healthcare Market by Country, 2021 - 2024, USD Million
- TABLE 344 LAMEA Healthcare Market by Country, 2025 - 2032, USD Million
- TABLE 345 LAMEA Defense & Security Market by Country, 2021 - 2024, USD Million
- TABLE 346 LAMEA Defense & Security Market by Country, 2025 - 2032, USD Million
- TABLE 347 LAMEA Automotive Market by Country, 2021 - 2024, USD Million
- TABLE 348 LAMEA Automotive Market by Country, 2025 - 2032, USD Million
- TABLE 349 LAMEA Other End-use Market by Country, 2021 - 2024, USD Million
- TABLE 350 LAMEA Other End-use Market by Country, 2025 - 2032, USD Million
- TABLE 351 LAMEA Visual Intelligence Market by Application, 2021 - 2024, USD Million
- TABLE 352 LAMEA Visual Intelligence Market by Application, 2025 - 2032, USD Million
- TABLE 353 LAMEA Surveillance & Security Market by Country, 2021 - 2024, USD Million
- TABLE 354 LAMEA Surveillance & Security Market by Country, 2025 - 2032, USD Million
- TABLE 355 LAMEA Quality Inspection & Automation Market by Country, 2021 - 2024, USD Million
- TABLE 356 LAMEA Quality Inspection & Automation Market by Country, 2025 - 2032, USD Million
- TABLE 357 LAMEA Facial Recognition Market by Country, 2021 - 2024, USD Million
- TABLE 358 LAMEA Facial Recognition Market by Country, 2025 - 2032, USD Million
- TABLE 359 LAMEA Image & Video Analytics Market by Country, 2021 - 2024, USD Million
- TABLE 360 LAMEA Image & Video Analytics Market by Country, 2025 - 2032, USD Million
- TABLE 361 LAMEA Predictive Maintenance Market by Country, 2021 - 2024, USD Million
- TABLE 362 LAMEA Predictive Maintenance Market by Country, 2025 - 2032, USD Million
- TABLE 363 LAMEA Traffic Monitoring Market by Country, 2021 - 2024, USD Million
- TABLE 364 LAMEA Traffic Monitoring Market by Country, 2025 - 2032, USD Million
- TABLE 365 LAMEA Retail Analytics Market by Country, 2021 - 2024, USD Million
- TABLE 366 LAMEA Retail Analytics Market by Country, 2025 - 2032, USD Million
- TABLE 367 LAMEA Visual Intelligence Market by Country, 2021 - 2024, USD Million
- TABLE 368 LAMEA Visual Intelligence Market by Country, 2025 - 2032, USD Million
- TABLE 369 Brazil Visual Intelligence Market, 2021 - 2024, USD Million
- TABLE 370 Brazil Visual Intelligence Market, 2025 - 2032, USD Million
- TABLE 371 Brazil Visual Intelligence Market by Technology, 2021 - 2024, USD Million
- TABLE 372 Brazil Visual Intelligence Market by Technology, 2025 - 2032, USD Million
- TABLE 373 Brazil Visual Intelligence Market by End-use, 2021 - 2024, USD Million
- TABLE 374 Brazil Visual Intelligence Market by End-use, 2025 - 2032, USD Million
- TABLE 375 Brazil Visual Intelligence Market by Application, 2021 - 2024, USD Million
- TABLE 376 Brazil Visual Intelligence Market by Application, 2025 - 2032, USD Million
- TABLE 377 Argentina Visual Intelligence Market, 2021 - 2024, USD Million
- TABLE 378 Argentina Visual Intelligence Market, 2025 - 2032, USD Million
- TABLE 379 Argentina Visual Intelligence Market by Technology, 2021 - 2024, USD Million
- TABLE 380 Argentina Visual Intelligence Market by Technology, 2025 - 2032, USD Million
- TABLE 381 Argentina Visual Intelligence Market by End-use, 2021 - 2024, USD Million
- TABLE 382 Argentina Visual Intelligence Market by End-use, 2025 - 2032, USD Million
- TABLE 383 Argentina Visual Intelligence Market by Application, 2021 - 2024, USD Million
- TABLE 384 Argentina Visual Intelligence Market by Application, 2025 - 2032, USD Million
- TABLE 385 UAE Visual Intelligence Market, 2021 - 2024, USD Million
- TABLE 386 UAE Visual Intelligence Market, 2025 - 2032, USD Million
- TABLE 387 UAE Visual Intelligence Market by Technology, 2021 - 2024, USD Million
- TABLE 388 UAE Visual Intelligence Market by Technology, 2025 - 2032, USD Million
- TABLE 389 UAE Visual Intelligence Market by End-use, 2021 - 2024, USD Million
- TABLE 390 UAE Visual Intelligence Market by End-use, 2025 - 2032, USD Million
- TABLE 391 UAE Visual Intelligence Market by Application, 2021 - 2024, USD Million
- TABLE 392 UAE Visual Intelligence Market by Application, 2025 - 2032, USD Million
- TABLE 393 Saudi Arabia Visual Intelligence Market, 2021 - 2024, USD Million
- TABLE 394 Saudi Arabia Visual Intelligence Market, 2025 - 2032, USD Million
- TABLE 395 Saudi Arabia Visual Intelligence Market by Technology, 2021 - 2024, USD Million
- TABLE 396 Saudi Arabia Visual Intelligence Market by Technology, 2025 - 2032, USD Million
- TABLE 397 Saudi Arabia Visual Intelligence Market by End-use, 2021 - 2024, USD Million
- TABLE 398 Saudi Arabia Visual Intelligence Market by End-use, 2025 - 2032, USD Million
- TABLE 399 Saudi Arabia Visual Intelligence Market by Application, 2021 - 2024, USD Million
- TABLE 400 Saudi Arabia Visual Intelligence Market by Application, 2025 - 2032, USD Million
- TABLE 401 South Africa Visual Intelligence Market, 2021 - 2024, USD Million
- TABLE 402 South Africa Visual Intelligence Market, 2025 - 2032, USD Million
- TABLE 403 South Africa Visual Intelligence Market by Technology, 2021 - 2024, USD Million
- TABLE 404 South Africa Visual Intelligence Market by Technology, 2025 - 2032, USD Million
- TABLE 405 South Africa Visual Intelligence Market by End-use, 2021 - 2024, USD Million
- TABLE 406 South Africa Visual Intelligence Market by End-use, 2025 - 2032, USD Million
- TABLE 407 South Africa Visual Intelligence Market by Application, 2021 - 2024, USD Million
- TABLE 408 South Africa Visual Intelligence Market by Application, 2025 - 2032, USD Million
- TABLE 409 Nigeria Visual Intelligence Market, 2021 - 2024, USD Million
- TABLE 410 Nigeria Visual Intelligence Market, 2025 - 2032, USD Million
- TABLE 411 Nigeria Visual Intelligence Market by Technology, 2021 - 2024, USD Million
- TABLE 412 Nigeria Visual Intelligence Market by Technology, 2025 - 2032, USD Million
- TABLE 413 Nigeria Visual Intelligence Market by End-use, 2021 - 2024, USD Million
- TABLE 414 Nigeria Visual Intelligence Market by End-use, 2025 - 2032, USD Million
- TABLE 415 Nigeria Visual Intelligence Market by Application, 2021 - 2024, USD Million
- TABLE 416 Nigeria Visual Intelligence Market by Application, 2025 - 2032, USD Million
- TABLE 417 Rest of LAMEA Visual Intelligence Market, 2021 - 2024, USD Million
- TABLE 418 Rest of LAMEA Visual Intelligence Market, 2025 - 2032, USD Million
- TABLE 419 Rest of LAMEA Visual Intelligence Market by Technology, 2021 - 2024, USD Million
- TABLE 420 Rest of LAMEA Visual Intelligence Market by Technology, 2025 - 2032, USD Million
- TABLE 421 Rest of LAMEA Visual Intelligence Market by End-use, 2021 - 2024, USD Million
- TABLE 422 Rest of LAMEA Visual Intelligence Market by End-use, 2025 - 2032, USD Million
- TABLE 423 Rest of LAMEA Visual Intelligence Market by Application, 2021 - 2024, USD Million
- TABLE 424 Rest of LAMEA Visual Intelligence Market by Application, 2025 - 2032, USD Million
- TABLE 425 Key Information - NVIDIA Corporation
- TABLE 426 Key Information - IBM Corporation
- TABLE 427 Key Information - Microsoft Corporation
- TABLE 428 Key Information - Amazon Web Services, Inc.
- TABLE 429 Key Information - Google LLC
- TABLE 430 Key Information - Omron Corporation
- TABLE 431 Key information - Cognex Corporation
- TABLE 432 Key Information - Meta Platforms, Inc.
- TABLE 433 Key Information - Qualcomm Incorporated
- TABLE 434 Key Information - Intel Corporation
LIST OF FIGURES
- FIG 1 Methodology for the research
- FIG 2 Global Visual Intelligence Market, 2021 - 2032, USD Million
- FIG 3 Key Factors Impacting Visual Intelligence Market
- FIG 4 KBV Cardinal Matrix
- FIG 5 Market Share Analysis, 2024
- FIG 6 Key Leading Strategies: Percentage Distribution (2021-2025)
- FIG 7 Key Strategic Move: (Partnerships, Collaborations & Agreements: 2023, apr - 2025, may) Leading Players
- FIG 8 PORTER'S FIVE FORCES ANALYSIS - Visual Intelligence Market
- FIG 9 Value Chain Analysis of Visual Intelligence Market
- FIG 10 Key Customer Criteria - Visual Intelligence Market
- FIG 11 Global Visual Intelligence Market share by Technology, 2024
- FIG 12 Global Visual Intelligence Market share by Technology, 2032
- FIG 13 Global Visual Intelligence Market by Technology, 2021 - 2032, USD Million
- FIG 14 Global Visual Intelligence Market share by End-use, 2024
- FIG 15 Global Visual Intelligence Market share by End-use, 2032
- FIG 16 Global Visual Intelligence Market by End-use, 2021 - 2032, USD Million
- FIG 17 Global Visual Intelligence Market share by Application, 2024
- FIG 18 Global Visual Intelligence Market share by Application, 2032
- FIG 19 Global Visual Intelligence Market by Application, 2021 - 2032, USD Million
- FIG 20 Global Visual Intelligence Market share by Region, 2024
- FIG 21 Global Visual Intelligence Market share by Region, 2032
- FIG 22 Global Visual Intelligence Market by Region, 2021 - 2032, USD Million
- FIG 23 North America Visual Intelligence Market, 2021 - 2032, USD Million
- FIG 24 North America Visual Intelligence Market share by Technology, 2024
- FIG 25 North America Visual Intelligence Market share by Technology, 2032
- FIG 26 North America Visual Intelligence Market by Technology, 2021 - 2032, USD Million
- FIG 27 North America Visual Intelligence Market share by End-use, 2024
- FIG 28 North America Visual Intelligence Market share by End-use, 2032
- FIG 29 North America Visual Intelligence Market by End-use, 2021 - 2032, USD Million
- FIG 30 North America Visual Intelligence Market share by Application, 2024
- FIG 31 North America Visual Intelligence Market share by Application, 2032
- FIG 32 North America Visual Intelligence Market by Application, 2021 - 2032, USD Million
- FIG 33 North America Visual Intelligence Market by Country, 2021
- FIG 34 North America Visual Intelligence Market by Country, 2021
- FIG 35 North America Visual Intelligence Market by Country, 2025 - 2032, USD Million
- FIG 36 Europe Visual Intelligence Market, 2021 - 2032, USD Million
- FIG 37 Europe Visual Intelligence Market share by Technology, 2024
- FIG 38 Europe Visual Intelligence Market share by Technology, 2032
- FIG 39 Europe Visual Intelligence Market by Technology, 2021 - 2032, USD Million
- FIG 40 Europe Visual Intelligence Market share by End-use, 2024
- FIG 41 Europe Visual Intelligence Market share by End-use, 2032
- FIG 42 Europe Visual Intelligence Market by End-use, 2021 - 2032, USD Million
- FIG 43 Europe Visual Intelligence Market share by Application, 2024
- FIG 44 Europe Visual Intelligence Market share by Application, 2032
- FIG 45 Europe Visual Intelligence Market by Application, 2021 - 2032, USD Million
- FIG 46 Europe Visual Intelligence Market share by Country, 2024
- FIG 47 Europe Visual Intelligence Market share by Country, 2032
- FIG 48 Europe Visual Intelligence Market by Country, 2025 - 2032, USD Million
- FIG 49 Asia Pacific Visual Intelligence Market, 2021 - 2032, USD Million
- FIG 50 Asia Pacific Visual Intelligence Market share by Technology, 2024
- FIG 51 Asia Pacific Visual Intelligence Market share by Technology, 2032
- FIG 52 Asia Pacific Visual Intelligence Market by Technology, 2021 - 2032, USD Million
- FIG 53 Asia Pacific Visual Intelligence Market share by End-use, 2024
- FIG 54 Asia Pacific Visual Intelligence Market share by End-use, 2032
- FIG 55 Asia Pacific Visual Intelligence Market by End-use, 2021 - 2032, USD Million
- FIG 56 Asia Pacific Visual Intelligence Market share by Application, 2024
- FIG 57 Asia Pacific Visual Intelligence Market share by Application, 2032
- FIG 58 Asia Pacific Visual Intelligence Market by Application, 2021 - 2032, USD Million
- FIG 59 Asia Pacific Visual Intelligence Market share by Country, 2021
- FIG 60 Asia Pacific Visual Intelligence Market share by Country, 2021
- FIG 61 Asia Pacific Visual Intelligence Market share by Country, 2025 - 2032, USD Million
- FIG 62 LAMEA Visual Intelligence Market, 2021 - 2032, USD Million
- FIG 63 LAMEA Visual Intelligence Market share by Technology, 2024
- FIG 64 LAMEA Visual Intelligence Market share by Technology, 2032
- FIG 65 LAMEA Visual Intelligence Market by Technology, 2021 - 2032, USD Million
- FIG 66 LAMEA Visual Intelligence Market share by End-use, 2024
- FIG 67 LAMEA Visual Intelligence Market share by End-use, 2032
- FIG 68 LAMEA Visual Intelligence Market by End-use, 2021 - 2032, USD Million
- FIG 69 LAMEA Visual Intelligence Market share by Application, 2024
- FIG 70 LAMEA Visual Intelligence Market share by Application, 2032
- FIG 71 LAMEA Visual Intelligence Market by Application, 2021 - 2032, USD Million
- FIG 72 LAMEA Visual Intelligence Market by Country, 2021
- FIG 73 LAMEA Visual Intelligence Market by Country, 2021
- FIG 74 LAMEA Visual Intelligence Market by Country, 2025 - 2032, USD Million
- FIG 75 Recent strategies and developments: NVIDIA Corporation
- FIG 76 SWOT Analysis: NVIDIA Corporation
- FIG 77 SWOT Analysis: IBM Corporation
- FIG 78 SWOT Analysis: Microsoft Corporation
- FIG 79 SWOT Analysis: Amazon Web Services, Inc.
- FIG 80 SWOT Analysis: Google LLC
- FIG 81 SWOT Analysis: Omron Corporation
- FIG 82 Recent strategies and developments: Cognex Corporation
- FIG 83 SWOT Analysis: Cognex Corporation
- FIG 84 SWOT Analysis: Meta Platforms, Inc.
- FIG 85 Recent strategies and developments: QUALCOMM Incorporated
- FIG 86 SWOT Analysis: QUALCOMM Incorporated
- FIG 87 SWOT Analysis: Intel corporation
The Global Visual Intelligence Market size is expected to reach $44.41 billion by 2032, rising at a market growth of 18.8% CAGR during the forecast period.
Computer Vision forms the foundational layer of the global visual intelligence market, enabling machines to interpret, understand, and make decisions based on visual inputs such as images and video. As a mature and widely deployed technology, it plays a pivotal role in powering real-time applications across a broad range of industries including manufacturing, healthcare, automotive, retail, defense, and smart cities.
The major strategies followed by the market participants are Partnerships as the key developmental strategy to keep pace with the changing demands of end users. For instance, In May, 2025, Qualcomm Incorporated teamed up with Advantech, a Computer manufacturing company to advance Edge AI for IoT, integrating Qualcomm's Dragonwing tech into Advantech's edge platforms. This collaboration boosts AI performance across industries, supports developer tools for faster deployment, and aims to accelerate intelligent, autonomous edge solutions in robotics, manufacturing, healthcare, and more. Moreover, In February, 2025, Microsoft Corporation announced the partnership with Anduril Industries, a defense industry to advance the U.S. Army's Integrated Visual Augmentation System (IVAS). Anduril will oversee hardware and software development, while Microsoft's Azure cloud will power AI workloads, enhancing battlefield awareness, decision-making, and combat readiness through augmented and virtual reality technologies.
KBV Cardinal Matrix - Visual Intelligence Market Competition Analysis
Based on the Analysis presented in the KBV Cardinal matrix; Google LLC, Microsoft Corporation, and NVIDIA Corporation are the forerunners in the Visual Intelligence Market. In November, 2024, NVIDIA Corporation teamed up with GFT Technologies, an IT service management company partners with NVIDIA to deliver advanced AI manufacturing solutions, combining GFT's digitization expertise with NVIDIA's AI software and computing platforms. This collaboration enables tailored AI applications like digital twins and visual inspection tools, enhancing quality control and operational efficiency in manufacturing industries worldwide. Companies such as Meta Platforms, Inc., Amazon Web Services, Inc., and Qualcomm Incorporated are some of the key innovators in Visual Intelligence Market.
COVID-19 Impact Analysis
The COVID-19 outbreak acted as a catalyst for the visual intelligence market, driving accelerated adoption across industries. In the short term, businesses grappled with pandemic-induced disruption and rapidly pivoted to cloud-based visual analytics and computer-vision platforms to make sense of fast-changing consumer behavior, supply chain pressures, and remote work challenges. Healthcare, especially diagnostic imaging, saw AI-powered tools-like CT-scan analysis systems for COVID pneumonia-deployed at scale, augmenting overburdened radiologists and enabling remote patient triage. Thus, the COVID-19 had positive impact on the visual intelligence market.
Market Growth Factors
The rapid expansion of edge computing and the Internet of Things (IoT) has significantly influenced the growth of the visual intelligence market. Edge computing allows data processing to occur closer to the data source, reducing latency and bandwidth usage. This is particularly beneficial for visual intelligence applications that require real-time data analysis, such as surveillance systems, autonomous vehicles, and industrial automation. As these technologies continue to evolve, their combined impact is expected to drive significant growth in the visual intelligence market.
Additionally, The evolution of deep learning and computer vision algorithms has been a cornerstone in the development of visual intelligence technologies. These advancements have enhanced the ability of machines to interpret and analyze visual data with a level of accuracy and efficiency that was previously unattainable. Deep learning models, particularly convolutional neural networks (CNNs), have revolutionized image and video analysis by enabling automated feature extraction and pattern recognition. This has led to significant improvements in applications such as facial recognition, object detection, and scene understanding. As these algorithms become more robust and accessible, they will further accelerate the adoption of visual intelligence solutions.
Market Restraining Factors
However, The integration of visual intelligence technologies, such as facial recognition and biometric analysis, has raised significant concerns regarding data privacy and regulatory compliance. As these systems often process sensitive personal information, they are subject to stringent data protection laws like the European Union's General Data Protection Regulation (GDPR) and the California Consumer Privacy Act (CCPA) in the United States. These regulations mandate strict guidelines on data collection, storage, and usage, requiring organizations to implement robust data governance frameworks. In conclusion, while visual intelligence offers powerful capabilities, its adoption hinges on navigating complex privacy regulations, ensuring ethical use, and maintaining public trust.
Value Chain Analysis
The value chain of the Visual Intelligence Market begins with Research & Development (R&D), driving innovation and foundational progress. This is supported by Technology and Infrastructure Providers, enabling scalability and efficiency. Data Collection & Labelling feeds quality inputs for Model Training & Optimization, where intelligent models are refined. These models are integrated into real-world solutions through Product Development & Integration, followed by Marketing & Sales efforts to promote adoption. Distribution & Deployment ensures reach across markets, while End Use & Feedback Loop provides critical insights, which cycle back to inform R&D and infrastructure development, completing a dynamic, iterative innovation loop.
Market Share Analysis
Technology Outlook
Based on the Technology, the Global Visual Intelligence market is segmented into Computer Vision, Deep Learning, Machine Learning, and Image Processing. The Deep Learning segment garnered the 29% revenue share in the market in 2024. Deep learning is a transformative segment of the global visual intelligence market, enabling systems to process and interpret complex patterns in visual data with a high degree of accuracy. Built on artificial neural networks, deep learning models mimic human cognitive processes-learning from massive datasets to detect intricate features, make predictions, and continuously improve performance.
End-use Outlook
Based on the End-use, the Global Visual Intelligence market is segmented into Retail & E-commerce, Manufacturing, Healthcare, Defense & Security, Automotive, and Other End-use. The Manufacturing segment acquired the 22% revenue share in the market in 2024. The Manufacturing segment stands as a pivotal contributor to the global visual intelligence market, driven by the escalating demand for automation, quality assurance, and predictive maintenance across industrial sectors. As global manufacturers navigate increasing complexity, supply chain volatility, and labor constraints, visual intelligence technologies have emerged as a core solution to enhance operational efficiency and maintain high production standards.
Application Outlook
Based on the Application, the Global Visual Intelligence market is segmented into Surveillance & Security, Quality Inspection & Automation, Facial Recognition, Image & Video Analytics, Predictive Maintenance, Traffic Monitoring, and Retail Analytics. The Quality Inspection & Automation segment recorded the 22% revenue share in the market in 2024. The Quality Inspection & Automation segment is a vital pillar of the global visual intelligence market, playing a transformative role in enhancing product reliability, operational efficiency, and manufacturing precision. As industries increasingly automate production lines to meet global demand and reduce human error, visual intelligence technologies-particularly computer vision, deep learning, and image processing-are being widely deployed to perform fast, accurate, and scalable quality checks.
Regional Outlook
Region-wise, the market is analyzed across North America, Europe, Asia Pacific, and LAMEA. The North America Segment attained the 37% revenue share in the market in 2024. This growth was driven by the region's strong technological infrastructure, high adoption of advanced analytics solutions, and supportive regulatory frameworks that encouraged innovation while enforcing data protection. The presence of key market players and increased investment in AI and machine learning technologies further contributed to North America's dominant position in the global market.
Market Competition and Attributes
The Visual Intelligence Market is highly competitive, driven by startups and regional firms focusing on AI-powered image and video analytics. Innovation, affordability, and niche applications in retail, healthcare, and security fuel competition. These players leverage agile development and industry-specific customization to capture market segments, creating a dynamic environment despite limited global reach and brand influence.
Recent Strategies Deployed in the Market
- Mar-2025: NVIDIA Corporation unveiled Cosmos World Foundation Models, enabling customizable physical AI reasoning and large-scale synthetic data generation for robotics and autonomous vehicles. Early adopters include Agility Robotics and Uber. The platform supports enhanced AI training through photorealistic simulations, multimodal reasoning, and real-time world generation, accelerating physical AI development.
- Feb-2025: Qualcomm Incorporated teamed up with DevisionX, a software company to advance AI computer vision solutions, integrating DevisionX's Tuba.AI platform with Qualcomm AI Hub for seamless model deployment on Snapdragon devices. This collaboration enhances performance, reduces latency, and simplifies AI vision workflows, enabling businesses to optimize operations and scale AI vision technologies efficiently.
- Jan-2025: Qualcomm Incorporated unveiled its AI On-Prem Appliance Solution and AI Inference Suite, enabling enterprises to run generative AI and computer vision workloads locally. These tools offer cost-effective, secure AI deployment with support from industry leaders like Honeywell, Aetina, and IBM for diverse enterprise and industrial applications.
- Oct-2024: Qualcomm Incorporated teamed up with Mistral AI, an AI company to bring Mistral's advanced generative AI models, Ministral 3B and 8B, to Snapdragon-powered edge devices like smartphones, vehicles, and PCs. This collaboration aims to enable faster, private, and energy-efficient on-device AI, enhancing user experiences with AI assistants and more.
- Apr-2024: Cognex Corporation unveiled the In-Sight L38, the world's first AI-powered 3D vision system. It combines 2D, 3D, and AI technologies for fast, reliable manufacturing inspections. The system simplifies setup, offers high-resolution imaging with patented laser optics, and enhances quality and performance in factory automation.
List of Key Companies Profiled
- NVIDIA Corporation
- IBM Corporation
- Microsoft Corporation
- Amazon Web Services, Inc. (Amazon.com, Inc.)
- Google LLC (Alphabet Inc.)
- Omron Corporation
- Cognex Corporation
- Meta Platforms, Inc.
- Qualcomm Incorporated (Qualcomm Technologies, Inc.)
- Intel Corporation
Global Visual Intelligence Market Report Segmentation
By Technology
- Computer Vision
- Deep Learning
- Machine Learning
- Image Processing
By End-use
- Retail & E-commerce
- Manufacturing
- Healthcare
- Defense & Security
- Automotive
- Other End-use
By Application
- Surveillance & Security
- Quality Inspection & Automation
- Facial Recognition
- Image & Video Analytics
- Predictive Maintenance
- Traffic Monitoring
- Retail Analytics
By Geography
- North America
- US
- Canada
- Mexico
- Rest of North America
- Europe
- Germany
- UK
- France
- Russia
- Spain
- Italy
- Rest of Europe
- Asia Pacific
- China
- Japan
- India
- South Korea
- Singapore
- Malaysia
- Rest of Asia Pacific
- LAMEA
- Brazil
- Argentina
- UAE
- Saudi Arabia
- South Africa
- Nigeria
- Rest of LAMEA
Table of Contents
Chapter 1. Market Scope & Methodology
- 1.1 Market Definition
- 1.2 Objectives
- 1.3 Market Scope
- 1.4 Segmentation
- 1.4.1 Global Visual Intelligence Market, by Technology
- 1.4.2 Global Visual Intelligence Market, by End-use
- 1.4.3 Global Visual Intelligence Market, by Application
- 1.4.4 Global Visual Intelligence Market, by Geography
- 1.5 Methodology for the research
Chapter 2. Market at a Glance
- 2.1 Key Highlights
Chapter 3. Market Overview
- 3.1 Introduction
- 3.1.1 Overview
- 3.2 Key Factors Impacting the Market
- 3.2.1 Market Drivers
- 3.2.2 Market Restraints
- 3.2.3 Market Opportunities
- 3.2.4 Market Challenges
Chapter 4. Competition Analysis - Global
- 4.1 KBV Cardinal Matrix
- 4.2 Recent Industry Wide Strategic Developments
- 4.2.1 Partnerships, Collaborations and Agreements
- 4.2.2 Product Launches and Product Expansions
- 4.2.3 Acquisition and Mergers
- 4.3 Market Share Analysis, 2024
- 4.4 Top Winning Strategies
- 4.4.1 Key Leading Strategies: Percentage Distribution (2021-2025)
- 4.4.2 Key Strategic Move: (Partnerships, Collaborations & Agreements: 2023, Apr - 2025, May) Leading Players
- 4.5 Porter Five Forces Analysis
Chapter 5. Value Chain Analysis of Visual Intelligence Market
- 5.1 Research & Development (R&D)
- 5.2 Technology and Infrastructure Providers
- 5.3 Data Collection & Labelling
- 5.4 Model Training & Optimization
- 5.5 Product Development & Integration
- 5.6 Marketing & Sales
- 5.7 Distribution & Deployment
- 5.8 End Use & Feedback Loop
Chapter 6. Key Customer Criteria: Visual Intelligence Market
Chapter 7. Global Visual Intelligence Market by Technology
- 7.1 Global Computer Vision Market by Region
- 7.2 Global Deep Learning Market by Region
- 7.3 Global Machine Learning Market by Region
- 7.4 Global Image Processing Market by Region
Chapter 8. Global Visual Intelligence Market by End-use
- 8.1 Global Retail & E-commerce Market by Region
- 8.2 Global Manufacturing Market by Region
- 8.3 Global Healthcare Market by Region
- 8.4 Global Defense & Security Market by Region
- 8.5 Global Automotive Market by Region
- 8.6 Global Other End-use Market by Region
Chapter 9. Global Visual Intelligence Market by Application
- 9.1 Global Surveillance & Security Market by Region
- 9.2 Global Quality Inspection & Automation Market by Region
- 9.3 Global Facial Recognition Market by Region
- 9.4 Global Image & Video Analytics Market by Region
- 9.5 Global Predictive Maintenance Market by Region
- 9.6 Global Traffic Monitoring Market by Region
- 9.7 Global Retail Analytics Market by Region
Chapter 10. Global Visual Intelligence Market by Region
- 10.1 North America Visual Intelligence Market
- 10.1.1 North America Visual Intelligence Market by Technology
- 10.1.1.1 North America Computer Vision Market by Country
- 10.1.1.2 North America Deep Learning Market by Country
- 10.1.1.3 North America Machine Learning Market by Country
- 10.1.1.4 North America Image Processing Market by Country
- 10.1.2 North America Visual Intelligence Market by End-use
- 10.1.2.1 North America Retail & E-commerce Market by Country
- 10.1.2.2 North America Manufacturing Market by Country
- 10.1.2.3 North America Healthcare Market by Country
- 10.1.2.4 North America Defense & Security Market by Country
- 10.1.2.5 North America Automotive Market by Country
- 10.1.2.6 North America Other End-use Market by Country
- 10.1.3 North America Visual Intelligence Market by Application
- 10.1.3.1 North America Surveillance & Security Market by Country
- 10.1.3.2 North America Quality Inspection & Automation Market by Country
- 10.1.3.3 North America Facial Recognition Market by Country
- 10.1.3.4 North America Image & Video Analytics Market by Country
- 10.1.3.5 North America Predictive Maintenance Market by Country
- 10.1.3.6 North America Traffic Monitoring Market by Country
- 10.1.3.7 North America Retail Analytics Market by Country
- 10.1.4 North America Visual Intelligence Market by Country
- 10.1.4.1 US Visual Intelligence Market
- 10.1.4.1.1 US Visual Intelligence Market by Technology
- 10.1.4.1.2 US Visual Intelligence Market by End-use
- 10.1.4.1.3 US Visual Intelligence Market by Application
- 10.1.4.2 Canada Visual Intelligence Market
- 10.1.4.2.1 Canada Visual Intelligence Market by Technology
- 10.1.4.2.2 Canada Visual Intelligence Market by End-use
- 10.1.4.2.3 Canada Visual Intelligence Market by Application
- 10.1.4.3 Mexico Visual Intelligence Market
- 10.1.4.3.1 Mexico Visual Intelligence Market by Technology
- 10.1.4.3.2 Mexico Visual Intelligence Market by End-use
- 10.1.4.3.3 Mexico Visual Intelligence Market by Application
- 10.1.4.4 Rest of North America Visual Intelligence Market
- 10.1.4.4.1 Rest of North America Visual Intelligence Market by Technology
- 10.1.4.4.2 Rest of North America Visual Intelligence Market by End-use
- 10.1.4.4.3 Rest of North America Visual Intelligence Market by Application
- 10.1.4.1 US Visual Intelligence Market
- 10.1.1 North America Visual Intelligence Market by Technology
- 10.2 Europe Visual Intelligence Market
- 10.2.1 Europe Visual Intelligence Market by Technology
- 10.2.1.1 Europe Computer Vision Market by Country
- 10.2.1.2 Europe Deep Learning Market by Country
- 10.2.1.3 Europe Machine Learning Market by Country
- 10.2.1.4 Europe Image Processing Market by Country
- 10.2.2 Europe Visual Intelligence Market by End-use
- 10.2.2.1 Europe Retail & E-commerce Market by Country
- 10.2.2.2 Europe Manufacturing Market by Country
- 10.2.2.3 Europe Healthcare Market by Country
- 10.2.2.4 Europe Defense & Security Market by Country
- 10.2.2.5 Europe Automotive Market by Country
- 10.2.2.6 Europe Other End-use Market by Country
- 10.2.3 Europe Visual Intelligence Market by Application
- 10.2.3.1 Europe Surveillance & Security Market by Country
- 10.2.3.2 Europe Quality Inspection & Automation Market by Country
- 10.2.3.3 Europe Facial Recognition Market by Country
- 10.2.3.4 Europe Image & Video Analytics Market by Country
- 10.2.3.5 Europe Predictive Maintenance Market by Country
- 10.2.3.6 Europe Traffic Monitoring Market by Country
- 10.2.3.7 Europe Retail Analytics Market by Country
- 10.2.4 Europe Visual Intelligence Market by Country
- 10.2.4.1 Germany Visual Intelligence Market
- 10.2.4.1.1 Germany Visual Intelligence Market by Technology
- 10.2.4.1.2 Germany Visual Intelligence Market by End-use
- 10.2.4.1.3 Germany Visual Intelligence Market by Application
- 10.2.4.2 UK Visual Intelligence Market
- 10.2.4.2.1 UK Visual Intelligence Market by Technology
- 10.2.4.2.2 UK Visual Intelligence Market by End-use
- 10.2.4.2.3 UK Visual Intelligence Market by Application
- 10.2.4.3 France Visual Intelligence Market
- 10.2.4.3.1 France Visual Intelligence Market by Technology
- 10.2.4.3.2 France Visual Intelligence Market by End-use
- 10.2.4.3.3 France Visual Intelligence Market by Application
- 10.2.4.4 Russia Visual Intelligence Market
- 10.2.4.4.1 Russia Visual Intelligence Market by Technology
- 10.2.4.4.2 Russia Visual Intelligence Market by End-use
- 10.2.4.4.3 Russia Visual Intelligence Market by Application
- 10.2.4.5 Spain Visual Intelligence Market
- 10.2.4.5.1 Spain Visual Intelligence Market by Technology
- 10.2.4.5.2 Spain Visual Intelligence Market by End-use
- 10.2.4.5.3 Spain Visual Intelligence Market by Application
- 10.2.4.6 Italy Visual Intelligence Market
- 10.2.4.6.1 Italy Visual Intelligence Market by Technology
- 10.2.4.6.2 Italy Visual Intelligence Market by End-use
- 10.2.4.6.3 Italy Visual Intelligence Market by Application
- 10.2.4.7 Rest of Europe Visual Intelligence Market
- 10.2.4.7.1 Rest of Europe Visual Intelligence Market by Technology
- 10.2.4.7.2 Rest of Europe Visual Intelligence Market by End-use
- 10.2.4.7.3 Rest of Europe Visual Intelligence Market by Application
- 10.2.4.1 Germany Visual Intelligence Market
- 10.2.1 Europe Visual Intelligence Market by Technology
- 10.3 Asia Pacific Visual Intelligence Market
- 10.3.1 Asia Pacific Visual Intelligence Market by Technology
- 10.3.1.1 Asia Pacific Computer Vision Market by Country
- 10.3.1.2 Asia Pacific Deep Learning Market by Country
- 10.3.1.3 Asia Pacific Machine Learning Market by Country
- 10.3.1.4 Asia Pacific Image Processing Market by Country
- 10.3.2 Asia Pacific Visual Intelligence Market by End-use
- 10.3.2.1 Asia Pacific Retail & E-commerce Market by Country
- 10.3.2.2 Asia Pacific Manufacturing Market by Country
- 10.3.2.3 Asia Pacific Healthcare Market by Country
- 10.3.2.4 Asia Pacific Defense & Security Market by Country
- 10.3.2.5 Asia Pacific Automotive Market by Country
- 10.3.2.6 Asia Pacific Other End-use Market by Country
- 10.3.3 Asia Pacific Visual Intelligence Market by Application
- 10.3.3.1 Asia Pacific Surveillance & Security Market by Country
- 10.3.3.2 Asia Pacific Quality Inspection & Automation Market by Country
- 10.3.3.3 Asia Pacific Facial Recognition Market by Country
- 10.3.3.4 Asia Pacific Image & Video Analytics Market by Country
- 10.3.3.5 Asia Pacific Predictive Maintenance Market by Country
- 10.3.3.6 Asia Pacific Traffic Monitoring Market by Country
- 10.3.3.7 Asia Pacific Retail Analytics Market by Country
- 10.3.4 Asia Pacific Visual Intelligence Market by Country
- 10.3.4.1 China Visual Intelligence Market
- 10.3.4.1.1 China Visual Intelligence Market by Technology
- 10.3.4.1.2 China Visual Intelligence Market by End-use
- 10.3.4.1.3 China Visual Intelligence Market by Application
- 10.3.4.2 Japan Visual Intelligence Market
- 10.3.4.2.1 Japan Visual Intelligence Market by Technology
- 10.3.4.2.2 Japan Visual Intelligence Market by End-use
- 10.3.4.2.3 Japan Visual Intelligence Market by Application
- 10.3.4.3 India Visual Intelligence Market
- 10.3.4.3.1 India Visual Intelligence Market by Technology
- 10.3.4.3.2 India Visual Intelligence Market by End-use
- 10.3.4.3.3 India Visual Intelligence Market by Application
- 10.3.4.4 South Korea Visual Intelligence Market
- 10.3.4.4.1 South Korea Visual Intelligence Market by Technology
- 10.3.4.4.2 South Korea Visual Intelligence Market by End-use
- 10.3.4.4.3 South Korea Visual Intelligence Market by Application
- 10.3.4.5 Singapore Visual Intelligence Market
- 10.3.4.5.1 Singapore Visual Intelligence Market by Technology
- 10.3.4.5.2 Singapore Visual Intelligence Market by End-use
- 10.3.4.5.3 Singapore Visual Intelligence Market by Application
- 10.3.4.6 Malaysia Visual Intelligence Market
- 10.3.4.6.1 Malaysia Visual Intelligence Market by Technology
- 10.3.4.6.2 Malaysia Visual Intelligence Market by End-use
- 10.3.4.6.3 Malaysia Visual Intelligence Market by Application
- 10.3.4.7 Rest of Asia Pacific Visual Intelligence Market
- 10.3.4.7.1 Rest of Asia Pacific Visual Intelligence Market by Technology
- 10.3.4.7.2 Rest of Asia Pacific Visual Intelligence Market by End-use
- 10.3.4.7.3 Rest of Asia Pacific Visual Intelligence Market by Application
- 10.3.4.1 China Visual Intelligence Market
- 10.3.1 Asia Pacific Visual Intelligence Market by Technology
- 10.4 LAMEA Visual Intelligence Market
- 10.4.1 LAMEA Visual Intelligence Market by Technology
- 10.4.1.1 LAMEA Computer Vision Market by Country
- 10.4.1.2 LAMEA Deep Learning Market by Country
- 10.4.1.3 LAMEA Machine Learning Market by Country
- 10.4.1.4 LAMEA Image Processing Market by Country
- 10.4.2 LAMEA Visual Intelligence Market by End-use
- 10.4.2.1 LAMEA Retail & E-commerce Market by Country
- 10.4.2.2 LAMEA Manufacturing Market by Country
- 10.4.2.3 LAMEA Healthcare Market by Country
- 10.4.2.4 LAMEA Defense & Security Market by Country
- 10.4.2.5 LAMEA Automotive Market by Country
- 10.4.2.6 LAMEA Other End-use Market by Country
- 10.4.3 LAMEA Visual Intelligence Market by Application
- 10.4.3.1 LAMEA Surveillance & Security Market by Country
- 10.4.3.2 LAMEA Quality Inspection & Automation Market by Country
- 10.4.3.3 LAMEA Facial Recognition Market by Country
- 10.4.3.4 LAMEA Image & Video Analytics Market by Country
- 10.4.3.5 LAMEA Predictive Maintenance Market by Country
- 10.4.3.6 LAMEA Traffic Monitoring Market by Country
- 10.4.3.7 LAMEA Retail Analytics Market by Country
- 10.4.4 LAMEA Visual Intelligence Market by Country
- 10.4.4.1 Brazil Visual Intelligence Market
- 10.4.4.1.1 Brazil Visual Intelligence Market by Technology
- 10.4.4.1.2 Brazil Visual Intelligence Market by End-use
- 10.4.4.1.3 Brazil Visual Intelligence Market by Application
- 10.4.4.2 Argentina Visual Intelligence Market
- 10.4.4.2.1 Argentina Visual Intelligence Market by Technology
- 10.4.4.2.2 Argentina Visual Intelligence Market by End-use
- 10.4.4.2.3 Argentina Visual Intelligence Market by Application
- 10.4.4.3 UAE Visual Intelligence Market
- 10.4.4.3.1 UAE Visual Intelligence Market by Technology
- 10.4.4.3.2 UAE Visual Intelligence Market by End-use
- 10.4.4.3.3 UAE Visual Intelligence Market by Application
- 10.4.4.4 Saudi Arabia Visual Intelligence Market
- 10.4.4.4.1 Saudi Arabia Visual Intelligence Market by Technology
- 10.4.4.4.2 Saudi Arabia Visual Intelligence Market by End-use
- 10.4.4.4.3 Saudi Arabia Visual Intelligence Market by Application
- 10.4.4.5 South Africa Visual Intelligence Market
- 10.4.4.5.1 South Africa Visual Intelligence Market by Technology
- 10.4.4.5.2 South Africa Visual Intelligence Market by End-use
- 10.4.4.5.3 South Africa Visual Intelligence Market by Application
- 10.4.4.6 Nigeria Visual Intelligence Market
- 10.4.4.6.1 Nigeria Visual Intelligence Market by Technology
- 10.4.4.6.2 Nigeria Visual Intelligence Market by End-use
- 10.4.4.6.3 Nigeria Visual Intelligence Market by Application
- 10.4.4.7 Rest of LAMEA Visual Intelligence Market
- 10.4.4.7.1 Rest of LAMEA Visual Intelligence Market by Technology
- 10.4.4.7.2 Rest of LAMEA Visual Intelligence Market by End-use
- 10.4.4.7.3 Rest of LAMEA Visual Intelligence Market by Application
- 10.4.4.1 Brazil Visual Intelligence Market
- 10.4.1 LAMEA Visual Intelligence Market by Technology
Chapter 11. Company Profiles
- 11.1 NVIDIA Corporation
- 11.1.1 Company Overview
- 11.1.2 Financial Analysis
- 11.1.3 Segmental and Regional Analysis
- 11.1.4 Research & Development Expenses
- 11.1.5 Recent strategies and developments:
- 11.1.5.1 Partnerships, Collaborations, and Agreements:
- 11.1.5.2 Product Launches and Product Expansions:
- 11.1.6 SWOT Analysis
- 11.2 IBM Corporation
- 11.2.1 Company Overview
- 11.2.2 Financial Analysis
- 11.2.3 Regional & Segmental Analysis
- 11.2.4 Research & Development Expenses
- 11.2.5 SWOT Analysis
- 11.3 Microsoft Corporation
- 11.3.1 Company Overview
- 11.3.2 Financial Analysis
- 11.3.3 Segmental and Regional Analysis
- 11.3.4 Research & Development Expenses
- 11.3.5 Recent strategies and developments:
- 11.3.5.1 Partnerships, Collaborations, and Agreements:
- 11.3.6 SWOT Analysis
- 11.4 Amazon Web Services, Inc. (Amazon.com, Inc.)
- 11.4.1 Company Overview
- 11.4.2 Financial Analysis
- 11.4.3 Segmental and Regional Analysis
- 11.4.4 SWOT Analysis
- 11.5 Google LLC (Alphabet Inc.)
- 11.5.1 Company Overview
- 11.5.2 Financial Analysis
- 11.5.3 Segmental and Regional Analysis
- 11.5.4 Research & Development Expenses
- 11.5.5 SWOT Analysis
- 11.6 Omron Corporation
- 11.6.1 Company Overview
- 11.6.2 Financial Analysis
- 11.6.3 Segmental and Regional Analysis
- 11.6.4 Research & Development Expenses
- 11.6.5 Recent strategies and developments:
- 11.6.5.1 Product Launches and Product Expansions:
- 11.6.6 SWOT Analysis
- 11.7 Cognex Corporation
- 11.7.1 Company Overview
- 11.7.2 Financial Analysis
- 11.7.3 Regional Analysis
- 11.7.4 Research & Development Expenses
- 11.7.5 Recent strategies and developments:
- 11.7.5.1 Partnerships, Collaborations, and Agreements:
- 11.7.5.2 Product Launches and Product Expansions:
- 11.7.5.3 Acquisition and Mergers:
- 11.7.6 SWOT Analysis
- 11.8 Meta Platforms, Inc.
- 11.8.1 Company Overview
- 11.8.2 Financial Analysis
- 11.8.3 Segment and Regional Analysis
- 11.8.4 Research & Development Expense
- 11.8.5 SWOT Analysis
- 11.9 Qualcomm Incorporated (Qualcomm Technologies, Inc.)
- 11.9.1 Company Overview
- 11.9.2 Financial Analysis
- 11.9.3 Segmental and Regional Analysis
- 11.9.4 Research & Development Expense
- 11.9.5 Recent strategies and developments:
- 11.9.5.1 Partnerships, Collaborations, and Agreements:
- 11.9.5.2 Product Launches and Product Expansions:
- 11.9.6 SWOT Analysis
- 11.10. Intel Corporation
- 11.10.1 Company Overview
- 11.10.2 Financial Analysis
- 11.10.3 Segmental and Regional Analysis
- 11.10.4 Research & Development Expenses
- 11.10.5 SWOT Analysis

