|
|
市場調査レポート
商品コード
1767859
ヌートロピックの世界市場規模、シェア、動向分析レポート:流通チャネル別、形態別、地域別展望・予測、2025年~2032年Global Nootropics Market Size, Share & Trends Analysis Report By Distribution Channel (Offline and Online), By Form (Capsules & Tablets, Powder, Drinks, and Other Form), By Regional Outlook and Forecast, 2025 - 2032 |
||||||
|
|||||||
|
|||||||

| ヌートロピックの世界市場規模、シェア、動向分析レポート:流通チャネル別、形態別、地域別展望・予測、2025年~2032年 |
|
出版日: 2025年04月30日
発行: KBV Research
ページ情報: 英文 169 Pages
納期: 即納可能
|

全表示
- 概要
- 図表
- 目次
ヌートロピック(脳機能改善薬)市場規模は、予測期間中に14.3%のCAGRで市場成長し、2032年までに133億1,000万米ドルに達すると予想されています。
さらに近年、予防ヘルスケアへの大きなシフトが見られ、人々は病気になってからの治療だけでなく、長期的な健康を重視するようになっています。この変化は、自らの健康を管理したいという欲求の高まりに支えられており、サプリメントや健康食品を日常生活に取り入れる人が増えています。ヌートロピックはこの流れに完全に適合し、脳の健康維持、精神パフォーマンスの向上、そして全体的な健康増進への積極的なアプローチを提供します。したがって、予防ヘルスケアの普及は、ヌートロピックの需要を間違いなく刺激し、世界中の消費者の健康習慣にさらに深く根付いていると言えるでしょう。
しかし、ヌートロピックの普及を阻む大きな障壁の一つは、高額な処方や処方箋が必要な製剤に伴う高コストです。ヌートロピックは認知機能向上効果をもたらしますが、一部の製品には高額な価格設定がつきもので、多くの人々にとって入手が困難となっています。高価な成分や独自のブレンドを配合していることが多いプレミアムヌートロピックは、多くの人にとって、特に低所得層や発展途上地域の人々にとって、価格が高すぎて入手が困難な場合があります。そのため、プレミアムや処方箋が必要なヌートロピックの高コストが入手の困難さを招き、市場の成長を阻害しています。
流通チャネル別展望
流通チャネルに基づいて、市場はオフラインとオンラインに分類されます。オンラインセグメントは、2024年に市場収益の28%を占めました。このセグメントの成長は、インターネット普及率の上昇、スマートフォン利用の増加、そして宅配の利便性によって牽引されました。消費者は、競争力のある価格、製品レビュー、そして世界ブランドへのアクセスに惹かれ、幅広いヌートロピック製品を求めてeコマースプラットフォームを利用するようになりました。デジタルマーケティング戦略とインフルエンサー主導のプロモーションの成長も、このセグメントにおける認知度の向上とオンライン売上の押し上げに重要な役割を果たしました。
形態別展望
形態に基づいて、市場はカプセル/錠剤、粉末、飲料、その他に分類されます。粉末セグメントは2024年に市場の25%の収益シェアを獲得しました。この形態は、フィットネス愛好家、学生、そしてカスタマイズ可能な投与量と素早い吸収を好む健康志向の人々の間で人気を博しました。粉末はスムージーや健康ドリンクによく使用され、ユーザーはヌートロピックを日常生活に簡単に取り入れることができます。パーソナライズされた栄養への需要の高まりと、フレーバー付きおよびフレーバーなしの粉末オプションの入手可能性が、このセグメントの成長に大きく貢献しました。
地域別展望
地域別に見ると、市場は北米、欧州、アジア太平洋、LAMEA(ラ・メリア、中東・アフリカ)で分析されています。アジア太平洋地域は、2024年に市場収益の26%を占めると予測されています。この成長は、中国、インド、日本、韓国などの国々における健康意識の高まり、都市化の進展、そしてメンタルヘルスへの関心の高まりによって牽引されています。この地域では、特に若年成人や学生の間で、脳の健康サプリメントの需要が急増しています。
目次
第1章 市場範囲と調査手法
- 市場の定義
- 目的
- 市場範囲
- セグメンテーション
- 調査手法
第2章 市場要覧
- 主なハイライト
第3章 市場概要
- イントロダクション
- 概要
- 市場構成とシナリオ
- 概要
- 市場に影響を与える主な要因
- 市場促進要因
- 市場抑制要因
- 市場機会
- 市場の課題
- ポーターファイブフォース分析
第4章 世界市場:流通チャネル別
- 世界のオフライン市場:地域別
- 世界のオンライン市場:地域別
第5章 世界市場:形態別
- 世界のカプセル・錠剤市場:地域別
- 世界の粉末市場:地域別
- 世界の飲料市場:地域別
- 世界のその他のフォーム市場:地域別
第6章 世界市場:地域別
- 北米
- 北米の市場:国別
- 米国
- カナダ
- メキシコ
- その他北米地域
- 北米の市場:国別
- 欧州
- 欧州の市場:国別
- ドイツ
- 英国
- フランス
- ロシア
- スペイン
- イタリア
- その他欧州地域
- 欧州の市場:国別
- アジア太平洋地域
- アジア太平洋の市場:国別
- 中国
- 日本
- インド
- 韓国
- シンガポール
- マレーシア
- その他アジア太平洋地域
- アジア太平洋の市場:国別
- ラテンアメリカ・中東・アフリカ
- ラテンアメリカ・中東・アフリカの市場:国別
- ブラジル
- アルゼンチン
- アラブ首長国連邦
- サウジアラビア
- 南アフリカ
- ナイジェリア
- その他ラテンアメリカ・中東・アフリカ地域
- ラテンアメリカ・中東・アフリカの市場:国別
第7章 企業プロファイル
- Onnit Labs, Inc
- Reckitt Benckiser Group PLC
- Natural Stacks
- Mind Lab Pro(Opti-Nutra, ltd)
- PowderCitycom,Ltd
- NOW Foods, Inc
- Purelife Bioscience Co, Ltd.
- Peak Nootropics
- AlternaScript
- Teva Pharmaceutical Industries Ltd
第8章 ヌートロピック市場の成功必須条件
LIST OF TABLES
- TABLE 1 Global Nootropics Market, 2021 - 2024, USD Million
- TABLE 2 Global Nootropics Market, 2025 - 2032, USD Million
- TABLE 3 Global Nootropics Market by Distribution Channel, 2021 - 2024, USD Million
- TABLE 4 Global Nootropics Market by Distribution Channel, 2025 - 2032, USD Million
- TABLE 5 Global Offline Market by Region, 2021 - 2024, USD Million
- TABLE 6 Global Offline Market by Region, 2025 - 2032, USD Million
- TABLE 7 Global Online Market by Region, 2021 - 2024, USD Million
- TABLE 8 Global Online Market by Region, 2025 - 2032, USD Million
- TABLE 9 Global Nootropics Market by Form, 2021 - 2024, USD Million
- TABLE 10 Global Nootropics Market by Form, 2025 - 2032, USD Million
- TABLE 11 Global Capsules & Tablets Market by Region, 2021 - 2024, USD Million
- TABLE 12 Global Capsules & Tablets Market by Region, 2025 - 2032, USD Million
- TABLE 13 Global Powder Market by Region, 2021 - 2024, USD Million
- TABLE 14 Global Powder Market by Region, 2025 - 2032, USD Million
- TABLE 15 Global Drinks Market by Region, 2021 - 2024, USD Million
- TABLE 16 Global Drinks Market by Region, 2025 - 2032, USD Million
- TABLE 17 Global Other Form Market by Region, 2021 - 2024, USD Million
- TABLE 18 Global Other Form Market by Region, 2025 - 2032, USD Million
- TABLE 19 Global Nootropics Market by Region, 2021 - 2024, USD Million
- TABLE 20 Global Nootropics Market by Region, 2025 - 2032, USD Million
- TABLE 21 North America Nootropics Market, 2021 - 2024, USD Million
- TABLE 22 North America Nootropics Market, 2025 - 2032, USD Million
- TABLE 23 North America Nootropics Market by Distribution Channel, 2021 - 2024, USD Million
- TABLE 24 North America Nootropics Market by Distribution Channel, 2025 - 2032, USD Million
- TABLE 25 North America Offline Market by Region, 2021 - 2024, USD Million
- TABLE 26 North America Offline Market by Region, 2025 - 2032, USD Million
- TABLE 27 North America Online Market by Region, 2021 - 2024, USD Million
- TABLE 28 North America Online Market by Region, 2025 - 2032, USD Million
- TABLE 29 North America Nootropics Market by Form, 2021 - 2024, USD Million
- TABLE 30 North America Nootropics Market by Form, 2025 - 2032, USD Million
- TABLE 31 North America Capsules & Tablets Market by Country, 2021 - 2024, USD Million
- TABLE 32 North America Capsules & Tablets Market by Country, 2025 - 2032, USD Million
- TABLE 33 North America Powder Market by Country, 2021 - 2024, USD Million
- TABLE 34 North America Powder Market by Country, 2025 - 2032, USD Million
- TABLE 35 North America Drinks Market by Country, 2021 - 2024, USD Million
- TABLE 36 North America Drinks Market by Country, 2025 - 2032, USD Million
- TABLE 37 North America Other Form Market by Country, 2021 - 2024, USD Million
- TABLE 38 North America Other Form Market by Country, 2025 - 2032, USD Million
- TABLE 39 North America Nootropics Market by Country, 2021 - 2024, USD Million
- TABLE 40 North America Nootropics Market by Country, 2025 - 2032, USD Million
- TABLE 41 US Nootropics Market, 2021 - 2024, USD Million
- TABLE 42 US Nootropics Market, 2025 - 2032, USD Million
- TABLE 43 US Nootropics Market by Distribution Channel, 2021 - 2024, USD Million
- TABLE 44 US Nootropics Market by Distribution Channel, 2025 - 2032, USD Million
- TABLE 45 US Nootropics Market by Form, 2021 - 2024, USD Million
- TABLE 46 US Nootropics Market by Form, 2025 - 2032, USD Million
- TABLE 47 Canada Nootropics Market, 2021 - 2024, USD Million
- TABLE 48 Canada Nootropics Market, 2025 - 2032, USD Million
- TABLE 49 Canada Nootropics Market by Distribution Channel, 2021 - 2024, USD Million
- TABLE 50 Canada Nootropics Market by Distribution Channel, 2025 - 2032, USD Million
- TABLE 51 Canada Nootropics Market by Form, 2021 - 2024, USD Million
- TABLE 52 Canada Nootropics Market by Form, 2025 - 2032, USD Million
- TABLE 53 Mexico Nootropics Market, 2021 - 2024, USD Million
- TABLE 54 Mexico Nootropics Market, 2025 - 2032, USD Million
- TABLE 55 Mexico Nootropics Market by Distribution Channel, 2021 - 2024, USD Million
- TABLE 56 Mexico Nootropics Market by Distribution Channel, 2025 - 2032, USD Million
- TABLE 57 Mexico Nootropics Market by Form, 2021 - 2024, USD Million
- TABLE 58 Mexico Nootropics Market by Form, 2025 - 2032, USD Million
- TABLE 59 Rest of North America Nootropics Market, 2021 - 2024, USD Million
- TABLE 60 Rest of North America Nootropics Market, 2025 - 2032, USD Million
- TABLE 61 Rest of North America Nootropics Market by Distribution Channel, 2021 - 2024, USD Million
- TABLE 62 Rest of North America Nootropics Market by Distribution Channel, 2025 - 2032, USD Million
- TABLE 63 Rest of North America Nootropics Market by Form, 2021 - 2024, USD Million
- TABLE 64 Rest of North America Nootropics Market by Form, 2025 - 2032, USD Million
- TABLE 65 Europe Nootropics Market, 2021 - 2024, USD Million
- TABLE 66 Europe Nootropics Market, 2025 - 2032, USD Million
- TABLE 67 Europe Nootropics Market by Distribution Channel, 2021 - 2024, USD Million
- TABLE 68 Europe Nootropics Market by Distribution Channel, 2025 - 2032, USD Million
- TABLE 69 Europe Offline Market by Country, 2021 - 2024, USD Million
- TABLE 70 Europe Offline Market by Country, 2025 - 2032, USD Million
- TABLE 71 Europe Online Market by Country, 2021 - 2024, USD Million
- TABLE 72 Europe Online Market by Country, 2025 - 2032, USD Million
- TABLE 73 Europe Nootropics Market by Form, 2021 - 2024, USD Million
- TABLE 74 Europe Nootropics Market by Form, 2025 - 2032, USD Million
- TABLE 75 Europe Capsules & Tablets Market by Country, 2021 - 2024, USD Million
- TABLE 76 Europe Capsules & Tablets Market by Country, 2025 - 2032, USD Million
- TABLE 77 Europe Powder Market by Country, 2021 - 2024, USD Million
- TABLE 78 Europe Powder Market by Country, 2025 - 2032, USD Million
- TABLE 79 Europe Drinks Market by Country, 2021 - 2024, USD Million
- TABLE 80 Europe Drinks Market by Country, 2025 - 2032, USD Million
- TABLE 81 Europe Other Form Market by Country, 2021 - 2024, USD Million
- TABLE 82 Europe Other Form Market by Country, 2025 - 2032, USD Million
- TABLE 83 Europe Nootropics Market by Country, 2021 - 2024, USD Million
- TABLE 84 Europe Nootropics Market by Country, 2025 - 2032, USD Million
- TABLE 85 Germany Nootropics Market, 2021 - 2024, USD Million
- TABLE 86 Germany Nootropics Market, 2025 - 2032, USD Million
- TABLE 87 Germany Nootropics Market by Distribution Channel, 2021 - 2024, USD Million
- TABLE 88 Germany Nootropics Market by Distribution Channel, 2025 - 2032, USD Million
- TABLE 89 Germany Nootropics Market by Form, 2021 - 2024, USD Million
- TABLE 90 Germany Nootropics Market by Form, 2025 - 2032, USD Million
- TABLE 91 UK Nootropics Market, 2021 - 2024, USD Million
- TABLE 92 UK Nootropics Market, 2025 - 2032, USD Million
- TABLE 93 UK Nootropics Market by Distribution Channel, 2021 - 2024, USD Million
- TABLE 94 UK Nootropics Market by Distribution Channel, 2025 - 2032, USD Million
- TABLE 95 UK Nootropics Market by Form, 2021 - 2024, USD Million
- TABLE 96 UK Nootropics Market by Form, 2025 - 2032, USD Million
- TABLE 97 France Nootropics Market, 2021 - 2024, USD Million
- TABLE 98 France Nootropics Market, 2025 - 2032, USD Million
- TABLE 99 France Nootropics Market by Distribution Channel, 2021 - 2024, USD Million
- TABLE 100 France Nootropics Market by Distribution Channel, 2025 - 2032, USD Million
- TABLE 101 France Nootropics Market by Form, 2021 - 2024, USD Million
- TABLE 102 France Nootropics Market by Form, 2025 - 2032, USD Million
- TABLE 103 Russia Nootropics Market, 2021 - 2024, USD Million
- TABLE 104 Russia Nootropics Market, 2025 - 2032, USD Million
- TABLE 105 Russia Nootropics Market by Distribution Channel, 2021 - 2024, USD Million
- TABLE 106 Russia Nootropics Market by Distribution Channel, 2025 - 2032, USD Million
- TABLE 107 Russia Nootropics Market by Form, 2021 - 2024, USD Million
- TABLE 108 Russia Nootropics Market by Form, 2025 - 2032, USD Million
- TABLE 109 Spain Nootropics Market, 2021 - 2024, USD Million
- TABLE 110 Spain Nootropics Market, 2025 - 2032, USD Million
- TABLE 111 Spain Nootropics Market by Distribution Channel, 2021 - 2024, USD Million
- TABLE 112 Spain Nootropics Market by Distribution Channel, 2025 - 2032, USD Million
- TABLE 113 Spain Nootropics Market by Form, 2021 - 2024, USD Million
- TABLE 114 Spain Nootropics Market by Form, 2025 - 2032, USD Million
- TABLE 115 Italy Nootropics Market, 2021 - 2024, USD Million
- TABLE 116 Italy Nootropics Market, 2025 - 2032, USD Million
- TABLE 117 Italy Nootropics Market by Distribution Channel, 2021 - 2024, USD Million
- TABLE 118 Italy Nootropics Market by Distribution Channel, 2025 - 2032, USD Million
- TABLE 119 Italy Nootropics Market by Form, 2021 - 2024, USD Million
- TABLE 120 Italy Nootropics Market by Form, 2025 - 2032, USD Million
- TABLE 121 Rest of Europe Nootropics Market, 2021 - 2024, USD Million
- TABLE 122 Rest of Europe Nootropics Market, 2025 - 2032, USD Million
- TABLE 123 Rest of Europe Nootropics Market by Distribution Channel, 2021 - 2024, USD Million
- TABLE 124 Rest of Europe Nootropics Market by Distribution Channel, 2025 - 2032, USD Million
- TABLE 125 Rest of Europe Nootropics Market by Form, 2021 - 2024, USD Million
- TABLE 126 Rest of Europe Nootropics Market by Form, 2025 - 2032, USD Million
- TABLE 127 Asia Pacific Nootropics Market, 2021 - 2024, USD Million
- TABLE 128 Asia Pacific Nootropics Market, 2025 - 2032, USD Million
- TABLE 129 Asia Pacific Nootropics Market by Distribution Channel, 2021 - 2024, USD Million
- TABLE 130 Asia Pacific Nootropics Market by Distribution Channel, 2025 - 2032, USD Million
- TABLE 131 Asia Pacific Offline Market by Country, 2021 - 2024, USD Million
- TABLE 132 Asia Pacific Offline Market by Country, 2025 - 2032, USD Million
- TABLE 133 Asia Pacific Online Market by Country, 2021 - 2024, USD Million
- TABLE 134 Asia Pacific Online Market by Country, 2025 - 2032, USD Million
- TABLE 135 Asia Pacific Nootropics Market by Form, 2021 - 2024, USD Million
- TABLE 136 Asia Pacific Nootropics Market by Form, 2025 - 2032, USD Million
- TABLE 137 Asia Pacific Capsules & Tablets Market by Country, 2021 - 2024, USD Million
- TABLE 138 Asia Pacific Capsules & Tablets Market by Country, 2025 - 2032, USD Million
- TABLE 139 Asia Pacific Powder Market by Country, 2021 - 2024, USD Million
- TABLE 140 Asia Pacific Powder Market by Country, 2025 - 2032, USD Million
- TABLE 141 Asia Pacific Drinks Market by Country, 2021 - 2024, USD Million
- TABLE 142 Asia Pacific Drinks Market by Country, 2025 - 2032, USD Million
- TABLE 143 Asia Pacific Other Form Market by Country, 2021 - 2024, USD Million
- TABLE 144 Asia Pacific Other Form Market by Country, 2025 - 2032, USD Million
- TABLE 145 Asia Pacific Nootropics Market by Country, 2021 - 2024, USD Million
- TABLE 146 Asia Pacific Nootropics Market by Country, 2025 - 2032, USD Million
- TABLE 147 China Nootropics Market, 2021 - 2024, USD Million
- TABLE 148 China Nootropics Market, 2025 - 2032, USD Million
- TABLE 149 China Nootropics Market by Distribution Channel, 2021 - 2024, USD Million
- TABLE 150 China Nootropics Market by Distribution Channel, 2025 - 2032, USD Million
- TABLE 151 China Nootropics Market by Form, 2021 - 2024, USD Million
- TABLE 152 China Nootropics Market by Form, 2025 - 2032, USD Million
- TABLE 153 Japan Nootropics Market, 2021 - 2024, USD Million
- TABLE 154 Japan Nootropics Market, 2025 - 2032, USD Million
- TABLE 155 Japan Nootropics Market by Distribution Channel, 2021 - 2024, USD Million
- TABLE 156 Japan Nootropics Market by Distribution Channel, 2025 - 2032, USD Million
- TABLE 157 Japan Nootropics Market by Form, 2021 - 2024, USD Million
- TABLE 158 Japan Nootropics Market by Form, 2025 - 2032, USD Million
- TABLE 159 India Nootropics Market, 2021 - 2024, USD Million
- TABLE 160 India Nootropics Market, 2025 - 2032, USD Million
- TABLE 161 India Nootropics Market by Distribution Channel, 2021 - 2024, USD Million
- TABLE 162 India Nootropics Market by Distribution Channel, 2025 - 2032, USD Million
- TABLE 163 India Nootropics Market by Form, 2021 - 2024, USD Million
- TABLE 164 India Nootropics Market by Form, 2025 - 2032, USD Million
- TABLE 165 South Korea Nootropics Market, 2021 - 2024, USD Million
- TABLE 166 South Korea Nootropics Market, 2025 - 2032, USD Million
- TABLE 167 South Korea Nootropics Market by Distribution Channel, 2021 - 2024, USD Million
- TABLE 168 South Korea Nootropics Market by Distribution Channel, 2025 - 2032, USD Million
- TABLE 169 South Korea Nootropics Market by Form, 2021 - 2024, USD Million
- TABLE 170 South Korea Nootropics Market by Form, 2025 - 2032, USD Million
- TABLE 171 Singapore Nootropics Market, 2021 - 2024, USD Million
- TABLE 172 Singapore Nootropics Market, 2025 - 2032, USD Million
- TABLE 173 Singapore Nootropics Market by Distribution Channel, 2021 - 2024, USD Million
- TABLE 174 Singapore Nootropics Market by Distribution Channel, 2025 - 2032, USD Million
- TABLE 175 Singapore Nootropics Market by Form, 2021 - 2024, USD Million
- TABLE 176 Singapore Nootropics Market by Form, 2025 - 2032, USD Million
- TABLE 177 Malaysia Nootropics Market, 2021 - 2024, USD Million
- TABLE 178 Malaysia Nootropics Market, 2025 - 2032, USD Million
- TABLE 179 Malaysia Nootropics Market by Distribution Channel, 2021 - 2024, USD Million
- TABLE 180 Malaysia Nootropics Market by Distribution Channel, 2025 - 2032, USD Million
- TABLE 181 Malaysia Nootropics Market by Form, 2021 - 2024, USD Million
- TABLE 182 Malaysia Nootropics Market by Form, 2025 - 2032, USD Million
- TABLE 183 Rest of Asia Pacific Nootropics Market, 2021 - 2024, USD Million
- TABLE 184 Rest of Asia Pacific Nootropics Market, 2025 - 2032, USD Million
- TABLE 185 Rest of Asia Pacific Nootropics Market by Distribution Channel, 2021 - 2024, USD Million
- TABLE 186 Rest of Asia Pacific Nootropics Market by Distribution Channel, 2025 - 2032, USD Million
- TABLE 187 Rest of Asia Pacific Nootropics Market by Form, 2021 - 2024, USD Million
- TABLE 188 Rest of Asia Pacific Nootropics Market by Form, 2025 - 2032, USD Million
- TABLE 189 LAMEA Nootropics Market, 2021 - 2024, USD Million
- TABLE 190 LAMEA Nootropics Market, 2025 - 2032, USD Million
- TABLE 191 LAMEA Nootropics Market by Distribution Channel, 2021 - 2024, USD Million
- TABLE 192 LAMEA Nootropics Market by Distribution Channel, 2025 - 2032, USD Million
- TABLE 193 LAMEA Offline Market by Country, 2021 - 2024, USD Million
- TABLE 194 LAMEA Offline Market by Country, 2025 - 2032, USD Million
- TABLE 195 LAMEA Online Market by Country, 2021 - 2024, USD Million
- TABLE 196 LAMEA Online Market by Country, 2025 - 2032, USD Million
- TABLE 197 LAMEA Nootropics Market by Form, 2021 - 2024, USD Million
- TABLE 198 LAMEA Nootropics Market by Form, 2025 - 2032, USD Million
- TABLE 199 LAMEA Capsules & Tablets Market by Country, 2021 - 2024, USD Million
- TABLE 200 LAMEA Capsules & Tablets Market by Country, 2025 - 2032, USD Million
- TABLE 201 LAMEA Powder Market by Country, 2021 - 2024, USD Million
- TABLE 202 LAMEA Powder Market by Country, 2025 - 2032, USD Million
- TABLE 203 LAMEA Drinks Market by Country, 2021 - 2024, USD Million
- TABLE 204 LAMEA Drinks Market by Country, 2025 - 2032, USD Million
- TABLE 205 LAMEA Other Form Market by Country, 2021 - 2024, USD Million
- TABLE 206 LAMEA Other Form Market by Country, 2025 - 2032, USD Million
- TABLE 207 LAMEA Nootropics Market by Country, 2021 - 2024, USD Million
- TABLE 208 LAMEA Nootropics Market by Country, 2025 - 2032, USD Million
- TABLE 209 Brazil Nootropics Market, 2021 - 2024, USD Million
- TABLE 210 Brazil Nootropics Market, 2025 - 2032, USD Million
- TABLE 211 Brazil Nootropics Market by Distribution Channel, 2021 - 2024, USD Million
- TABLE 212 Brazil Nootropics Market by Distribution Channel, 2025 - 2032, USD Million
- TABLE 213 Brazil Nootropics Market by Form, 2021 - 2024, USD Million
- TABLE 214 Brazil Nootropics Market by Form, 2025 - 2032, USD Million
- TABLE 215 Argentina Nootropics Market, 2021 - 2024, USD Million
- TABLE 216 Argentina Nootropics Market, 2025 - 2032, USD Million
- TABLE 217 Argentina Nootropics Market by Distribution Channel, 2021 - 2024, USD Million
- TABLE 218 Argentina Nootropics Market by Distribution Channel, 2025 - 2032, USD Million
- TABLE 219 Argentina Nootropics Market by Form, 2021 - 2024, USD Million
- TABLE 220 Argentina Nootropics Market by Form, 2025 - 2032, USD Million
- TABLE 221 UAE Nootropics Market, 2021 - 2024, USD Million
- TABLE 222 UAE Nootropics Market, 2025 - 2032, USD Million
- TABLE 223 UAE Nootropics Market by Distribution Channel, 2021 - 2024, USD Million
- TABLE 224 UAE Nootropics Market by Distribution Channel, 2025 - 2032, USD Million
- TABLE 225 UAE Nootropics Market by Form, 2021 - 2024, USD Million
- TABLE 226 UAE Nootropics Market by Form, 2025 - 2032, USD Million
- TABLE 227 Saudi Arabia Nootropics Market, 2021 - 2024, USD Million
- TABLE 228 Saudi Arabia Nootropics Market, 2025 - 2032, USD Million
- TABLE 229 Saudi Arabia Nootropics Market by Distribution Channel, 2021 - 2024, USD Million
- TABLE 230 Saudi Arabia Nootropics Market by Distribution Channel, 2025 - 2032, USD Million
- TABLE 231 Saudi Arabia Nootropics Market by Form, 2021 - 2024, USD Million
- TABLE 232 Saudi Arabia Nootropics Market by Form, 2025 - 2032, USD Million
- TABLE 233 South Africa Nootropics Market, 2021 - 2024, USD Million
- TABLE 234 South Africa Nootropics Market, 2025 - 2032, USD Million
- TABLE 235 South Africa Nootropics Market by Distribution Channel, 2021 - 2024, USD Million
- TABLE 236 South Africa Nootropics Market by Distribution Channel, 2025 - 2032, USD Million
- TABLE 237 South Africa Nootropics Market by Form, 2021 - 2024, USD Million
- TABLE 238 South Africa Nootropics Market by Form, 2025 - 2032, USD Million
- TABLE 239 Nigeria Nootropics Market, 2021 - 2024, USD Million
- TABLE 240 Nigeria Nootropics Market, 2025 - 2032, USD Million
- TABLE 241 Nigeria Nootropics Market by Distribution Channel, 2021 - 2024, USD Million
- TABLE 242 Nigeria Nootropics Market by Distribution Channel, 2025 - 2032, USD Million
- TABLE 243 Nigeria Nootropics Market by Form, 2021 - 2024, USD Million
- TABLE 244 Nigeria Nootropics Market by Form, 2025 - 2032, USD Million
- TABLE 245 Rest of LAMEA Nootropics Market, 2021 - 2024, USD Million
- TABLE 246 Rest of LAMEA Nootropics Market, 2025 - 2032, USD Million
- TABLE 247 Rest of LAMEA Nootropics Market by Distribution Channel, 2021 - 2024, USD Million
- TABLE 248 Rest of LAMEA Nootropics Market by Distribution Channel, 2025 - 2032, USD Million
- TABLE 249 Rest of LAMEA Nootropics Market by Form, 2021 - 2024, USD Million
- TABLE 250 Rest of LAMEA Nootropics Market by Form, 2025 - 2032, USD Million
- TABLE 251 Key Information - Onnit Labs, Inc.
- TABLE 252 Key information - Reckitt Benckiser Group PLC
- TABLE 253 Key Information - Natural Stacks
- TABLE 254 Key Information - Mind Lab Pro
- TABLE 255 Key Information - PowderCity.com,Ltd
- TABLE 256 Key Information - NOW Foods, Inc.
- TABLE 257 Key Information - Purelife Bioscience Co., Ltd.
- TABLE 258 key information - Peak Nootropics
- TABLE 259 key Information - AlternaScript
- TABLE 260 Key Information - Teva Pharmaceuticals Industries Ltd.
LIST OF FIGURES
- FIG 1 Methodology for the research
- FIG 2 Global Nootropics Market, 2021 - 2032, USD Million
- FIG 3 Key Factors Impacting Nootropics Market
- FIG 4 Porter's Five Forces Analysis - Nootropics Market
- FIG 5 Global Nootropics Market share by Distribution Channel, 2024
- FIG 6 Global Nootropics Market by Distribution Channel, 2032
- FIG 7 Global Nootropics Market by Distribution Channel, 2021 - 2032, USD Million
- FIG 8 Global Nootropics Market share by Form, 2024
- FIG 9 Global Nootropics Market by Form, 2032
- FIG 10 Global Nootropics Market by Form, 2021 - 2032, USD Million
- FIG 11 Global Nootropics Market share by Region, 2024
- FIG 12 Global Nootropics Market by Region, 2032
- FIG 13 Global Nootropics Market by Region, 2021 - 2032, USD Million
- FIG 14 North America Nootropics Market, 2021 - 2032, USD Million
- FIG 15 North America Nootropics Market share by Distribution Channel, 2024
- FIG 16 North America Nootropics Market by Distribution Channel, 2032
- FIG 17 North America Nootropics Market by Distribution Channel, 2021 - 2032, USD Million
- FIG 18 North America Nootropics Market share by Form, 2024
- FIG 19 North America Nootropics Market by Form, 2032
- FIG 20 North America Nootropics Market by Form, 2021 - 2032, USD Million
- FIG 21 North America Nootropics Market share by Country, 2024
- FIG 22 North America Nootropics Market by Country, 2032
- FIG 23 North America Nootropics Market by Country, 2021 - 2032, USD Million
- FIG 24 Europe Nootropics Market, 2021 - 2032, USD Million
- FIG 25 Europe Nootropics Market share by Distribution Channel, 2024
- FIG 26 Europe Nootropics Market by Distribution Channel, 2032
- FIG 27 Europe Nootropics Market by Distribution Channel, 2021 - 2032, USD Million
- FIG 28 Europe Nootropics Market share by Form, 2024
- FIG 29 Europe Nootropics Market by Form, 2032
- FIG 30 Europe Nootropics Market by Form, 2021 - 2032, USD Million
- FIG 31 Europe Nootropics Market share by Country, 2024
- FIG 32 Europe Nootropics Market by Country, 2032
- FIG 33 Europe Nootropics Market by Country, 2021 - 2032, USD Million
- FIG 34 Asia Pacific Nootropics Market, 2021 - 2032, USD Million
- FIG 35 Asia Pacific Nootropics Market share by Distribution Channel, 2024
- FIG 36 Asia Pacific Nootropics Market by Distribution Channel, 2032
- FIG 37 Asia Pacific Nootropics Market by Distribution Channel, 2021 - 2032, USD Million
- FIG 38 Asia Pacific Nootropics Market share by Form, 2024
- FIG 39 Asia Pacific Nootropics Market by Form, 2032
- FIG 40 Asia Pacific Nootropics Market by Form, 2021 - 2032, USD Million
- FIG 41 Asia Pacific Nootropics Market share by Country, 2024
- FIG 42 Asia Pacific Nootropics Market by Country, 2032
- FIG 43 Asia Pacific Nootropics Market by Country, 2021 - 2032, USD Million
- FIG 44 LAMEA Nootropics Market, 2021 - 2032, USD Million
- FIG 45 LAMEA Nootropics Market share by Distribution Channel, 2024
- FIG 46 LAMEA Nootropics Market by Distribution Channel, 2032
- FIG 47 LAMEA Nootropics Market by Distribution Channel, 2021 - 2032, USD Million
- FIG 48 LAMEA Nootropics Market share by Form, 2024
- FIG 49 LAMEA Nootropics Market by Form, 2032
- FIG 50 LAMEA Nootropics Market by Form, 2021 - 2032, USD Million
- FIG 51 LAMEA Nootropics Market share by Country, 2024
- FIG 52 LAMEA Nootropics Market by Country, 2032
- FIG 53 LAMEA Nootropics Market by Country, 2021 - 2032, USD Million
- FIG 54 SWOT Analysis: Reckitt Benckiser Group PLC
- FIG 55 SWOT Analysis: NOW Foods, Inc.
- FIG 56 SWOT Analysis: Teva Pharmaceuticals Industries Ltd.
The Global Nootropics Market size is expected to reach $13.31 billion by 2032, rising at a market growth of 14.3% CAGR during the forecast period.
The North America segment recorded 40% revenue share in the market in 2024. The strong market presence in this region can be attributed to the growing consumer awareness regarding cognitive enhancers, the widespread availability of nootropic products, and the well-established health and wellness industry. Additionally, the increasing adoption of dietary supplements among working professionals, students, and older adults further propelled the demand for nootropics.
As awareness around cognitive health and mental performance grows, individuals increasingly seek ways to enhance their mental abilities, memory, focus, and overall brain health. This awareness is being fuelled by a combination of factors, including the rise of social media, increased scientific research, and the increasing importance placed on mental wellness. The modern lifestyle, filled with multitasking, high stress, and a constant demand for peak performance, has led many to recognize the significance of maintaining cognitive sharpness. Thus, increasing awareness about cognitive health and mental performance enhancement drives the market's growth.
Additionally, In recent years, there has been a significant shift toward preventive healthcare, as individuals prioritize long-term wellness rather than solely focusing on treating illnesses once they arise. This shift is driven by a growing desire to take control of one's health, and people are increasingly incorporating supplements and wellness products into their daily routines. Nootropics fit perfectly into this movement, offering a proactive approach to maintaining brain health, boosting mental performance, and enhancing overall well-being. Therefore, as such, the growing adoption of preventive healthcare practices is undoubtedly fuelling the demand for nootropics, further embedding them into the wellness routines of consumers worldwide.
However, One of the significant barriers hindering the widespread adoption of nootropics is the high cost associated with premium or prescription-based formulations. While nootropics offer cognitive enhancement benefits, the high price tag of certain products limits their accessibility to a larger portion of the population. Premium nootropic formulations, which often include a combination of expensive ingredients or proprietary blends, can be cost-prohibitive for many individuals, particularly those in lower income brackets or developing regions. Thus, the high cost of premium or prescription-based nootropic formulations restricting accessibility is impeding the growth of the market.
Distribution Channel Outlook
On the basis of distribution channel, the market is classified into offline and online. The online segment recorded 28% revenue share in the market in 2024. This segment's growth was fuelled by increasing internet penetration, rising smartphone usage, and the convenience of home delivery. Consumers increasingly turned to e-commerce platforms for a wide variety of nootropic products, attracted by competitive pricing, product reviews, and access to global brands. The growth of digital marketing strategies and influencer-driven promotions also played a vital role in enhancing visibility and boosting online sales in this segment.
Form Outlook
Based on form, the market is characterized into capsules/tablets, powder, drinks, and others. The powder segment procured 25% revenue share in the market in 2024. This form gained traction among fitness enthusiasts, students, and health-conscious individuals who preferred customizable dosages and quick absorption. Powders are often used in smoothies or health drinks, allowing users to integrate nootropics into their daily routines easily. The increasing demand for personalized nutrition and the availability of flavoured and unflavoured powder options contributed significantly to the growth of this segment.
Regional Outlook
Region-wise, the market is analyzed across North America, Europe, Asia Pacific, and LAMEA. The Asia Pacific segment witnessed 26% revenue share in the market in 2024. This growth was driven by rising health consciousness, increasing urbanization, and a growing focus on mental well-being across countries like China, India, Japan, and South Korea. The region has witnessed a surge in demand for brain health supplements, especially among young adults and students.
List of Key Companies Profiled
- Onnit Labs, Inc.
- Reckitt Benckiser Group PLC
- Natural Stacks
- Mind Lab Pro (Opti-Nutra, ltd.)
- PowderCity.com,Ltd
- NOW Foods, Inc.
- Purelife Bioscience Co., Ltd.
- Peak Nootropics
- AlternaScript
- Teva Pharmaceutical Industries Ltd.
Global Nootropics Market Report Segmentation
By Distribution Channel
- Offline
- Online
By Form
- Capsules & Tablets
- Powder
- Drinks
- Other Form
By Geography
- North America
- US
- Canada
- Mexico
- Rest of North America
- Europe
- Germany
- UK
- France
- Russia
- Spain
- Italy
- Rest of Europe
- Asia Pacific
- China
- Japan
- India
- South Korea
- Singapore
- Malaysia
- Rest of Asia Pacific
- LAMEA
- Brazil
- Argentina
- UAE
- Saudi Arabia
- South Africa
- Nigeria
- Rest of LAMEA
Table of Contents
Chapter 1. Market Scope & Methodology
- 1.1 Market Definition
- 1.2 Objectives
- 1.3 Market Scope
- 1.4 Segmentation
- 1.4.1 Global Nootropics Market, by Distribution Channel
- 1.4.2 Global Nootropics Market, by Form
- 1.4.3 Global Nootropics Market, by Geography
- 1.5 Methodology for the research
Chapter 2. Market at a Glance
- 2.1 Key Highlights
Chapter 3. Market Overview
- 3.1 Introduction
- 3.1.1 Overview
- 3.1.1.1 Market Composition and Scenario
- 3.1.1 Overview
- 3.2 Key Factors Impacting the Market
- 3.2.1 Market Drivers
- 3.2.2 Market Restraints
- 3.2.3 Market Opportunities
- 3.2.4 Market Challenges
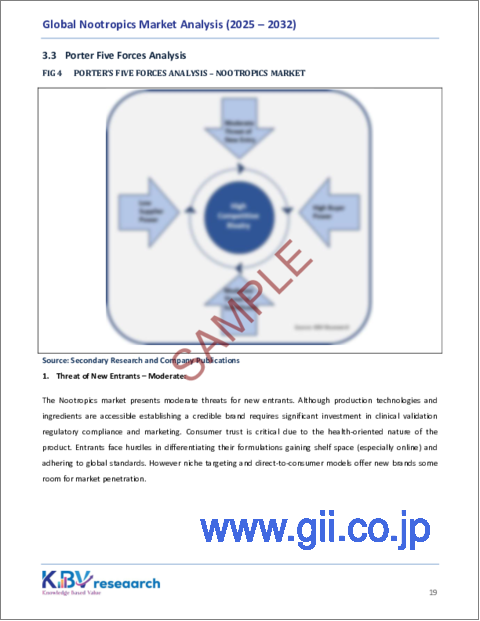
- 3.3 Porter Five Forces Analysis
Chapter 4. Global Nootropics Market by Distribution Channel
- 4.1 Global Offline Market by Region
- 4.2 Global Online Market by Region
Chapter 5. Global Nootropics Market by Form
- 5.1 Global Capsules & Tablets Market by Region
- 5.2 Global Powder Market by Region
- 5.3 Global Drinks Market by Region
- 5.4 Global Other Form Market by Region
Chapter 6. Global Nootropics Market by Region
- 6.1 North America Nootropics Market
- 6.1.1 North America Nootropics Market by Distribution Channel
- 6.1.1.1 North America Offline Market by Region
- 6.1.1.2 North America Online Market by Region
- 6.1.2 North America Nootropics Market by Form
- 6.1.2.1 North America Capsules & Tablets Market by Country
- 6.1.2.2 North America Powder Market by Country
- 6.1.2.3 North America Drinks Market by Country
- 6.1.2.4 North America Other Form Market by Country
- 6.1.3 North America Nootropics Market by Country
- 6.1.3.1 US Nootropics Market
- 6.1.3.1.1 US Nootropics Market by Distribution Channel
- 6.1.3.1.2 US Nootropics Market by Form
- 6.1.3.2 Canada Nootropics Market
- 6.1.3.2.1 Canada Nootropics Market by Distribution Channel
- 6.1.3.2.2 Canada Nootropics Market by Form
- 6.1.3.3 Mexico Nootropics Market
- 6.1.3.3.1 Mexico Nootropics Market by Distribution Channel
- 6.1.3.3.2 Mexico Nootropics Market by Form
- 6.1.3.4 Rest of North America Nootropics Market
- 6.1.3.4.1 Rest of North America Nootropics Market by Distribution Channel
- 6.1.3.4.2 Rest of North America Nootropics Market by Form
- 6.1.3.1 US Nootropics Market
- 6.1.1 North America Nootropics Market by Distribution Channel
- 6.2 Europe Nootropics Market
- 6.2.1 Europe Nootropics Market by Distribution Channel
- 6.2.1.1 Europe Offline Market by Country
- 6.2.1.2 Europe Online Market by Country
- 6.2.2 Europe Nootropics Market by Form
- 6.2.2.1 Europe Capsules & Tablets Market by Country
- 6.2.2.2 Europe Powder Market by Country
- 6.2.2.3 Europe Drinks Market by Country
- 6.2.2.4 Europe Other Form Market by Country
- 6.2.3 Europe Nootropics Market by Country
- 6.2.3.1 Germany Nootropics Market
- 6.2.3.1.1 Germany Nootropics Market by Distribution Channel
- 6.2.3.1.2 Germany Nootropics Market by Form
- 6.2.3.2 UK Nootropics Market
- 6.2.3.2.1 UK Nootropics Market by Distribution Channel
- 6.2.3.2.2 UK Nootropics Market by Form
- 6.2.3.3 France Nootropics Market
- 6.2.3.3.1 France Nootropics Market by Distribution Channel
- 6.2.3.3.2 France Nootropics Market by Form
- 6.2.3.4 Russia Nootropics Market
- 6.2.3.4.1 Russia Nootropics Market by Distribution Channel
- 6.2.3.4.2 Russia Nootropics Market by Form
- 6.2.3.5 Spain Nootropics Market
- 6.2.3.5.1 Spain Nootropics Market by Distribution Channel
- 6.2.3.5.2 Spain Nootropics Market by Form
- 6.2.3.6 Italy Nootropics Market
- 6.2.3.6.1 Italy Nootropics Market by Distribution Channel
- 6.2.3.6.2 Italy Nootropics Market by Form
- 6.2.3.7 Rest of Europe Nootropics Market
- 6.2.3.7.1 Rest of Europe Nootropics Market by Distribution Channel
- 6.2.3.7.2 Rest of Europe Nootropics Market by Form
- 6.2.3.1 Germany Nootropics Market
- 6.2.1 Europe Nootropics Market by Distribution Channel
- 6.3 Asia Pacific Nootropics Market
- 6.3.1 Asia Pacific Nootropics Market by Distribution Channel
- 6.3.1.1 Asia Pacific Offline Market by Country
- 6.3.1.2 Asia Pacific Online Market by Country
- 6.3.2 Asia Pacific Nootropics Market by Form
- 6.3.2.1 Asia Pacific Capsules & Tablets Market by Country
- 6.3.2.2 Asia Pacific Powder Market by Country
- 6.3.2.3 Asia Pacific Drinks Market by Country
- 6.3.2.4 Asia Pacific Other Form Market by Country
- 6.3.3 Asia Pacific Nootropics Market by Country
- 6.3.3.1 China Nootropics Market
- 6.3.3.1.1 China Nootropics Market by Distribution Channel
- 6.3.3.1.2 China Nootropics Market by Form
- 6.3.3.2 Japan Nootropics Market
- 6.3.3.2.1 Japan Nootropics Market by Distribution Channel
- 6.3.3.2.2 Japan Nootropics Market by Form
- 6.3.3.3 India Nootropics Market
- 6.3.3.3.1 India Nootropics Market by Distribution Channel
- 6.3.3.3.2 India Nootropics Market by Form
- 6.3.3.4 South Korea Nootropics Market
- 6.3.3.4.1 South Korea Nootropics Market by Distribution Channel
- 6.3.3.4.2 South Korea Nootropics Market by Form
- 6.3.3.5 Singapore Nootropics Market
- 6.3.3.5.1 Singapore Nootropics Market by Distribution Channel
- 6.3.3.5.2 Singapore Nootropics Market by Form
- 6.3.3.6 Malaysia Nootropics Market
- 6.3.3.6.1 Malaysia Nootropics Market by Distribution Channel
- 6.3.3.6.2 Malaysia Nootropics Market by Form
- 6.3.3.7 Rest of Asia Pacific Nootropics Market
- 6.3.3.7.1 Rest of Asia Pacific Nootropics Market by Distribution Channel
- 6.3.3.7.2 Rest of Asia Pacific Nootropics Market by Form
- 6.3.3.1 China Nootropics Market
- 6.3.1 Asia Pacific Nootropics Market by Distribution Channel
- 6.4 LAMEA Nootropics Market
- 6.4.1 LAMEA Nootropics Market by Distribution Channel
- 6.4.1.1 LAMEA Offline Market by Country
- 6.4.1.2 LAMEA Online Market by Country
- 6.4.2 LAMEA Nootropics Market by Form
- 6.4.2.1 LAMEA Capsules & Tablets Market by Country
- 6.4.2.2 LAMEA Powder Market by Country
- 6.4.2.3 LAMEA Drinks Market by Country
- 6.4.2.4 LAMEA Other Form Market by Country
- 6.4.3 LAMEA Nootropics Market by Country
- 6.4.3.1 Brazil Nootropics Market
- 6.4.3.1.1 Brazil Nootropics Market by Distribution Channel
- 6.4.3.1.2 Brazil Nootropics Market by Form
- 6.4.3.2 Argentina Nootropics Market
- 6.4.3.2.1 Argentina Nootropics Market by Distribution Channel
- 6.4.3.2.2 Argentina Nootropics Market by Form
- 6.4.3.3 UAE Nootropics Market
- 6.4.3.3.1 UAE Nootropics Market by Distribution Channel
- 6.4.3.3.2 UAE Nootropics Market by Form
- 6.4.3.4 Saudi Arabia Nootropics Market
- 6.4.3.4.1 Saudi Arabia Nootropics Market by Distribution Channel
- 6.4.3.4.2 Saudi Arabia Nootropics Market by Form
- 6.4.3.5 South Africa Nootropics Market
- 6.4.3.5.1 South Africa Nootropics Market by Distribution Channel
- 6.4.3.5.2 South Africa Nootropics Market by Form
- 6.4.3.6 Nigeria Nootropics Market
- 6.4.3.6.1 Nigeria Nootropics Market by Distribution Channel
- 6.4.3.6.2 Nigeria Nootropics Market by Form
- 6.4.3.7 Rest of LAMEA Nootropics Market
- 6.4.3.7.1 Rest of LAMEA Nootropics Market by Distribution Channel
- 6.4.3.7.2 Rest of LAMEA Nootropics Market by Form
- 6.4.3.1 Brazil Nootropics Market
- 6.4.1 LAMEA Nootropics Market by Distribution Channel
Chapter 7. Company Profiles
- 7.1 Onnit Labs, Inc.
- 7.1.1 Company Overview
- 7.2 Reckitt Benckiser Group PLC
- 7.2.1 Company Overview
- 7.2.2 Financial Analysis
- 7.2.3 Segmental and Regional Analysis
- 7.2.4 Research & Development Expenses
- 7.2.5 SWOT Analysis
- 7.3 Natural Stacks
- 7.3.1 Company Overview
- 7.4 Mind Lab Pro (Opti-Nutra, ltd.)
- 7.4.1 Company Overview
- 7.5 PowderCity.com,Ltd
- 7.5.1 Company Overview
- 7.6 NOW Foods, Inc.
- 7.6.1 Company Overview
- 7.6.2 SWOT Analysis
- 7.7 Purelife Bioscience Co., Ltd.
- 7.7.1 Company Overview
- 7.8 Peak Nootropics
- 7.8.1 Company Overview
- 7.9 AlternaScript
- 7.9.1 Company Overview
- 7.10. Teva Pharmaceutical Industries Ltd.
- 7.10.1 Company Overview
- 7.10.2 Financial Analysis
- 7.10.3 Segmental Analysis
- 7.10.4 Research & Development Expenses
- 7.10.5 SWOT Analysis
