|
|
市場調査レポート
商品コード
1642328
世界の持続可能なサプライチェーン向けブロックチェーン市場規模、シェア、動向分析レポート、企業規模別、業種別、地域別展望と予測、2024年~2031年Global Blockchain for Sustainable Supply Chains Market Size, Share & Trends Analysis Report By Enterprise Size (Large Enterprise and SMEs), By Industry Vertical, By Regional Outlook and Forecast, 2024 - 2031 |
||||||
|
|||||||
|
|||||||

| 世界の持続可能なサプライチェーン向けブロックチェーン市場規模、シェア、動向分析レポート、企業規模別、業種別、地域別展望と予測、2024年~2031年 |
|
出版日: 2025年01月20日
発行: KBV Research
ページ情報: 英文 210 Pages
納期: 即納可能
|

全表示
- 概要
- 図表
- 目次
持続可能なサプライチェーン向けブロックチェーンの世界市場規模は、予測期間中に49.8%のCAGRで市場成長し、2031年までに17億6,000万米ドルに達すると予想されています。
さらに、今日の消費者は、購入品の倫理的および環境的影響をより意識しており、製品の調達、製造、流通方法についての透明性を求めています。ブロックチェーン技術は、安全で検証可能で透明な製品経路記録を提供することで、この要求に応えます。QRコードをスキャンするか、ブロックチェーンを利用したプラットフォームにアクセスすることで、消費者は原材料の調達、労働慣行、持続可能性認証に関する詳細な情報を見ることができます。結論として、倫理的で持続可能な製品に対する消費者の意識の高まりが、市場の成長を促進します。
しかし、ブロックチェーン技術をサプライチェーンに導入するには、多額の資金と物流の取り組みが必要であり、企業、特に中小企業にとって大きな障害となります。ハードウェアインフラストラクチャ、ソフトウェア開発、システム統合の初期費用は法外な額になる可能性があります。さらに、多くの企業はブロックチェーンプラットフォームに対応するためにレガシーシステムをアップグレードまたは交換する必要があり、初期費用がさらに膨らみます。したがって、初期費用の高さは、特にコスト効率が最優先される業界では、引き続き大きな制約となります。
企業規模の見通し
企業規模に基づいて、市場は大企業と中小企業に分かれています。2023年には、中小企業セグメントが市場で32%の収益シェアを獲得しました。中小企業は、製品のトレーサビリティを強化し、リソース管理を改善し、このような高度なテクノロジーに通常伴う大きな経済的負担なしに持続可能性への取り組みを示すために、ブロックチェーン技術を採用しています。
業界垂直展望
業界別では、市場は小売、製造、飲食品、ヘルスケア、石油・ガス、その他に分類されます。2023年には、製造部門が市場で19%の収益シェアを獲得しました。製造業者は、サプライチェーンの最適化、品質管理の改善、バリューチェーン全体の持続可能性の確保のために、ブロックチェーン技術を採用するケースが増えています。原材料を追跡し、生産プロセスを監視し、製品の真正性を検証する機能により、ブロックチェーンは、運用効率を改善し、規制と持続可能性の目標を達成したいと考えている製造業者にとって貴重なツールとなっています。
地域展望
地域別に見ると、市場は北米、欧州、アジア太平洋、ラテンアメリカ・中東・アフリカにわたって分析されています。アジア太平洋地域は、2023年に市場で28%の収益シェアを生み出しました。この地域の急速な工業化、大規模な製造能力、広大なサプライチェーンネットワークが、この成長に大きく貢献しています。中国、インド、日本などの国々は、サプライチェーンの透明性と持続可能性を向上させるためにブロックチェーン技術を統合する取り組みを先導しています。
目次
第1章 市場範囲と調査手法
- 市場の定義
- 目的
- 市場範囲
- セグメンテーション
- 調査手法
第2章 市場要覧
- 主なハイライト
第3章 市場概要
- イントロダクション
- 概要
- 市場構成とシナリオ
- 概要
- 市場に影響を与える主な要因
- 市場促進要因
- 市場抑制要因
- 市場機会
- 市場の課題
第4章 競合分析- 世界
- 市場シェア分析、2023年
- ポーターのファイブフォース分析
第5章 世界の持続可能なサプライチェーン向けブロックチェーン市場:企業規模別
- 世界の大企業市場:地域別
- 世界の中小企業市場:地域別
第6章 世界の持続可能なサプライチェーン向けブロックチェーン市場:業界別
- 世界の小売市場:地域別
- 世界の製造市場:地域別
- 世界の食品・飲料市場:地域別
- 世界のヘルスケア市場:地域別
- 世界の石油・ガス市場:地域別
- 世界その他の産業垂直市場:地域別
第7章 世界の持続可能なサプライチェーン向けブロックチェーン市場:地域別
- 北米
- 北米の持続可能なサプライチェーン向けブロックチェーン市場:国別
- 米国
- カナダ
- メキシコ
- その他北米地域
- 北米の持続可能なサプライチェーン向けブロックチェーン市場:国別
- 欧州
- 欧州の持続可能なサプライチェーン向けブロックチェーン市場:国別
- ドイツ
- 英国
- フランス
- ロシア
- スペイン
- イタリア
- その他欧州地域
- 欧州の持続可能なサプライチェーン向けブロックチェーン市場:国別
- アジア太平洋地域
- アジア太平洋の持続可能なサプライチェーン向けブロックチェーン市場:国別
- 中国
- 日本
- インド
- 韓国
- シンガポール
- マレーシア
- その他アジア太平洋地域
- アジア太平洋の持続可能なサプライチェーン向けブロックチェーン市場:国別
- ラテンアメリカ・中東・アフリカ
- ラテンアメリカ・中東・アフリカの持続可能なサプライチェーン向けブロックチェーン市場:国別
- ブラジル
- アルゼンチン
- アラブ首長国連邦
- サウジアラビア
- 南アフリカ
- ナイジェリア
- その他ラテンアメリカ・中東・アフリカ地域
- ラテンアメリカ・中東・アフリカの持続可能なサプライチェーン向けブロックチェーン市場:国別
第8章 企業プロファイル
- IBM Corporation
- Microsoft Corporation
- SAP SE
- Oracle Corporation
- Accenture PLC
- Dell Technologies, Inc
- Intel Corporation
- Walmart, Inc
- Bitfury Group Limited
- OriginTrail
第9章 持続可能なサプライチェーン向けブロックチェーンの勝利の必須事項
LIST OF TABLES
- TABLE 1 Global Blockchain for Sustainable Supply Chains Market, 2020 - 2023, USD Thousands
- TABLE 2 Global Blockchain for Sustainable Supply Chains Market, 2024 - 2031, USD Thousands
- TABLE 3 Global Blockchain for Sustainable Supply Chains Market by Enterprise Size, 2020 - 2023, USD Thousands
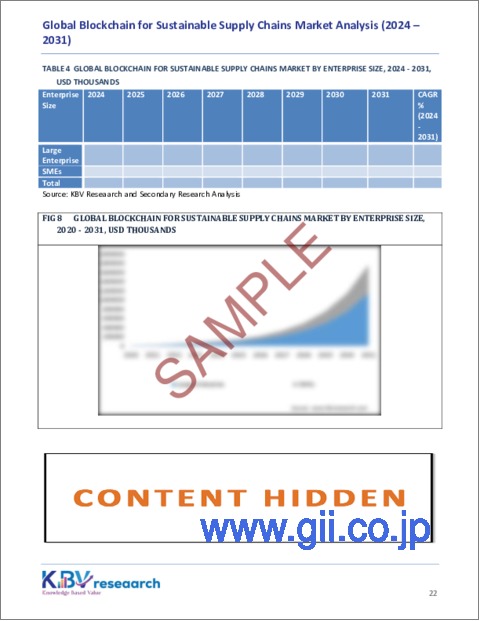
- TABLE 4 Global Blockchain for Sustainable Supply Chains Market by Enterprise Size, 2024 - 2031, USD Thousands
- TABLE 5 Global Large Enterprise Market by Region, 2020 - 2023, USD Thousands
- TABLE 6 Global Large Enterprise Market by Region, 2024 - 2031, USD Thousands
- TABLE 7 Global SMEs Market by Region, 2020 - 2023, USD Thousands
- TABLE 8 Global SMEs Market by Region, 2024 - 2031, USD Thousands
- TABLE 9 Global Blockchain for Sustainable Supply Chains Market by Industry Vertical, 2020 - 2023, USD Thousands
- TABLE 10 Global Blockchain for Sustainable Supply Chains Market by Industry Vertical, 2024 - 2031, USD Thousands
- TABLE 11 Global Retail Market by Region, 2020 - 2023, USD Thousands
- TABLE 12 Global Retail Market by Region, 2024 - 2031, USD Thousands
- TABLE 13 Global Manufacturing Market by Region, 2020 - 2023, USD Thousands
- TABLE 14 Global Manufacturing Market by Region, 2024 - 2031, USD Thousands
- TABLE 15 Global Food & Beverages Market by Region, 2020 - 2023, USD Thousands
- TABLE 16 Global Food & Beverages Market by Region, 2024 - 2031, USD Thousands
- TABLE 17 Global Healthcare Market by Region, 2020 - 2023, USD Thousands
- TABLE 18 Global Healthcare Market by Region, 2024 - 2031, USD Thousands
- TABLE 19 Global Oil & Gas Market by Region, 2020 - 2023, USD Thousands
- TABLE 20 Global Oil & Gas Market by Region, 2024 - 2031, USD Thousands
- TABLE 21 Global Other Industry Vertical Market by Region, 2020 - 2023, USD Thousands
- TABLE 22 Global Other Industry Vertical Market by Region, 2024 - 2031, USD Thousands
- TABLE 23 Global Blockchain for Sustainable Supply Chains Market by Region, 2020 - 2023, USD Thousands
- TABLE 24 Global Blockchain for Sustainable Supply Chains Market by Region, 2024 - 2031, USD Thousands
- TABLE 25 North America Blockchain for Sustainable Supply Chains Market, 2020 - 2023, USD Thousands
- TABLE 26 North America Blockchain for Sustainable Supply Chains Market, 2024 - 2031, USD Thousands
- TABLE 27 North America Blockchain for Sustainable Supply Chains Market by Enterprise Size, 2020 - 2023, USD Thousands
- TABLE 28 North America Blockchain for Sustainable Supply Chains Market by Enterprise Size, 2024 - 2031, USD Thousands
- TABLE 29 North America Large Enterprise Market by Country, 2020 - 2023, USD Thousands
- TABLE 30 North America Large Enterprise Market by Country, 2024 - 2031, USD Thousands
- TABLE 31 North America SMEs Market by Country, 2020 - 2023, USD Thousands
- TABLE 32 North America SMEs Market by Country, 2024 - 2031, USD Thousands
- TABLE 33 North America Blockchain for Sustainable Supply Chains Market by Industry Vertical, 2020 - 2023, USD Thousands
- TABLE 34 North America Blockchain for Sustainable Supply Chains Market by Industry Vertical, 2024 - 2031, USD Thousands
- TABLE 35 North America Retail Market by Country, 2020 - 2023, USD Thousands
- TABLE 36 North America Retail Market by Country, 2024 - 2031, USD Thousands
- TABLE 37 North America Manufacturing Market by Country, 2020 - 2023, USD Thousands
- TABLE 38 North America Manufacturing Market by Country, 2024 - 2031, USD Thousands
- TABLE 39 North America Food & Beverages Market by Country, 2020 - 2023, USD Thousands
- TABLE 40 North America Food & Beverages Market by Country, 2024 - 2031, USD Thousands
- TABLE 41 North America Healthcare Market by Country, 2020 - 2023, USD Thousands
- TABLE 42 North America Healthcare Market by Country, 2024 - 2031, USD Thousands
- TABLE 43 North America Oil & Gas Market by Country, 2020 - 2023, USD Thousands
- TABLE 44 North America Oil & Gas Market by Country, 2024 - 2031, USD Thousands
- TABLE 45 North America Other Industry Vertical Market by Country, 2020 - 2023, USD Thousands
- TABLE 46 North America Other Industry Vertical Market by Country, 2024 - 2031, USD Thousands
- TABLE 47 North America Blockchain for Sustainable Supply Chains Market by Country, 2020 - 2023, USD Thousands
- TABLE 48 North America Blockchain for Sustainable Supply Chains Market by Country, 2024 - 2031, USD Thousands
- TABLE 49 US Blockchain for Sustainable Supply Chains Market, 2020 - 2023, USD Thousands
- TABLE 50 US Blockchain for Sustainable Supply Chains Market, 2024 - 2031, USD Thousands
- TABLE 51 US Blockchain for Sustainable Supply Chains Market by Enterprise Size, 2020 - 2023, USD Thousands
- TABLE 52 US Blockchain for Sustainable Supply Chains Market by Enterprise Size, 2024 - 2031, USD Thousands
- TABLE 53 US Blockchain for Sustainable Supply Chains Market by Industry Vertical, 2020 - 2023, USD Thousands
- TABLE 54 US Blockchain for Sustainable Supply Chains Market by Industry Vertical, 2024 - 2031, USD Thousands
- TABLE 55 Canada Blockchain for Sustainable Supply Chains Market, 2020 - 2023, USD Thousands
- TABLE 56 Canada Blockchain for Sustainable Supply Chains Market, 2024 - 2031, USD Thousands
- TABLE 57 Canada Blockchain for Sustainable Supply Chains Market by Enterprise Size, 2020 - 2023, USD Thousands
- TABLE 58 Canada Blockchain for Sustainable Supply Chains Market by Enterprise Size, 2024 - 2031, USD Thousands
- TABLE 59 Canada Blockchain for Sustainable Supply Chains Market by Industry Vertical, 2020 - 2023, USD Thousands
- TABLE 60 Canada Blockchain for Sustainable Supply Chains Market by Industry Vertical, 2024 - 2031, USD Thousands
- TABLE 61 Mexico Blockchain for Sustainable Supply Chains Market, 2020 - 2023, USD Thousands
- TABLE 62 Mexico Blockchain for Sustainable Supply Chains Market, 2024 - 2031, USD Thousands
- TABLE 63 Mexico Blockchain for Sustainable Supply Chains Market by Enterprise Size, 2020 - 2023, USD Thousands
- TABLE 64 Mexico Blockchain for Sustainable Supply Chains Market by Enterprise Size, 2024 - 2031, USD Thousands
- TABLE 65 Mexico Blockchain for Sustainable Supply Chains Market by Industry Vertical, 2020 - 2023, USD Thousands
- TABLE 66 Mexico Blockchain for Sustainable Supply Chains Market by Industry Vertical, 2024 - 2031, USD Thousands
- TABLE 67 Rest of North America Blockchain for Sustainable Supply Chains Market, 2020 - 2023, USD Thousands
- TABLE 68 Rest of North America Blockchain for Sustainable Supply Chains Market, 2024 - 2031, USD Thousands
- TABLE 69 Rest of North America Blockchain for Sustainable Supply Chains Market by Enterprise Size, 2020 - 2023, USD Thousands
- TABLE 70 Rest of North America Blockchain for Sustainable Supply Chains Market by Enterprise Size, 2024 - 2031, USD Thousands
- TABLE 71 Rest of North America Blockchain for Sustainable Supply Chains Market by Industry Vertical, 2020 - 2023, USD Thousands
- TABLE 72 Rest of North America Blockchain for Sustainable Supply Chains Market by Industry Vertical, 2024 - 2031, USD Thousands
- TABLE 73 Europe Blockchain for Sustainable Supply Chains Market, 2020 - 2023, USD Thousands
- TABLE 74 Europe Blockchain for Sustainable Supply Chains Market, 2024 - 2031, USD Thousands
- TABLE 75 Europe Blockchain for Sustainable Supply Chains Market by Enterprise Size, 2020 - 2023, USD Thousands
- TABLE 76 Europe Blockchain for Sustainable Supply Chains Market by Enterprise Size, 2024 - 2031, USD Thousands
- TABLE 77 Europe Large Enterprise Market by Country, 2020 - 2023, USD Thousands
- TABLE 78 Europe Large Enterprise Market by Country, 2024 - 2031, USD Thousands
- TABLE 79 Europe SMEs Market by Country, 2020 - 2023, USD Thousands
- TABLE 80 Europe SMEs Market by Country, 2024 - 2031, USD Thousands
- TABLE 81 Europe Blockchain for Sustainable Supply Chains Market by Industry Vertical, 2020 - 2023, USD Thousands
- TABLE 82 Europe Blockchain for Sustainable Supply Chains Market by Industry Vertical, 2024 - 2031, USD Thousands
- TABLE 83 Europe Retail Market by Country, 2020 - 2023, USD Thousands
- TABLE 84 Europe Retail Market by Country, 2024 - 2031, USD Thousands
- TABLE 85 Europe Manufacturing Market by Country, 2020 - 2023, USD Thousands
- TABLE 86 Europe Manufacturing Market by Country, 2024 - 2031, USD Thousands
- TABLE 87 Europe Food & Beverages Market by Country, 2020 - 2023, USD Thousands
- TABLE 88 Europe Food & Beverages Market by Country, 2024 - 2031, USD Thousands
- TABLE 89 Europe Healthcare Market by Country, 2020 - 2023, USD Thousands
- TABLE 90 Europe Healthcare Market by Country, 2024 - 2031, USD Thousands
- TABLE 91 Europe Oil & Gas Market by Country, 2020 - 2023, USD Thousands
- TABLE 92 Europe Oil & Gas Market by Country, 2024 - 2031, USD Thousands
- TABLE 93 Europe Other Industry Vertical Market by Country, 2020 - 2023, USD Thousands
- TABLE 94 Europe Other Industry Vertical Market by Country, 2024 - 2031, USD Thousands
- TABLE 95 Europe Blockchain for Sustainable Supply Chains Market by Country, 2020 - 2023, USD Thousands
- TABLE 96 Europe Blockchain for Sustainable Supply Chains Market by Country, 2024 - 2031, USD Thousands
- TABLE 97 Germany Blockchain for Sustainable Supply Chains Market, 2020 - 2023, USD Thousands
- TABLE 98 Germany Blockchain for Sustainable Supply Chains Market, 2024 - 2031, USD Thousands
- TABLE 99 Germany Blockchain for Sustainable Supply Chains Market by Enterprise Size, 2020 - 2023, USD Thousands
- TABLE 100 Germany Blockchain for Sustainable Supply Chains Market by Enterprise Size, 2024 - 2031, USD Thousands
- TABLE 101 Germany Blockchain for Sustainable Supply Chains Market by Industry Vertical, 2020 - 2023, USD Thousands
- TABLE 102 Germany Blockchain for Sustainable Supply Chains Market by Industry Vertical, 2024 - 2031, USD Thousands
- TABLE 103 UK Blockchain for Sustainable Supply Chains Market, 2020 - 2023, USD Thousands
- TABLE 104 UK Blockchain for Sustainable Supply Chains Market, 2024 - 2031, USD Thousands
- TABLE 105 UK Blockchain for Sustainable Supply Chains Market by Enterprise Size, 2020 - 2023, USD Thousands
- TABLE 106 UK Blockchain for Sustainable Supply Chains Market by Enterprise Size, 2024 - 2031, USD Thousands
- TABLE 107 UK Blockchain for Sustainable Supply Chains Market by Industry Vertical, 2020 - 2023, USD Thousands
- TABLE 108 UK Blockchain for Sustainable Supply Chains Market by Industry Vertical, 2024 - 2031, USD Thousands
- TABLE 109 France Blockchain for Sustainable Supply Chains Market, 2020 - 2023, USD Thousands
- TABLE 110 France Blockchain for Sustainable Supply Chains Market, 2024 - 2031, USD Thousands
- TABLE 111 France Blockchain for Sustainable Supply Chains Market by Enterprise Size, 2020 - 2023, USD Thousands
- TABLE 112 France Blockchain for Sustainable Supply Chains Market by Enterprise Size, 2024 - 2031, USD Thousands
- TABLE 113 France Blockchain for Sustainable Supply Chains Market by Industry Vertical, 2020 - 2023, USD Thousands
- TABLE 114 France Blockchain for Sustainable Supply Chains Market by Industry Vertical, 2024 - 2031, USD Thousands
- TABLE 115 Russia Blockchain for Sustainable Supply Chains Market, 2020 - 2023, USD Thousands
- TABLE 116 Russia Blockchain for Sustainable Supply Chains Market, 2024 - 2031, USD Thousands
- TABLE 117 Russia Blockchain for Sustainable Supply Chains Market by Enterprise Size, 2020 - 2023, USD Thousands
- TABLE 118 Russia Blockchain for Sustainable Supply Chains Market by Enterprise Size, 2024 - 2031, USD Thousands
- TABLE 119 Russia Blockchain for Sustainable Supply Chains Market by Industry Vertical, 2020 - 2023, USD Thousands
- TABLE 120 Russia Blockchain for Sustainable Supply Chains Market by Industry Vertical, 2024 - 2031, USD Thousands
- TABLE 121 Spain Blockchain for Sustainable Supply Chains Market, 2020 - 2023, USD Thousands
- TABLE 122 Spain Blockchain for Sustainable Supply Chains Market, 2024 - 2031, USD Thousands
- TABLE 123 Spain Blockchain for Sustainable Supply Chains Market by Enterprise Size, 2020 - 2023, USD Thousands
- TABLE 124 Spain Blockchain for Sustainable Supply Chains Market by Enterprise Size, 2024 - 2031, USD Thousands
- TABLE 125 Spain Blockchain for Sustainable Supply Chains Market by Industry Vertical, 2020 - 2023, USD Thousands
- TABLE 126 Spain Blockchain for Sustainable Supply Chains Market by Industry Vertical, 2024 - 2031, USD Thousands
- TABLE 127 Italy Blockchain for Sustainable Supply Chains Market, 2020 - 2023, USD Thousands
- TABLE 128 Italy Blockchain for Sustainable Supply Chains Market, 2024 - 2031, USD Thousands
- TABLE 129 Italy Blockchain for Sustainable Supply Chains Market by Enterprise Size, 2020 - 2023, USD Thousands
- TABLE 130 Italy Blockchain for Sustainable Supply Chains Market by Enterprise Size, 2024 - 2031, USD Thousands
- TABLE 131 Italy Blockchain for Sustainable Supply Chains Market by Industry Vertical, 2020 - 2023, USD Thousands
- TABLE 132 Italy Blockchain for Sustainable Supply Chains Market by Industry Vertical, 2024 - 2031, USD Thousands
- TABLE 133 Rest of Europe Blockchain for Sustainable Supply Chains Market, 2020 - 2023, USD Thousands
- TABLE 134 Rest of Europe Blockchain for Sustainable Supply Chains Market, 2024 - 2031, USD Thousands
- TABLE 135 Rest of Europe Blockchain for Sustainable Supply Chains Market by Enterprise Size, 2020 - 2023, USD Thousands
- TABLE 136 Rest of Europe Blockchain for Sustainable Supply Chains Market by Enterprise Size, 2024 - 2031, USD Thousands
- TABLE 137 Rest of Europe Blockchain for Sustainable Supply Chains Market by Industry Vertical, 2020 - 2023, USD Thousands
- TABLE 138 Rest of Europe Blockchain for Sustainable Supply Chains Market by Industry Vertical, 2024 - 2031, USD Thousands
- TABLE 139 Asia Pacific Blockchain for Sustainable Supply Chains Market, 2020 - 2023, USD Thousands
- TABLE 140 Asia Pacific Blockchain for Sustainable Supply Chains Market, 2024 - 2031, USD Thousands
- TABLE 141 Asia Pacific Blockchain for Sustainable Supply Chains Market by Enterprise Size, 2020 - 2023, USD Thousands
- TABLE 142 Asia Pacific Blockchain for Sustainable Supply Chains Market by Enterprise Size, 2024 - 2031, USD Thousands
- TABLE 143 Asia Pacific Large Enterprise Market by Country, 2020 - 2023, USD Thousands
- TABLE 144 Asia Pacific Large Enterprise Market by Country, 2024 - 2031, USD Thousands
- TABLE 145 Asia Pacific SMEs Market by Country, 2020 - 2023, USD Thousands
- TABLE 146 Asia Pacific SMEs Market by Country, 2024 - 2031, USD Thousands
- TABLE 147 Asia Pacific Blockchain for Sustainable Supply Chains Market by Industry Vertical, 2020 - 2023, USD Thousands
- TABLE 148 Asia Pacific Blockchain for Sustainable Supply Chains Market by Industry Vertical, 2024 - 2031, USD Thousands
- TABLE 149 Asia Pacific Retail Market by Country, 2020 - 2023, USD Thousands
- TABLE 150 Asia Pacific Retail Market by Country, 2024 - 2031, USD Thousands
- TABLE 151 Asia Pacific Manufacturing Market by Country, 2020 - 2023, USD Thousands
- TABLE 152 Asia Pacific Manufacturing Market by Country, 2024 - 2031, USD Thousands
- TABLE 153 Asia Pacific Food & Beverages Market by Country, 2020 - 2023, USD Thousands
- TABLE 154 Asia Pacific Food & Beverages Market by Country, 2024 - 2031, USD Thousands
- TABLE 155 Asia Pacific Healthcare Market by Country, 2020 - 2023, USD Thousands
- TABLE 156 Asia Pacific Healthcare Market by Country, 2024 - 2031, USD Thousands
- TABLE 157 Asia Pacific Oil & Gas Market by Country, 2020 - 2023, USD Thousands
- TABLE 158 Asia Pacific Oil & Gas Market by Country, 2024 - 2031, USD Thousands
- TABLE 159 Asia Pacific Other Industry Vertical Market by Country, 2020 - 2023, USD Thousands
- TABLE 160 Asia Pacific Other Industry Vertical Market by Country, 2024 - 2031, USD Thousands
- TABLE 161 Asia Pacific Blockchain for Sustainable Supply Chains Market by Country, 2020 - 2023, USD Thousands
- TABLE 162 Asia Pacific Blockchain for Sustainable Supply Chains Market by Country, 2024 - 2031, USD Thousands
- TABLE 163 China Blockchain for Sustainable Supply Chains Market, 2020 - 2023, USD Thousands
- TABLE 164 China Blockchain for Sustainable Supply Chains Market, 2024 - 2031, USD Thousands
- TABLE 165 China Blockchain for Sustainable Supply Chains Market by Enterprise Size, 2020 - 2023, USD Thousands
- TABLE 166 China Blockchain for Sustainable Supply Chains Market by Enterprise Size, 2024 - 2031, USD Thousands
- TABLE 167 China Blockchain for Sustainable Supply Chains Market by Industry Vertical, 2020 - 2023, USD Thousands
- TABLE 168 China Blockchain for Sustainable Supply Chains Market by Industry Vertical, 2024 - 2031, USD Thousands
- TABLE 169 Japan Blockchain for Sustainable Supply Chains Market, 2020 - 2023, USD Thousands
- TABLE 170 Japan Blockchain for Sustainable Supply Chains Market, 2024 - 2031, USD Thousands
- TABLE 171 Japan Blockchain for Sustainable Supply Chains Market by Enterprise Size, 2020 - 2023, USD Thousands
- TABLE 172 Japan Blockchain for Sustainable Supply Chains Market by Enterprise Size, 2024 - 2031, USD Thousands
- TABLE 173 Japan Blockchain for Sustainable Supply Chains Market by Industry Vertical, 2020 - 2023, USD Thousands
- TABLE 174 Japan Blockchain for Sustainable Supply Chains Market by Industry Vertical, 2024 - 2031, USD Thousands
- TABLE 175 India Blockchain for Sustainable Supply Chains Market, 2020 - 2023, USD Thousands
- TABLE 176 India Blockchain for Sustainable Supply Chains Market, 2024 - 2031, USD Thousands
- TABLE 177 India Blockchain for Sustainable Supply Chains Market by Enterprise Size, 2020 - 2023, USD Thousands
- TABLE 178 India Blockchain for Sustainable Supply Chains Market by Enterprise Size, 2024 - 2031, USD Thousands
- TABLE 179 India Blockchain for Sustainable Supply Chains Market by Industry Vertical, 2020 - 2023, USD Thousands
- TABLE 180 India Blockchain for Sustainable Supply Chains Market by Industry Vertical, 2024 - 2031, USD Thousands
- TABLE 181 South Korea Blockchain for Sustainable Supply Chains Market, 2020 - 2023, USD Thousands
- TABLE 182 South Korea Blockchain for Sustainable Supply Chains Market, 2024 - 2031, USD Thousands
- TABLE 183 South Korea Blockchain for Sustainable Supply Chains Market by Enterprise Size, 2020 - 2023, USD Thousands
- TABLE 184 South Korea Blockchain for Sustainable Supply Chains Market by Enterprise Size, 2024 - 2031, USD Thousands
- TABLE 185 South Korea Blockchain for Sustainable Supply Chains Market by Industry Vertical, 2020 - 2023, USD Thousands
- TABLE 186 South Korea Blockchain for Sustainable Supply Chains Market by Industry Vertical, 2024 - 2031, USD Thousands
- TABLE 187 Singapore Blockchain for Sustainable Supply Chains Market, 2020 - 2023, USD Thousands
- TABLE 188 Singapore Blockchain for Sustainable Supply Chains Market, 2024 - 2031, USD Thousands
- TABLE 189 Singapore Blockchain for Sustainable Supply Chains Market by Enterprise Size, 2020 - 2023, USD Thousands
- TABLE 190 Singapore Blockchain for Sustainable Supply Chains Market by Enterprise Size, 2024 - 2031, USD Thousands
- TABLE 191 Singapore Blockchain for Sustainable Supply Chains Market by Industry Vertical, 2020 - 2023, USD Thousands
- TABLE 192 Singapore Blockchain for Sustainable Supply Chains Market by Industry Vertical, 2024 - 2031, USD Thousands
- TABLE 193 Malaysia Blockchain for Sustainable Supply Chains Market, 2020 - 2023, USD Thousands
- TABLE 194 Malaysia Blockchain for Sustainable Supply Chains Market, 2024 - 2031, USD Thousands
- TABLE 195 Malaysia Blockchain for Sustainable Supply Chains Market by Enterprise Size, 2020 - 2023, USD Thousands
- TABLE 196 Malaysia Blockchain for Sustainable Supply Chains Market by Enterprise Size, 2024 - 2031, USD Thousands
- TABLE 197 Malaysia Blockchain for Sustainable Supply Chains Market by Industry Vertical, 2020 - 2023, USD Thousands
- TABLE 198 Malaysia Blockchain for Sustainable Supply Chains Market by Industry Vertical, 2024 - 2031, USD Thousands
- TABLE 199 Rest of Asia Pacific Blockchain for Sustainable Supply Chains Market, 2020 - 2023, USD Thousands
- TABLE 200 Rest of Asia Pacific Blockchain for Sustainable Supply Chains Market, 2024 - 2031, USD Thousands
- TABLE 201 Rest of Asia Pacific Blockchain for Sustainable Supply Chains Market by Enterprise Size, 2020 - 2023, USD Thousands
- TABLE 202 Rest of Asia Pacific Blockchain for Sustainable Supply Chains Market by Enterprise Size, 2024 - 2031, USD Thousands
- TABLE 203 Rest of Asia Pacific Blockchain for Sustainable Supply Chains Market by Industry Vertical, 2020 - 2023, USD Thousands
- TABLE 204 Rest of Asia Pacific Blockchain for Sustainable Supply Chains Market by Industry Vertical, 2024 - 2031, USD Thousands
- TABLE 205 LAMEA Blockchain for Sustainable Supply Chains Market, 2020 - 2023, USD Thousands
- TABLE 206 LAMEA Blockchain for Sustainable Supply Chains Market, 2024 - 2031, USD Thousands
- TABLE 207 LAMEA Blockchain for Sustainable Supply Chains Market by Enterprise Size, 2020 - 2023, USD Thousands
- TABLE 208 LAMEA Blockchain for Sustainable Supply Chains Market by Enterprise Size, 2024 - 2031, USD Thousands
- TABLE 209 LAMEA Large Enterprise Market by Country, 2020 - 2023, USD Thousands
- TABLE 210 LAMEA Large Enterprise Market by Country, 2024 - 2031, USD Thousands
- TABLE 211 LAMEA SMEs Market by Country, 2020 - 2023, USD Thousands
- TABLE 212 LAMEA SMEs Market by Country, 2024 - 2031, USD Thousands
- TABLE 213 LAMEA Blockchain for Sustainable Supply Chains Market by Industry Vertical, 2020 - 2023, USD Thousands
- TABLE 214 LAMEA Blockchain for Sustainable Supply Chains Market by Industry Vertical, 2024 - 2031, USD Thousands
- TABLE 215 LAMEA Retail Market by Country, 2020 - 2023, USD Thousands
- TABLE 216 LAMEA Retail Market by Country, 2024 - 2031, USD Thousands
- TABLE 217 LAMEA Manufacturing Market by Country, 2020 - 2023, USD Thousands
- TABLE 218 LAMEA Manufacturing Market by Country, 2024 - 2031, USD Thousands
- TABLE 219 LAMEA Food & Beverages Market by Country, 2020 - 2023, USD Thousands
- TABLE 220 LAMEA Food & Beverages Market by Country, 2024 - 2031, USD Thousands
- TABLE 221 LAMEA Healthcare Market by Country, 2020 - 2023, USD Thousands
- TABLE 222 LAMEA Healthcare Market by Country, 2024 - 2031, USD Thousands
- TABLE 223 LAMEA Oil & Gas Market by Country, 2020 - 2023, USD Thousands
- TABLE 224 LAMEA Oil & Gas Market by Country, 2024 - 2031, USD Thousands
- TABLE 225 LAMEA Other Industry Vertical Market by Country, 2020 - 2023, USD Thousands
- TABLE 226 LAMEA Other Industry Vertical Market by Country, 2024 - 2031, USD Thousands
- TABLE 227 LAMEA Blockchain for Sustainable Supply Chains Market by Country, 2020 - 2023, USD Thousands
- TABLE 228 LAMEA Blockchain for Sustainable Supply Chains Market by Country, 2024 - 2031, USD Thousands
- TABLE 229 Brazil Blockchain for Sustainable Supply Chains Market, 2020 - 2023, USD Thousands
- TABLE 230 Brazil Blockchain for Sustainable Supply Chains Market, 2024 - 2031, USD Thousands
- TABLE 231 Brazil Blockchain for Sustainable Supply Chains Market by Enterprise Size, 2020 - 2023, USD Thousands
- TABLE 232 Brazil Blockchain for Sustainable Supply Chains Market by Enterprise Size, 2024 - 2031, USD Thousands
- TABLE 233 Brazil Blockchain for Sustainable Supply Chains Market by Industry Vertical, 2020 - 2023, USD Thousands
- TABLE 234 Brazil Blockchain for Sustainable Supply Chains Market by Industry Vertical, 2024 - 2031, USD Thousands
- TABLE 235 Argentina Blockchain for Sustainable Supply Chains Market, 2020 - 2023, USD Thousands
- TABLE 236 Argentina Blockchain for Sustainable Supply Chains Market, 2024 - 2031, USD Thousands
- TABLE 237 Argentina Blockchain for Sustainable Supply Chains Market by Enterprise Size, 2020 - 2023, USD Thousands
- TABLE 238 Argentina Blockchain for Sustainable Supply Chains Market by Enterprise Size, 2024 - 2031, USD Thousands
- TABLE 239 Argentina Blockchain for Sustainable Supply Chains Market by Industry Vertical, 2020 - 2023, USD Thousands
- TABLE 240 Argentina Blockchain for Sustainable Supply Chains Market by Industry Vertical, 2024 - 2031, USD Thousands
- TABLE 241 UAE Blockchain for Sustainable Supply Chains Market, 2020 - 2023, USD Thousands
- TABLE 242 UAE Blockchain for Sustainable Supply Chains Market, 2024 - 2031, USD Thousands
- TABLE 243 UAE Blockchain for Sustainable Supply Chains Market by Enterprise Size, 2020 - 2023, USD Thousands
- TABLE 244 UAE Blockchain for Sustainable Supply Chains Market by Enterprise Size, 2024 - 2031, USD Thousands
- TABLE 245 UAE Blockchain for Sustainable Supply Chains Market by Industry Vertical, 2020 - 2023, USD Thousands
- TABLE 246 UAE Blockchain for Sustainable Supply Chains Market by Industry Vertical, 2024 - 2031, USD Thousands
- TABLE 247 Saudi Arabia Blockchain for Sustainable Supply Chains Market, 2020 - 2023, USD Thousands
- TABLE 248 Saudi Arabia Blockchain for Sustainable Supply Chains Market, 2024 - 2031, USD Thousands
- TABLE 249 Saudi Arabia Blockchain for Sustainable Supply Chains Market by Enterprise Size, 2020 - 2023, USD Thousands
- TABLE 250 Saudi Arabia Blockchain for Sustainable Supply Chains Market by Enterprise Size, 2024 - 2031, USD Thousands
- TABLE 251 Saudi Arabia Blockchain for Sustainable Supply Chains Market by Industry Vertical, 2020 - 2023, USD Thousands
- TABLE 252 Saudi Arabia Blockchain for Sustainable Supply Chains Market by Industry Vertical, 2024 - 2031, USD Thousands
- TABLE 253 South Africa Blockchain for Sustainable Supply Chains Market, 2020 - 2023, USD Thousands
- TABLE 254 South Africa Blockchain for Sustainable Supply Chains Market, 2024 - 2031, USD Thousands
- TABLE 255 South Africa Blockchain for Sustainable Supply Chains Market by Enterprise Size, 2020 - 2023, USD Thousands
- TABLE 256 South Africa Blockchain for Sustainable Supply Chains Market by Enterprise Size, 2024 - 2031, USD Thousands
- TABLE 257 South Africa Blockchain for Sustainable Supply Chains Market by Industry Vertical, 2020 - 2023, USD Thousands
- TABLE 258 South Africa Blockchain for Sustainable Supply Chains Market by Industry Vertical, 2024 - 2031, USD Thousands
- TABLE 259 Nigeria Blockchain for Sustainable Supply Chains Market, 2020 - 2023, USD Thousands
- TABLE 260 Nigeria Blockchain for Sustainable Supply Chains Market, 2024 - 2031, USD Thousands
- TABLE 261 Nigeria Blockchain for Sustainable Supply Chains Market by Enterprise Size, 2020 - 2023, USD Thousands
- TABLE 262 Nigeria Blockchain for Sustainable Supply Chains Market by Enterprise Size, 2024 - 2031, USD Thousands
- TABLE 263 Nigeria Blockchain for Sustainable Supply Chains Market by Industry Vertical, 2020 - 2023, USD Thousands
- TABLE 264 Nigeria Blockchain for Sustainable Supply Chains Market by Industry Vertical, 2024 - 2031, USD Thousands
- TABLE 265 Rest of LAMEA Blockchain for Sustainable Supply Chains Market, 2020 - 2023, USD Thousands
- TABLE 266 Rest of LAMEA Blockchain for Sustainable Supply Chains Market, 2024 - 2031, USD Thousands
- TABLE 267 Rest of LAMEA Blockchain for Sustainable Supply Chains Market by Enterprise Size, 2020 - 2023, USD Thousands
- TABLE 268 Rest of LAMEA Blockchain for Sustainable Supply Chains Market by Enterprise Size, 2024 - 2031, USD Thousands
- TABLE 269 Rest of LAMEA Blockchain for Sustainable Supply Chains Market by Industry Vertical, 2020 - 2023, USD Thousands
- TABLE 270 Rest of LAMEA Blockchain for Sustainable Supply Chains Market by Industry Vertical, 2024 - 2031, USD Thousands
- TABLE 271 Key Information - IBM Corporation
- TABLE 272 Key Information - Microsoft Corporation
- TABLE 273 Key Information - SAP SE
- TABLE 274 Key Information - Oracle Corporation
- TABLE 275 Key Information - Accenture PLC
- TABLE 276 Key Information - Dell Technologies, Inc.
- TABLE 277 Key Information - Intel Corporation
- TABLE 278 Key Information - Walmart, Inc.
- TABLE 279 Key Information - Bitfury Group Limited.
- TABLE 280 Key Information - OriginTrail
The Global Blockchain for Sustainable Supply Chains Market size is expected to reach $1.76 billion by 2031, rising at a market growth of 49.8% CAGR during the forecast period.
The North America region witnessed 36% revenue share in the market in 2023. This can be attributed to the region's advanced technological infrastructure and the increasing focus on transparency and sustainability across industries. Key sectors such as retail, automotive, and agriculture are driving the adoption of blockchain solutions to enhance traceability, reduce inefficiencies, and promote sustainable practices.
Global supply chains are becoming increasingly complex, making transparency and traceability essential for ensuring efficiency, compliance, and consumer trust. Blockchain technology offers a unique solution by creating a decentralized ledger that securely records every transaction and event within the supply chain. This allows businesses to trace products in real-time from origin to destination, ensuring the authenticity of goods and compliance with ethical and regulatory standards. Thus, increasing focus on transparency and traceability in supply chains drives the market's growth.
Additionally, Consumers today are more conscious of their purchases' ethical and environmental impact, demanding transparency about how products are sourced, manufactured, and distributed. Blockchain technology addresses this demand by offering a secure, verifiable, and transparent product journey record. By scanning QR codes or accessing blockchain-powered platforms, consumers can view detailed information about raw material sourcing, labor practices, and sustainability certifications. In conclusion, rising consumer awareness of ethical and sustainable products propels the market's growth.
However, Implementing blockchain technology into supply chains requires significant financial and logistical commitments, presenting a major hurdle for businesses, particularly small and medium-sized enterprises (SMEs). The upfront costs for hardware infrastructure, software development, and system integration can be prohibitive. Additionally, many companies must upgrade or replace legacy systems to accommodate blockchain platforms, further inflating initial expenditures. Thus, high initial costs will continue to be a significant restraint, particularly for industries where cost efficiency is paramount.
Enterprise Size Outlook
On the basis of enterprise size, the market is segmented into large enterprise and SMEs. In 2023, the SMEs segment attained 32% revenue share in the market. SMEs are adopting blockchain technology to enhance product traceability, improve resource management, and demonstrate their commitment to sustainability without the significant financial burden typically associated with such advanced technologies.
Industry Vertical Outlook
Based on industry vertical, the market is divided into retail, manufacturing, food and beverages, healthcare, oil and gas, and others. In 2023, the manufacturing segment garnered 19% revenue share in the market. Manufacturers increasingly adopt blockchain technology to optimize their supply chains, improve quality control, and ensure sustainability across the entire value chain. The ability to track raw materials, monitor production processes, and verify product authenticity has made blockchain a valuable tool for manufacturers seeking to improve operational efficiency and meet regulatory and sustainability goals.
Regional Outlook
Region-wise, the market is analyzed across North America, Europe, Asia Pacific, and LAMEA. The Asia Pacific region generated 28% revenue share in the market in 2023. The region's rapid industrialization, large-scale manufacturing capabilities, and vast supply chain networks are major contributors to this growth. Countries like China, India, and Japan are leading the charge in integrating blockchain technology to improve supply chain transparency and sustainability.
List of Key Companies Profiled
- IBM Corporation
- Microsoft Corporation
- SAP SE
- Oracle Corporation
- Accenture PLC
- Dell Technologies, Inc.
- Intel Corporation
- Walmart, Inc.
- Bitfury Group Limited.
- OriginTrail
Global Blockchain for Sustainable Supply Chains Market Report Segmentation
By Enterprise Size
- Large Enterprise
- SMEs
By Industry Vertical
- Retail
- Manufacturing
- Food & Beverages
- Healthcare
- Oil & Gas
- Other Industry Vertical
By Geography
- North America
- US
- Canada
- Mexico
- Rest of North America
- Europe
- Germany
- UK
- France
- Russia
- Spain
- Italy
- Rest of Europe
- Asia Pacific
- China
- Japan
- India
- South Korea
- Singapore
- Malaysia
- Rest of Asia Pacific
- LAMEA
- Brazil
- Argentina
- UAE
- Saudi Arabia
- South Africa
- Nigeria
- Rest of LAMEA
Table of Contents
Chapter 1. Market Scope & Methodology
- 1.1 Market Definition
- 1.2 Objectives
- 1.3 Market Scope
- 1.4 Segmentation
- 1.4.1 Global Blockchain for Sustainable Supply Chains Market, by Enterprise Size
- 1.4.2 Global Blockchain for Sustainable Supply Chains Market, by Industry Vertical
- 1.4.3 Global Blockchain for Sustainable Supply Chains Market, by Geography
- 1.5 Methodology for the research
Chapter 2. Market at a Glance
- 2.1 Key Highlights
Chapter 3. Market Overview
- 3.1 Introduction
- 3.1.1 Overview
- 3.1.1.1 Market Composition and Scenario
- 3.1.1 Overview
- 3.2 Key Factors Impacting the Market
- 3.2.1 Market Drivers
- 3.2.2 Market Restraints
- 3.2.3 Market Opportunities
- 3.2.4 Market Challenges
Chapter 4. Competition Analysis - Global
- 4.1 Market Share Analysis, 2023
- 4.2 Porter Five Forces Analysis
Chapter 5. Global Blockchain for Sustainable Supply Chains Market by Enterprise Size
- 5.1 Global Large Enterprise Market by Region
- 5.2 Global SMEs Market by Region
Chapter 6. Global Blockchain for Sustainable Supply Chains Market by Industry Vertical
- 6.1 Global Retail Market by Region
- 6.2 Global Manufacturing Market by Region
- 6.3 Global Food & Beverages Market by Region
- 6.4 Global Healthcare Market by Region
- 6.5 Global Oil & Gas Market by Region
- 6.6 Global Other Industry Vertical Market by Region
Chapter 7. Global Blockchain for Sustainable Supply Chains Market by Region
- 7.1 North America Blockchain for Sustainable Supply Chains Market
- 7.1.1 North America Blockchain for Sustainable Supply Chains Market by Enterprise Size
- 7.1.1.1 North America Large Enterprise Market by Country
- 7.1.1.2 North America SMEs Market by Country
- 7.1.2 North America Blockchain for Sustainable Supply Chains Market by Industry Vertical
- 7.1.2.1 North America Retail Market by Country
- 7.1.2.2 North America Manufacturing Market by Country
- 7.1.2.3 North America Food & Beverages Market by Country
- 7.1.2.4 North America Healthcare Market by Country
- 7.1.2.5 North America Oil & Gas Market by Country
- 7.1.2.6 North America Other Industry Vertical Market by Country
- 7.1.3 North America Blockchain for Sustainable Supply Chains Market by Country
- 7.1.3.1 US Blockchain for Sustainable Supply Chains Market
- 7.1.3.1.1 US Blockchain for Sustainable Supply Chains Market by Enterprise Size
- 7.1.3.1.2 US Blockchain for Sustainable Supply Chains Market by Industry Vertical
- 7.1.3.2 Canada Blockchain for Sustainable Supply Chains Market
- 7.1.3.2.1 Canada Blockchain for Sustainable Supply Chains Market by Enterprise Size
- 7.1.3.2.2 Canada Blockchain for Sustainable Supply Chains Market by Industry Vertical
- 7.1.3.3 Mexico Blockchain for Sustainable Supply Chains Market
- 7.1.3.3.1 Mexico Blockchain for Sustainable Supply Chains Market by Enterprise Size
- 7.1.3.3.2 Mexico Blockchain for Sustainable Supply Chains Market by Industry Vertical
- 7.1.3.4 Rest of North America Blockchain for Sustainable Supply Chains Market
- 7.1.3.4.1 Rest of North America Blockchain for Sustainable Supply Chains Market by Enterprise Size
- 7.1.3.4.2 Rest of North America Blockchain for Sustainable Supply Chains Market by Industry Vertical
- 7.1.3.1 US Blockchain for Sustainable Supply Chains Market
- 7.1.1 North America Blockchain for Sustainable Supply Chains Market by Enterprise Size
- 7.2 Europe Blockchain for Sustainable Supply Chains Market
- 7.2.1 Europe Blockchain for Sustainable Supply Chains Market by Enterprise Size
- 7.2.1.1 Europe Large Enterprise Market by Country
- 7.2.1.2 Europe SMEs Market by Country
- 7.2.2 Europe Blockchain for Sustainable Supply Chains Market by Industry Vertical
- 7.2.2.1 Europe Retail Market by Country
- 7.2.2.2 Europe Manufacturing Market by Country
- 7.2.2.3 Europe Food & Beverages Market by Country
- 7.2.2.4 Europe Healthcare Market by Country
- 7.2.2.5 Europe Oil & Gas Market by Country
- 7.2.2.6 Europe Other Industry Vertical Market by Country
- 7.2.3 Europe Blockchain for Sustainable Supply Chains Market by Country
- 7.2.3.1 Germany Blockchain for Sustainable Supply Chains Market
- 7.2.3.1.1 Germany Blockchain for Sustainable Supply Chains Market by Enterprise Size
- 7.2.3.1.2 Germany Blockchain for Sustainable Supply Chains Market by Industry Vertical
- 7.2.3.2 UK Blockchain for Sustainable Supply Chains Market
- 7.2.3.2.1 UK Blockchain for Sustainable Supply Chains Market by Enterprise Size
- 7.2.3.2.2 UK Blockchain for Sustainable Supply Chains Market by Industry Vertical
- 7.2.3.3 France Blockchain for Sustainable Supply Chains Market
- 7.2.3.3.1 France Blockchain for Sustainable Supply Chains Market by Enterprise Size
- 7.2.3.3.2 France Blockchain for Sustainable Supply Chains Market by Industry Vertical
- 7.2.3.4 Russia Blockchain for Sustainable Supply Chains Market
- 7.2.3.4.1 Russia Blockchain for Sustainable Supply Chains Market by Enterprise Size
- 7.2.3.4.2 Russia Blockchain for Sustainable Supply Chains Market by Industry Vertical
- 7.2.3.5 Spain Blockchain for Sustainable Supply Chains Market
- 7.2.3.5.1 Spain Blockchain for Sustainable Supply Chains Market by Enterprise Size
- 7.2.3.5.2 Spain Blockchain for Sustainable Supply Chains Market by Industry Vertical
- 7.2.3.6 Italy Blockchain for Sustainable Supply Chains Market
- 7.2.3.6.1 Italy Blockchain for Sustainable Supply Chains Market by Enterprise Size
- 7.2.3.6.2 Italy Blockchain for Sustainable Supply Chains Market by Industry Vertical
- 7.2.3.7 Rest of Europe Blockchain for Sustainable Supply Chains Market
- 7.2.3.7.1 Rest of Europe Blockchain for Sustainable Supply Chains Market by Enterprise Size
- 7.2.3.7.2 Rest of Europe Blockchain for Sustainable Supply Chains Market by Industry Vertical
- 7.2.3.1 Germany Blockchain for Sustainable Supply Chains Market
- 7.2.1 Europe Blockchain for Sustainable Supply Chains Market by Enterprise Size
- 7.3 Asia Pacific Blockchain for Sustainable Supply Chains Market
- 7.3.1 Asia Pacific Blockchain for Sustainable Supply Chains Market by Enterprise Size
- 7.3.1.1 Asia Pacific Large Enterprise Market by Country
- 7.3.1.2 Asia Pacific SMEs Market by Country
- 7.3.2 Asia Pacific Blockchain for Sustainable Supply Chains Market by Industry Vertical
- 7.3.2.1 Asia Pacific Retail Market by Country
- 7.3.2.2 Asia Pacific Manufacturing Market by Country
- 7.3.2.3 Asia Pacific Food & Beverages Market by Country
- 7.3.2.4 Asia Pacific Healthcare Market by Country
- 7.3.2.5 Asia Pacific Oil & Gas Market by Country
- 7.3.2.6 Asia Pacific Other Industry Vertical Market by Country
- 7.3.3 Asia Pacific Blockchain for Sustainable Supply Chains Market by Country
- 7.3.3.1 China Blockchain for Sustainable Supply Chains Market
- 7.3.3.1.1 China Blockchain for Sustainable Supply Chains Market by Enterprise Size
- 7.3.3.1.2 China Blockchain for Sustainable Supply Chains Market by Industry Vertical
- 7.3.3.2 Japan Blockchain for Sustainable Supply Chains Market
- 7.3.3.2.1 Japan Blockchain for Sustainable Supply Chains Market by Enterprise Size
- 7.3.3.2.2 Japan Blockchain for Sustainable Supply Chains Market by Industry Vertical
- 7.3.3.3 India Blockchain for Sustainable Supply Chains Market
- 7.3.3.3.1 India Blockchain for Sustainable Supply Chains Market by Enterprise Size
- 7.3.3.3.2 India Blockchain for Sustainable Supply Chains Market by Industry Vertical
- 7.3.3.4 South Korea Blockchain for Sustainable Supply Chains Market
- 7.3.3.4.1 South Korea Blockchain for Sustainable Supply Chains Market by Enterprise Size
- 7.3.3.4.2 South Korea Blockchain for Sustainable Supply Chains Market by Industry Vertical
- 7.3.3.5 Singapore Blockchain for Sustainable Supply Chains Market
- 7.3.3.5.1 Singapore Blockchain for Sustainable Supply Chains Market by Enterprise Size
- 7.3.3.5.2 Singapore Blockchain for Sustainable Supply Chains Market by Industry Vertical
- 7.3.3.6 Malaysia Blockchain for Sustainable Supply Chains Market
- 7.3.3.6.1 Malaysia Blockchain for Sustainable Supply Chains Market by Enterprise Size
- 7.3.3.6.2 Malaysia Blockchain for Sustainable Supply Chains Market by Industry Vertical
- 7.3.3.7 Rest of Asia Pacific Blockchain for Sustainable Supply Chains Market
- 7.3.3.7.1 Rest of Asia Pacific Blockchain for Sustainable Supply Chains Market by Enterprise Size
- 7.3.3.7.2 Rest of Asia Pacific Blockchain for Sustainable Supply Chains Market by Industry Vertical
- 7.3.3.1 China Blockchain for Sustainable Supply Chains Market
- 7.3.1 Asia Pacific Blockchain for Sustainable Supply Chains Market by Enterprise Size
- 7.4 LAMEA Blockchain for Sustainable Supply Chains Market
- 7.4.1 LAMEA Blockchain for Sustainable Supply Chains Market by Enterprise Size
- 7.4.1.1 LAMEA Large Enterprise Market by Country
- 7.4.1.2 LAMEA SMEs Market by Country
- 7.4.2 LAMEA Blockchain for Sustainable Supply Chains Market by Industry Vertical
- 7.4.2.1 LAMEA Retail Market by Country
- 7.4.2.2 LAMEA Manufacturing Market by Country
- 7.4.2.3 LAMEA Food & Beverages Market by Country
- 7.4.2.4 LAMEA Healthcare Market by Country
- 7.4.2.5 LAMEA Oil & Gas Market by Country
- 7.4.2.6 LAMEA Other Industry Vertical Market by Country
- 7.4.3 LAMEA Blockchain for Sustainable Supply Chains Market by Country
- 7.4.3.1 Brazil Blockchain for Sustainable Supply Chains Market
- 7.4.3.1.1 Brazil Blockchain for Sustainable Supply Chains Market by Enterprise Size
- 7.4.3.1.2 Brazil Blockchain for Sustainable Supply Chains Market by Industry Vertical
- 7.4.3.2 Argentina Blockchain for Sustainable Supply Chains Market
- 7.4.3.2.1 Argentina Blockchain for Sustainable Supply Chains Market by Enterprise Size
- 7.4.3.2.2 Argentina Blockchain for Sustainable Supply Chains Market by Industry Vertical
- 7.4.3.3 UAE Blockchain for Sustainable Supply Chains Market
- 7.4.3.3.1 UAE Blockchain for Sustainable Supply Chains Market by Enterprise Size
- 7.4.3.3.2 UAE Blockchain for Sustainable Supply Chains Market by Industry Vertical
- 7.4.3.4 Saudi Arabia Blockchain for Sustainable Supply Chains Market
- 7.4.3.4.1 Saudi Arabia Blockchain for Sustainable Supply Chains Market by Enterprise Size
- 7.4.3.4.2 Saudi Arabia Blockchain for Sustainable Supply Chains Market by Industry Vertical
- 7.4.3.5 South Africa Blockchain for Sustainable Supply Chains Market
- 7.4.3.5.1 South Africa Blockchain for Sustainable Supply Chains Market by Enterprise Size
- 7.4.3.5.2 South Africa Blockchain for Sustainable Supply Chains Market by Industry Vertical
- 7.4.3.6 Nigeria Blockchain for Sustainable Supply Chains Market
- 7.4.3.6.1 Nigeria Blockchain for Sustainable Supply Chains Market by Enterprise Size
- 7.4.3.6.2 Nigeria Blockchain for Sustainable Supply Chains Market by Industry Vertical
- 7.4.3.7 Rest of LAMEA Blockchain for Sustainable Supply Chains Market
- 7.4.3.7.1 Rest of LAMEA Blockchain for Sustainable Supply Chains Market by Enterprise Size
- 7.4.3.7.2 Rest of LAMEA Blockchain for Sustainable Supply Chains Market by Industry Vertical
- 7.4.3.1 Brazil Blockchain for Sustainable Supply Chains Market
- 7.4.1 LAMEA Blockchain for Sustainable Supply Chains Market by Enterprise Size
Chapter 8. Company Profiles
- 8.1 IBM Corporation
- 8.1.1 Company Overview
- 8.1.2 Financial Analysis
- 8.1.3 Regional & Segmental Analysis
- 8.1.4 Research & Development Expenses
- 8.1.5 SWOT Analysis
- 8.2 Microsoft Corporation
- 8.2.1 Company Overview
- 8.2.2 Financial Analysis
- 8.2.3 Segmental and Regional Analysis
- 8.2.4 Research & Development Expenses
- 8.2.5 Recent strategies and developments:
- 8.2.5.1 Product Launches and Product Expansions:
- 8.2.6 SWOT Analysis
- 8.3 SAP SE
- 8.3.1 Company Overview
- 8.3.2 Financial Analysis
- 8.3.3 Regional Analysis
- 8.3.4 Research & Development Expense
- 8.3.5 Recent strategies and developments:
- 8.3.5.1 Partnerships, Collaborations, and Agreements:
- 8.3.6 SWOT Analysis
- 8.4 Oracle Corporation
- 8.4.1 Company Overview
- 8.4.2 Financial Analysis
- 8.4.3 Segmental and Regional Analysis
- 8.4.4 Research & Development Expense
- 8.4.5 Recent strategies and developments:
- 8.4.5.1 Product Launches and Product Expansions:
- 8.4.6 SWOT Analysis
- 8.5 Accenture PLC
- 8.5.1 Company Overview
- 8.5.2 Financial Analysis
- 8.5.3 Segmental Analysis
- 8.5.4 Research & Development Expenses
- 8.5.5 SWOT Analysis
- 8.6 Dell Technologies, Inc.
- 8.6.1 Company Overview
- 8.6.2 Financial Analysis
- 8.6.3 Segmental and Regional Analysis
- 8.6.4 Research & Development Expense
- 8.6.5 SWOT Analysis
- 8.7 Intel Corporation
- 8.7.1 Company Overview
- 8.7.2 Financial Analysis
- 8.7.3 Segmental and Regional Analysis
- 8.7.4 Research & Development Expenses
- 8.7.5 SWOT Analysis
- 8.8 Walmart, Inc.
- 8.8.1 Company Overview
- 8.8.2 Financial Analysis
- 8.8.3 Segmental and Regional Analysis
- 8.8.4 SWOT Analysis
- 8.9 Bitfury Group Limited.
- 8.9.1 Company Overview
- 8.10. OriginTrail
- 8.10.1 Company Overview
