|
|
市場調査レポート
商品コード
1555900
APMソフトウェア(アプリケーションパフォーマンスモニタリングソフトウェア)の世界市場規模、シェア、動向分析:企業規模別、タイプ別、アクセスタイプ別、展開別、最終用途別、地域別、展望と予測、2024年-2031年Global Application Performance Monitoring Software Market Size, Share & Trends Analysis Report By Enterprise Size, By Type, By Access Type, By Deployment (Cloud and On-premises), By End Use, By Regional Outlook and Forecast, 2024 - 2031 |
||||||

|
|||||||
|
|||||||

| APMソフトウェア(アプリケーションパフォーマンスモニタリングソフトウェア)の世界市場規模、シェア、動向分析:企業規模別、タイプ別、アクセスタイプ別、展開別、最終用途別、地域別、展望と予測、2024年-2031年 |
|
出版日: 2024年09月13日
発行: KBV Research
ページ情報: 英文 414 Pages
納期: 即納可能
|

全表示
- 概要
- 図表
- 目次
世界のAPMソフトウェア(アプリケーションパフォーマンスモニタリングソフトウェア)市場規模は、予測期間中に14.3%のCAGRで市場成長し、2031年までに135億米ドルに達すると予想されています。
市場成長要因
アプリケーションが単一のまとまりのあるユニットとして構築される従来のモノリシックソフトウェアアーキテクチャは、マイクロサービスやコンテナ化された環境などのよりモジュール化されたアプローチに徐々に取って代わられてきました。APMソフトウェアは、この複雑さに対処する上で重要な役割を果たします。マイクロサービス環境では、各サービスは独立して動作し、多くの場合は異なるサーバー上で動作し、APIを介して他のサービスと通信します。したがって、これらの要因が市場の成長を促進しています。
継続的インテグレーションと継続的デリバリー(CI/CD)環境では、ソフトウェアの更新が1日に複数回発生する可能性があり、コードとアプリケーションの構成が頻繁に変更されます。さらに、CI/CDパイプラインの高速性により、迅速かつ効率的な問題解決が求められますが、APMソフトウェアは詳細な診断を提供することでこれを実現します。したがって、これらのテクノロジーの採用は、このソフトウェアの採用に役立っています。
市場抑制要因
APMソフトウェアの導入には、ライセンシング料のほか、ハードウェアのアップグレードやネットワークの再構成など、高額な初期費用がかかることがよくあります。さらに、APMソフトウェアは特殊な性質を持つため、効果的に運用および管理するには熟練したIT担当者が必要です。そのため、小規模な企業では、導入、トレーニング、メンテナンスにかかる金銭的負担がメリットを上回り、市場の成長を妨げていることがよくあります。
企業規模の展望
企業規模に基づいて、市場は大企業と中小企業(SME)に分かれています。中小企業(SME)セグメントは、2023年に市場で40%の収益シェアを獲得しました。特にデジタル変革をきっかけに、クラウドベースで手頃な価格のAPMソフトウェアソリューションに対する需要が高まり、APMツールの採用が増加しています。
タイプの展望
タイプに基づいて、市場はリアルユーザーモニタリング(RUM)、合成モニタリング、サーバーサイドモニタリング、データベースモニタリング、ネットワークパフォーマンスモニタリングなどに分類されます。合成モニタリングセグメントは、2023年に市場で22%の収益シェアを記録しました。合成モニタリングにより、企業はユーザージャーニーを積極的にシミュレートし、実際のユーザーが影響を受ける前にさまざまなシナリオでアプリケーションのパフォーマンスをテストできます。
アクセスタイプの展望
アクセスタイプ別に見ると、市場はウェブAPM、モバイルAPM、その他に分類されます。モバイルAPMセグメントは、2023年に市場で31%の収益シェアを獲得しました。この成長は、モバイルアプリケーションの急速な普及とユーザーエンゲージメントにおける重要な役割によって促進されています。
展開の展望
展開に基づいて、市場はクラウドとオンプレミスに分割されます。オンプレミスセグメントは、2023年に市場で45%の収益シェアを記録しました。多くの大企業、特に厳格なデータセキュリティとコンプライアンスの要件を持つ企業は、オンプレミスのAPMソリューションに依存して、監視インフラをより適切に制御しています。
最終用途の展望
最終用途に基づいて、市場はITおよび通信、 BFSI、小売、ヘルスケア、メディア・エンターテインメント、 eコマース、製造、政府、学術機関などに細分化されています。BFSIセグメントは、2023年に市場で19%の収益シェアを獲得しました。金融取引とデータセキュリティの重要性が高いため、APMソフトウェアは銀行、金融、保険のアプリケーションを監視します。
地域の展望
地域別に見ると、市場は北米、欧州、アジア太平洋、ラテンアメリカ・中東・アフリカにおいて分析されています。北米セグメントは、2023年に市場で35%の収益シェアを記録しました。主要業界全体で高度なITインフラ、クラウドサービス、デジタル変革イニシアチブの採用率が高いことが、セグメントの成長を牽引しています。
目次
第1章 市場範囲と調査手法
- 市場の定義
- 目的
- 市場範囲
- セグメンテーション
- 調査手法
第2章 市場要覧
- 主なハイライト
第3章 市場概要
- イントロダクション
- 概要
- 市場構成とシナリオ
- 概要
- 市場に影響を与える主な要因
- 市場促進要因
- 市場抑制要因
- 市場機会
- 市場の課題
第4章 競合分析:世界
- KBV Cardinal Matrix
- 最近の業界全体の戦略的展開
- パートナーシップ、コラボレーション、および契約
- 製品の発売と製品の拡大
- 買収と合併
- 市場シェア分析、2023年
- 主要成功戦略
- 主な戦略
- 主要な戦略的動き
- ポーターのファイブフォース分析
第5章 世界のAPMソフトウェア市場:企業規模別
- 世界の大企業市場:地域別
- 世界の中小企業市場:地域別
第6章 世界のAPMソフトウェア市場:タイプ別
- 世界のリアルユーザーモニタリング(RUM)市場:地域別
- 世界の合成モニタリング市場:地域別
- 世界のサーバーサイドモニタリング市場:地域別
- 世界のデータベースモニタリング市場:地域別
- 世界ネットワークパフォーマンスモニタリング市場:地域別
- 世界のその他のタイプ市場:地域別
第7章 世界のAPMソフトウェア市場:アクセスタイプ別
- 世界のウェブAPM市場:地域別
- 世界のモバイルAPM市場:地域別
- 世界のその他のアクセスタイプ市場:地域別
第8章 世界のAPMソフトウェア市場:展開別
- 世界のクラウド市場:地域別
- 世界のオンプレミス市場:地域別
第9章 世界のAPMソフトウェア市場:最終用途別
- 世界のIT・通信市場:地域別
- 世界のBFSI市場:地域別
- 世界の小売市場:地域別
- 世界のヘルスケア市場:地域別
- 世界のメディア・エンターテインメント市場:地域別
- 世界のeコマース市場:地域別
- 世界の製造市場:地域別
- 世界の政府・学術機関市場:地域別
- 世界のその他の最終用途市場:地域別
第10章 世界のAPMソフトウェア市場:地域別
- 北米
- 北米のAPMソフトウェア市場:国別
- 米国
- カナダ
- メキシコ
- その他北米地域
- 北米のAPMソフトウェア市場:国別
- 欧州
- 欧州のAPMソフトウェア市場:国別
- ドイツ
- 英国
- フランス
- ロシア
- スペイン
- イタリア
- その他欧州地域
- 欧州のAPMソフトウェア市場:国別
- アジア太平洋地域
- アジア太平洋のAPMソフトウェア市場:国別
- 中国
- 日本
- インド
- 韓国
- オーストラリア
- マレーシア
- その他アジア太平洋地域
- アジア太平洋のAPMソフトウェア市場:国別
- ラテンアメリカ・中東・アフリカ
- ラテンアメリカ・中東・アフリカのAPMソフトウェア市場:国別
- ブラジル
- アルゼンチン
- アラブ首長国連邦
- サウジアラビア
- 南アフリカ
- ナイジェリア
- その他ラテンアメリカ・中東・アフリカ地域
- ラテンアメリカ・中東・アフリカのAPMソフトウェア市場:国別
第11章 企業プロファイル
- Amazon Web Services, Inc(Amazon.com, Inc.)
- Cisco Systems, Inc
- Broadcom, Inc
- Datadog, Inc
- Google LLC(Alphabet Inc)
- IBM Corporation
- Microsoft Corporation
- Oracle Corporation
- Open Text Corporation
- Dynatrace, Inc
第12章 APMソフトウェア市場における成功必須条件
LIST OF TABLES
- TABLE 1 Global Application Performance Monitoring Software Market, 2020 - 2023, USD Million
- TABLE 2 Global Application Performance Monitoring Software Market, 2024 - 2031, USD Million
- TABLE 3 Partnerships, Collaborations and Agreements- Application Performance Monitoring Software Market
- TABLE 4 Product Launches And Product Expansions- Application Performance Monitoring Software Market
- TABLE 5 Acquisition and Mergers- Application Performance Monitoring Software Market
- TABLE 6 Global Application Performance Monitoring Software Market by Enterprise Size, 2020 - 2023, USD Million
- TABLE 7 Global Application Performance Monitoring Software Market by Enterprise Size, 2024 - 2031, USD Million
- TABLE 8 Global Large Enterprise Market by Region, 2020 - 2023, USD Million
- TABLE 9 Global Large Enterprise Market by Region, 2024 - 2031, USD Million
- TABLE 10 Global Small & Medium Enterprise (SME) Market by Region, 2020 - 2023, USD Million
- TABLE 11 Global Small & Medium Enterprise (SME) Market by Region, 2024 - 2031, USD Million
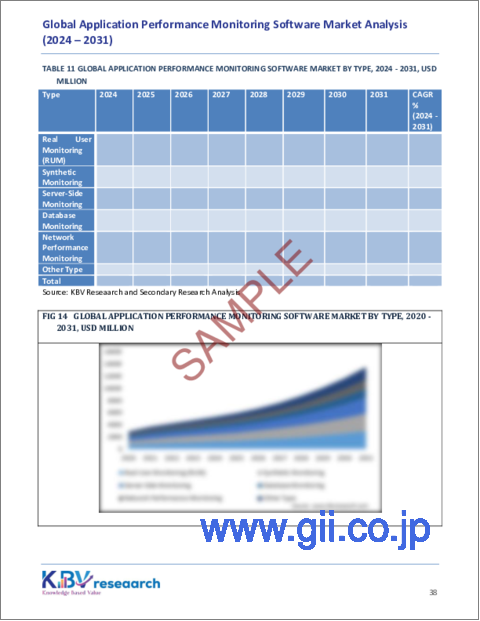
- TABLE 12 Global Application Performance Monitoring Software Market by Type, 2020 - 2023, USD Million
- TABLE 13 Global Application Performance Monitoring Software Market by Type, 2024 - 2031, USD Million
- TABLE 14 Global Real User Monitoring (RUM) Market by Region, 2020 - 2023, USD Million
- TABLE 15 Global Real User Monitoring (RUM) Market by Region, 2024 - 2031, USD Million
- TABLE 16 Global Synthetic Monitoring Market by Region, 2020 - 2023, USD Million
- TABLE 17 Global Synthetic Monitoring Market by Region, 2024 - 2031, USD Million
- TABLE 18 Global Server-Side Monitoring Market by Region, 2020 - 2023, USD Million
- TABLE 19 Global Server-Side Monitoring Market by Region, 2024 - 2031, USD Million
- TABLE 20 Global Database Monitoring Market by Region, 2020 - 2023, USD Million
- TABLE 21 Global Database Monitoring Market by Region, 2024 - 2031, USD Million
- TABLE 22 Global Network Performance Monitoring Market by Region, 2020 - 2023, USD Million
- TABLE 23 Global Network Performance Monitoring Market by Region, 2024 - 2031, USD Million
- TABLE 24 Global Other Type Market by Region, 2020 - 2023, USD Million
- TABLE 25 Global Other Type Market by Region, 2024 - 2031, USD Million
- TABLE 26 Global Application Performance Monitoring Software Market by Access Type, 2020 - 2023, USD Million
- TABLE 27 Global Application Performance Monitoring Software Market by Access Type, 2024 - 2031, USD Million
- TABLE 28 Global Web APM Market by Region, 2020 - 2023, USD Million
- TABLE 29 Global Web APM Market by Region, 2024 - 2031, USD Million
- TABLE 30 Global Mobile APM Market by Region, 2020 - 2023, USD Million
- TABLE 31 Global Mobile APM Market by Region, 2024 - 2031, USD Million
- TABLE 32 Global Other Access Type Market by Region, 2020 - 2023, USD Million
- TABLE 33 Global Other Access Type Market by Region, 2024 - 2031, USD Million
- TABLE 34 Global Application Performance Monitoring Software Market by Deployment, 2020 - 2023, USD Million
- TABLE 35 Global Application Performance Monitoring Software Market by Deployment, 2024 - 2031, USD Million
- TABLE 36 Global Cloud Market by Region, 2020 - 2023, USD Million
- TABLE 37 Global Cloud Market by Region, 2024 - 2031, USD Million
- TABLE 38 Global On-premises Market by Region, 2020 - 2023, USD Million
- TABLE 39 Global On-premises Market by Region, 2024 - 2031, USD Million
- TABLE 40 Global Application Performance Monitoring Software Market by End Use, 2020 - 2023, USD Million
- TABLE 41 Global Application Performance Monitoring Software Market by End Use, 2024 - 2031, USD Million
- TABLE 42 Global IT & Telecommunications Market by Region, 2020 - 2023, USD Million
- TABLE 43 Global IT & Telecommunications Market by Region, 2024 - 2031, USD Million
- TABLE 44 Global BFSI Market by Region, 2020 - 2023, USD Million
- TABLE 45 Global BFSI Market by Region, 2024 - 2031, USD Million
- TABLE 46 Global Retail Market by Region, 2020 - 2023, USD Million
- TABLE 47 Global Retail Market by Region, 2024 - 2031, USD Million
- TABLE 48 Global Healthcare Market by Region, 2020 - 2023, USD Million
- TABLE 49 Global Healthcare Market by Region, 2024 - 2031, USD Million
- TABLE 50 Global Media & Entertainment Market by Region, 2020 - 2023, USD Million
- TABLE 51 Global Media & Entertainment Market by Region, 2024 - 2031, USD Million
- TABLE 52 Global E-Commerce Market by Region, 2020 - 2023, USD Million
- TABLE 53 Global E-Commerce Market by Region, 2024 - 2031, USD Million
- TABLE 54 Global Manufacturing Market by Region, 2020 - 2023, USD Million
- TABLE 55 Global Manufacturing Market by Region, 2024 - 2031, USD Million
- TABLE 56 Global Government & Academics Market by Region, 2020 - 2023, USD Million
- TABLE 57 Global Government & Academics Market by Region, 2024 - 2031, USD Million
- TABLE 58 Global Other End Use Market by Region, 2020 - 2023, USD Million
- TABLE 59 Global Other End Use Market by Region, 2024 - 2031, USD Million
- TABLE 60 Global Application Performance Monitoring Software Market by Region, 2020 - 2023, USD Million
- TABLE 61 Global Application Performance Monitoring Software Market by Region, 2024 - 2031, USD Million
- TABLE 62 North America Application Performance Monitoring Software Market, 2020 - 2023, USD Million
- TABLE 63 North America Application Performance Monitoring Software Market, 2024 - 2031, USD Million
- TABLE 64 North America Application Performance Monitoring Software Market by Enterprise Size, 2020 - 2023, USD Million
- TABLE 65 North America Application Performance Monitoring Software Market by Enterprise Size, 2024 - 2031, USD Million
- TABLE 66 North America Large Enterprise Market by Region, 2020 - 2023, USD Million
- TABLE 67 North America Large Enterprise Market by Region, 2024 - 2031, USD Million
- TABLE 68 North America Small & Medium Enterprise (SME) Market by Region, 2020 - 2023, USD Million
- TABLE 69 North America Small & Medium Enterprise (SME) Market by Region, 2024 - 2031, USD Million
- TABLE 70 North America Application Performance Monitoring Software Market by Type, 2020 - 2023, USD Million
- TABLE 71 North America Application Performance Monitoring Software Market by Type, 2024 - 2031, USD Million
- TABLE 72 North America Real User Monitoring (RUM) Market by Country, 2020 - 2023, USD Million
- TABLE 73 North America Real User Monitoring (RUM) Market by Country, 2024 - 2031, USD Million
- TABLE 74 North America Synthetic Monitoring Market by Country, 2020 - 2023, USD Million
- TABLE 75 North America Synthetic Monitoring Market by Country, 2024 - 2031, USD Million
- TABLE 76 North America Server-Side Monitoring Market by Country, 2020 - 2023, USD Million
- TABLE 77 North America Server-Side Monitoring Market by Country, 2024 - 2031, USD Million
- TABLE 78 North America Database Monitoring Market by Country, 2020 - 2023, USD Million
- TABLE 79 North America Database Monitoring Market by Country, 2024 - 2031, USD Million
- TABLE 80 North America Network Performance Monitoring Market by Country, 2020 - 2023, USD Million
- TABLE 81 North America Network Performance Monitoring Market by Country, 2024 - 2031, USD Million
- TABLE 82 North America Other Type Market by Country, 2020 - 2023, USD Million
- TABLE 83 North America Other Type Market by Country, 2024 - 2031, USD Million
- TABLE 84 North America Application Performance Monitoring Software Market by Access Type, 2020 - 2023, USD Million
- TABLE 85 North America Application Performance Monitoring Software Market by Access Type, 2024 - 2031, USD Million
- TABLE 86 North America Web APM Market by Country, 2020 - 2023, USD Million
- TABLE 87 North America Web APM Market by Country, 2024 - 2031, USD Million
- TABLE 88 North America Mobile APM Market by Country, 2020 - 2023, USD Million
- TABLE 89 North America Mobile APM Market by Country, 2024 - 2031, USD Million
- TABLE 90 North America Other Access Type Market by Country, 2020 - 2023, USD Million
- TABLE 91 North America Other Access Type Market by Country, 2024 - 2031, USD Million
- TABLE 92 North America Application Performance Monitoring Software Market by Deployment, 2020 - 2023, USD Million
- TABLE 93 North America Application Performance Monitoring Software Market by Deployment, 2024 - 2031, USD Million
- TABLE 94 North America Cloud Market by Country, 2020 - 2023, USD Million
- TABLE 95 North America Cloud Market by Country, 2024 - 2031, USD Million
- TABLE 96 North America On-premises Market by Country, 2020 - 2023, USD Million
- TABLE 97 North America On-premises Market by Country, 2024 - 2031, USD Million
- TABLE 98 North America Application Performance Monitoring Software Market by End Use, 2020 - 2023, USD Million
- TABLE 99 North America Application Performance Monitoring Software Market by End Use, 2024 - 2031, USD Million
- TABLE 100 North America IT & Telecommunications Market by Country, 2020 - 2023, USD Million
- TABLE 101 North America IT & Telecommunications Market by Country, 2024 - 2031, USD Million
- TABLE 102 North America BFSI Market by Country, 2020 - 2023, USD Million
- TABLE 103 North America BFSI Market by Country, 2024 - 2031, USD Million
- TABLE 104 North America Retail Market by Country, 2020 - 2023, USD Million
- TABLE 105 North America Retail Market by Country, 2024 - 2031, USD Million
- TABLE 106 North America Healthcare Market by Country, 2020 - 2023, USD Million
- TABLE 107 North America Healthcare Market by Country, 2024 - 2031, USD Million
- TABLE 108 North America Media & Entertainment Market by Country, 2020 - 2023, USD Million
- TABLE 109 North America Media & Entertainment Market by Country, 2024 - 2031, USD Million
- TABLE 110 North America E-Commerce Market by Country, 2020 - 2023, USD Million
- TABLE 111 North America E-Commerce Market by Country, 2024 - 2031, USD Million
- TABLE 112 North America Manufacturing Market by Country, 2020 - 2023, USD Million
- TABLE 113 North America Manufacturing Market by Country, 2024 - 2031, USD Million
- TABLE 114 North America Government & Academics Market by Country, 2020 - 2023, USD Million
- TABLE 115 North America Government & Academics Market by Country, 2024 - 2031, USD Million
- TABLE 116 North America Other End Use Market by Country, 2020 - 2023, USD Million
- TABLE 117 North America Other End Use Market by Country, 2024 - 2031, USD Million
- TABLE 118 North America Application Performance Monitoring Software Market by Country, 2020 - 2023, USD Million
- TABLE 119 North America Application Performance Monitoring Software Market by Country, 2024 - 2031, USD Million
- TABLE 120 US Application Performance Monitoring Software Market, 2020 - 2023, USD Million
- TABLE 121 US Application Performance Monitoring Software Market, 2024 - 2031, USD Million
- TABLE 122 US Application Performance Monitoring Software Market by Enterprise Size, 2020 - 2023, USD Million
- TABLE 123 US Application Performance Monitoring Software Market by Enterprise Size, 2024 - 2031, USD Million
- TABLE 124 US Application Performance Monitoring Software Market by Type, 2020 - 2023, USD Million
- TABLE 125 US Application Performance Monitoring Software Market by Type, 2024 - 2031, USD Million
- TABLE 126 US Application Performance Monitoring Software Market by Access Type, 2020 - 2023, USD Million
- TABLE 127 US Application Performance Monitoring Software Market by Access Type, 2024 - 2031, USD Million
- TABLE 128 US Application Performance Monitoring Software Market by Deployment, 2020 - 2023, USD Million
- TABLE 129 US Application Performance Monitoring Software Market by Deployment, 2024 - 2031, USD Million
- TABLE 130 US Application Performance Monitoring Software Market by End Use, 2020 - 2023, USD Million
- TABLE 131 US Application Performance Monitoring Software Market by End Use, 2024 - 2031, USD Million
- TABLE 132 Canada Application Performance Monitoring Software Market, 2020 - 2023, USD Million
- TABLE 133 Canada Application Performance Monitoring Software Market, 2024 - 2031, USD Million
- TABLE 134 Canada Application Performance Monitoring Software Market by Enterprise Size, 2020 - 2023, USD Million
- TABLE 135 Canada Application Performance Monitoring Software Market by Enterprise Size, 2024 - 2031, USD Million
- TABLE 136 Canada Application Performance Monitoring Software Market by Type, 2020 - 2023, USD Million
- TABLE 137 Canada Application Performance Monitoring Software Market by Type, 2024 - 2031, USD Million
- TABLE 138 Canada Application Performance Monitoring Software Market by Access Type, 2020 - 2023, USD Million
- TABLE 139 Canada Application Performance Monitoring Software Market by Access Type, 2024 - 2031, USD Million
- TABLE 140 Canada Application Performance Monitoring Software Market by Deployment, 2020 - 2023, USD Million
- TABLE 141 Canada Application Performance Monitoring Software Market by Deployment, 2024 - 2031, USD Million
- TABLE 142 Canada Application Performance Monitoring Software Market by End Use, 2020 - 2023, USD Million
- TABLE 143 Canada Application Performance Monitoring Software Market by End Use, 2024 - 2031, USD Million
- TABLE 144 Mexico Application Performance Monitoring Software Market, 2020 - 2023, USD Million
- TABLE 145 Mexico Application Performance Monitoring Software Market, 2024 - 2031, USD Million
- TABLE 146 Mexico Application Performance Monitoring Software Market by Enterprise Size, 2020 - 2023, USD Million
- TABLE 147 Mexico Application Performance Monitoring Software Market by Enterprise Size, 2024 - 2031, USD Million
- TABLE 148 Mexico Application Performance Monitoring Software Market by Type, 2020 - 2023, USD Million
- TABLE 149 Mexico Application Performance Monitoring Software Market by Type, 2024 - 2031, USD Million
- TABLE 150 Mexico Application Performance Monitoring Software Market by Access Type, 2020 - 2023, USD Million
- TABLE 151 Mexico Application Performance Monitoring Software Market by Access Type, 2024 - 2031, USD Million
- TABLE 152 Mexico Application Performance Monitoring Software Market by Deployment, 2020 - 2023, USD Million
- TABLE 153 Mexico Application Performance Monitoring Software Market by Deployment, 2024 - 2031, USD Million
- TABLE 154 Mexico Application Performance Monitoring Software Market by End Use, 2020 - 2023, USD Million
- TABLE 155 Mexico Application Performance Monitoring Software Market by End Use, 2024 - 2031, USD Million
- TABLE 156 Rest of North America Application Performance Monitoring Software Market, 2020 - 2023, USD Million
- TABLE 157 Rest of North America Application Performance Monitoring Software Market, 2024 - 2031, USD Million
- TABLE 158 Rest of North America Application Performance Monitoring Software Market by Enterprise Size, 2020 - 2023, USD Million
- TABLE 159 Rest of North America Application Performance Monitoring Software Market by Enterprise Size, 2024 - 2031, USD Million
- TABLE 160 Rest of North America Application Performance Monitoring Software Market by Type, 2020 - 2023, USD Million
- TABLE 161 Rest of North America Application Performance Monitoring Software Market by Type, 2024 - 2031, USD Million
- TABLE 162 Rest of North America Application Performance Monitoring Software Market by Access Type, 2020 - 2023, USD Million
- TABLE 163 Rest of North America Application Performance Monitoring Software Market by Access Type, 2024 - 2031, USD Million
- TABLE 164 Rest of North America Application Performance Monitoring Software Market by Deployment, 2020 - 2023, USD Million
- TABLE 165 Rest of North America Application Performance Monitoring Software Market by Deployment, 2024 - 2031, USD Million
- TABLE 166 Rest of North America Application Performance Monitoring Software Market by End Use, 2020 - 2023, USD Million
- TABLE 167 Rest of North America Application Performance Monitoring Software Market by End Use, 2024 - 2031, USD Million
- TABLE 168 Europe Application Performance Monitoring Software Market, 2020 - 2023, USD Million
- TABLE 169 Europe Application Performance Monitoring Software Market, 2024 - 2031, USD Million
- TABLE 170 Europe Application Performance Monitoring Software Market by Enterprise Size, 2020 - 2023, USD Million
- TABLE 171 Europe Application Performance Monitoring Software Market by Enterprise Size, 2024 - 2031, USD Million
- TABLE 172 Europe Large Enterprise Market by Country, 2020 - 2023, USD Million
- TABLE 173 Europe Large Enterprise Market by Country, 2024 - 2031, USD Million
- TABLE 174 Europe Small & Medium Enterprise (SME) Market by Country, 2020 - 2023, USD Million
- TABLE 175 Europe Small & Medium Enterprise (SME) Market by Country, 2024 - 2031, USD Million
- TABLE 176 Europe Application Performance Monitoring Software Market by Type, 2020 - 2023, USD Million
- TABLE 177 Europe Application Performance Monitoring Software Market by Type, 2024 - 2031, USD Million
- TABLE 178 Europe Real User Monitoring (RUM) Market by Country, 2020 - 2023, USD Million
- TABLE 179 Europe Real User Monitoring (RUM) Market by Country, 2024 - 2031, USD Million
- TABLE 180 Europe Synthetic Monitoring Market by Country, 2020 - 2023, USD Million
- TABLE 181 Europe Synthetic Monitoring Market by Country, 2024 - 2031, USD Million
- TABLE 182 Europe Server-Side Monitoring Market by Country, 2020 - 2023, USD Million
- TABLE 183 Europe Server-Side Monitoring Market by Country, 2024 - 2031, USD Million
- TABLE 184 Europe Database Monitoring Market by Country, 2020 - 2023, USD Million
- TABLE 185 Europe Database Monitoring Market by Country, 2024 - 2031, USD Million
- TABLE 186 Europe Network Performance Monitoring Market by Country, 2020 - 2023, USD Million
- TABLE 187 Europe Network Performance Monitoring Market by Country, 2024 - 2031, USD Million
- TABLE 188 Europe Other Type Market by Country, 2020 - 2023, USD Million
- TABLE 189 Europe Other Type Market by Country, 2024 - 2031, USD Million
- TABLE 190 Europe Application Performance Monitoring Software Market by Access Type, 2020 - 2023, USD Million
- TABLE 191 Europe Application Performance Monitoring Software Market by Access Type, 2024 - 2031, USD Million
- TABLE 192 Europe Web APM Market by Country, 2020 - 2023, USD Million
- TABLE 193 Europe Web APM Market by Country, 2024 - 2031, USD Million
- TABLE 194 Europe Mobile APM Market by Country, 2020 - 2023, USD Million
- TABLE 195 Europe Mobile APM Market by Country, 2024 - 2031, USD Million
- TABLE 196 Europe Other Access Type Market by Country, 2020 - 2023, USD Million
- TABLE 197 Europe Other Access Type Market by Country, 2024 - 2031, USD Million
- TABLE 198 Europe Application Performance Monitoring Software Market by Deployment, 2020 - 2023, USD Million
- TABLE 199 Europe Application Performance Monitoring Software Market by Deployment, 2024 - 2031, USD Million
- TABLE 200 Europe Cloud Market by Country, 2020 - 2023, USD Million
- TABLE 201 Europe Cloud Market by Country, 2024 - 2031, USD Million
- TABLE 202 Europe On-premises Market by Country, 2020 - 2023, USD Million
- TABLE 203 Europe On-premises Market by Country, 2024 - 2031, USD Million
- TABLE 204 Europe Application Performance Monitoring Software Market by End Use, 2020 - 2023, USD Million
- TABLE 205 Europe Application Performance Monitoring Software Market by End Use, 2024 - 2031, USD Million
- TABLE 206 Europe IT & Telecommunications Market by Country, 2020 - 2023, USD Million
- TABLE 207 Europe IT & Telecommunications Market by Country, 2024 - 2031, USD Million
- TABLE 208 Europe BFSI Market by Country, 2020 - 2023, USD Million
- TABLE 209 Europe BFSI Market by Country, 2024 - 2031, USD Million
- TABLE 210 Europe Retail Market by Country, 2020 - 2023, USD Million
- TABLE 211 Europe Retail Market by Country, 2024 - 2031, USD Million
- TABLE 212 Europe Healthcare Market by Country, 2020 - 2023, USD Million
- TABLE 213 Europe Healthcare Market by Country, 2024 - 2031, USD Million
- TABLE 214 Europe Media & Entertainment Market by Country, 2020 - 2023, USD Million
- TABLE 215 Europe Media & Entertainment Market by Country, 2024 - 2031, USD Million
- TABLE 216 Europe E-Commerce Market by Country, 2020 - 2023, USD Million
- TABLE 217 Europe E-Commerce Market by Country, 2024 - 2031, USD Million
- TABLE 218 Europe Manufacturing Market by Country, 2020 - 2023, USD Million
- TABLE 219 Europe Manufacturing Market by Country, 2024 - 2031, USD Million
- TABLE 220 Europe Government & Academics Market by Country, 2020 - 2023, USD Million
- TABLE 221 Europe Government & Academics Market by Country, 2024 - 2031, USD Million
- TABLE 222 Europe Other End Use Market by Country, 2020 - 2023, USD Million
- TABLE 223 Europe Other End Use Market by Country, 2024 - 2031, USD Million
- TABLE 224 Europe Application Performance Monitoring Software Market by Country, 2020 - 2023, USD Million
- TABLE 225 Europe Application Performance Monitoring Software Market by Country, 2024 - 2031, USD Million
- TABLE 226 Germany Application Performance Monitoring Software Market, 2020 - 2023, USD Million
- TABLE 227 Germany Application Performance Monitoring Software Market, 2024 - 2031, USD Million
- TABLE 228 Germany Application Performance Monitoring Software Market by Enterprise Size, 2020 - 2023, USD Million
- TABLE 229 Germany Application Performance Monitoring Software Market by Enterprise Size, 2024 - 2031, USD Million
- TABLE 230 Germany Application Performance Monitoring Software Market by Type, 2020 - 2023, USD Million
- TABLE 231 Germany Application Performance Monitoring Software Market by Type, 2024 - 2031, USD Million
- TABLE 232 Germany Application Performance Monitoring Software Market by Access Type, 2020 - 2023, USD Million
- TABLE 233 Germany Application Performance Monitoring Software Market by Access Type, 2024 - 2031, USD Million
- TABLE 234 Germany Application Performance Monitoring Software Market by Deployment, 2020 - 2023, USD Million
- TABLE 235 Germany Application Performance Monitoring Software Market by Deployment, 2024 - 2031, USD Million
- TABLE 236 Germany Application Performance Monitoring Software Market by End Use, 2020 - 2023, USD Million
- TABLE 237 Germany Application Performance Monitoring Software Market by End Use, 2024 - 2031, USD Million
- TABLE 238 UK Application Performance Monitoring Software Market, 2020 - 2023, USD Million
- TABLE 239 UK Application Performance Monitoring Software Market, 2024 - 2031, USD Million
- TABLE 240 UK Application Performance Monitoring Software Market by Enterprise Size, 2020 - 2023, USD Million
- TABLE 241 UK Application Performance Monitoring Software Market by Enterprise Size, 2024 - 2031, USD Million
- TABLE 242 UK Application Performance Monitoring Software Market by Type, 2020 - 2023, USD Million
- TABLE 243 UK Application Performance Monitoring Software Market by Type, 2024 - 2031, USD Million
- TABLE 244 UK Application Performance Monitoring Software Market by Access Type, 2020 - 2023, USD Million
- TABLE 245 UK Application Performance Monitoring Software Market by Access Type, 2024 - 2031, USD Million
- TABLE 246 UK Application Performance Monitoring Software Market by Deployment, 2020 - 2023, USD Million
- TABLE 247 UK Application Performance Monitoring Software Market by Deployment, 2024 - 2031, USD Million
- TABLE 248 UK Application Performance Monitoring Software Market by End Use, 2020 - 2023, USD Million
- TABLE 249 UK Application Performance Monitoring Software Market by End Use, 2024 - 2031, USD Million
- TABLE 250 France Application Performance Monitoring Software Market, 2020 - 2023, USD Million
- TABLE 251 France Application Performance Monitoring Software Market, 2024 - 2031, USD Million
- TABLE 252 France Application Performance Monitoring Software Market by Enterprise Size, 2020 - 2023, USD Million
- TABLE 253 France Application Performance Monitoring Software Market by Enterprise Size, 2024 - 2031, USD Million
- TABLE 254 France Application Performance Monitoring Software Market by Type, 2020 - 2023, USD Million
- TABLE 255 France Application Performance Monitoring Software Market by Type, 2024 - 2031, USD Million
- TABLE 256 France Application Performance Monitoring Software Market by Access Type, 2020 - 2023, USD Million
- TABLE 257 France Application Performance Monitoring Software Market by Access Type, 2024 - 2031, USD Million
- TABLE 258 France Application Performance Monitoring Software Market by Deployment, 2020 - 2023, USD Million
- TABLE 259 France Application Performance Monitoring Software Market by Deployment, 2024 - 2031, USD Million
- TABLE 260 France Application Performance Monitoring Software Market by End Use, 2020 - 2023, USD Million
- TABLE 261 France Application Performance Monitoring Software Market by End Use, 2024 - 2031, USD Million
- TABLE 262 Russia Application Performance Monitoring Software Market, 2020 - 2023, USD Million
- TABLE 263 Russia Application Performance Monitoring Software Market, 2024 - 2031, USD Million
- TABLE 264 Russia Application Performance Monitoring Software Market by Enterprise Size, 2020 - 2023, USD Million
- TABLE 265 Russia Application Performance Monitoring Software Market by Enterprise Size, 2024 - 2031, USD Million
- TABLE 266 Russia Application Performance Monitoring Software Market by Type, 2020 - 2023, USD Million
- TABLE 267 Russia Application Performance Monitoring Software Market by Type, 2024 - 2031, USD Million
- TABLE 268 Russia Application Performance Monitoring Software Market by Access Type, 2020 - 2023, USD Million
- TABLE 269 Russia Application Performance Monitoring Software Market by Access Type, 2024 - 2031, USD Million
- TABLE 270 Russia Application Performance Monitoring Software Market by Deployment, 2020 - 2023, USD Million
- TABLE 271 Russia Application Performance Monitoring Software Market by Deployment, 2024 - 2031, USD Million
- TABLE 272 Russia Application Performance Monitoring Software Market by End Use, 2020 - 2023, USD Million
- TABLE 273 Russia Application Performance Monitoring Software Market by End Use, 2024 - 2031, USD Million
- TABLE 274 Spain Application Performance Monitoring Software Market, 2020 - 2023, USD Million
- TABLE 275 Spain Application Performance Monitoring Software Market, 2024 - 2031, USD Million
- TABLE 276 Spain Application Performance Monitoring Software Market by Enterprise Size, 2020 - 2023, USD Million
- TABLE 277 Spain Application Performance Monitoring Software Market by Enterprise Size, 2024 - 2031, USD Million
- TABLE 278 Spain Application Performance Monitoring Software Market by Type, 2020 - 2023, USD Million
- TABLE 279 Spain Application Performance Monitoring Software Market by Type, 2024 - 2031, USD Million
- TABLE 280 Spain Application Performance Monitoring Software Market by Access Type, 2020 - 2023, USD Million
- TABLE 281 Spain Application Performance Monitoring Software Market by Access Type, 2024 - 2031, USD Million
- TABLE 282 Spain Application Performance Monitoring Software Market by Deployment, 2020 - 2023, USD Million
- TABLE 283 Spain Application Performance Monitoring Software Market by Deployment, 2024 - 2031, USD Million
- TABLE 284 Spain Application Performance Monitoring Software Market by End Use, 2020 - 2023, USD Million
- TABLE 285 Spain Application Performance Monitoring Software Market by End Use, 2024 - 2031, USD Million
- TABLE 286 Italy Application Performance Monitoring Software Market, 2020 - 2023, USD Million
- TABLE 287 Italy Application Performance Monitoring Software Market, 2024 - 2031, USD Million
- TABLE 288 Italy Application Performance Monitoring Software Market by Enterprise Size, 2020 - 2023, USD Million
- TABLE 289 Italy Application Performance Monitoring Software Market by Enterprise Size, 2024 - 2031, USD Million
- TABLE 290 Italy Application Performance Monitoring Software Market by Type, 2020 - 2023, USD Million
- TABLE 291 Italy Application Performance Monitoring Software Market by Type, 2024 - 2031, USD Million
- TABLE 292 Italy Application Performance Monitoring Software Market by Access Type, 2020 - 2023, USD Million
- TABLE 293 Italy Application Performance Monitoring Software Market by Access Type, 2024 - 2031, USD Million
- TABLE 294 Italy Application Performance Monitoring Software Market by Deployment, 2020 - 2023, USD Million
- TABLE 295 Italy Application Performance Monitoring Software Market by Deployment, 2024 - 2031, USD Million
- TABLE 296 Italy Application Performance Monitoring Software Market by End Use, 2020 - 2023, USD Million
- TABLE 297 Italy Application Performance Monitoring Software Market by End Use, 2024 - 2031, USD Million
- TABLE 298 Rest of Europe Application Performance Monitoring Software Market, 2020 - 2023, USD Million
- TABLE 299 Rest of Europe Application Performance Monitoring Software Market, 2024 - 2031, USD Million
- TABLE 300 Rest of Europe Application Performance Monitoring Software Market by Enterprise Size, 2020 - 2023, USD Million
- TABLE 301 Rest of Europe Application Performance Monitoring Software Market by Enterprise Size, 2024 - 2031, USD Million
- TABLE 302 Rest of Europe Application Performance Monitoring Software Market by Type, 2020 - 2023, USD Million
- TABLE 303 Rest of Europe Application Performance Monitoring Software Market by Type, 2024 - 2031, USD Million
- TABLE 304 Rest of Europe Application Performance Monitoring Software Market by Access Type, 2020 - 2023, USD Million
- TABLE 305 Rest of Europe Application Performance Monitoring Software Market by Access Type, 2024 - 2031, USD Million
- TABLE 306 Rest of Europe Application Performance Monitoring Software Market by Deployment, 2020 - 2023, USD Million
- TABLE 307 Rest of Europe Application Performance Monitoring Software Market by Deployment, 2024 - 2031, USD Million
- TABLE 308 Rest of Europe Application Performance Monitoring Software Market by End Use, 2020 - 2023, USD Million
- TABLE 309 Rest of Europe Application Performance Monitoring Software Market by End Use, 2024 - 2031, USD Million
- TABLE 310 Asia Pacific Application Performance Monitoring Software Market, 2020 - 2023, USD Million
- TABLE 311 Asia Pacific Application Performance Monitoring Software Market, 2024 - 2031, USD Million
- TABLE 312 Asia Pacific Application Performance Monitoring Software Market by Enterprise Size, 2020 - 2023, USD Million
- TABLE 313 Asia Pacific Application Performance Monitoring Software Market by Enterprise Size, 2024 - 2031, USD Million
- TABLE 314 Asia Pacific Large Enterprise Market by Country, 2020 - 2023, USD Million
- TABLE 315 Asia Pacific Large Enterprise Market by Country, 2024 - 2031, USD Million
- TABLE 316 Asia Pacific Small & Medium Enterprise (SME) Market by Country, 2020 - 2023, USD Million
- TABLE 317 Asia Pacific Small & Medium Enterprise (SME) Market by Country, 2024 - 2031, USD Million
- TABLE 318 Asia Pacific Application Performance Monitoring Software Market by Type, 2020 - 2023, USD Million
- TABLE 319 Asia Pacific Application Performance Monitoring Software Market by Type, 2024 - 2031, USD Million
- TABLE 320 Asia Pacific Real User Monitoring (RUM) Market by Country, 2020 - 2023, USD Million
- TABLE 321 Asia Pacific Real User Monitoring (RUM) Market by Country, 2024 - 2031, USD Million
- TABLE 322 Asia Pacific Synthetic Monitoring Market by Country, 2020 - 2023, USD Million
- TABLE 323 Asia Pacific Synthetic Monitoring Market by Country, 2024 - 2031, USD Million
- TABLE 324 Asia Pacific Server-Side Monitoring Market by Country, 2020 - 2023, USD Million
- TABLE 325 Asia Pacific Server-Side Monitoring Market by Country, 2024 - 2031, USD Million
- TABLE 326 Asia Pacific Database Monitoring Market by Country, 2020 - 2023, USD Million
- TABLE 327 Asia Pacific Database Monitoring Market by Country, 2024 - 2031, USD Million
- TABLE 328 Asia Pacific Network Performance Monitoring Market by Country, 2020 - 2023, USD Million
- TABLE 329 Asia Pacific Network Performance Monitoring Market by Country, 2024 - 2031, USD Million
- TABLE 330 Asia Pacific Other Type Market by Country, 2020 - 2023, USD Million
- TABLE 331 Asia Pacific Other Type Market by Country, 2024 - 2031, USD Million
- TABLE 332 Asia Pacific Application Performance Monitoring Software Market by Access Type, 2020 - 2023, USD Million
- TABLE 333 Asia Pacific Application Performance Monitoring Software Market by Access Type, 2024 - 2031, USD Million
- TABLE 334 Asia Pacific Web APM Market by Country, 2020 - 2023, USD Million
- TABLE 335 Asia Pacific Web APM Market by Country, 2024 - 2031, USD Million
- TABLE 336 Asia Pacific Mobile APM Market by Country, 2020 - 2023, USD Million
- TABLE 337 Asia Pacific Mobile APM Market by Country, 2024 - 2031, USD Million
- TABLE 338 Asia Pacific Other Access Type Market by Country, 2020 - 2023, USD Million
- TABLE 339 Asia Pacific Other Access Type Market by Country, 2024 - 2031, USD Million
- TABLE 340 Asia Pacific Application Performance Monitoring Software Market by Deployment, 2020 - 2023, USD Million
- TABLE 341 Asia Pacific Application Performance Monitoring Software Market by Deployment, 2024 - 2031, USD Million
- TABLE 342 Asia Pacific Cloud Market by Country, 2020 - 2023, USD Million
- TABLE 343 Asia Pacific Cloud Market by Country, 2024 - 2031, USD Million
- TABLE 344 Asia Pacific On-premises Market by Country, 2020 - 2023, USD Million
- TABLE 345 Asia Pacific On-premises Market by Country, 2024 - 2031, USD Million
- TABLE 346 Asia Pacific Application Performance Monitoring Software Market by End Use, 2020 - 2023, USD Million
- TABLE 347 Asia Pacific Application Performance Monitoring Software Market by End Use, 2024 - 2031, USD Million
- TABLE 348 Asia Pacific IT & Telecommunications Market by Country, 2020 - 2023, USD Million
- TABLE 349 Asia Pacific IT & Telecommunications Market by Country, 2024 - 2031, USD Million
- TABLE 350 Asia Pacific BFSI Market by Country, 2020 - 2023, USD Million
- TABLE 351 Asia Pacific BFSI Market by Country, 2024 - 2031, USD Million
- TABLE 352 Asia Pacific Retail Market by Country, 2020 - 2023, USD Million
- TABLE 353 Asia Pacific Retail Market by Country, 2024 - 2031, USD Million
- TABLE 354 Asia Pacific Healthcare Market by Country, 2020 - 2023, USD Million
- TABLE 355 Asia Pacific Healthcare Market by Country, 2024 - 2031, USD Million
- TABLE 356 Asia Pacific Media & Entertainment Market by Country, 2020 - 2023, USD Million
- TABLE 357 Asia Pacific Media & Entertainment Market by Country, 2024 - 2031, USD Million
- TABLE 358 Asia Pacific E-Commerce Market by Country, 2020 - 2023, USD Million
- TABLE 359 Asia Pacific E-Commerce Market by Country, 2024 - 2031, USD Million
- TABLE 360 Asia Pacific Manufacturing Market by Country, 2020 - 2023, USD Million
- TABLE 361 Asia Pacific Manufacturing Market by Country, 2024 - 2031, USD Million
- TABLE 362 Asia Pacific Government & Academics Market by Country, 2020 - 2023, USD Million
- TABLE 363 Asia Pacific Government & Academics Market by Country, 2024 - 2031, USD Million
- TABLE 364 Asia Pacific Other End Use Market by Country, 2020 - 2023, USD Million
- TABLE 365 Asia Pacific Other End Use Market by Country, 2024 - 2031, USD Million
- TABLE 366 Asia Pacific Application Performance Monitoring Software Market by Country, 2020 - 2023, USD Million
- TABLE 367 Asia Pacific Application Performance Monitoring Software Market by Country, 2024 - 2031, USD Million
- TABLE 368 China Application Performance Monitoring Software Market, 2020 - 2023, USD Million
- TABLE 369 China Application Performance Monitoring Software Market, 2024 - 2031, USD Million
- TABLE 370 China Application Performance Monitoring Software Market by Enterprise Size, 2020 - 2023, USD Million
- TABLE 371 China Application Performance Monitoring Software Market by Enterprise Size, 2024 - 2031, USD Million
- TABLE 372 China Application Performance Monitoring Software Market by Type, 2020 - 2023, USD Million
- TABLE 373 China Application Performance Monitoring Software Market by Type, 2024 - 2031, USD Million
- TABLE 374 China Application Performance Monitoring Software Market by Access Type, 2020 - 2023, USD Million
- TABLE 375 China Application Performance Monitoring Software Market by Access Type, 2024 - 2031, USD Million
- TABLE 376 China Application Performance Monitoring Software Market by Deployment, 2020 - 2023, USD Million
- TABLE 377 China Application Performance Monitoring Software Market by Deployment, 2024 - 2031, USD Million
- TABLE 378 China Application Performance Monitoring Software Market by End Use, 2020 - 2023, USD Million
- TABLE 379 China Application Performance Monitoring Software Market by End Use, 2024 - 2031, USD Million
- TABLE 380 Japan Application Performance Monitoring Software Market, 2020 - 2023, USD Million
- TABLE 381 Japan Application Performance Monitoring Software Market, 2024 - 2031, USD Million
- TABLE 382 Japan Application Performance Monitoring Software Market by Enterprise Size, 2020 - 2023, USD Million
- TABLE 383 Japan Application Performance Monitoring Software Market by Enterprise Size, 2024 - 2031, USD Million
- TABLE 384 Japan Application Performance Monitoring Software Market by Type, 2020 - 2023, USD Million
- TABLE 385 Japan Application Performance Monitoring Software Market by Type, 2024 - 2031, USD Million
- TABLE 386 Japan Application Performance Monitoring Software Market by Access Type, 2020 - 2023, USD Million
- TABLE 387 Japan Application Performance Monitoring Software Market by Access Type, 2024 - 2031, USD Million
- TABLE 388 Japan Application Performance Monitoring Software Market by Deployment, 2020 - 2023, USD Million
- TABLE 389 Japan Application Performance Monitoring Software Market by Deployment, 2024 - 2031, USD Million
- TABLE 390 Japan Application Performance Monitoring Software Market by End Use, 2020 - 2023, USD Million
- TABLE 391 Japan Application Performance Monitoring Software Market by End Use, 2024 - 2031, USD Million
- TABLE 392 India Application Performance Monitoring Software Market, 2020 - 2023, USD Million
- TABLE 393 India Application Performance Monitoring Software Market, 2024 - 2031, USD Million
- TABLE 394 India Application Performance Monitoring Software Market by Enterprise Size, 2020 - 2023, USD Million
- TABLE 395 India Application Performance Monitoring Software Market by Enterprise Size, 2024 - 2031, USD Million
- TABLE 396 India Application Performance Monitoring Software Market by Type, 2020 - 2023, USD Million
- TABLE 397 India Application Performance Monitoring Software Market by Type, 2024 - 2031, USD Million
- TABLE 398 India Application Performance Monitoring Software Market by Access Type, 2020 - 2023, USD Million
- TABLE 399 India Application Performance Monitoring Software Market by Access Type, 2024 - 2031, USD Million
- TABLE 400 India Application Performance Monitoring Software Market by Deployment, 2020 - 2023, USD Million
- TABLE 401 India Application Performance Monitoring Software Market by Deployment, 2024 - 2031, USD Million
- TABLE 402 India Application Performance Monitoring Software Market by End Use, 2020 - 2023, USD Million
- TABLE 403 India Application Performance Monitoring Software Market by End Use, 2024 - 2031, USD Million
- TABLE 404 South Korea Application Performance Monitoring Software Market, 2020 - 2023, USD Million
- TABLE 405 South Korea Application Performance Monitoring Software Market, 2024 - 2031, USD Million
- TABLE 406 South Korea Application Performance Monitoring Software Market by Enterprise Size, 2020 - 2023, USD Million
- TABLE 407 South Korea Application Performance Monitoring Software Market by Enterprise Size, 2024 - 2031, USD Million
- TABLE 408 South Korea Application Performance Monitoring Software Market by Type, 2020 - 2023, USD Million
- TABLE 409 South Korea Application Performance Monitoring Software Market by Type, 2024 - 2031, USD Million
- TABLE 410 South Korea Application Performance Monitoring Software Market by Access Type, 2020 - 2023, USD Million
- TABLE 411 South Korea Application Performance Monitoring Software Market by Access Type, 2024 - 2031, USD Million
- TABLE 412 South Korea Application Performance Monitoring Software Market by Deployment, 2020 - 2023, USD Million
- TABLE 413 South Korea Application Performance Monitoring Software Market by Deployment, 2024 - 2031, USD Million
- TABLE 414 South Korea Application Performance Monitoring Software Market by End Use, 2020 - 2023, USD Million
- TABLE 415 South Korea Application Performance Monitoring Software Market by End Use, 2024 - 2031, USD Million
- TABLE 416 Australia Application Performance Monitoring Software Market, 2020 - 2023, USD Million
- TABLE 417 Australia Application Performance Monitoring Software Market, 2024 - 2031, USD Million
- TABLE 418 Australia Application Performance Monitoring Software Market by Enterprise Size, 2020 - 2023, USD Million
- TABLE 419 Australia Application Performance Monitoring Software Market by Enterprise Size, 2024 - 2031, USD Million
- TABLE 420 Australia Application Performance Monitoring Software Market by Type, 2020 - 2023, USD Million
- TABLE 421 Australia Application Performance Monitoring Software Market by Type, 2024 - 2031, USD Million
- TABLE 422 Australia Application Performance Monitoring Software Market by Access Type, 2020 - 2023, USD Million
- TABLE 423 Australia Application Performance Monitoring Software Market by Access Type, 2024 - 2031, USD Million
- TABLE 424 Australia Application Performance Monitoring Software Market by Deployment, 2020 - 2023, USD Million
- TABLE 425 Australia Application Performance Monitoring Software Market by Deployment, 2024 - 2031, USD Million
- TABLE 426 Australia Application Performance Monitoring Software Market by End Use, 2020 - 2023, USD Million
- TABLE 427 Australia Application Performance Monitoring Software Market by End Use, 2024 - 2031, USD Million
- TABLE 428 Malaysia Application Performance Monitoring Software Market, 2020 - 2023, USD Million
- TABLE 429 Malaysia Application Performance Monitoring Software Market, 2024 - 2031, USD Million
- TABLE 430 Malaysia Application Performance Monitoring Software Market by Enterprise Size, 2020 - 2023, USD Million
- TABLE 431 Malaysia Application Performance Monitoring Software Market by Enterprise Size, 2024 - 2031, USD Million
- TABLE 432 Malaysia Application Performance Monitoring Software Market by Type, 2020 - 2023, USD Million
- TABLE 433 Malaysia Application Performance Monitoring Software Market by Type, 2024 - 2031, USD Million
- TABLE 434 Malaysia Application Performance Monitoring Software Market by Access Type, 2020 - 2023, USD Million
- TABLE 435 Malaysia Application Performance Monitoring Software Market by Access Type, 2024 - 2031, USD Million
- TABLE 436 Malaysia Application Performance Monitoring Software Market by Deployment, 2020 - 2023, USD Million
- TABLE 437 Malaysia Application Performance Monitoring Software Market by Deployment, 2024 - 2031, USD Million
- TABLE 438 Malaysia Application Performance Monitoring Software Market by End Use, 2020 - 2023, USD Million
- TABLE 439 Malaysia Application Performance Monitoring Software Market by End Use, 2024 - 2031, USD Million
- TABLE 440 Rest of Asia Pacific Application Performance Monitoring Software Market, 2020 - 2023, USD Million
- TABLE 441 Rest of Asia Pacific Application Performance Monitoring Software Market, 2024 - 2031, USD Million
- TABLE 442 Rest of Asia Pacific Application Performance Monitoring Software Market by Enterprise Size, 2020 - 2023, USD Million
- TABLE 443 Rest of Asia Pacific Application Performance Monitoring Software Market by Enterprise Size, 2024 - 2031, USD Million
- TABLE 444 Rest of Asia Pacific Application Performance Monitoring Software Market by Type, 2020 - 2023, USD Million
- TABLE 445 Rest of Asia Pacific Application Performance Monitoring Software Market by Type, 2024 - 2031, USD Million
- TABLE 446 Rest of Asia Pacific Application Performance Monitoring Software Market by Access Type, 2020 - 2023, USD Million
- TABLE 447 Rest of Asia Pacific Application Performance Monitoring Software Market by Access Type, 2024 - 2031, USD Million
- TABLE 448 Rest of Asia Pacific Application Performance Monitoring Software Market by Deployment, 2020 - 2023, USD Million
- TABLE 449 Rest of Asia Pacific Application Performance Monitoring Software Market by Deployment, 2024 - 2031, USD Million
- TABLE 450 Rest of Asia Pacific Application Performance Monitoring Software Market by End Use, 2020 - 2023, USD Million
- TABLE 451 Rest of Asia Pacific Application Performance Monitoring Software Market by End Use, 2024 - 2031, USD Million
- TABLE 452 LAMEA Application Performance Monitoring Software Market, 2020 - 2023, USD Million
- TABLE 453 LAMEA Application Performance Monitoring Software Market, 2024 - 2031, USD Million
- TABLE 454 LAMEA Application Performance Monitoring Software Market by Enterprise Size, 2020 - 2023, USD Million
- TABLE 455 LAMEA Application Performance Monitoring Software Market by Enterprise Size, 2024 - 2031, USD Million
- TABLE 456 LAMEA Large Enterprise Market by Country, 2020 - 2023, USD Million
- TABLE 457 LAMEA Large Enterprise Market by Country, 2024 - 2031, USD Million
- TABLE 458 LAMEA Small & Medium Enterprise (SME) Market by Country, 2020 - 2023, USD Million
- TABLE 459 LAMEA Small & Medium Enterprise (SME) Market by Country, 2024 - 2031, USD Million
- TABLE 460 LAMEA Application Performance Monitoring Software Market by Type, 2020 - 2023, USD Million
- TABLE 461 LAMEA Application Performance Monitoring Software Market by Type, 2024 - 2031, USD Million
- TABLE 462 LAMEA Real User Monitoring (RUM) Market by Country, 2020 - 2023, USD Million
- TABLE 463 LAMEA Real User Monitoring (RUM) Market by Country, 2024 - 2031, USD Million
- TABLE 464 LAMEA Synthetic Monitoring Market by Country, 2020 - 2023, USD Million
- TABLE 465 LAMEA Synthetic Monitoring Market by Country, 2024 - 2031, USD Million
- TABLE 466 LAMEA Server-Side Monitoring Market by Country, 2020 - 2023, USD Million
- TABLE 467 LAMEA Server-Side Monitoring Market by Country, 2024 - 2031, USD Million
- TABLE 468 LAMEA Database Monitoring Market by Country, 2020 - 2023, USD Million
- TABLE 469 LAMEA Database Monitoring Market by Country, 2024 - 2031, USD Million
- TABLE 470 LAMEA Network Performance Monitoring Market by Country, 2020 - 2023, USD Million
- TABLE 471 LAMEA Network Performance Monitoring Market by Country, 2024 - 2031, USD Million
- TABLE 472 LAMEA Other Type Market by Country, 2020 - 2023, USD Million
- TABLE 473 LAMEA Other Type Market by Country, 2024 - 2031, USD Million
- TABLE 474 LAMEA Application Performance Monitoring Software Market by Access Type, 2020 - 2023, USD Million
- TABLE 475 LAMEA Application Performance Monitoring Software Market by Access Type, 2024 - 2031, USD Million
- TABLE 476 LAMEA Web APM Market by Country, 2020 - 2023, USD Million
- TABLE 477 LAMEA Web APM Market by Country, 2024 - 2031, USD Million
- TABLE 478 LAMEA Mobile APM Market by Country, 2020 - 2023, USD Million
- TABLE 479 LAMEA Mobile APM Market by Country, 2024 - 2031, USD Million
- TABLE 480 LAMEA Other Access Type Market by Country, 2020 - 2023, USD Million
- TABLE 481 LAMEA Other Access Type Market by Country, 2024 - 2031, USD Million
- TABLE 482 LAMEA Application Performance Monitoring Software Market by Deployment, 2020 - 2023, USD Million
- TABLE 483 LAMEA Application Performance Monitoring Software Market by Deployment, 2024 - 2031, USD Million
- TABLE 484 LAMEA Cloud Market by Country, 2020 - 2023, USD Million
- TABLE 485 LAMEA Cloud Market by Country, 2024 - 2031, USD Million
- TABLE 486 LAMEA On-premises Market by Country, 2020 - 2023, USD Million
- TABLE 487 LAMEA On-premises Market by Country, 2024 - 2031, USD Million
- TABLE 488 LAMEA Application Performance Monitoring Software Market by End Use, 2020 - 2023, USD Million
- TABLE 489 LAMEA Application Performance Monitoring Software Market by End Use, 2024 - 2031, USD Million
- TABLE 490 LAMEA IT & Telecommunications Market by Country, 2020 - 2023, USD Million
- TABLE 491 LAMEA IT & Telecommunications Market by Country, 2024 - 2031, USD Million
- TABLE 492 LAMEA BFSI Market by Country, 2020 - 2023, USD Million
- TABLE 493 LAMEA BFSI Market by Country, 2024 - 2031, USD Million
- TABLE 494 LAMEA Retail Market by Country, 2020 - 2023, USD Million
- TABLE 495 LAMEA Retail Market by Country, 2024 - 2031, USD Million
- TABLE 496 LAMEA Healthcare Market by Country, 2020 - 2023, USD Million
- TABLE 497 LAMEA Healthcare Market by Country, 2024 - 2031, USD Million
- TABLE 498 LAMEA Media & Entertainment Market by Country, 2020 - 2023, USD Million
- TABLE 499 LAMEA Media & Entertainment Market by Country, 2024 - 2031, USD Million
- TABLE 500 LAMEA E-Commerce Market by Country, 2020 - 2023, USD Million
- TABLE 501 LAMEA E-Commerce Market by Country, 2024 - 2031, USD Million
- TABLE 502 LAMEA Manufacturing Market by Country, 2020 - 2023, USD Million
- TABLE 503 LAMEA Manufacturing Market by Country, 2024 - 2031, USD Million
- TABLE 504 LAMEA Government & Academics Market by Country, 2020 - 2023, USD Million
- TABLE 505 LAMEA Government & Academics Market by Country, 2024 - 2031, USD Million
- TABLE 506 LAMEA Other End Use Market by Country, 2020 - 2023, USD Million
- TABLE 507 LAMEA Other End Use Market by Country, 2024 - 2031, USD Million
- TABLE 508 LAMEA Application Performance Monitoring Software Market by Country, 2020 - 2023, USD Million
- TABLE 509 LAMEA Application Performance Monitoring Software Market by Country, 2024 - 2031, USD Million
- TABLE 510 Brazil Application Performance Monitoring Software Market, 2020 - 2023, USD Million
- TABLE 511 Brazil Application Performance Monitoring Software Market, 2024 - 2031, USD Million
- TABLE 512 Brazil Application Performance Monitoring Software Market by Enterprise Size, 2020 - 2023, USD Million
- TABLE 513 Brazil Application Performance Monitoring Software Market by Enterprise Size, 2024 - 2031, USD Million
- TABLE 514 Brazil Application Performance Monitoring Software Market by Type, 2020 - 2023, USD Million
- TABLE 515 Brazil Application Performance Monitoring Software Market by Type, 2024 - 2031, USD Million
- TABLE 516 Brazil Application Performance Monitoring Software Market by Access Type, 2020 - 2023, USD Million
- TABLE 517 Brazil Application Performance Monitoring Software Market by Access Type, 2024 - 2031, USD Million
- TABLE 518 Brazil Application Performance Monitoring Software Market by Deployment, 2020 - 2023, USD Million
- TABLE 519 Brazil Application Performance Monitoring Software Market by Deployment, 2024 - 2031, USD Million
- TABLE 520 Brazil Application Performance Monitoring Software Market by End Use, 2020 - 2023, USD Million
- TABLE 521 Brazil Application Performance Monitoring Software Market by End Use, 2024 - 2031, USD Million
- TABLE 522 Argentina Application Performance Monitoring Software Market, 2020 - 2023, USD Million
- TABLE 523 Argentina Application Performance Monitoring Software Market, 2024 - 2031, USD Million
- TABLE 524 Argentina Application Performance Monitoring Software Market by Enterprise Size, 2020 - 2023, USD Million
- TABLE 525 Argentina Application Performance Monitoring Software Market by Enterprise Size, 2024 - 2031, USD Million
- TABLE 526 Argentina Application Performance Monitoring Software Market by Type, 2020 - 2023, USD Million
- TABLE 527 Argentina Application Performance Monitoring Software Market by Type, 2024 - 2031, USD Million
- TABLE 528 Argentina Application Performance Monitoring Software Market by Access Type, 2020 - 2023, USD Million
- TABLE 529 Argentina Application Performance Monitoring Software Market by Access Type, 2024 - 2031, USD Million
- TABLE 530 Argentina Application Performance Monitoring Software Market by Deployment, 2020 - 2023, USD Million
- TABLE 531 Argentina Application Performance Monitoring Software Market by Deployment, 2024 - 2031, USD Million
- TABLE 532 Argentina Application Performance Monitoring Software Market by End Use, 2020 - 2023, USD Million
- TABLE 533 Argentina Application Performance Monitoring Software Market by End Use, 2024 - 2031, USD Million
- TABLE 534 UAE Application Performance Monitoring Software Market, 2020 - 2023, USD Million
- TABLE 535 UAE Application Performance Monitoring Software Market, 2024 - 2031, USD Million
- TABLE 536 UAE Application Performance Monitoring Software Market by Enterprise Size, 2020 - 2023, USD Million
- TABLE 537 UAE Application Performance Monitoring Software Market by Enterprise Size, 2024 - 2031, USD Million
- TABLE 538 UAE Application Performance Monitoring Software Market by Type, 2020 - 2023, USD Million
- TABLE 539 UAE Application Performance Monitoring Software Market by Type, 2024 - 2031, USD Million
- TABLE 540 UAE Application Performance Monitoring Software Market by Access Type, 2020 - 2023, USD Million
- TABLE 541 UAE Application Performance Monitoring Software Market by Access Type, 2024 - 2031, USD Million
- TABLE 542 UAE Application Performance Monitoring Software Market by Deployment, 2020 - 2023, USD Million
- TABLE 543 UAE Application Performance Monitoring Software Market by Deployment, 2024 - 2031, USD Million
- TABLE 544 UAE Application Performance Monitoring Software Market by End Use, 2020 - 2023, USD Million
- TABLE 545 UAE Application Performance Monitoring Software Market by End Use, 2024 - 2031, USD Million
- TABLE 546 Saudi Arabia Application Performance Monitoring Software Market, 2020 - 2023, USD Million
- TABLE 547 Saudi Arabia Application Performance Monitoring Software Market, 2024 - 2031, USD Million
- TABLE 548 Saudi Arabia Application Performance Monitoring Software Market by Enterprise Size, 2020 - 2023, USD Million
- TABLE 549 Saudi Arabia Application Performance Monitoring Software Market by Enterprise Size, 2024 - 2031, USD Million
- TABLE 550 Saudi Arabia Application Performance Monitoring Software Market by Type, 2020 - 2023, USD Million
- TABLE 551 Saudi Arabia Application Performance Monitoring Software Market by Type, 2024 - 2031, USD Million
- TABLE 552 Saudi Arabia Application Performance Monitoring Software Market by Access Type, 2020 - 2023, USD Million
- TABLE 553 Saudi Arabia Application Performance Monitoring Software Market by Access Type, 2024 - 2031, USD Million
- TABLE 554 Saudi Arabia Application Performance Monitoring Software Market by Deployment, 2020 - 2023, USD Million
- TABLE 555 Saudi Arabia Application Performance Monitoring Software Market by Deployment, 2024 - 2031, USD Million
- TABLE 556 Saudi Arabia Application Performance Monitoring Software Market by End Use, 2020 - 2023, USD Million
- TABLE 557 Saudi Arabia Application Performance Monitoring Software Market by End Use, 2024 - 2031, USD Million
- TABLE 558 South Africa Application Performance Monitoring Software Market, 2020 - 2023, USD Million
- TABLE 559 South Africa Application Performance Monitoring Software Market, 2024 - 2031, USD Million
- TABLE 560 South Africa Application Performance Monitoring Software Market by Enterprise Size, 2020 - 2023, USD Million
- TABLE 561 South Africa Application Performance Monitoring Software Market by Enterprise Size, 2024 - 2031, USD Million
- TABLE 562 South Africa Application Performance Monitoring Software Market by Type, 2020 - 2023, USD Million
- TABLE 563 South Africa Application Performance Monitoring Software Market by Type, 2024 - 2031, USD Million
- TABLE 564 South Africa Application Performance Monitoring Software Market by Access Type, 2020 - 2023, USD Million
- TABLE 565 South Africa Application Performance Monitoring Software Market by Access Type, 2024 - 2031, USD Million
- TABLE 566 South Africa Application Performance Monitoring Software Market by Deployment, 2020 - 2023, USD Million
- TABLE 567 South Africa Application Performance Monitoring Software Market by Deployment, 2024 - 2031, USD Million
- TABLE 568 South Africa Application Performance Monitoring Software Market by End Use, 2020 - 2023, USD Million
- TABLE 569 South Africa Application Performance Monitoring Software Market by End Use, 2024 - 2031, USD Million
- TABLE 570 Nigeria Application Performance Monitoring Software Market, 2020 - 2023, USD Million
- TABLE 571 Nigeria Application Performance Monitoring Software Market, 2024 - 2031, USD Million
- TABLE 572 Nigeria Application Performance Monitoring Software Market by Enterprise Size, 2020 - 2023, USD Million
- TABLE 573 Nigeria Application Performance Monitoring Software Market by Enterprise Size, 2024 - 2031, USD Million
- TABLE 574 Nigeria Application Performance Monitoring Software Market by Type, 2020 - 2023, USD Million
- TABLE 575 Nigeria Application Performance Monitoring Software Market by Type, 2024 - 2031, USD Million
- TABLE 576 Nigeria Application Performance Monitoring Software Market by Access Type, 2020 - 2023, USD Million
- TABLE 577 Nigeria Application Performance Monitoring Software Market by Access Type, 2024 - 2031, USD Million
- TABLE 578 Nigeria Application Performance Monitoring Software Market by Deployment, 2020 - 2023, USD Million
- TABLE 579 Nigeria Application Performance Monitoring Software Market by Deployment, 2024 - 2031, USD Million
- TABLE 580 Nigeria Application Performance Monitoring Software Market by End Use, 2020 - 2023, USD Million
- TABLE 581 Nigeria Application Performance Monitoring Software Market by End Use, 2024 - 2031, USD Million
- TABLE 582 Rest of LAMEA Application Performance Monitoring Software Market, 2020 - 2023, USD Million
- TABLE 583 Rest of LAMEA Application Performance Monitoring Software Market, 2024 - 2031, USD Million
- TABLE 584 Rest of LAMEA Application Performance Monitoring Software Market by Enterprise Size, 2020 - 2023, USD Million
- TABLE 585 Rest of LAMEA Application Performance Monitoring Software Market by Enterprise Size, 2024 - 2031, USD Million
- TABLE 586 Rest of LAMEA Application Performance Monitoring Software Market by Type, 2020 - 2023, USD Million
- TABLE 587 Rest of LAMEA Application Performance Monitoring Software Market by Type, 2024 - 2031, USD Million
- TABLE 588 Rest of LAMEA Application Performance Monitoring Software Market by Access Type, 2020 - 2023, USD Million
- TABLE 589 Rest of LAMEA Application Performance Monitoring Software Market by Access Type, 2024 - 2031, USD Million
- TABLE 590 Rest of LAMEA Application Performance Monitoring Software Market by Deployment, 2020 - 2023, USD Million
- TABLE 591 Rest of LAMEA Application Performance Monitoring Software Market by Deployment, 2024 - 2031, USD Million
- TABLE 592 Rest of LAMEA Application Performance Monitoring Software Market by End Use, 2020 - 2023, USD Million
- TABLE 593 Rest of LAMEA Application Performance Monitoring Software Market by End Use, 2024 - 2031, USD Million
- TABLE 594 Key Information - Amazon Web Services, Inc.
- TABLE 595 Key Information - Cisco Systems, Inc.
- TABLE 596 Key Information - Broadcom, Inc.
- TABLE 597 Key Information - Datadog Cloud Monitoring
- TABLE 598 Key Information - Google LLC
- TABLE 599 Key Information - IBM Corporation
- TABLE 600 Key Information - Microsoft Corporation
- TABLE 601 Key Information - Oracle Corporation
- TABLE 602 Key Information - Open Text Corporation
- TABLE 603 Key Information - Dynatrace, Inc.
The Global Application Performance Monitoring Software Market size is expected to reach $13.5 billion by 2031, rising at a market growth of 14.3% CAGR during the forecast period.
As the European region's focus on digital transformation, particularly in industries like manufacturing, finance, and government services, have contributed to the rising demand for APM solutions. European companies have increasingly turned to APM tools to enhance the performance of their applications, especially as they adopt cloud and hybrid environments. Furthermore, the region's emphasis on data privacy and regulatory compliance has resulted in the widespread use of monitoring tools that guarantee the efficient operation of critical systems while adhering to rigorous performance standards. Consequently, the European region would acquire nearly 30% of the total market share by 2031.
The major strategies followed by the market participants are Product launches as the key developmental strategy to keep pace with the changing demands of end users. For instance, in July, 2024, Oracle Corporation unveiled OCI Stack Monitoring simplifies monitoring by automatically overseeing all hosts-whether in OCI, on-premises, or other clouds-through a new one-click UI. This feature enables automatic promotion of hosts for monitoring once an agent is deployed, ensuring seamless tracking with minimal effort. Moreover, in June, 2024, Datadog, Inc. unveiled its security offerings with Agentless Scanning, Data Security, and Code Security features. These updates help DevOps and security teams secure cloud environments and applications, providing essential visibility and context to manage and prioritize security risks in complex, cloud-native setups.
Market Growth Factors
Traditional monolithic software architectures, where applications are built as a single cohesive unit, have gradually given way to more modular approaches, such as microservices and containerized environments. APM software plays a vital role in addressing this complexity. In a microservices environment, each service operates independently, often on different servers, and communicates with other services through APIs. Hence, these factors are driving the growth of the market.
In a continuous integration and continuous delivery (CI/CD) environment, software updates can occur multiple times a day, leading to frequent changes in code and application configurations. Moreover, the rapid nature of CI/CD pipelines necessitates fast and efficient issue resolution, which APM software facilitates by offering deep diagnostics. Thus, the adoption of these technologies is aiding in the adoption of this software.
Market Restraining Factors
Implementing APM software often involves high upfront costs beyond licensing fees, including hardware upgrades and network reconfigurations. Additionally, the specialized nature of APM software demands skilled IT personnel to operate and manage it effectively. Hence, for smaller companies, the combined financial burden of implementation, training, and maintenance often outweighs the benefits, hindering the market's growth.
Enterprise Size Outlook
Based on enterprise size, the market is bifurcated into large enterprise and small &medium enterprise (SME). The small &medium enterprise (SME) segment procured 40% revenue share in the market in 2023. The growing demand for cloud-based and affordable APM software solutions, particularly in the wake of digital transformation, has led to increased adoption of APM tools.
Type Outlook
On the basis of type, the market is classified into real user monitoring (RUM), synthetic monitoring, server-side monitoring, database monitoring, network performance monitoring, and others. The synthetic monitoring segment recorded 22% revenue share in the market in 2023. Synthetic monitoring allows businesses to proactively simulate user journeys, testing application performance under different scenarios before real users are affected.
Access Type Outlook
By access type, the market is divided into web APM, mobile APM, and others. The mobile APM segment procured 31% revenue share in the market in 2023. This growth is fuelled by mobile applications' rapid proliferation and critical role in user engagement.
Deployment Outlook
Based on deployment, the market is segmented into cloud and on-premises. The on-premises segment recorded 45% revenue share in the market in 2023. Many large enterprises, especially those with strict data security and compliance requirements, rely on on-premises APM solutions to maintain greater control over their monitoring infrastructure.
End Use Outlook
On the basis of end use, the market is fragmented into IT & telecommunications, BFSI, retail, healthcare, media & entertainment, e-commerce, manufacturing, government, academics, and others. The BFSI segment garnered 19% revenue share in the market in 2023. Given the high stakes of financial transactions and data security, APM software monitors banking, financial, and insurance applications.
Regional Outlook
Region-wise, the market is analyzed across North America, Europe, Asia Pacific, and LAMEA. The North America segment recorded 35% revenue share in the market in 2023. The high adoption of advanced IT infrastructure, cloud services, and digital transformation initiatives across key industries drives the segment's growth.
Recent Strategies Deployed in the Market
- Aug-2024: Google LLC announced the partnership with Accenture, an Irish-American professional services company to boost enterprise solutions in generative AI and cybersecurity. They are expanding investments to support all stages of AI projects, from use case identification to deployment. The partnership also focuses on cybersecurity, addressing new risks, and enhancing breach management and recovery.
- Aug-2024: Microsoft Corporation announced the acquisition of Fungible Inc., which specializes in composable infrastructure for enhancing networking and storage in data centers using high-efficiency, low-power data processing units (DPUs). The Fungible team will integrate into Microsoft's data center engineering, focusing on DPU solutions and network innovation, reinforcing Microsoft's commitment to advanced data center technologies.
- Jul-2024: Cisco Systems, Inc. announced the partnership with Optus, an Australian telecommunications company to enhance network and data security for Optus Enterprise and Business clients. This includes expanding Optus' Integrated Network Operation Centre and Security Operation Centre, offering Cisco-Powered Secure Firewall and Managed Secure Service Edge, with future capabilities in Vulnerability Management and Threat Hunting.
- Feb-2024: Dynatrace, Inc. unveiled a new app, Databases, which simplifies database management by offering real-time monitoring of availability and performance. It enables deep architectural analysis for troubleshooting and provides a unified platform for DBAs, application owners, and ITOps to collaborate, ensuring efficient problem resolution and a single source of truth.
- Aug-2023: IBM Corporation announced the acquisition of Apptio Inc., a Bellevue, Washington-based company. This move integrates Apptio's solutions with IBM's IT automation tools, offering clients a comprehensive platform to optimize and automate their IT management and decision-making processes.
List of Key Companies Profiled
- Amazon Web Services, Inc. (Amazon.com, Inc.)
- Cisco Systems, Inc.
- Broadcom, Inc.
- Datadog, Inc.
- Google LLC (Alphabet Inc.)
- IBM Corporation
- Microsoft Corporation
- Oracle Corporation
- Open Text Corporation
- Dynatrace, Inc.
Global Application Performance Monitoring Software Market Report Segmentation
By Enterprise Size
- Large Enterprise
- Small & Medium Enterprise (SME)
By Type
- Real User Monitoring (RUM)
- Synthetic Monitoring
- Server-Side Monitoring
- Database Monitoring
- Network Performance Monitoring
- Other Type
By Access Type
- Web APM
- Mobile APM
- Other Access Type
By Deployment
- Cloud
- On-premises
By End Use
- IT & Telecommunications
- BFSI
- Retail
- Healthcare
- Media & Entertainment
- E-Commerce
- Manufacturing
- Government & Academics
- Other End Use
By Geography
- North America
- US
- Canada
- Mexico
- Rest of North America
- Europe
- Germany
- UK
- France
- Russia
- Spain
- Italy
- Rest of Europe
- Asia Pacific
- China
- Japan
- India
- South Korea
- Australia
- Malaysia
- Rest of Asia Pacific
- LAMEA
- Brazil
- Argentina
- UAE
- Saudi Arabia
- South Africa
- Nigeria
- Rest of LAMEA
Table of Contents
Chapter 1. Market Scope & Methodology
- 1.1 Market Definition
- 1.2 Objectives
- 1.3 Market Scope
- 1.4 Segmentation
- 1.4.1 Global Application Performance Monitoring Software Market, by Enterprise Size
- 1.4.2 Global Application Performance Monitoring Software Market, by Type
- 1.4.3 Global Application Performance Monitoring Software Market, by Access Type
- 1.4.4 Global Application Performance Monitoring Software Market, by Deployment
- 1.4.5 Global Application Performance Monitoring Software Market, by End Use
- 1.4.6 Global Application Performance Monitoring Software Market, by Geography
- 1.5 Methodology for the research
Chapter 2. Market at a Glance
- 2.1 Key Highlights
Chapter 3. Market Overview
- 3.1 Introduction
- 3.1.1 Overview
- 3.1.1.1 Market Composition and Scenario
- 3.1.1 Overview
- 3.2 Key Factors Impacting the Market
- 3.2.1 Market Drivers
- 3.2.2 Market Restraints
- 3.2.3 Market Opportunities
- 3.2.4 Market Challenges
Chapter 4. Competition Analysis - Global
- 4.1 KBV Cardinal Matrix
- 4.2 Recent Industry Wide Strategic Developments
- 4.2.1 Partnerships, Collaborations and Agreements
- 4.2.2 Product Launches and Product Expansions
- 4.2.3 Acquisition and Mergers
- 4.3 Market Share Analysis, 2023
- 4.4 Top Winning Strategies
- 4.4.1 Key Leading Strategies: Percentage Distribution (2020-2024)
- 4.4.2 Key Strategic Move: (Product Launches and Product Expansions : 2021, Jun - 2024, Jul) Leading Players
- 4.5 Porter Five Forces Analysis
Chapter 5. Global Application Performance Monitoring Software Market by Enterprise Size
- 5.1 Global Large Enterprise Market by Region
- 5.2 Global Small & Medium Enterprise (SME) Market by Region
Chapter 6. Global Application Performance Monitoring Software Market by Type
- 6.1 Global Real User Monitoring (RUM) Market by Region
- 6.2 Global Synthetic Monitoring Market by Region
- 6.3 Global Server-Side Monitoring Market by Region
- 6.4 Global Database Monitoring Market by Region
- 6.5 Global Network Performance Monitoring Market by Region
- 6.6 Global Other Type Market by Region
Chapter 7. Global Application Performance Monitoring Software Market by Access Type
- 7.1 Global Web APM Market by Region
- 7.2 Global Mobile APM Market by Region
- 7.3 Global Other Access Type Market by Region
Chapter 8. Global Application Performance Monitoring Software Market by Deployment
- 8.1 Global Cloud Market by Region
- 8.2 Global On-premises Market by Region
Chapter 9. Global Application Performance Monitoring Software Market by End Use
- 9.1 Global IT & Telecommunications Market by Region
- 9.2 Global BFSI Market by Region
- 9.3 Global Retail Market by Region
- 9.4 Global Healthcare Market by Region
- 9.5 Global Media & Entertainment Market by Region
- 9.6 Global E-Commerce Market by Region
- 9.7 Global Manufacturing Market by Region
- 9.8 Global Government & Academics Market by Region
- 9.9 Global Other End Use Market by Region
Chapter 10. Global Application Performance Monitoring Software Market by Region
- 10.1 North America Application Performance Monitoring Software Market
- 10.1.1 North America Application Performance Monitoring Software Market by Enterprise Size
- 10.1.1.1 North America Large Enterprise Market by Region
- 10.1.1.2 North America Small & Medium Enterprise (SME) Market by Region
- 10.1.2 North America Application Performance Monitoring Software Market by Type
- 10.1.2.1 North America Real User Monitoring (RUM) Market by Country
- 10.1.2.2 North America Synthetic Monitoring Market by Country
- 10.1.2.3 North America Server-Side Monitoring Market by Country
- 10.1.2.4 North America Database Monitoring Market by Country
- 10.1.2.5 North America Network Performance Monitoring Market by Country
- 10.1.2.6 North America Other Type Market by Country
- 10.1.3 North America Application Performance Monitoring Software Market by Access Type
- 10.1.3.1 North America Web APM Market by Country
- 10.1.3.2 North America Mobile APM Market by Country
- 10.1.3.3 North America Other Access Type Market by Country
- 10.1.4 North America Application Performance Monitoring Software Market by Deployment
- 10.1.4.1 North America Cloud Market by Country
- 10.1.4.2 North America On-premises Market by Country
- 10.1.5 North America Application Performance Monitoring Software Market by End Use
- 10.1.5.1 North America IT & Telecommunications Market by Country
- 10.1.5.2 North America BFSI Market by Country
- 10.1.5.3 North America Retail Market by Country
- 10.1.5.4 North America Healthcare Market by Country
- 10.1.5.5 North America Media & Entertainment Market by Country
- 10.1.5.6 North America E-Commerce Market by Country
- 10.1.5.7 North America Manufacturing Market by Country
- 10.1.5.8 North America Government & Academics Market by Country
- 10.1.5.9 North America Other End Use Market by Country
- 10.1.6 North America Application Performance Monitoring Software Market by Country
- 10.1.6.1 US Application Performance Monitoring Software Market
- 10.1.6.1.1 US Application Performance Monitoring Software Market by Enterprise Size
- 10.1.6.1.2 US Application Performance Monitoring Software Market by Type
- 10.1.6.1.3 US Application Performance Monitoring Software Market by Access Type
- 10.1.6.1.4 US Application Performance Monitoring Software Market by Deployment
- 10.1.6.1.5 US Application Performance Monitoring Software Market by End Use
- 10.1.6.2 Canada Application Performance Monitoring Software Market
- 10.1.6.2.1 Canada Application Performance Monitoring Software Market by Enterprise Size
- 10.1.6.2.2 Canada Application Performance Monitoring Software Market by Type
- 10.1.6.2.3 Canada Application Performance Monitoring Software Market by Access Type
- 10.1.6.2.4 Canada Application Performance Monitoring Software Market by Deployment
- 10.1.6.2.5 Canada Application Performance Monitoring Software Market by End Use
- 10.1.6.3 Mexico Application Performance Monitoring Software Market
- 10.1.6.3.1 Mexico Application Performance Monitoring Software Market by Enterprise Size
- 10.1.6.3.2 Mexico Application Performance Monitoring Software Market by Type
- 10.1.6.3.3 Mexico Application Performance Monitoring Software Market by Access Type
- 10.1.6.3.4 Mexico Application Performance Monitoring Software Market by Deployment
- 10.1.6.3.5 Mexico Application Performance Monitoring Software Market by End Use
- 10.1.6.4 Rest of North America Application Performance Monitoring Software Market
- 10.1.6.4.1 Rest of North America Application Performance Monitoring Software Market by Enterprise Size
- 10.1.6.4.2 Rest of North America Application Performance Monitoring Software Market by Type
- 10.1.6.4.3 Rest of North America Application Performance Monitoring Software Market by Access Type
- 10.1.6.4.4 Rest of North America Application Performance Monitoring Software Market by Deployment
- 10.1.6.4.5 Rest of North America Application Performance Monitoring Software Market by End Use
- 10.1.6.1 US Application Performance Monitoring Software Market
- 10.1.1 North America Application Performance Monitoring Software Market by Enterprise Size
- 10.2 Europe Application Performance Monitoring Software Market
- 10.2.1 Europe Application Performance Monitoring Software Market by Enterprise Size
- 10.2.1.1 Europe Large Enterprise Market by Country
- 10.2.1.2 Europe Small & Medium Enterprise (SME) Market by Country
- 10.2.2 Europe Application Performance Monitoring Software Market by Type
- 10.2.2.1 Europe Real User Monitoring (RUM) Market by Country
- 10.2.2.2 Europe Synthetic Monitoring Market by Country
- 10.2.2.3 Europe Server-Side Monitoring Market by Country
- 10.2.2.4 Europe Database Monitoring Market by Country
- 10.2.2.5 Europe Network Performance Monitoring Market by Country
- 10.2.2.6 Europe Other Type Market by Country
- 10.2.3 Europe Application Performance Monitoring Software Market by Access Type
- 10.2.3.1 Europe Web APM Market by Country
- 10.2.3.2 Europe Mobile APM Market by Country
- 10.2.3.3 Europe Other Access Type Market by Country
- 10.2.4 Europe Application Performance Monitoring Software Market by Deployment
- 10.2.4.1 Europe Cloud Market by Country
- 10.2.4.2 Europe On-premises Market by Country
- 10.2.5 Europe Application Performance Monitoring Software Market by End Use
- 10.2.5.1 Europe IT & Telecommunications Market by Country
- 10.2.5.2 Europe BFSI Market by Country
- 10.2.5.3 Europe Retail Market by Country
- 10.2.5.4 Europe Healthcare Market by Country
- 10.2.5.5 Europe Media & Entertainment Market by Country
- 10.2.5.6 Europe E-Commerce Market by Country
- 10.2.5.7 Europe Manufacturing Market by Country
- 10.2.5.8 Europe Government & Academics Market by Country
- 10.2.5.9 Europe Other End Use Market by Country
- 10.2.6 Europe Application Performance Monitoring Software Market by Country
- 10.2.6.1 Germany Application Performance Monitoring Software Market
- 10.2.6.1.1 Germany Application Performance Monitoring Software Market by Enterprise Size
- 10.2.6.1.2 Germany Application Performance Monitoring Software Market by Type
- 10.2.6.1.3 Germany Application Performance Monitoring Software Market by Access Type
- 10.2.6.1.4 Germany Application Performance Monitoring Software Market by Deployment
- 10.2.6.1.5 Germany Application Performance Monitoring Software Market by End Use
- 10.2.6.2 UK Application Performance Monitoring Software Market
- 10.2.6.2.1 UK Application Performance Monitoring Software Market by Enterprise Size
- 10.2.6.2.2 UK Application Performance Monitoring Software Market by Type
- 10.2.6.2.3 UK Application Performance Monitoring Software Market by Access Type
- 10.2.6.2.4 UK Application Performance Monitoring Software Market by Deployment
- 10.2.6.2.5 UK Application Performance Monitoring Software Market by End Use
- 10.2.6.3 France Application Performance Monitoring Software Market
- 10.2.6.3.1 France Application Performance Monitoring Software Market by Enterprise Size
- 10.2.6.3.2 France Application Performance Monitoring Software Market by Type
- 10.2.6.3.3 France Application Performance Monitoring Software Market by Access Type
- 10.2.6.3.4 France Application Performance Monitoring Software Market by Deployment
- 10.2.6.3.5 France Application Performance Monitoring Software Market by End Use
- 10.2.6.4 Russia Application Performance Monitoring Software Market
- 10.2.6.4.1 Russia Application Performance Monitoring Software Market by Enterprise Size
- 10.2.6.4.2 Russia Application Performance Monitoring Software Market by Type
- 10.2.6.4.3 Russia Application Performance Monitoring Software Market by Access Type
- 10.2.6.4.4 Russia Application Performance Monitoring Software Market by Deployment
- 10.2.6.4.5 Russia Application Performance Monitoring Software Market by End Use
- 10.2.6.5 Spain Application Performance Monitoring Software Market
- 10.2.6.5.1 Spain Application Performance Monitoring Software Market by Enterprise Size
- 10.2.6.5.2 Spain Application Performance Monitoring Software Market by Type
- 10.2.6.5.3 Spain Application Performance Monitoring Software Market by Access Type
- 10.2.6.5.4 Spain Application Performance Monitoring Software Market by Deployment
- 10.2.6.5.5 Spain Application Performance Monitoring Software Market by End Use
- 10.2.6.6 Italy Application Performance Monitoring Software Market
- 10.2.6.6.1 Italy Application Performance Monitoring Software Market by Enterprise Size
- 10.2.6.6.2 Italy Application Performance Monitoring Software Market by Type
- 10.2.6.6.3 Italy Application Performance Monitoring Software Market by Access Type
- 10.2.6.6.4 Italy Application Performance Monitoring Software Market by Deployment
- 10.2.6.6.5 Italy Application Performance Monitoring Software Market by End Use
- 10.2.6.7 Rest of Europe Application Performance Monitoring Software Market
- 10.2.6.7.1 Rest of Europe Application Performance Monitoring Software Market by Enterprise Size
- 10.2.6.7.2 Rest of Europe Application Performance Monitoring Software Market by Type
- 10.2.6.7.3 Rest of Europe Application Performance Monitoring Software Market by Access Type
- 10.2.6.7.4 Rest of Europe Application Performance Monitoring Software Market by Deployment
- 10.2.6.7.5 Rest of Europe Application Performance Monitoring Software Market by End Use
- 10.2.6.1 Germany Application Performance Monitoring Software Market
- 10.2.1 Europe Application Performance Monitoring Software Market by Enterprise Size
- 10.3 Asia Pacific Application Performance Monitoring Software Market
- 10.3.1 Asia Pacific Application Performance Monitoring Software Market by Enterprise Size
- 10.3.1.1 Asia Pacific Large Enterprise Market by Country
- 10.3.1.2 Asia Pacific Small & Medium Enterprise (SME) Market by Country
- 10.3.2 Asia Pacific Application Performance Monitoring Software Market by Type
- 10.3.2.1 Asia Pacific Real User Monitoring (RUM) Market by Country
- 10.3.2.2 Asia Pacific Synthetic Monitoring Market by Country
- 10.3.2.3 Asia Pacific Server-Side Monitoring Market by Country
- 10.3.2.4 Asia Pacific Database Monitoring Market by Country
- 10.3.2.5 Asia Pacific Network Performance Monitoring Market by Country
- 10.3.2.6 Asia Pacific Other Type Market by Country
- 10.3.3 Asia Pacific Application Performance Monitoring Software Market by Access Type
- 10.3.3.1 Asia Pacific Web APM Market by Country
- 10.3.3.2 Asia Pacific Mobile APM Market by Country
- 10.3.3.3 Asia Pacific Other Access Type Market by Country
- 10.3.4 Asia Pacific Application Performance Monitoring Software Market by Deployment
- 10.3.4.1 Asia Pacific Cloud Market by Country
- 10.3.4.2 Asia Pacific On-premises Market by Country
- 10.3.5 Asia Pacific Application Performance Monitoring Software Market by End Use
- 10.3.5.1 Asia Pacific IT & Telecommunications Market by Country
- 10.3.5.2 Asia Pacific BFSI Market by Country
- 10.3.5.3 Asia Pacific Retail Market by Country
- 10.3.5.4 Asia Pacific Healthcare Market by Country
- 10.3.5.5 Asia Pacific Media & Entertainment Market by Country
- 10.3.5.6 Asia Pacific E-Commerce Market by Country
- 10.3.5.7 Asia Pacific Manufacturing Market by Country
- 10.3.5.8 Asia Pacific Government & Academics Market by Country
- 10.3.5.9 Asia Pacific Other End Use Market by Country
- 10.3.6 Asia Pacific Application Performance Monitoring Software Market by Country
- 10.3.6.1 China Application Performance Monitoring Software Market
- 10.3.6.1.1 China Application Performance Monitoring Software Market by Enterprise Size
- 10.3.6.1.2 China Application Performance Monitoring Software Market by Type
- 10.3.6.1.3 China Application Performance Monitoring Software Market by Access Type
- 10.3.6.1.4 China Application Performance Monitoring Software Market by Deployment
- 10.3.6.1.5 China Application Performance Monitoring Software Market by End Use
- 10.3.6.2 Japan Application Performance Monitoring Software Market
- 10.3.6.2.1 Japan Application Performance Monitoring Software Market by Enterprise Size
- 10.3.6.2.2 Japan Application Performance Monitoring Software Market by Type
- 10.3.6.2.3 Japan Application Performance Monitoring Software Market by Access Type
- 10.3.6.2.4 Japan Application Performance Monitoring Software Market by Deployment
- 10.3.6.2.5 Japan Application Performance Monitoring Software Market by End Use
- 10.3.6.3 India Application Performance Monitoring Software Market
- 10.3.6.3.1 India Application Performance Monitoring Software Market by Enterprise Size
- 10.3.6.3.2 India Application Performance Monitoring Software Market by Type
- 10.3.6.3.3 India Application Performance Monitoring Software Market by Access Type
- 10.3.6.3.4 India Application Performance Monitoring Software Market by Deployment
- 10.3.6.3.5 India Application Performance Monitoring Software Market by End Use
- 10.3.6.4 South Korea Application Performance Monitoring Software Market
- 10.3.6.4.1 South Korea Application Performance Monitoring Software Market by Enterprise Size
- 10.3.6.4.2 South Korea Application Performance Monitoring Software Market by Type
- 10.3.6.4.3 South Korea Application Performance Monitoring Software Market by Access Type
- 10.3.6.4.4 South Korea Application Performance Monitoring Software Market by Deployment
- 10.3.6.4.5 South Korea Application Performance Monitoring Software Market by End Use
- 10.3.6.5 Australia Application Performance Monitoring Software Market
- 10.3.6.5.1 Australia Application Performance Monitoring Software Market by Enterprise Size
- 10.3.6.5.2 Australia Application Performance Monitoring Software Market by Type
- 10.3.6.5.3 Australia Application Performance Monitoring Software Market by Access Type
- 10.3.6.5.4 Australia Application Performance Monitoring Software Market by Deployment
- 10.3.6.5.5 Australia Application Performance Monitoring Software Market by End Use
- 10.3.6.6 Malaysia Application Performance Monitoring Software Market
- 10.3.6.6.1 Malaysia Application Performance Monitoring Software Market by Enterprise Size
- 10.3.6.6.2 Malaysia Application Performance Monitoring Software Market by Type
- 10.3.6.6.3 Malaysia Application Performance Monitoring Software Market by Access Type
- 10.3.6.6.4 Malaysia Application Performance Monitoring Software Market by Deployment
- 10.3.6.6.5 Malaysia Application Performance Monitoring Software Market by End Use
- 10.3.6.7 Rest of Asia Pacific Application Performance Monitoring Software Market
- 10.3.6.7.1 Rest of Asia Pacific Application Performance Monitoring Software Market by Enterprise Size
- 10.3.6.7.2 Rest of Asia Pacific Application Performance Monitoring Software Market by Type
- 10.3.6.7.3 Rest of Asia Pacific Application Performance Monitoring Software Market by Access Type
- 10.3.6.7.4 Rest of Asia Pacific Application Performance Monitoring Software Market by Deployment
- 10.3.6.7.5 Rest of Asia Pacific Application Performance Monitoring Software Market by End Use
- 10.3.6.1 China Application Performance Monitoring Software Market
- 10.3.1 Asia Pacific Application Performance Monitoring Software Market by Enterprise Size
- 10.4 LAMEA Application Performance Monitoring Software Market
- 10.4.1 LAMEA Application Performance Monitoring Software Market by Enterprise Size
- 10.4.1.1 LAMEA Large Enterprise Market by Country
- 10.4.1.2 LAMEA Small & Medium Enterprise (SME) Market by Country
- 10.4.2 LAMEA Application Performance Monitoring Software Market by Type
- 10.4.2.1 LAMEA Real User Monitoring (RUM) Market by Country
- 10.4.2.2 LAMEA Synthetic Monitoring Market by Country
- 10.4.2.3 LAMEA Server-Side Monitoring Market by Country
- 10.4.2.4 LAMEA Database Monitoring Market by Country
- 10.4.2.5 LAMEA Network Performance Monitoring Market by Country
- 10.4.2.6 LAMEA Other Type Market by Country
- 10.4.3 LAMEA Application Performance Monitoring Software Market by Access Type
- 10.4.3.1 LAMEA Web APM Market by Country
- 10.4.3.2 LAMEA Mobile APM Market by Country
- 10.4.3.3 LAMEA Other Access Type Market by Country
- 10.4.4 LAMEA Application Performance Monitoring Software Market by Deployment
- 10.4.4.1 LAMEA Cloud Market by Country
- 10.4.4.2 LAMEA On-premises Market by Country
- 10.4.5 LAMEA Application Performance Monitoring Software Market by End Use
- 10.4.5.1 LAMEA IT & Telecommunications Market by Country
- 10.4.5.2 LAMEA BFSI Market by Country
- 10.4.5.3 LAMEA Retail Market by Country
- 10.4.5.4 LAMEA Healthcare Market by Country
- 10.4.5.5 LAMEA Media & Entertainment Market by Country
- 10.4.5.6 LAMEA E-Commerce Market by Country
- 10.4.5.7 LAMEA Manufacturing Market by Country
- 10.4.5.8 LAMEA Government & Academics Market by Country
- 10.4.5.9 LAMEA Other End Use Market by Country
- 10.4.6 LAMEA Application Performance Monitoring Software Market by Country
- 10.4.6.1 Brazil Application Performance Monitoring Software Market
- 10.4.6.1.1 Brazil Application Performance Monitoring Software Market by Enterprise Size
- 10.4.6.1.2 Brazil Application Performance Monitoring Software Market by Type
- 10.4.6.1.3 Brazil Application Performance Monitoring Software Market by Access Type
- 10.4.6.1.4 Brazil Application Performance Monitoring Software Market by Deployment
- 10.4.6.1.5 Brazil Application Performance Monitoring Software Market by End Use
- 10.4.6.2 Argentina Application Performance Monitoring Software Market
- 10.4.6.2.1 Argentina Application Performance Monitoring Software Market by Enterprise Size
- 10.4.6.2.2 Argentina Application Performance Monitoring Software Market by Type
- 10.4.6.2.3 Argentina Application Performance Monitoring Software Market by Access Type
- 10.4.6.2.4 Argentina Application Performance Monitoring Software Market by Deployment
- 10.4.6.2.5 Argentina Application Performance Monitoring Software Market by End Use
- 10.4.6.3 UAE Application Performance Monitoring Software Market
- 10.4.6.3.1 UAE Application Performance Monitoring Software Market by Enterprise Size
- 10.4.6.3.2 UAE Application Performance Monitoring Software Market by Type
- 10.4.6.3.3 UAE Application Performance Monitoring Software Market by Access Type
- 10.4.6.3.4 UAE Application Performance Monitoring Software Market by Deployment
- 10.4.6.3.5 UAE Application Performance Monitoring Software Market by End Use
- 10.4.6.4 Saudi Arabia Application Performance Monitoring Software Market
- 10.4.6.4.1 Saudi Arabia Application Performance Monitoring Software Market by Enterprise Size
- 10.4.6.4.2 Saudi Arabia Application Performance Monitoring Software Market by Type
- 10.4.6.4.3 Saudi Arabia Application Performance Monitoring Software Market by Access Type
- 10.4.6.4.4 Saudi Arabia Application Performance Monitoring Software Market by Deployment
- 10.4.6.4.5 Saudi Arabia Application Performance Monitoring Software Market by End Use
- 10.4.6.5 South Africa Application Performance Monitoring Software Market
- 10.4.6.5.1 South Africa Application Performance Monitoring Software Market by Enterprise Size
- 10.4.6.5.2 South Africa Application Performance Monitoring Software Market by Type
- 10.4.6.5.3 South Africa Application Performance Monitoring Software Market by Access Type
- 10.4.6.5.4 South Africa Application Performance Monitoring Software Market by Deployment
- 10.4.6.5.5 South Africa Application Performance Monitoring Software Market by End Use
- 10.4.6.6 Nigeria Application Performance Monitoring Software Market
- 10.4.6.6.1 Nigeria Application Performance Monitoring Software Market by Enterprise Size
- 10.4.6.6.2 Nigeria Application Performance Monitoring Software Market by Type
- 10.4.6.6.3 Nigeria Application Performance Monitoring Software Market by Access Type
- 10.4.6.6.4 Nigeria Application Performance Monitoring Software Market by Deployment
- 10.4.6.6.5 Nigeria Application Performance Monitoring Software Market by End Use
- 10.4.6.7 Rest of LAMEA Application Performance Monitoring Software Market
- 10.4.6.7.1 Rest of LAMEA Application Performance Monitoring Software Market by Enterprise Size
- 10.4.6.7.2 Rest of LAMEA Application Performance Monitoring Software Market by Type
- 10.4.6.7.3 Rest of LAMEA Application Performance Monitoring Software Market by Access Type
- 10.4.6.7.4 Rest of LAMEA Application Performance Monitoring Software Market by Deployment
- 10.4.6.7.5 Rest of LAMEA Application Performance Monitoring Software Market by End Use
- 10.4.6.1 Brazil Application Performance Monitoring Software Market
- 10.4.1 LAMEA Application Performance Monitoring Software Market by Enterprise Size
Chapter 11. Company Profiles
- 11.1 Amazon Web Services, Inc. (Amazon.com, Inc.)
- 11.1.1 Company Overview
- 11.1.2 Financial Analysis
- 11.1.3 Segmental Analysis
- 11.1.4 Recent strategies and developments:
- 11.1.4.1 Product Launches and Product Expansions:
- 11.1.5 SWOT Analysis
- 11.2 Cisco Systems, Inc.
- 11.2.1 Company Overview
- 11.2.2 Financial Analysis
- 11.2.3 Regional Analysis
- 11.2.4 Research & Development Expense
- 11.2.5 Recent strategies and developments:
- 11.2.5.1 Partnerships, Collaborations, and Agreements:
- 11.2.5.2 Product Launches and Product Expansions:
- 11.2.5.3 Acquisition and Mergers:
- 11.2.6 SWOT Analysis
- 11.3 Broadcom, Inc.
- 11.3.1 Company Overview
- 11.3.2 Financial Analysis
- 11.3.3 Segmental and Regional Analysis
- 11.3.4 Research & Development Expense
- 11.3.5 Recent strategies and developments:
- 11.3.5.1 Acquisition and Mergers:
- 11.3.6 SWOT Analysis
- 11.4 Datadog, Inc.
- 11.4.1 Company Overview
- 11.4.2 Financial Analysis
- 11.4.3 Research & Development Expenses
- 11.4.4 Recent strategies and developments:
- 11.4.4.1 Partnerships, Collaborations, and Agreements:
- 11.4.4.2 Product Launches and Product Expansions:
- 11.4.4.3 Acquisition and Mergers:
- 11.4.5 SWOT Analysis:
- 11.5 Google LLC (Alphabet Inc.)
- 11.5.1 Company Overview
- 11.5.2 Financial Analysis
- 11.5.3 Segmental and Regional Analysis
- 11.5.4 Research & Development Expense
- 11.5.5 Recent strategies and developments:
- 11.5.5.1 Partnerships, Collaborations, and Agreements:
- 11.5.6 SWOT Analysis
- 11.6 IBM Corporation
- 11.6.1 Company Overview
- 11.6.2 Financial Analysis
- 11.6.3 Regional & Segmental Analysis
- 11.6.4 Research & Development Expenses
- 11.6.5 Recent strategies and developments:
- 11.6.5.1 Product Launches and Product Expansions:
- 11.6.5.2 Acquisition and Mergers:
- 11.6.6 SWOT Analysis
- 11.7 Microsoft Corporation
- 11.7.1 Company Overview
- 11.7.2 Financial Analysis
- 11.7.3 Segmental and Regional Analysis
- 11.7.4 Research & Development Expenses
- 11.7.5 Recent strategies and developments:
- 11.7.5.1 Acquisition and Mergers:
- 11.7.6 SWOT Analysis
- 11.8 Oracle Corporation
- 11.8.1 Company Overview
- 11.8.2 Financial Analysis
- 11.8.3 Segmental and Regional Analysis
- 11.8.4 Research & Development Expense
- 11.8.5 Recent strategies and developments:
- 11.8.5.1 Product Launches and Product Expansions:
- 11.8.6 SWOT Analysis
- 11.9 Open Text Corporation
- 11.9.1 Company Overview
- 11.9.2 Financial Analysis
- 11.9.3 Segmental and Regional Analysis
- 11.9.4 Research & Development Expenses
- 11.9.5 SWOT Analysis
- 11.10. Dynatrace, Inc.
- 11.10.1 Company Overview
- 11.10.2 Financial Analysis
- 11.10.3 Regional Analysis
- 11.10.4 Research & Development Expenses
- 11.10.5 Recent strategies and developments:
- 11.10.5.1 Product Launches and Product Expansions:
- 11.10.5.2 Acquisition and Mergers:
- 11.10.6 SWOT Analysis:

