|
|
市場調査レポート
商品コード
1555899
アプリケーションパフォーマンスモニタリングの世界市場:市場規模、シェア、動向分析 - アクセスタイプ別、最終用途別、展開別、企業規模別、ソリューション別、地域別展望、予測、2024~2031年Global Application Performance Monitoring Market Size, Share & Trends Analysis Report By Access Type, By End-use, By Deployment, By Enterprise Size, By Solution, By Regional Outlook and Forecast, 2024 - 2031 |
||||||

|
|||||||
|
|||||||


| アプリケーションパフォーマンスモニタリングの世界市場:市場規模、シェア、動向分析 - アクセスタイプ別、最終用途別、展開別、企業規模別、ソリューション別、地域別展望、予測、2024~2031年 |
|
出版日: 2024年09月13日
発行: KBV Research
ページ情報: 英文 400 Pages
納期: 即納可能
|

全表示
- 概要
- 図表
- 目次
世界のアプリケーションパフォーマンスモニタリングの市場規模は、予測期間中にCAGR 14.7%で成長し、2031年までに209億米ドルに達すると予測されています。
KBV Cardinal matrixに提示された分析に基づくと、Microsoft CorporationとGoogle LLCはアプリケーションパフォーマンスモニタリング市場の先駆者です。Amazon Web Services、Inc.、Cisco Systems、Inc.、Broadcom、Inc.などの企業は、アプリケーションパフォーマンスモニタリング市場の主要なイノベーターの一部です。2024年5月、Cisco Systems、Inc.は、強化された異常検出、セキュリティ、SAP監視を備えたAI駆動型アプリケーション可観測性を提供するAppDynamics On-Premises用の新しい仮想アプライアンスを発表しました。このアップデートにより、パフォーマンス検出、セキュリティ、SAP管理が改善され、セルフホスト型ソリューションとSaaSソリューション間の移行を含む柔軟なライセンシングオプションが提供されます。
市場成長要因
APMツールは、応答時間、トランザクション時間、エラー率など、アプリケーションパフォーマンスに関する詳細なメトリックを提供します。これらのメトリックは、パフォーマンスの問題がユーザーエクスペリエンスにどのように影響するかを組織が理解し、改善すべき領域を特定するのに役立ちます。APMソリューションは、ユーザーの行動とアプリケーションの使用パターンに関する洞察を提供し、組織がパフォーマンスの最適化の取り組みを調整して、ユーザーのニーズと好みをより適切に満たせるように支援します。したがって、顧客エクスペリエンスへの注目が高まることで、市場の成長が促進されます。
さらに、APMツールはこれらの高度なテクノロジーのパフォーマンスを監視し、効率的に動作し、正確な結果を提供できる必要があります。結論として、デジタル変革イニシアチブの成長が市場の成長を促進します。
市場抑制要因
APMツールは、セキュリティ上の脆弱性がある場合、サイバー攻撃の標的になる可能性があります。脆弱性を悪用されると、攻撃者が機密パフォーマンスデータにアクセスしたり、監視システムの整合性を侵害したりする可能性があります。APMツールのセキュリティ上の脆弱性に対処するには、定期的な更新とパッチが必要です。ソリューションを最新の状態に保たないと、組織がセキュリティリスクにさらされる可能性があります。結論として、データのプライバシーとセキュリティに関する懸念が市場の成長を妨げています。
市場の主要企業は、市場で競争力を維持するために、多様な革新的な製品で競争しています。上の図は、市場の主要企業の一部が共有する収益の割合を示しています。市場の主要企業は、さまざまな産業からの需要に応えるために、さまざまな戦略を採用しています。市場における主要な開発戦略は、製品の発売と製品の拡張です。
ソリューションの展望
ソリューションに基づいて、市場はソフトウェアとサービスに分かれています。2023年には、ソフトウェアセグメントが市場で67%の収益シェアを獲得しました。APMソフトウェアには、パフォーマンスの問題の詳細な根本原因分析を容易にする高度な診断ツールが装備されています。パフォーマンスメトリック、トランザクショントレース、ログを分析することで、ソフトウェアは問題の根本的な原因を特定し、より迅速な解決を可能にします。
サービスの展望
サービスセグメントはさらに、統合と展開、トレーニングと教育、サポートとメンテナンスに細分化されています。2023年には、統合と展開セグメントが市場で44%の収益シェアを占めました。APMソリューションは、インシデント管理システム、ITサービス管理(ITSM)プラットフォーム、ログ管理システムなどの他のIT管理ツールと統合する必要があります。
展開モードの展望
展開モードに基づいて、市場はクラウドとオンプレミスに分割されます。 2023年には、オンプレミスセグメントが市場で46%の収益シェアを獲得しました。オンプレミス展開では、特定の組織のニーズを満たすために広範なカスタマイズが可能です。
企業規模の展望
企業規模に基づいて、市場は大企業と中小企業に分類されます。中小企業セグメントは、2023年に市場で40%の収益シェアを記録しました。中小企業は、デジタル環境での業務を改善するために、デジタルテクノロジーとツールを徐々に取り入れています。
アクセスタイプの展望
アクセスタイプ別に基づいて、市場はウェブ APM、モバイルAPM、その他に分類されます。2023年には、ウェブ APMセグメントが市場で65%の収益シェアを記録しました。現代の企業は、顧客対応サービスから社内業務まで、さまざまな機能でウェブアプリケーションに大きく依存しています。
エンドユーザーの展望
エンドユーザーに基づいて、市場はBFSI、製造、ヘルスケア、小売・eコマース、IT・通信、メディアおよびエンターテイメント、学術機関、政府、その他に分類されます。IT・通信セグメントは、2023年に市場で23%の収益シェアを獲得しました。IT・通信企業は、スムーズに動作するために継続的な監視を必要とする複雑なアプリケーションやシステムを扱うことがよくあります。
地域の展望
地域別に見ると、市場は北米、欧州、アジア太平洋、ラテンアメリカ・中東・アフリカにわたって分析されています。アジア太平洋は、2023年に市場で29%の収益シェアを生み出しました。アジア太平洋はモバイル普及率が高く、多くのユーザーがスマートフォン経由でアプリケーションやサービスにアクセスしています。
市場競争と特性
アプリケーションパフォーマンスモニタリング(APM)市場は、既存および新興のさまざまな企業が参入しており、競争が激しい市場です。競合に影響を与える主な属性には、リアルタイムデータ分析、スケーラビリティ、統合の容易さ、高度な分析機能などがあります。主要企業は、アプリケーションパフォーマンス、ユーザーエクスペリエンス、インフラの健全性に対する詳細な可視性を提供する包括的なソリューションの提供に重点を置いています。AIと機械学習のイノベーションも競合を促進しており、ベンダーはアプリケーションの信頼性とパフォーマンスを向上させるために、より予測的で実用的な洞察を提供することを目指しています。
目次
第1章 市場範囲と調査手法
- 市場の定義
- 目的
- 市場範囲
- セグメンテーション
- 調査手法
第2章 市場要覧
- 主なハイライト
第3章 市場概要
- イントロダクション
- 概要
- 市場構成とシナリオ
- 概要
- 市場に影響を与える主な要因
- 市場促進要因
- 市場抑制要因
- 市場機会
- 市場の課題
第4章 競合分析- 世界
- KBV Cardinal Matrix
- 最近の産業全体の戦略的展開
- パートナーシップ、コラボレーション、および契約
- 製品の発売と製品の拡大
- 買収と合併
- 市場シェア分析、2023年
- 主要成功戦略
- 主な戦略
- 主要な戦略的動き
- ポーターのファイブフォース分析
第5章 世界のアプリケーションパフォーマンスモニタリング市場:アクセスタイプ別
- 世界のウェブAPM市場:地域別
- 世界のモバイルAPM市場:地域別
第6章 世界のアプリケーションパフォーマンスモニタリング市場:最終用途別
- 世界のIT・通信市場:地域別
- 世界のBFSI市場:地域別
- 世界の小売・eコマース市場:地域別
- 世界のヘルスケア市場:地域別
- 世界の製造市場:地域別
- 世界の政府市場:地域別
- 世界のメディア・エンターテインメント市場:地域別
- 世界の学術市場:地域別
- 世界のその他の最終用途市場:地域別
第7章 世界のアプリケーションパフォーマンスモニタリング市場:展開別
- 世界のクラウド市場:地域別
- 世界のオンプレミス市場:地域別
第8章 世界のアプリケーションパフォーマンスモニタリング市場:企業規模別
- 世界の大企業市場:地域別
- 世界の中小企業市場:地域別
第9章 世界のアプリケーションパフォーマンスモニタリング市場:ソリューション別
- 世界のソフトウェア市場:地域別
- 世界のサービス市場:地域別
- 世界のアプリケーションパフォーマンスモニタリング市場:サービスタイプ別
第10章 世界のアプリケーションパフォーマンスモニタリング市場:地域別
- 北米
- 北米のアプリケーションパフォーマンスモニタリング市場:国別
- 米国
- カナダ
- メキシコ
- その他の北米
- 北米のアプリケーションパフォーマンスモニタリング市場:国別
- 欧州
- 欧州のアプリケーションパフォーマンスモニタリング市場:国別
- ドイツ
- 英国
- フランス
- ロシア
- スペイン
- イタリア
- その他の欧州
- 欧州のアプリケーションパフォーマンスモニタリング市場:国別
- アジア太平洋
- アジア太平洋のアプリケーションパフォーマンスモニタリング市場:国別
- 中国
- 日本
- インド
- 韓国
- シンガポール
- マレーシア
- その他のアジア太平洋
- アジア太平洋のアプリケーションパフォーマンスモニタリング市場:国別
- ラテンアメリカ・中東・アフリカ
- ラテンアメリカ・中東・アフリカのアプリケーションパフォーマンスモニタリング市場:国別
- ブラジル
- アルゼンチン
- アラブ首長国連邦
- サウジアラビア
- 南アフリカ
- ナイジェリア
- その他のラテンアメリカ・中東・アフリカ
- ラテンアメリカ・中東・アフリカのアプリケーションパフォーマンスモニタリング市場:国別
第11章 企業プロファイル
- Amazon Web Services, Inc(Amazon.com, Inc.)
- Cisco Systems, Inc
- Broadcom, Inc
- Datadog, Inc
- Google LLC(Alphabet Inc)
- IBM Corporation
- Microsoft Corporation
- Oracle Corporation
- Open Text Corporation
- Dynatrace, Inc
第12章 アプリケーションパフォーマンスモニタリング市場における成功必須条件
LIST OF TABLES
- TABLE 1 Global Application Performance Monitoring Market, 2020 - 2023, USD Million
- TABLE 2 Global Application Performance Monitoring Market, 2024 - 2031, USD Million
- TABLE 3 Partnerships, Collaborations and Agreements- Application Performance Monitoring Market
- TABLE 4 Product Launches And Product Expansions- Application Performance Monitoring Market
- TABLE 5 Acquisition and Mergers- Application Performance Monitoring Market
- TABLE 6 Global Application Performance Monitoring Market by Access Type, 2020 - 2023, USD Million
- TABLE 7 Global Application Performance Monitoring Market by Access Type, 2024 - 2031, USD Million
- TABLE 8 Global Web APM Market by Region, 2020 - 2023, USD Million
- TABLE 9 Global Web APM Market by Region, 2024 - 2031, USD Million
- TABLE 10 Global Mobile APM Market by Region, 2020 - 2023, USD Million
- TABLE 11 Global Mobile APM Market by Region, 2024 - 2031, USD Million
- TABLE 12 Global Application Performance Monitoring Market by End-use, 2020 - 2023, USD Million
- TABLE 13 Global Application Performance Monitoring Market by End-use, 2024 - 2031, USD Million
- TABLE 14 Global IT & Telecommunications Market by Region, 2020 - 2023, USD Million
- TABLE 15 Global IT & Telecommunications Market by Region, 2024 - 2031, USD Million
- TABLE 16 Global BFSI Market by Region, 2020 - 2023, USD Million
- TABLE 17 Global BFSI Market by Region, 2024 - 2031, USD Million
- TABLE 18 Global Retail & E-Commerce Market by Region, 2020 - 2023, USD Million
- TABLE 19 Global Retail & E-Commerce Market by Region, 2024 - 2031, USD Million
- TABLE 20 Global Healthcare Market by Region, 2020 - 2023, USD Million
- TABLE 21 Global Healthcare Market by Region, 2024 - 2031, USD Million
- TABLE 22 Global Manufacturing Market by Region, 2020 - 2023, USD Million
- TABLE 23 Global Manufacturing Market by Region, 2024 - 2031, USD Million
- TABLE 24 Global Government Market by Region, 2020 - 2023, USD Million
- TABLE 25 Global Government Market by Region, 2024 - 2031, USD Million
- TABLE 26 Global Media & Entertainment Market by Region, 2020 - 2023, USD Million
- TABLE 27 Global Media & Entertainment Market by Region, 2024 - 2031, USD Million
- TABLE 28 Global Academics Market by Region, 2020 - 2023, USD Million
- TABLE 29 Global Academics Market by Region, 2024 - 2031, USD Million
- TABLE 30 Global Other End-use Market by Region, 2020 - 2023, USD Million
- TABLE 31 Global Other End-use Market by Region, 2024 - 2031, USD Million
- TABLE 32 Global Application Performance Monitoring Market by Deployment, 2020 - 2023, USD Million
- TABLE 33 Global Application Performance Monitoring Market by Deployment, 2024 - 2031, USD Million
- TABLE 34 Global Cloud Market by Region, 2020 - 2023, USD Million
- TABLE 35 Global Cloud Market by Region, 2024 - 2031, USD Million
- TABLE 36 Global On-Premises Market by Region, 2020 - 2023, USD Million
- TABLE 37 Global On-Premises Market by Region, 2024 - 2031, USD Million
- TABLE 38 Global Application Performance Monitoring Market by Enterprise Size, 2020 - 2023, USD Million
- TABLE 39 Global Application Performance Monitoring Market by Enterprise Size, 2024 - 2031, USD Million
- TABLE 40 Global Large Enterprises Market by Region, 2020 - 2023, USD Million
- TABLE 41 Global Large Enterprises Market by Region, 2024 - 2031, USD Million
- TABLE 42 Global SMEs Market by Region, 2020 - 2023, USD Million
- TABLE 43 Global SMEs Market by Region, 2024 - 2031, USD Million
- TABLE 44 Global Application Performance Monitoring Market by Solution, 2020 - 2023, USD Million
- TABLE 45 Global Application Performance Monitoring Market by Solution, 2024 - 2031, USD Million
- TABLE 46 Global Software Market by Region, 2020 - 2023, USD Million
- TABLE 47 Global Software Market by Region, 2024 - 2031, USD Million
- TABLE 48 Global Services Market by Region, 2020 - 2023, USD Million
- TABLE 49 Global Services Market by Region, 2024 - 2031, USD Million
- TABLE 50 Global Application Performance Monitoring Market by Services Type, 2020 - 2023, USD Million
- TABLE 51 Global Application Performance Monitoring Market by Services Type, 2024 - 2031, USD Million
- TABLE 52 Global Integration & Deployment Market by Region, 2020 - 2023, USD Million
- TABLE 53 Global Integration & Deployment Market by Region, 2024 - 2031, USD Million
- TABLE 54 Global Support & Maintenance Market by Region, 2020 - 2023, USD Million
- TABLE 55 Global Support & Maintenance Market by Region, 2024 - 2031, USD Million
- TABLE 56 Global Training & Education Market by Region, 2020 - 2023, USD Million
- TABLE 57 Global Training & Education Market by Region, 2024 - 2031, USD Million
- TABLE 58 Global Application Performance Monitoring Market by Region, 2020 - 2023, USD Million
- TABLE 59 Global Application Performance Monitoring Market by Region, 2024 - 2031, USD Million
- TABLE 60 North America Application Performance Monitoring Market, 2020 - 2023, USD Million
- TABLE 61 North America Application Performance Monitoring Market, 2024 - 2031, USD Million
- TABLE 62 North America Application Performance Monitoring Market by Access Type, 2020 - 2023, USD Million
- TABLE 63 North America Application Performance Monitoring Market by Access Type, 2024 - 2031, USD Million
- TABLE 64 North America Web APM Market by Region, 2020 - 2023, USD Million
- TABLE 65 North America Web APM Market by Region, 2024 - 2031, USD Million
- TABLE 66 North America Mobile APM Market by Region, 2020 - 2023, USD Million
- TABLE 67 North America Mobile APM Market by Region, 2024 - 2031, USD Million
- TABLE 68 North America Application Performance Monitoring Market by End-use, 2020 - 2023, USD Million
- TABLE 69 North America Application Performance Monitoring Market by End-use, 2024 - 2031, USD Million
- TABLE 70 North America IT & Telecommunications Market by Country, 2020 - 2023, USD Million
- TABLE 71 North America IT & Telecommunications Market by Country, 2024 - 2031, USD Million
- TABLE 72 North America BFSI Market by Country, 2020 - 2023, USD Million
- TABLE 73 North America BFSI Market by Country, 2024 - 2031, USD Million
- TABLE 74 North America Retail & E-Commerce Market by Country, 2020 - 2023, USD Million
- TABLE 75 North America Retail & E-Commerce Market by Country, 2024 - 2031, USD Million
- TABLE 76 North America Healthcare Market by Country, 2020 - 2023, USD Million
- TABLE 77 North America Healthcare Market by Country, 2024 - 2031, USD Million
- TABLE 78 North America Manufacturing Market by Country, 2020 - 2023, USD Million
- TABLE 79 North America Manufacturing Market by Country, 2024 - 2031, USD Million
- TABLE 80 North America Government Market by Country, 2020 - 2023, USD Million
- TABLE 81 North America Government Market by Country, 2024 - 2031, USD Million
- TABLE 82 North America Media & Entertainment Market by Country, 2020 - 2023, USD Million
- TABLE 83 North America Media & Entertainment Market by Country, 2024 - 2031, USD Million
- TABLE 84 North America Academics Market by Country, 2020 - 2023, USD Million
- TABLE 85 North America Academics Market by Country, 2024 - 2031, USD Million
- TABLE 86 North America Other End-use Market by Country, 2020 - 2023, USD Million
- TABLE 87 North America Other End-use Market by Country, 2024 - 2031, USD Million
- TABLE 88 North America Application Performance Monitoring Market by Deployment, 2020 - 2023, USD Million
- TABLE 89 North America Application Performance Monitoring Market by Deployment, 2024 - 2031, USD Million
- TABLE 90 North America Cloud Market by Country, 2020 - 2023, USD Million
- TABLE 91 North America Cloud Market by Country, 2024 - 2031, USD Million
- TABLE 92 North America On-Premises Market by Country, 2020 - 2023, USD Million
- TABLE 93 North America On-Premises Market by Country, 2024 - 2031, USD Million
- TABLE 94 North America Application Performance Monitoring Market by Enterprise Size, 2020 - 2023, USD Million
- TABLE 95 North America Application Performance Monitoring Market by Enterprise Size, 2024 - 2031, USD Million
- TABLE 96 North America Large Enterprises Market by Country, 2020 - 2023, USD Million
- TABLE 97 North America Large Enterprises Market by Country, 2024 - 2031, USD Million
- TABLE 98 North America SMEs Market by Country, 2020 - 2023, USD Million
- TABLE 99 North America SMEs Market by Country, 2024 - 2031, USD Million
- TABLE 100 North America Application Performance Monitoring Market by Solution, 2020 - 2023, USD Million
- TABLE 101 North America Application Performance Monitoring Market by Solution, 2024 - 2031, USD Million
- TABLE 102 North America Software Market by Country, 2020 - 2023, USD Million
- TABLE 103 North America Software Market by Country, 2024 - 2031, USD Million
- TABLE 104 North America Services Market by Country, 2020 - 2023, USD Million
- TABLE 105 North America Services Market by Country, 2024 - 2031, USD Million
- TABLE 106 North America Application Performance Monitoring Market by Services Type, 2020 - 2023, USD Million
- TABLE 107 North America Application Performance Monitoring Market by Services Type, 2024 - 2031, USD Million
- TABLE 108 North America Integration & Deployment Market by Country, 2020 - 2023, USD Million
- TABLE 109 North America Integration & Deployment Market by Country, 2024 - 2031, USD Million
- TABLE 110 North America Support & Maintenance Market by Country, 2020 - 2023, USD Million
- TABLE 111 North America Support & Maintenance Market by Country, 2024 - 2031, USD Million
- TABLE 112 North America Training & Education Market by Country, 2020 - 2023, USD Million
- TABLE 113 North America Training & Education Market by Country, 2024 - 2031, USD Million
- TABLE 114 North America Application Performance Monitoring Market by Country, 2020 - 2023, USD Million
- TABLE 115 North America Application Performance Monitoring Market by Country, 2024 - 2031, USD Million
- TABLE 116 US Application Performance Monitoring Market, 2020 - 2023, USD Million
- TABLE 117 US Application Performance Monitoring Market, 2024 - 2031, USD Million
- TABLE 118 US Application Performance Monitoring Market by Access Type, 2020 - 2023, USD Million
- TABLE 119 US Application Performance Monitoring Market by Access Type, 2024 - 2031, USD Million
- TABLE 120 US Application Performance Monitoring Market by End-use, 2020 - 2023, USD Million
- TABLE 121 US Application Performance Monitoring Market by End-use, 2024 - 2031, USD Million
- TABLE 122 US Application Performance Monitoring Market by Deployment, 2020 - 2023, USD Million
- TABLE 123 US Application Performance Monitoring Market by Deployment, 2024 - 2031, USD Million
- TABLE 124 US Application Performance Monitoring Market by Enterprise Size, 2020 - 2023, USD Million
- TABLE 125 US Application Performance Monitoring Market by Enterprise Size, 2024 - 2031, USD Million
- TABLE 126 US Application Performance Monitoring Market by Solution, 2020 - 2023, USD Million
- TABLE 127 US Application Performance Monitoring Market by Solution, 2024 - 2031, USD Million
- TABLE 128 US Application Performance Monitoring Market by Services Type, 2020 - 2023, USD Million
- TABLE 129 US Application Performance Monitoring Market by Services Type, 2024 - 2031, USD Million
- TABLE 130 Canada Application Performance Monitoring Market, 2020 - 2023, USD Million
- TABLE 131 Canada Application Performance Monitoring Market, 2024 - 2031, USD Million
- TABLE 132 Canada Application Performance Monitoring Market by Access Type, 2020 - 2023, USD Million
- TABLE 133 Canada Application Performance Monitoring Market by Access Type, 2024 - 2031, USD Million
- TABLE 134 Canada Application Performance Monitoring Market by End-use, 2020 - 2023, USD Million
- TABLE 135 Canada Application Performance Monitoring Market by End-use, 2024 - 2031, USD Million
- TABLE 136 Canada Application Performance Monitoring Market by Deployment, 2020 - 2023, USD Million
- TABLE 137 Canada Application Performance Monitoring Market by Deployment, 2024 - 2031, USD Million
- TABLE 138 Canada Application Performance Monitoring Market by Enterprise Size, 2020 - 2023, USD Million
- TABLE 139 Canada Application Performance Monitoring Market by Enterprise Size, 2024 - 2031, USD Million
- TABLE 140 Canada Application Performance Monitoring Market by Solution, 2020 - 2023, USD Million
- TABLE 141 Canada Application Performance Monitoring Market by Solution, 2024 - 2031, USD Million
- TABLE 142 Canada Application Performance Monitoring Market by Services Type, 2020 - 2023, USD Million
- TABLE 143 Canada Application Performance Monitoring Market by Services Type, 2024 - 2031, USD Million
- TABLE 144 Mexico Application Performance Monitoring Market, 2020 - 2023, USD Million
- TABLE 145 Mexico Application Performance Monitoring Market, 2024 - 2031, USD Million
- TABLE 146 Mexico Application Performance Monitoring Market by Access Type, 2020 - 2023, USD Million
- TABLE 147 Mexico Application Performance Monitoring Market by Access Type, 2024 - 2031, USD Million
- TABLE 148 Mexico Application Performance Monitoring Market by End-use, 2020 - 2023, USD Million
- TABLE 149 Mexico Application Performance Monitoring Market by End-use, 2024 - 2031, USD Million
- TABLE 150 Mexico Application Performance Monitoring Market by Deployment, 2020 - 2023, USD Million
- TABLE 151 Mexico Application Performance Monitoring Market by Deployment, 2024 - 2031, USD Million
- TABLE 152 Mexico Application Performance Monitoring Market by Enterprise Size, 2020 - 2023, USD Million
- TABLE 153 Mexico Application Performance Monitoring Market by Enterprise Size, 2024 - 2031, USD Million
- TABLE 154 Mexico Application Performance Monitoring Market by Solution, 2020 - 2023, USD Million
- TABLE 155 Mexico Application Performance Monitoring Market by Solution, 2024 - 2031, USD Million
- TABLE 156 Mexico Application Performance Monitoring Market by Services Type, 2020 - 2023, USD Million
- TABLE 157 Mexico Application Performance Monitoring Market by Services Type, 2024 - 2031, USD Million
- TABLE 158 Rest of North America Application Performance Monitoring Market, 2020 - 2023, USD Million
- TABLE 159 Rest of North America Application Performance Monitoring Market, 2024 - 2031, USD Million
- TABLE 160 Rest of North America Application Performance Monitoring Market by Access Type, 2020 - 2023, USD Million
- TABLE 161 Rest of North America Application Performance Monitoring Market by Access Type, 2024 - 2031, USD Million
- TABLE 162 Rest of North America Application Performance Monitoring Market by End-use, 2020 - 2023, USD Million
- TABLE 163 Rest of North America Application Performance Monitoring Market by End-use, 2024 - 2031, USD Million
- TABLE 164 Rest of North America Application Performance Monitoring Market by Deployment, 2020 - 2023, USD Million
- TABLE 165 Rest of North America Application Performance Monitoring Market by Deployment, 2024 - 2031, USD Million
- TABLE 166 Rest of North America Application Performance Monitoring Market by Enterprise Size, 2020 - 2023, USD Million
- TABLE 167 Rest of North America Application Performance Monitoring Market by Enterprise Size, 2024 - 2031, USD Million
- TABLE 168 Rest of North America Application Performance Monitoring Market by Solution, 2020 - 2023, USD Million
- TABLE 169 Rest of North America Application Performance Monitoring Market by Solution, 2024 - 2031, USD Million
- TABLE 170 Rest of North America Application Performance Monitoring Market by Services Type, 2020 - 2023, USD Million
- TABLE 171 Rest of North America Application Performance Monitoring Market by Services Type, 2024 - 2031, USD Million
- TABLE 172 Europe Application Performance Monitoring Market, 2020 - 2023, USD Million
- TABLE 173 Europe Application Performance Monitoring Market, 2024 - 2031, USD Million
- TABLE 174 Europe Application Performance Monitoring Market by Access Type, 2020 - 2023, USD Million
- TABLE 175 Europe Application Performance Monitoring Market by Access Type, 2024 - 2031, USD Million
- TABLE 176 Europe Web APM Market by Country, 2020 - 2023, USD Million
- TABLE 177 Europe Web APM Market by Country, 2024 - 2031, USD Million
- TABLE 178 Europe Mobile APM Market by Country, 2020 - 2023, USD Million
- TABLE 179 Europe Mobile APM Market by Country, 2024 - 2031, USD Million
- TABLE 180 Europe Application Performance Monitoring Market by End-use, 2020 - 2023, USD Million
- TABLE 181 Europe Application Performance Monitoring Market by End-use, 2024 - 2031, USD Million
- TABLE 182 Europe IT & Telecommunications Market by Country, 2020 - 2023, USD Million
- TABLE 183 Europe IT & Telecommunications Market by Country, 2024 - 2031, USD Million
- TABLE 184 Europe BFSI Market by Country, 2020 - 2023, USD Million
- TABLE 185 Europe BFSI Market by Country, 2024 - 2031, USD Million
- TABLE 186 Europe Retail & E-Commerce Market by Country, 2020 - 2023, USD Million
- TABLE 187 Europe Retail & E-Commerce Market by Country, 2024 - 2031, USD Million
- TABLE 188 Europe Healthcare Market by Country, 2020 - 2023, USD Million
- TABLE 189 Europe Healthcare Market by Country, 2024 - 2031, USD Million
- TABLE 190 Europe Manufacturing Market by Country, 2020 - 2023, USD Million
- TABLE 191 Europe Manufacturing Market by Country, 2024 - 2031, USD Million
- TABLE 192 Europe Government Market by Country, 2020 - 2023, USD Million
- TABLE 193 Europe Government Market by Country, 2024 - 2031, USD Million
- TABLE 194 Europe Media & Entertainment Market by Country, 2020 - 2023, USD Million
- TABLE 195 Europe Media & Entertainment Market by Country, 2024 - 2031, USD Million
- TABLE 196 Europe Academics Market by Country, 2020 - 2023, USD Million
- TABLE 197 Europe Academics Market by Country, 2024 - 2031, USD Million
- TABLE 198 Europe Other End-use Market by Country, 2020 - 2023, USD Million
- TABLE 199 Europe Other End-use Market by Country, 2024 - 2031, USD Million
- TABLE 200 Europe Application Performance Monitoring Market by Deployment, 2020 - 2023, USD Million
- TABLE 201 Europe Application Performance Monitoring Market by Deployment, 2024 - 2031, USD Million
- TABLE 202 Europe Cloud Market by Country, 2020 - 2023, USD Million
- TABLE 203 Europe Cloud Market by Country, 2024 - 2031, USD Million
- TABLE 204 Europe On-Premises Market by Country, 2020 - 2023, USD Million
- TABLE 205 Europe On-Premises Market by Country, 2024 - 2031, USD Million
- TABLE 206 Europe Application Performance Monitoring Market by Enterprise Size, 2020 - 2023, USD Million
- TABLE 207 Europe Application Performance Monitoring Market by Enterprise Size, 2024 - 2031, USD Million
- TABLE 208 Europe Large Enterprises Market by Country, 2020 - 2023, USD Million
- TABLE 209 Europe Large Enterprises Market by Country, 2024 - 2031, USD Million
- TABLE 210 Europe SMEs Market by Country, 2020 - 2023, USD Million
- TABLE 211 Europe SMEs Market by Country, 2024 - 2031, USD Million
- TABLE 212 Europe Application Performance Monitoring Market by Solution, 2020 - 2023, USD Million
- TABLE 213 Europe Application Performance Monitoring Market by Solution, 2024 - 2031, USD Million
- TABLE 214 Europe Software Market by Country, 2020 - 2023, USD Million
- TABLE 215 Europe Software Market by Country, 2024 - 2031, USD Million
- TABLE 216 Europe Services Market by Country, 2020 - 2023, USD Million
- TABLE 217 Europe Services Market by Country, 2024 - 2031, USD Million
- TABLE 218 Europe Application Performance Monitoring Market by Services Type, 2020 - 2023, USD Million
- TABLE 219 Europe Application Performance Monitoring Market by Services Type, 2024 - 2031, USD Million
- TABLE 220 Europe Integration & Deployment Market by Country, 2020 - 2023, USD Million
- TABLE 221 Europe Integration & Deployment Market by Country, 2024 - 2031, USD Million
- TABLE 222 Europe Support & Maintenance Market by Country, 2020 - 2023, USD Million
- TABLE 223 Europe Support & Maintenance Market by Country, 2024 - 2031, USD Million
- TABLE 224 Europe Training & Education Market by Country, 2020 - 2023, USD Million
- TABLE 225 Europe Training & Education Market by Country, 2024 - 2031, USD Million
- TABLE 226 Europe Application Performance Monitoring Market by Country, 2020 - 2023, USD Million
- TABLE 227 Europe Application Performance Monitoring Market by Country, 2024 - 2031, USD Million
- TABLE 228 Germany Application Performance Monitoring Market, 2020 - 2023, USD Million
- TABLE 229 Germany Application Performance Monitoring Market, 2024 - 2031, USD Million
- TABLE 230 Germany Application Performance Monitoring Market by Access Type, 2020 - 2023, USD Million
- TABLE 231 Germany Application Performance Monitoring Market by Access Type, 2024 - 2031, USD Million
- TABLE 232 Germany Application Performance Monitoring Market by End-use, 2020 - 2023, USD Million
- TABLE 233 Germany Application Performance Monitoring Market by End-use, 2024 - 2031, USD Million
- TABLE 234 Germany Application Performance Monitoring Market by Deployment, 2020 - 2023, USD Million
- TABLE 235 Germany Application Performance Monitoring Market by Deployment, 2024 - 2031, USD Million
- TABLE 236 Germany Application Performance Monitoring Market by Enterprise Size, 2020 - 2023, USD Million
- TABLE 237 Germany Application Performance Monitoring Market by Enterprise Size, 2024 - 2031, USD Million
- TABLE 238 Germany Application Performance Monitoring Market by Solution, 2020 - 2023, USD Million
- TABLE 239 Germany Application Performance Monitoring Market by Solution, 2024 - 2031, USD Million
- TABLE 240 Germany Application Performance Monitoring Market by Services Type, 2020 - 2023, USD Million
- TABLE 241 Germany Application Performance Monitoring Market by Services Type, 2024 - 2031, USD Million
- TABLE 242 UK Application Performance Monitoring Market, 2020 - 2023, USD Million
- TABLE 243 UK Application Performance Monitoring Market, 2024 - 2031, USD Million
- TABLE 244 UK Application Performance Monitoring Market by Access Type, 2020 - 2023, USD Million
- TABLE 245 UK Application Performance Monitoring Market by Access Type, 2024 - 2031, USD Million
- TABLE 246 UK Application Performance Monitoring Market by End-use, 2020 - 2023, USD Million
- TABLE 247 UK Application Performance Monitoring Market by End-use, 2024 - 2031, USD Million
- TABLE 248 UK Application Performance Monitoring Market by Deployment, 2020 - 2023, USD Million
- TABLE 249 UK Application Performance Monitoring Market by Deployment, 2024 - 2031, USD Million
- TABLE 250 UK Application Performance Monitoring Market by Enterprise Size, 2020 - 2023, USD Million
- TABLE 251 UK Application Performance Monitoring Market by Enterprise Size, 2024 - 2031, USD Million
- TABLE 252 UK Application Performance Monitoring Market by Solution, 2020 - 2023, USD Million
- TABLE 253 UK Application Performance Monitoring Market by Solution, 2024 - 2031, USD Million
- TABLE 254 UK Application Performance Monitoring Market by Services Type, 2020 - 2023, USD Million
- TABLE 255 UK Application Performance Monitoring Market by Services Type, 2024 - 2031, USD Million
- TABLE 256 France Application Performance Monitoring Market, 2020 - 2023, USD Million
- TABLE 257 France Application Performance Monitoring Market, 2024 - 2031, USD Million
- TABLE 258 France Application Performance Monitoring Market by Access Type, 2020 - 2023, USD Million
- TABLE 259 France Application Performance Monitoring Market by Access Type, 2024 - 2031, USD Million
- TABLE 260 France Application Performance Monitoring Market by End-use, 2020 - 2023, USD Million
- TABLE 261 France Application Performance Monitoring Market by End-use, 2024 - 2031, USD Million
- TABLE 262 France Application Performance Monitoring Market by Deployment, 2020 - 2023, USD Million
- TABLE 263 France Application Performance Monitoring Market by Deployment, 2024 - 2031, USD Million
- TABLE 264 France Application Performance Monitoring Market by Enterprise Size, 2020 - 2023, USD Million
- TABLE 265 France Application Performance Monitoring Market by Enterprise Size, 2024 - 2031, USD Million
- TABLE 266 France Application Performance Monitoring Market by Solution, 2020 - 2023, USD Million
- TABLE 267 France Application Performance Monitoring Market by Solution, 2024 - 2031, USD Million
- TABLE 268 France Application Performance Monitoring Market by Services Type, 2020 - 2023, USD Million
- TABLE 269 France Application Performance Monitoring Market by Services Type, 2024 - 2031, USD Million
- TABLE 270 Russia Application Performance Monitoring Market, 2020 - 2023, USD Million
- TABLE 271 Russia Application Performance Monitoring Market, 2024 - 2031, USD Million
- TABLE 272 Russia Application Performance Monitoring Market by Access Type, 2020 - 2023, USD Million
- TABLE 273 Russia Application Performance Monitoring Market by Access Type, 2024 - 2031, USD Million
- TABLE 274 Russia Application Performance Monitoring Market by End-use, 2020 - 2023, USD Million
- TABLE 275 Russia Application Performance Monitoring Market by End-use, 2024 - 2031, USD Million
- TABLE 276 Russia Application Performance Monitoring Market by Deployment, 2020 - 2023, USD Million
- TABLE 277 Russia Application Performance Monitoring Market by Deployment, 2024 - 2031, USD Million
- TABLE 278 Russia Application Performance Monitoring Market by Enterprise Size, 2020 - 2023, USD Million
- TABLE 279 Russia Application Performance Monitoring Market by Enterprise Size, 2024 - 2031, USD Million
- TABLE 280 Russia Application Performance Monitoring Market by Solution, 2020 - 2023, USD Million
- TABLE 281 Russia Application Performance Monitoring Market by Solution, 2024 - 2031, USD Million
- TABLE 282 Russia Application Performance Monitoring Market by Services Type, 2020 - 2023, USD Million
- TABLE 283 Russia Application Performance Monitoring Market by Services Type, 2024 - 2031, USD Million
- TABLE 284 Spain Application Performance Monitoring Market, 2020 - 2023, USD Million
- TABLE 285 Spain Application Performance Monitoring Market, 2024 - 2031, USD Million
- TABLE 286 Spain Application Performance Monitoring Market by Access Type, 2020 - 2023, USD Million
- TABLE 287 Spain Application Performance Monitoring Market by Access Type, 2024 - 2031, USD Million
- TABLE 288 Spain Application Performance Monitoring Market by End-use, 2020 - 2023, USD Million
- TABLE 289 Spain Application Performance Monitoring Market by End-use, 2024 - 2031, USD Million
- TABLE 290 Spain Application Performance Monitoring Market by Deployment, 2020 - 2023, USD Million
- TABLE 291 Spain Application Performance Monitoring Market by Deployment, 2024 - 2031, USD Million
- TABLE 292 Spain Application Performance Monitoring Market by Enterprise Size, 2020 - 2023, USD Million
- TABLE 293 Spain Application Performance Monitoring Market by Enterprise Size, 2024 - 2031, USD Million
- TABLE 294 Spain Application Performance Monitoring Market by Solution, 2020 - 2023, USD Million
- TABLE 295 Spain Application Performance Monitoring Market by Solution, 2024 - 2031, USD Million
- TABLE 296 Spain Application Performance Monitoring Market by Services Type, 2020 - 2023, USD Million
- TABLE 297 Spain Application Performance Monitoring Market by Services Type, 2024 - 2031, USD Million
- TABLE 298 Italy Application Performance Monitoring Market, 2020 - 2023, USD Million
- TABLE 299 Italy Application Performance Monitoring Market, 2024 - 2031, USD Million
- TABLE 300 Italy Application Performance Monitoring Market by Access Type, 2020 - 2023, USD Million
- TABLE 301 Italy Application Performance Monitoring Market by Access Type, 2024 - 2031, USD Million
- TABLE 302 Italy Application Performance Monitoring Market by End-use, 2020 - 2023, USD Million
- TABLE 303 Italy Application Performance Monitoring Market by End-use, 2024 - 2031, USD Million
- TABLE 304 Italy Application Performance Monitoring Market by Deployment, 2020 - 2023, USD Million
- TABLE 305 Italy Application Performance Monitoring Market by Deployment, 2024 - 2031, USD Million
- TABLE 306 Italy Application Performance Monitoring Market by Enterprise Size, 2020 - 2023, USD Million
- TABLE 307 Italy Application Performance Monitoring Market by Enterprise Size, 2024 - 2031, USD Million
- TABLE 308 Italy Application Performance Monitoring Market by Solution, 2020 - 2023, USD Million
- TABLE 309 Italy Application Performance Monitoring Market by Solution, 2024 - 2031, USD Million
- TABLE 310 Italy Application Performance Monitoring Market by Services Type, 2020 - 2023, USD Million
- TABLE 311 Italy Application Performance Monitoring Market by Services Type, 2024 - 2031, USD Million
- TABLE 312 Rest of Europe Application Performance Monitoring Market, 2020 - 2023, USD Million
- TABLE 313 Rest of Europe Application Performance Monitoring Market, 2024 - 2031, USD Million
- TABLE 314 Rest of Europe Application Performance Monitoring Market by Access Type, 2020 - 2023, USD Million
- TABLE 315 Rest of Europe Application Performance Monitoring Market by Access Type, 2024 - 2031, USD Million
- TABLE 316 Rest of Europe Application Performance Monitoring Market by End-use, 2020 - 2023, USD Million
- TABLE 317 Rest of Europe Application Performance Monitoring Market by End-use, 2024 - 2031, USD Million
- TABLE 318 Rest of Europe Application Performance Monitoring Market by Deployment, 2020 - 2023, USD Million
- TABLE 319 Rest of Europe Application Performance Monitoring Market by Deployment, 2024 - 2031, USD Million
- TABLE 320 Rest of Europe Application Performance Monitoring Market by Enterprise Size, 2020 - 2023, USD Million
- TABLE 321 Rest of Europe Application Performance Monitoring Market by Enterprise Size, 2024 - 2031, USD Million
- TABLE 322 Rest of Europe Application Performance Monitoring Market by Solution, 2020 - 2023, USD Million
- TABLE 323 Rest of Europe Application Performance Monitoring Market by Solution, 2024 - 2031, USD Million
- TABLE 324 Rest of Europe Application Performance Monitoring Market by Services Type, 2020 - 2023, USD Million
- TABLE 325 Rest of Europe Application Performance Monitoring Market by Services Type, 2024 - 2031, USD Million
- TABLE 326 Asia Pacific Application Performance Monitoring Market, 2020 - 2023, USD Million
- TABLE 327 Asia Pacific Application Performance Monitoring Market, 2024 - 2031, USD Million
- TABLE 328 Asia Pacific Application Performance Monitoring Market by Access Type, 2020 - 2023, USD Million
- TABLE 329 Asia Pacific Application Performance Monitoring Market by Access Type, 2024 - 2031, USD Million
- TABLE 330 Asia Pacific Web APM Market by Country, 2020 - 2023, USD Million
- TABLE 331 Asia Pacific Web APM Market by Country, 2024 - 2031, USD Million
- TABLE 332 Asia Pacific Mobile APM Market by Country, 2020 - 2023, USD Million
- TABLE 333 Asia Pacific Mobile APM Market by Country, 2024 - 2031, USD Million
- TABLE 334 Asia Pacific Application Performance Monitoring Market by End-use, 2020 - 2023, USD Million
- TABLE 335 Asia Pacific Application Performance Monitoring Market by End-use, 2024 - 2031, USD Million
- TABLE 336 Asia Pacific IT & Telecommunications Market by Country, 2020 - 2023, USD Million
- TABLE 337 Asia Pacific IT & Telecommunications Market by Country, 2024 - 2031, USD Million
- TABLE 338 Asia Pacific BFSI Market by Country, 2020 - 2023, USD Million
- TABLE 339 Asia Pacific BFSI Market by Country, 2024 - 2031, USD Million
- TABLE 340 Asia Pacific Retail & E-Commerce Market by Country, 2020 - 2023, USD Million
- TABLE 341 Asia Pacific Retail & E-Commerce Market by Country, 2024 - 2031, USD Million
- TABLE 342 Asia Pacific Healthcare Market by Country, 2020 - 2023, USD Million
- TABLE 343 Asia Pacific Healthcare Market by Country, 2024 - 2031, USD Million
- TABLE 344 Asia Pacific Manufacturing Market by Country, 2020 - 2023, USD Million
- TABLE 345 Asia Pacific Manufacturing Market by Country, 2024 - 2031, USD Million
- TABLE 346 Asia Pacific Government Market by Country, 2020 - 2023, USD Million
- TABLE 347 Asia Pacific Government Market by Country, 2024 - 2031, USD Million
- TABLE 348 Asia Pacific Media & Entertainment Market by Country, 2020 - 2023, USD Million
- TABLE 349 Asia Pacific Media & Entertainment Market by Country, 2024 - 2031, USD Million
- TABLE 350 Asia Pacific Academics Market by Country, 2020 - 2023, USD Million
- TABLE 351 Asia Pacific Academics Market by Country, 2024 - 2031, USD Million
- TABLE 352 Asia Pacific Other End-use Market by Country, 2020 - 2023, USD Million
- TABLE 353 Asia Pacific Other End-use Market by Country, 2024 - 2031, USD Million
- TABLE 354 Asia Pacific Application Performance Monitoring Market by Deployment, 2020 - 2023, USD Million
- TABLE 355 Asia Pacific Application Performance Monitoring Market by Deployment, 2024 - 2031, USD Million
- TABLE 356 Asia Pacific Cloud Market by Country, 2020 - 2023, USD Million
- TABLE 357 Asia Pacific Cloud Market by Country, 2024 - 2031, USD Million
- TABLE 358 Asia Pacific On-Premises Market by Country, 2020 - 2023, USD Million
- TABLE 359 Asia Pacific On-Premises Market by Country, 2024 - 2031, USD Million
- TABLE 360 Asia Pacific Application Performance Monitoring Market by Enterprise Size, 2020 - 2023, USD Million
- TABLE 361 Asia Pacific Application Performance Monitoring Market by Enterprise Size, 2024 - 2031, USD Million
- TABLE 362 Asia Pacific Large Enterprises Market by Country, 2020 - 2023, USD Million
- TABLE 363 Asia Pacific Large Enterprises Market by Country, 2024 - 2031, USD Million
- TABLE 364 Asia Pacific SMEs Market by Country, 2020 - 2023, USD Million
- TABLE 365 Asia Pacific SMEs Market by Country, 2024 - 2031, USD Million
- TABLE 366 Asia Pacific Application Performance Monitoring Market by Solution, 2020 - 2023, USD Million
- TABLE 367 Asia Pacific Application Performance Monitoring Market by Solution, 2024 - 2031, USD Million
- TABLE 368 Asia Pacific Software Market by Country, 2020 - 2023, USD Million
- TABLE 369 Asia Pacific Software Market by Country, 2024 - 2031, USD Million
- TABLE 370 Asia Pacific Services Market by Country, 2020 - 2023, USD Million
- TABLE 371 Asia Pacific Services Market by Country, 2024 - 2031, USD Million
- TABLE 372 Asia Pacific Application Performance Monitoring Market by Services Type, 2020 - 2023, USD Million
- TABLE 373 Asia Pacific Application Performance Monitoring Market by Services Type, 2024 - 2031, USD Million
- TABLE 374 Asia Pacific Integration & Deployment Market by Country, 2020 - 2023, USD Million
- TABLE 375 Asia Pacific Integration & Deployment Market by Country, 2024 - 2031, USD Million
- TABLE 376 Asia Pacific Support & Maintenance Market by Country, 2020 - 2023, USD Million
- TABLE 377 Asia Pacific Support & Maintenance Market by Country, 2024 - 2031, USD Million
- TABLE 378 Asia Pacific Training & Education Market by Country, 2020 - 2023, USD Million
- TABLE 379 Asia Pacific Training & Education Market by Country, 2024 - 2031, USD Million
- TABLE 380 Asia Pacific Application Performance Monitoring Market by Country, 2020 - 2023, USD Million
- TABLE 381 Asia Pacific Application Performance Monitoring Market by Country, 2024 - 2031, USD Million
- TABLE 382 China Application Performance Monitoring Market, 2020 - 2023, USD Million
- TABLE 383 China Application Performance Monitoring Market, 2024 - 2031, USD Million
- TABLE 384 China Application Performance Monitoring Market by Access Type, 2020 - 2023, USD Million
- TABLE 385 China Application Performance Monitoring Market by Access Type, 2024 - 2031, USD Million
- TABLE 386 China Application Performance Monitoring Market by End-use, 2020 - 2023, USD Million
- TABLE 387 China Application Performance Monitoring Market by End-use, 2024 - 2031, USD Million
- TABLE 388 China Application Performance Monitoring Market by Deployment, 2020 - 2023, USD Million
- TABLE 389 China Application Performance Monitoring Market by Deployment, 2024 - 2031, USD Million
- TABLE 390 China Application Performance Monitoring Market by Enterprise Size, 2020 - 2023, USD Million
- TABLE 391 China Application Performance Monitoring Market by Enterprise Size, 2024 - 2031, USD Million
- TABLE 392 China Application Performance Monitoring Market by Solution, 2020 - 2023, USD Million
- TABLE 393 China Application Performance Monitoring Market by Solution, 2024 - 2031, USD Million
- TABLE 394 China Application Performance Monitoring Market by Services Type, 2020 - 2023, USD Million
- TABLE 395 China Application Performance Monitoring Market by Services Type, 2024 - 2031, USD Million
- TABLE 396 Japan Application Performance Monitoring Market, 2020 - 2023, USD Million
- TABLE 397 Japan Application Performance Monitoring Market, 2024 - 2031, USD Million
- TABLE 398 Japan Application Performance Monitoring Market by Access Type, 2020 - 2023, USD Million
- TABLE 399 Japan Application Performance Monitoring Market by Access Type, 2024 - 2031, USD Million
- TABLE 400 Japan Application Performance Monitoring Market by End-use, 2020 - 2023, USD Million
- TABLE 401 Japan Application Performance Monitoring Market by End-use, 2024 - 2031, USD Million
- TABLE 402 Japan Application Performance Monitoring Market by Deployment, 2020 - 2023, USD Million
- TABLE 403 Japan Application Performance Monitoring Market by Deployment, 2024 - 2031, USD Million
- TABLE 404 Japan Application Performance Monitoring Market by Enterprise Size, 2020 - 2023, USD Million
- TABLE 405 Japan Application Performance Monitoring Market by Enterprise Size, 2024 - 2031, USD Million
- TABLE 406 Japan Application Performance Monitoring Market by Solution, 2020 - 2023, USD Million
- TABLE 407 Japan Application Performance Monitoring Market by Solution, 2024 - 2031, USD Million
- TABLE 408 Japan Application Performance Monitoring Market by Services Type, 2020 - 2023, USD Million
- TABLE 409 Japan Application Performance Monitoring Market by Services Type, 2024 - 2031, USD Million
- TABLE 410 India Application Performance Monitoring Market, 2020 - 2023, USD Million
- TABLE 411 India Application Performance Monitoring Market, 2024 - 2031, USD Million
- TABLE 412 India Application Performance Monitoring Market by Access Type, 2020 - 2023, USD Million
- TABLE 413 India Application Performance Monitoring Market by Access Type, 2024 - 2031, USD Million
- TABLE 414 India Application Performance Monitoring Market by End-use, 2020 - 2023, USD Million
- TABLE 415 India Application Performance Monitoring Market by End-use, 2024 - 2031, USD Million
- TABLE 416 India Application Performance Monitoring Market by Deployment, 2020 - 2023, USD Million
- TABLE 417 India Application Performance Monitoring Market by Deployment, 2024 - 2031, USD Million
- TABLE 418 India Application Performance Monitoring Market by Enterprise Size, 2020 - 2023, USD Million
- TABLE 419 India Application Performance Monitoring Market by Enterprise Size, 2024 - 2031, USD Million
- TABLE 420 India Application Performance Monitoring Market by Solution, 2020 - 2023, USD Million
- TABLE 421 India Application Performance Monitoring Market by Solution, 2024 - 2031, USD Million
- TABLE 422 India Application Performance Monitoring Market by Services Type, 2020 - 2023, USD Million
- TABLE 423 India Application Performance Monitoring Market by Services Type, 2024 - 2031, USD Million
- TABLE 424 South Korea Application Performance Monitoring Market, 2020 - 2023, USD Million
- TABLE 425 South Korea Application Performance Monitoring Market, 2024 - 2031, USD Million
- TABLE 426 South Korea Application Performance Monitoring Market by Access Type, 2020 - 2023, USD Million
- TABLE 427 South Korea Application Performance Monitoring Market by Access Type, 2024 - 2031, USD Million
- TABLE 428 South Korea Application Performance Monitoring Market by End-use, 2020 - 2023, USD Million
- TABLE 429 South Korea Application Performance Monitoring Market by End-use, 2024 - 2031, USD Million
- TABLE 430 South Korea Application Performance Monitoring Market by Deployment, 2020 - 2023, USD Million
- TABLE 431 South Korea Application Performance Monitoring Market by Deployment, 2024 - 2031, USD Million
- TABLE 432 South Korea Application Performance Monitoring Market by Enterprise Size, 2020 - 2023, USD Million
- TABLE 433 South Korea Application Performance Monitoring Market by Enterprise Size, 2024 - 2031, USD Million
- TABLE 434 South Korea Application Performance Monitoring Market by Solution, 2020 - 2023, USD Million
- TABLE 435 South Korea Application Performance Monitoring Market by Solution, 2024 - 2031, USD Million
- TABLE 436 South Korea Application Performance Monitoring Market by Services Type, 2020 - 2023, USD Million
- TABLE 437 South Korea Application Performance Monitoring Market by Services Type, 2024 - 2031, USD Million
- TABLE 438 Singapore Application Performance Monitoring Market, 2020 - 2023, USD Million
- TABLE 439 Singapore Application Performance Monitoring Market, 2024 - 2031, USD Million
- TABLE 440 Singapore Application Performance Monitoring Market by Access Type, 2020 - 2023, USD Million
- TABLE 441 Singapore Application Performance Monitoring Market by Access Type, 2024 - 2031, USD Million
- TABLE 442 Singapore Application Performance Monitoring Market by End-use, 2020 - 2023, USD Million
- TABLE 443 Singapore Application Performance Monitoring Market by End-use, 2024 - 2031, USD Million
- TABLE 444 Singapore Application Performance Monitoring Market by Deployment, 2020 - 2023, USD Million
- TABLE 445 Singapore Application Performance Monitoring Market by Deployment, 2024 - 2031, USD Million
- TABLE 446 Singapore Application Performance Monitoring Market by Enterprise Size, 2020 - 2023, USD Million
- TABLE 447 Singapore Application Performance Monitoring Market by Enterprise Size, 2024 - 2031, USD Million
- TABLE 448 Singapore Application Performance Monitoring Market by Solution, 2020 - 2023, USD Million
- TABLE 449 Singapore Application Performance Monitoring Market by Solution, 2024 - 2031, USD Million
- TABLE 450 Singapore Application Performance Monitoring Market by Services Type, 2020 - 2023, USD Million
- TABLE 451 Singapore Application Performance Monitoring Market by Services Type, 2024 - 2031, USD Million
- TABLE 452 Malaysia Application Performance Monitoring Market, 2020 - 2023, USD Million
- TABLE 453 Malaysia Application Performance Monitoring Market, 2024 - 2031, USD Million
- TABLE 454 Malaysia Application Performance Monitoring Market by Access Type, 2020 - 2023, USD Million
- TABLE 455 Malaysia Application Performance Monitoring Market by Access Type, 2024 - 2031, USD Million
- TABLE 456 Malaysia Application Performance Monitoring Market by End-use, 2020 - 2023, USD Million
- TABLE 457 Malaysia Application Performance Monitoring Market by End-use, 2024 - 2031, USD Million
- TABLE 458 Malaysia Application Performance Monitoring Market by Deployment, 2020 - 2023, USD Million
- TABLE 459 Malaysia Application Performance Monitoring Market by Deployment, 2024 - 2031, USD Million
- TABLE 460 Malaysia Application Performance Monitoring Market by Enterprise Size, 2020 - 2023, USD Million
- TABLE 461 Malaysia Application Performance Monitoring Market by Enterprise Size, 2024 - 2031, USD Million
- TABLE 462 Malaysia Application Performance Monitoring Market by Solution, 2020 - 2023, USD Million
- TABLE 463 Malaysia Application Performance Monitoring Market by Solution, 2024 - 2031, USD Million
- TABLE 464 Malaysia Application Performance Monitoring Market by Services Type, 2020 - 2023, USD Million
- TABLE 465 Malaysia Application Performance Monitoring Market by Services Type, 2024 - 2031, USD Million
- TABLE 466 Rest of Asia Pacific Application Performance Monitoring Market, 2020 - 2023, USD Million
- TABLE 467 Rest of Asia Pacific Application Performance Monitoring Market, 2024 - 2031, USD Million
- TABLE 468 Rest of Asia Pacific Application Performance Monitoring Market by Access Type, 2020 - 2023, USD Million
- TABLE 469 Rest of Asia Pacific Application Performance Monitoring Market by Access Type, 2024 - 2031, USD Million
- TABLE 470 Rest of Asia Pacific Application Performance Monitoring Market by End-use, 2020 - 2023, USD Million
- TABLE 471 Rest of Asia Pacific Application Performance Monitoring Market by End-use, 2024 - 2031, USD Million
- TABLE 472 Rest of Asia Pacific Application Performance Monitoring Market by Deployment, 2020 - 2023, USD Million
- TABLE 473 Rest of Asia Pacific Application Performance Monitoring Market by Deployment, 2024 - 2031, USD Million
- TABLE 474 Rest of Asia Pacific Application Performance Monitoring Market by Enterprise Size, 2020 - 2023, USD Million
- TABLE 475 Rest of Asia Pacific Application Performance Monitoring Market by Enterprise Size, 2024 - 2031, USD Million
- TABLE 476 Rest of Asia Pacific Application Performance Monitoring Market by Solution, 2020 - 2023, USD Million
- TABLE 477 Rest of Asia Pacific Application Performance Monitoring Market by Solution, 2024 - 2031, USD Million
- TABLE 478 Rest of Asia Pacific Application Performance Monitoring Market by Services Type, 2020 - 2023, USD Million
- TABLE 479 Rest of Asia Pacific Application Performance Monitoring Market by Services Type, 2024 - 2031, USD Million
- TABLE 480 LAMEA Application Performance Monitoring Market, 2020 - 2023, USD Million
- TABLE 481 LAMEA Application Performance Monitoring Market, 2024 - 2031, USD Million
- TABLE 482 LAMEA Application Performance Monitoring Market by Access Type, 2020 - 2023, USD Million
- TABLE 483 LAMEA Application Performance Monitoring Market by Access Type, 2024 - 2031, USD Million
- TABLE 484 LAMEA Web APM Market by Country, 2020 - 2023, USD Million
- TABLE 485 LAMEA Web APM Market by Country, 2024 - 2031, USD Million
- TABLE 486 LAMEA Mobile APM Market by Country, 2020 - 2023, USD Million
- TABLE 487 LAMEA Mobile APM Market by Country, 2024 - 2031, USD Million
- TABLE 488 LAMEA Application Performance Monitoring Market by End-use, 2020 - 2023, USD Million
- TABLE 489 LAMEA Application Performance Monitoring Market by End-use, 2024 - 2031, USD Million
- TABLE 490 LAMEA IT & Telecommunications Market by Country, 2020 - 2023, USD Million
- TABLE 491 LAMEA IT & Telecommunications Market by Country, 2024 - 2031, USD Million
- TABLE 492 LAMEA BFSI Market by Country, 2020 - 2023, USD Million
- TABLE 493 LAMEA BFSI Market by Country, 2024 - 2031, USD Million
- TABLE 494 LAMEA Retail & E-Commerce Market by Country, 2020 - 2023, USD Million
- TABLE 495 LAMEA Retail & E-Commerce Market by Country, 2024 - 2031, USD Million
- TABLE 496 LAMEA Healthcare Market by Country, 2020 - 2023, USD Million
- TABLE 497 LAMEA Healthcare Market by Country, 2024 - 2031, USD Million
- TABLE 498 LAMEA Manufacturing Market by Country, 2020 - 2023, USD Million
- TABLE 499 LAMEA Manufacturing Market by Country, 2024 - 2031, USD Million
- TABLE 500 LAMEA Government Market by Country, 2020 - 2023, USD Million
- TABLE 501 LAMEA Government Market by Country, 2024 - 2031, USD Million
- TABLE 502 LAMEA Media & Entertainment Market by Country, 2020 - 2023, USD Million
- TABLE 503 LAMEA Media & Entertainment Market by Country, 2024 - 2031, USD Million
- TABLE 504 LAMEA Academics Market by Country, 2020 - 2023, USD Million
- TABLE 505 LAMEA Academics Market by Country, 2024 - 2031, USD Million
- TABLE 506 LAMEA Other End-use Market by Country, 2020 - 2023, USD Million
- TABLE 507 LAMEA Other End-use Market by Country, 2024 - 2031, USD Million
- TABLE 508 LAMEA Application Performance Monitoring Market by Deployment, 2020 - 2023, USD Million
- TABLE 509 LAMEA Application Performance Monitoring Market by Deployment, 2024 - 2031, USD Million
- TABLE 510 LAMEA Cloud Market by Country, 2020 - 2023, USD Million
- TABLE 511 LAMEA Cloud Market by Country, 2024 - 2031, USD Million
- TABLE 512 LAMEA On-Premises Market by Country, 2020 - 2023, USD Million
- TABLE 513 LAMEA On-Premises Market by Country, 2024 - 2031, USD Million
- TABLE 514 LAMEA Application Performance Monitoring Market by Enterprise Size, 2020 - 2023, USD Million
- TABLE 515 LAMEA Application Performance Monitoring Market by Enterprise Size, 2024 - 2031, USD Million
- TABLE 516 LAMEA Large Enterprises Market by Country, 2020 - 2023, USD Million
- TABLE 517 LAMEA Large Enterprises Market by Country, 2024 - 2031, USD Million
- TABLE 518 LAMEA SMEs Market by Country, 2020 - 2023, USD Million
- TABLE 519 LAMEA SMEs Market by Country, 2024 - 2031, USD Million
- TABLE 520 LAMEA Application Performance Monitoring Market by Solution, 2020 - 2023, USD Million
- TABLE 521 LAMEA Application Performance Monitoring Market by Solution, 2024 - 2031, USD Million
- TABLE 522 LAMEA Software Market by Country, 2020 - 2023, USD Million
- TABLE 523 LAMEA Software Market by Country, 2024 - 2031, USD Million
- TABLE 524 LAMEA Services Market by Country, 2020 - 2023, USD Million
- TABLE 525 LAMEA Services Market by Country, 2024 - 2031, USD Million
- TABLE 526 LAMEA Application Performance Monitoring Market by Services Type, 2020 - 2023, USD Million
- TABLE 527 LAMEA Application Performance Monitoring Market by Services Type, 2024 - 2031, USD Million
- TABLE 528 LAMEA Integration & Deployment Market by Country, 2020 - 2023, USD Million
- TABLE 529 LAMEA Integration & Deployment Market by Country, 2024 - 2031, USD Million
- TABLE 530 LAMEA Support & Maintenance Market by Country, 2020 - 2023, USD Million
- TABLE 531 LAMEA Support & Maintenance Market by Country, 2024 - 2031, USD Million
- TABLE 532 LAMEA Training & Education Market by Country, 2020 - 2023, USD Million
- TABLE 533 LAMEA Training & Education Market by Country, 2024 - 2031, USD Million
- TABLE 534 LAMEA Application Performance Monitoring Market by Country, 2020 - 2023, USD Million
- TABLE 535 LAMEA Application Performance Monitoring Market by Country, 2024 - 2031, USD Million
- TABLE 536 Brazil Application Performance Monitoring Market, 2020 - 2023, USD Million
- TABLE 537 Brazil Application Performance Monitoring Market, 2024 - 2031, USD Million
- TABLE 538 Brazil Application Performance Monitoring Market by Access Type, 2020 - 2023, USD Million
- TABLE 539 Brazil Application Performance Monitoring Market by Access Type, 2024 - 2031, USD Million
- TABLE 540 Brazil Application Performance Monitoring Market by End-use, 2020 - 2023, USD Million
- TABLE 541 Brazil Application Performance Monitoring Market by End-use, 2024 - 2031, USD Million
- TABLE 542 Brazil Application Performance Monitoring Market by Deployment, 2020 - 2023, USD Million
- TABLE 543 Brazil Application Performance Monitoring Market by Deployment, 2024 - 2031, USD Million
- TABLE 544 Brazil Application Performance Monitoring Market by Enterprise Size, 2020 - 2023, USD Million
- TABLE 545 Brazil Application Performance Monitoring Market by Enterprise Size, 2024 - 2031, USD Million
- TABLE 546 Brazil Application Performance Monitoring Market by Solution, 2020 - 2023, USD Million
- TABLE 547 Brazil Application Performance Monitoring Market by Solution, 2024 - 2031, USD Million
- TABLE 548 Brazil Application Performance Monitoring Market by Services Type, 2020 - 2023, USD Million
- TABLE 549 Brazil Application Performance Monitoring Market by Services Type, 2024 - 2031, USD Million
- TABLE 550 Argentina Application Performance Monitoring Market, 2020 - 2023, USD Million
- TABLE 551 Argentina Application Performance Monitoring Market, 2024 - 2031, USD Million
- TABLE 552 Argentina Application Performance Monitoring Market by Access Type, 2020 - 2023, USD Million
- TABLE 553 Argentina Application Performance Monitoring Market by Access Type, 2024 - 2031, USD Million
- TABLE 554 Argentina Application Performance Monitoring Market by End-use, 2020 - 2023, USD Million
- TABLE 555 Argentina Application Performance Monitoring Market by End-use, 2024 - 2031, USD Million
- TABLE 556 Argentina Application Performance Monitoring Market by Deployment, 2020 - 2023, USD Million
- TABLE 557 Argentina Application Performance Monitoring Market by Deployment, 2024 - 2031, USD Million
- TABLE 558 Argentina Application Performance Monitoring Market by Enterprise Size, 2020 - 2023, USD Million
- TABLE 559 Argentina Application Performance Monitoring Market by Enterprise Size, 2024 - 2031, USD Million
- TABLE 560 Argentina Application Performance Monitoring Market by Solution, 2020 - 2023, USD Million
- TABLE 561 Argentina Application Performance Monitoring Market by Solution, 2024 - 2031, USD Million
- TABLE 562 Argentina Application Performance Monitoring Market by Services Type, 2020 - 2023, USD Million
- TABLE 563 Argentina Application Performance Monitoring Market by Services Type, 2024 - 2031, USD Million
- TABLE 564 UAE Application Performance Monitoring Market, 2020 - 2023, USD Million
- TABLE 565 UAE Application Performance Monitoring Market, 2024 - 2031, USD Million
- TABLE 566 UAE Application Performance Monitoring Market by Access Type, 2020 - 2023, USD Million
- TABLE 567 UAE Application Performance Monitoring Market by Access Type, 2024 - 2031, USD Million
- TABLE 568 UAE Application Performance Monitoring Market by End-use, 2020 - 2023, USD Million
- TABLE 569 UAE Application Performance Monitoring Market by End-use, 2024 - 2031, USD Million
- TABLE 570 UAE Application Performance Monitoring Market by Deployment, 2020 - 2023, USD Million
- TABLE 571 UAE Application Performance Monitoring Market by Deployment, 2024 - 2031, USD Million
- TABLE 572 UAE Application Performance Monitoring Market by Enterprise Size, 2020 - 2023, USD Million
- TABLE 573 UAE Application Performance Monitoring Market by Enterprise Size, 2024 - 2031, USD Million
- TABLE 574 UAE Application Performance Monitoring Market by Solution, 2020 - 2023, USD Million
- TABLE 575 UAE Application Performance Monitoring Market by Solution, 2024 - 2031, USD Million
- TABLE 576 UAE Application Performance Monitoring Market by Services Type, 2020 - 2023, USD Million
- TABLE 577 UAE Application Performance Monitoring Market by Services Type, 2024 - 2031, USD Million
- TABLE 578 Saudi Arabia Application Performance Monitoring Market, 2020 - 2023, USD Million
- TABLE 579 Saudi Arabia Application Performance Monitoring Market, 2024 - 2031, USD Million
- TABLE 580 Saudi Arabia Application Performance Monitoring Market by Access Type, 2020 - 2023, USD Million
- TABLE 581 Saudi Arabia Application Performance Monitoring Market by Access Type, 2024 - 2031, USD Million
- TABLE 582 Saudi Arabia Application Performance Monitoring Market by End-use, 2020 - 2023, USD Million
- TABLE 583 Saudi Arabia Application Performance Monitoring Market by End-use, 2024 - 2031, USD Million
- TABLE 584 Saudi Arabia Application Performance Monitoring Market by Deployment, 2020 - 2023, USD Million
- TABLE 585 Saudi Arabia Application Performance Monitoring Market by Deployment, 2024 - 2031, USD Million
- TABLE 586 Saudi Arabia Application Performance Monitoring Market by Enterprise Size, 2020 - 2023, USD Million
- TABLE 587 Saudi Arabia Application Performance Monitoring Market by Enterprise Size, 2024 - 2031, USD Million
- TABLE 588 Saudi Arabia Application Performance Monitoring Market by Solution, 2020 - 2023, USD Million
- TABLE 589 Saudi Arabia Application Performance Monitoring Market by Solution, 2024 - 2031, USD Million
- TABLE 590 Saudi Arabia Application Performance Monitoring Market by Services Type, 2020 - 2023, USD Million
- TABLE 591 Saudi Arabia Application Performance Monitoring Market by Services Type, 2024 - 2031, USD Million
- TABLE 592 South Africa Application Performance Monitoring Market, 2020 - 2023, USD Million
- TABLE 593 South Africa Application Performance Monitoring Market, 2024 - 2031, USD Million
- TABLE 594 South Africa Application Performance Monitoring Market by Access Type, 2020 - 2023, USD Million
- TABLE 595 South Africa Application Performance Monitoring Market by Access Type, 2024 - 2031, USD Million
- TABLE 596 South Africa Application Performance Monitoring Market by End-use, 2020 - 2023, USD Million
- TABLE 597 South Africa Application Performance Monitoring Market by End-use, 2024 - 2031, USD Million
- TABLE 598 South Africa Application Performance Monitoring Market by Deployment, 2020 - 2023, USD Million
- TABLE 599 South Africa Application Performance Monitoring Market by Deployment, 2024 - 2031, USD Million
- TABLE 600 South Africa Application Performance Monitoring Market by Enterprise Size, 2020 - 2023, USD Million
- TABLE 601 South Africa Application Performance Monitoring Market by Enterprise Size, 2024 - 2031, USD Million
- TABLE 602 South Africa Application Performance Monitoring Market by Solution, 2020 - 2023, USD Million
- TABLE 603 South Africa Application Performance Monitoring Market by Solution, 2024 - 2031, USD Million
- TABLE 604 South Africa Application Performance Monitoring Market by Services Type, 2020 - 2023, USD Million
- TABLE 605 South Africa Application Performance Monitoring Market by Services Type, 2024 - 2031, USD Million
- TABLE 606 Nigeria Application Performance Monitoring Market, 2020 - 2023, USD Million
- TABLE 607 Nigeria Application Performance Monitoring Market, 2024 - 2031, USD Million
- TABLE 608 Nigeria Application Performance Monitoring Market by Access Type, 2020 - 2023, USD Million
- TABLE 609 Nigeria Application Performance Monitoring Market by Access Type, 2024 - 2031, USD Million
- TABLE 610 Nigeria Application Performance Monitoring Market by End-use, 2020 - 2023, USD Million
- TABLE 611 Nigeria Application Performance Monitoring Market by End-use, 2024 - 2031, USD Million
- TABLE 612 Nigeria Application Performance Monitoring Market by Deployment, 2020 - 2023, USD Million
- TABLE 613 Nigeria Application Performance Monitoring Market by Deployment, 2024 - 2031, USD Million
- TABLE 614 Nigeria Application Performance Monitoring Market by Enterprise Size, 2020 - 2023, USD Million
- TABLE 615 Nigeria Application Performance Monitoring Market by Enterprise Size, 2024 - 2031, USD Million
- TABLE 616 Nigeria Application Performance Monitoring Market by Solution, 2020 - 2023, USD Million
- TABLE 617 Nigeria Application Performance Monitoring Market by Solution, 2024 - 2031, USD Million
- TABLE 618 Nigeria Application Performance Monitoring Market by Services Type, 2020 - 2023, USD Million
- TABLE 619 Nigeria Application Performance Monitoring Market by Services Type, 2024 - 2031, USD Million
- TABLE 620 Rest of LAMEA Application Performance Monitoring Market, 2020 - 2023, USD Million
- TABLE 621 Rest of LAMEA Application Performance Monitoring Market, 2024 - 2031, USD Million
- TABLE 622 Rest of LAMEA Application Performance Monitoring Market by Access Type, 2020 - 2023, USD Million
- TABLE 623 Rest of LAMEA Application Performance Monitoring Market by Access Type, 2024 - 2031, USD Million
- TABLE 624 Rest of LAMEA Application Performance Monitoring Market by End-use, 2020 - 2023, USD Million
- TABLE 625 Rest of LAMEA Application Performance Monitoring Market by End-use, 2024 - 2031, USD Million
- TABLE 626 Rest of LAMEA Application Performance Monitoring Market by Deployment, 2020 - 2023, USD Million
- TABLE 627 Rest of LAMEA Application Performance Monitoring Market by Deployment, 2024 - 2031, USD Million
- TABLE 628 Rest of LAMEA Application Performance Monitoring Market by Enterprise Size, 2020 - 2023, USD Million
- TABLE 629 Rest of LAMEA Application Performance Monitoring Market by Enterprise Size, 2024 - 2031, USD Million
- TABLE 630 Rest of LAMEA Application Performance Monitoring Market by Solution, 2020 - 2023, USD Million
- TABLE 631 Rest of LAMEA Application Performance Monitoring Market by Solution, 2024 - 2031, USD Million
- TABLE 632 Rest of LAMEA Application Performance Monitoring Market by Services Type, 2020 - 2023, USD Million
- TABLE 633 Rest of LAMEA Application Performance Monitoring Market by Services Type, 2024 - 2031, USD Million
- TABLE 634 Key Information - Amazon Web Services, Inc.
- TABLE 635 Key Information - Cisco Systems, Inc.
- TABLE 636 Key Information - Broadcom, Inc.
- TABLE 637 Key Information - Datadog Cloud Monitoring
- TABLE 638 Key Information - Google LLC
- TABLE 639 Key Information - IBM Corporation
- TABLE 640 Key Information - Microsoft Corporation
- TABLE 641 Key Information - Oracle Corporation
- TABLE 642 Key Information - Open Text Corporation
- TABLE 643 Key Information - Dynatrace, Inc.
The Global Application Performance Monitoring Market size is expected to reach $20.9 billion by 2031, rising at a market growth of 14.7% CAGR during the forecast period.
E-commerce platforms often experience significant traffic spikes during peak shopping seasons, such as Cyber Monday, Black Friday, or holiday sales. APM tools helps monitor and manage the performance of these platforms to handle high traffic volumes efficiently without compromising user experience. In addition, for retailers with mobile apps, APM tools track app performance across different devices and operating systems, ensuring smooth functionality and quick response times to enhance user satisfaction. Thus, the retail & e-commerce segment acquired 16% revenue share in the application performance monitoring market in 2023.
The major strategies followed by the market participants are Product Launches as the key developmental strategy to keep pace with the changing demands of end users. For instance, In July, 2024, Oracle Corporation unveiled OCI Stack Monitoring simplifies monitoring by automatically overseeing all hosts-whether in OCI, on-premises, or other clouds-through a new one-click UI. This feature enables automatic promotion of hosts for monitoring once an agent is deployed, ensuring seamless tracking with minimal effort.
Based on the Analysis presented in the KBV Cardinal matrix; Microsoft Corporation and Google LLC are the forerunners in the Application Performance Monitoring Market. Companies such as Amazon Web Services, Inc., Cisco Systems, Inc., and Broadcom, Inc. are some of the key innovators in Application Performance Monitoring Market. In May, 2024, Cisco Systems, Inc. unveiled a new virtual appliance for AppDynamics On-Premises, offering AI-driven application observability with enhanced anomaly detection, security, and SAP monitoring. The update improves performance detection, security, and SAP management while providing flexible licensing options, including a transition between self-hosted and SaaS solutions.
Market Growth Factors
APM tools provide detailed metrics on application performance, including response times, transaction times, and error rates. These metrics help organizations understand how performance issues affect user experience and identify areas for improvement. APM solutions offer insights into user behaviour and application usage patterns, helping organizations tailor their performance optimization efforts to meet user needs and preferences better. Hence, the growing focus on customer experience drives the market's growth.
Additionally, APM tools must be capable of monitoring the performance of these advanced technologies, ensuring they operate efficiently and deliver accurate results. In conclusion, the growth of digital transformation initiatives drives the market's growth.
Market Restraining Factors
APM tools can be a target for cyber-attacks if they have security vulnerabilities. An exploited vulnerability could allow attackers to access sensitive performance data or compromise the integrity of the monitoring system. Regular updates and patches are required to address security vulnerabilities in APM tools. Failure to keep the solutions up to date can expose organizations to security risks. In conclusion, data privacy and security concerns are hindering the market's growth.
The leading players in the market are competing with diverse innovative offerings to remain competitive in the market. The above illustration shows the percentage of revenue shared by some of the leading companies in the market. The leading players of the market are adopting various strategies in order to cater demand coming from the different industries. The key developmental strategies in the market are Product Launches and Product Expansions.
Solution Outlook
Based on solution, the market is divided into software and services. In 2023, the software segment garnered 67% revenue share in the market. APM software is equipped with advanced diagnostic tools that facilitate in-depth root cause analysis of performance issues. By analyzing performance metrics, transaction traces, and logs, the software helps pinpoint the underlying causes of problems, enabling faster resolution.
Services Outlook
The services segment is further subdivided into integration & deployment, training & education, and support & maintenance. In 2023, the integration & deployment segment held 44% revenue share in the market. APM solutions need to integrate with other IT management tools such as incident management systems, IT service management (ITSM) platforms, and log management systems.
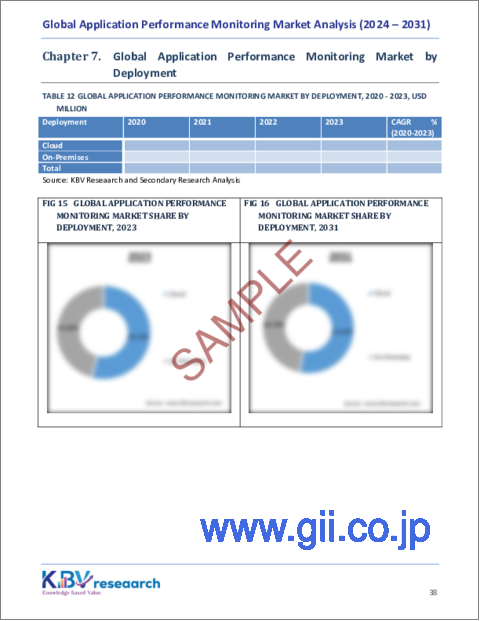
Deployment Mode Outlook
On the basis of deployment mode, the market is segmented into cloud and on-premises. In 2023, the on-premises segment attained 46% revenue share in the market. On-premises deployments allow for extensive customization to meet specific organizational needs.
Enterprise Size Outlook
Based on enterprise size, the market is classified into large enterprises and SMEs. The SMEs segment witnessed 40% revenue share in the market in 2023. SMEs are progressively incorporating digital technologies and tools to improve their operations in the digital environment.
Access Type Outlook
By access type, the market is divided into web APM, mobile APM, and others. In 2023, the web APM segment registered 65% revenue share in the market. Modern businesses rely heavily on web applications for various functions, from customer-facing services to internal operations.
End User Outlook
On the basis of end user, the market is categorized into BFSI, manufacturing, healthcare, retail & e-commerce, IT and telecommunications, media and entertainment, academics, government, and others. The IT and telecommunications segment attained 23% revenue share in the market in 2023. IT and telecommunications companies often deal with complex applications and systems that require constant monitoring to ensure they operate smoothly.
Regional Outlook
Region-wise, the market is analyzed across North America, Europe, Asia Pacific, and LAMEA. The Asia Pacific region generated 29% revenue share in the market in 2023. Asia Pacific has a high mobile penetration rate, with many users accessing applications and services via smartphones.
Market Competition and Attributes
The Application Performance Monitoring (APM) market is highly competitive, featuring a range of established and emerging players. Key attributes influencing competition include real-time data analysis, scalability, ease of integration, and advanced analytics capabilities. Leading companies focus on delivering comprehensive solutions that offer deep visibility into application performance, user experience, and infrastructure health. Innovations in AI and machine learning are also driving competition, with vendors aiming to provide more predictive and actionable insights to enhance application reliability and performance.
Recent Strategies Deployed in the Market
- Aug-2024: Google LLC announced the partnership with Accenture, an Irish American professional services company to boost enterprise solutions in generative AI and cybersecurity. They are expanding investments to support all stages of AI projects, from use case identification to deployment. The partnership also focuses on cybersecurity, addressing new risks, and enhancing breach management and recovery.
- Aug-2024: Microsoft Corporation announced the acquisition of Fungible Inc., which specializes in composable infrastructure for enhancing networking and storage in data centers using high-efficiency, low-power data processing units (DPUs). The Fungible team will integrate into Microsoft's data center engineering, focusing on DPU solutions and network innovation, reinforcing Microsoft's commitment to advanced data center technologies.
- Jul-2024: Cisco Systems, Inc. announced the partnership with Optus, an Australian telecommunications company to enhance network and data security for Optus Enterprise and Business clients. This includes expanding Optus' Integrated Network Operation Centre and Security Operation Centre, offering Cisco-Powered Secure Firewall and Managed Secure Service Edge, with future capabilities in Vulnerability Management and Threat Hunting.
- Jul-2024: Oracle Corporation unveiled OCI Stack Monitoring simplifies monitoring by automatically overseeing all hosts-whether in OCI, on-premises, or other clouds-through a new one-click UI. This feature enables automatic promotion of hosts for monitoring once an agent is deployed, ensuring seamless tracking with minimal effort.
- Jun-2024: Datadog, Inc. unveiled its security offerings with Agentless Scanning, Data Security, and Code Security features. These updates help DevOps and security teams secure cloud environments and applications, providing essential visibility and context to manage and prioritize security risks in complex, cloud-native setups.
List of Key Companies Profiled
- Amazon Web Services, Inc. (Amazon.com, Inc.)
- Cisco Systems, Inc.
- Broadcom, Inc.
- Datadog, Inc.
- Google LLC (Alphabet Inc.)
- IBM Corporation
- Microsoft Corporation
- Oracle Corporation
- Open Text Corporation
- Dynatrace, Inc.
Global Application Performance Monitoring Market Report Segmentation
By Access Type
- Web APM
- Mobile APM
By End-use
- IT & Telecommunications
- BFSI
- Retail & E-Commerce
- Healthcare
- Manufacturing
- Government
- Media & Entertainment
- Academics
- Other End-use
By Deployment
- Cloud
- On-Premises
By Enterprise Size
- Large Enterprises
- SMEs
By Solution
- Software
- Services
- Integration & Deployment
- Support & Maintenance
- Training & Education
By Geography
- North America
- US
- Canada
- Mexico
- Rest of North America
- Europe
- Germany
- UK
- France
- Russia
- Spain
- Italy
- Rest of Europe
- Asia Pacific
- China
- Japan
- India
- South Korea
- Australia
- Malaysia
- Rest of Asia Pacific
- LAMEA
- Brazil
- Argentina
- UAE
- Saudi Arabia
- South Africa
- Nigeria
- Rest of LAMEA
Table of Contents
Chapter 1. Market Scope & Methodology
- 1.1 Market Definition
- 1.2 Objectives
- 1.3 Market Scope
- 1.4 Segmentation
- 1.4.1 Global Application Performance Monitoring Market, by Access Type
- 1.4.2 Global Application Performance Monitoring Market, by End-use
- 1.4.3 Global Application Performance Monitoring Market, by Deployment
- 1.4.4 Global Application Performance Monitoring Market, by Enterprise Size
- 1.4.5 Global Application Performance Monitoring Market, by Solution
- 1.4.6 Global Application Performance Monitoring Market, by Geography
- 1.5 Methodology for the research
Chapter 2. Market at a Glance
- 2.1 Key Highlights
Chapter 3. Market Overview
- 3.1 Introduction
- 3.1.1 Overview
- 3.1.1.1 Market Composition and Scenario
- 3.1.1 Overview
- 3.2 Key Factors Impacting the Market
- 3.2.1 Market Drivers
- 3.2.2 Market Restraints
- 3.2.3 Market Opportunities
- 3.2.4 Market Challenges
Chapter 4. Competition Analysis - Global
- 4.1 KBV Cardinal Matrix
- 4.2 Recent Industry Wide Strategic Developments
- 4.2.1 Partnerships, Collaborations and Agreements
- 4.2.2 Product Launches and Product Expansions
- 4.2.3 Acquisition and Mergers
- 4.3 Market Share Analysis, 2023
- 4.4 Top Winning Strategies
- 4.4.1 Key Leading Strategies: Percentage Distribution (2020-2024)
- 4.4.2 Key Strategic Move: (Product Launches and Product Expansions: 2020, Oct - 2024, Jul) Leading Players
- 4.5 Porter Five Forces Analysis
Chapter 5. Global Application Performance Monitoring Market by Access Type
- 5.1 Global Web APM Market by Region
- 5.2 Global Mobile APM Market by Region
Chapter 6. Global Application Performance Monitoring Market by End-use
- 6.1 Global IT & Telecommunications Market by Region
- 6.2 Global BFSI Market by Region
- 6.3 Global Retail & E-Commerce Market by Region
- 6.4 Global Healthcare Market by Region
- 6.5 Global Manufacturing Market by Region
- 6.6 Global Government Market by Region
- 6.7 Global Media & Entertainment Market by Region
- 6.8 Global Academics Market by Region
- 6.9 Global Other End-use Market by Region
Chapter 7. Global Application Performance Monitoring Market by Deployment
- 7.1 Global Cloud Market by Region
- 7.2 Global On-Premises Market by Region
Chapter 8. Global Application Performance Monitoring Market by Enterprise Size
- 8.1 Global Large Enterprises Market by Region
- 8.2 Global SMEs Market by Region
Chapter 9. Global Application Performance Monitoring Market by Solution
- 9.1 Global Software Market by Region
- 9.2 Global Services Market by Region
- 9.3 Global Application Performance Monitoring Market by Services Type
- 9.3.1 Global Integration & Deployment Market by Region
- 9.3.2 Global Support & Maintenance Market by Region
- 9.3.3 Global Training & Education Market by Region
Chapter 10. Global Application Performance Monitoring Market by Region
- 10.1 North America Application Performance Monitoring Market
- 10.1.1 North America Application Performance Monitoring Market by Access Type
- 10.1.1.1 North America Web APM Market by Region
- 10.1.1.2 North America Mobile APM Market by Region
- 10.1.2 North America Application Performance Monitoring Market by End-use
- 10.1.2.1 North America IT & Telecommunications Market by Country
- 10.1.2.2 North America BFSI Market by Country
- 10.1.2.3 North America Retail & E-Commerce Market by Country
- 10.1.2.4 North America Healthcare Market by Country
- 10.1.2.5 North America Manufacturing Market by Country
- 10.1.2.6 North America Government Market by Country
- 10.1.2.7 North America Media & Entertainment Market by Country
- 10.1.2.8 North America Academics Market by Country
- 10.1.2.9 North America Other End-use Market by Country
- 10.1.3 North America Application Performance Monitoring Market by Deployment
- 10.1.3.1 North America Cloud Market by Country
- 10.1.3.2 North America On-Premises Market by Country
- 10.1.4 North America Application Performance Monitoring Market by Enterprise Size
- 10.1.4.1 North America Large Enterprises Market by Country
- 10.1.4.2 North America SMEs Market by Country
- 10.1.5 North America Application Performance Monitoring Market by Solution
- 10.1.5.1 North America Software Market by Country
- 10.1.5.2 North America Services Market by Country
- 10.1.5.3 North America Application Performance Monitoring Market by Services Type
- 10.1.5.3.1 North America Integration & Deployment Market by Country
- 10.1.5.3.2 North America Support & Maintenance Market by Country
- 10.1.5.3.3 North America Training & Education Market by Country
- 10.1.6 North America Application Performance Monitoring Market by Country
- 10.1.6.1 US Application Performance Monitoring Market
- 10.1.6.1.1 US Application Performance Monitoring Market by Access Type
- 10.1.6.1.2 US Application Performance Monitoring Market by End-use
- 10.1.6.1.3 US Application Performance Monitoring Market by Deployment
- 10.1.6.1.4 US Application Performance Monitoring Market by Enterprise Size
- 10.1.6.1.5 US Application Performance Monitoring Market by Solution
- 10.1.6.1.5.1 US Application Performance Monitoring Market by Services Type
- 10.1.6.2 Canada Application Performance Monitoring Market
- 10.1.6.2.1 Canada Application Performance Monitoring Market by Access Type
- 10.1.6.2.2 Canada Application Performance Monitoring Market by End-use
- 10.1.6.2.3 Canada Application Performance Monitoring Market by Deployment
- 10.1.6.2.4 Canada Application Performance Monitoring Market by Enterprise Size
- 10.1.6.2.5 Canada Application Performance Monitoring Market by Solution
- 10.1.6.2.5.1 Canada Application Performance Monitoring Market by Services Type
- 10.1.6.3 Mexico Application Performance Monitoring Market
- 10.1.6.3.1 Mexico Application Performance Monitoring Market by Access Type
- 10.1.6.3.2 Mexico Application Performance Monitoring Market by End-use
- 10.1.6.3.3 Mexico Application Performance Monitoring Market by Deployment
- 10.1.6.3.4 Mexico Application Performance Monitoring Market by Enterprise Size
- 10.1.6.3.5 Mexico Application Performance Monitoring Market by Solution
- 10.1.6.3.5.1 Mexico Application Performance Monitoring Market by Services Type
- 10.1.6.4 Rest of North America Application Performance Monitoring Market
- 10.1.6.4.1 Rest of North America Application Performance Monitoring Market by Access Type
- 10.1.6.4.2 Rest of North America Application Performance Monitoring Market by End-use
- 10.1.6.4.3 Rest of North America Application Performance Monitoring Market by Deployment
- 10.1.6.4.4 Rest of North America Application Performance Monitoring Market by Enterprise Size
- 10.1.6.4.5 Rest of North America Application Performance Monitoring Market by Solution
- 10.1.6.4.5.1 Rest of North America Application Performance Monitoring Market by Services Type
- 10.1.6.1 US Application Performance Monitoring Market
- 10.1.1 North America Application Performance Monitoring Market by Access Type
- 10.2 Europe Application Performance Monitoring Market
- 10.2.1 Europe Application Performance Monitoring Market by Access Type
- 10.2.1.1 Europe Web APM Market by Country
- 10.2.1.2 Europe Mobile APM Market by Country
- 10.2.2 Europe Application Performance Monitoring Market by End-use
- 10.2.2.1 Europe IT & Telecommunications Market by Country
- 10.2.2.2 Europe BFSI Market by Country
- 10.2.2.3 Europe Retail & E-Commerce Market by Country
- 10.2.2.4 Europe Healthcare Market by Country
- 10.2.2.5 Europe Manufacturing Market by Country
- 10.2.2.6 Europe Government Market by Country
- 10.2.2.7 Europe Media & Entertainment Market by Country
- 10.2.2.8 Europe Academics Market by Country
- 10.2.2.9 Europe Other End-use Market by Country
- 10.2.3 Europe Application Performance Monitoring Market by Deployment
- 10.2.3.1 Europe Cloud Market by Country
- 10.2.3.2 Europe On-Premises Market by Country
- 10.2.4 Europe Application Performance Monitoring Market by Enterprise Size
- 10.2.4.1 Europe Large Enterprises Market by Country
- 10.2.4.2 Europe SMEs Market by Country
- 10.2.5 Europe Application Performance Monitoring Market by Solution
- 10.2.5.1 Europe Software Market by Country
- 10.2.5.2 Europe Services Market by Country
- 10.2.5.3 Europe Application Performance Monitoring Market by Services Type
- 10.2.5.3.1 Europe Integration & Deployment Market by Country
- 10.2.5.3.2 Europe Support & Maintenance Market by Country
- 10.2.5.3.3 Europe Training & Education Market by Country
- 10.2.6 Europe Application Performance Monitoring Market by Country
- 10.2.6.1 Germany Application Performance Monitoring Market
- 10.2.6.1.1 Germany Application Performance Monitoring Market by Access Type
- 10.2.6.1.2 Germany Application Performance Monitoring Market by End-use
- 10.2.6.1.3 Germany Application Performance Monitoring Market by Deployment
- 10.2.6.1.4 Germany Application Performance Monitoring Market by Enterprise Size
- 10.2.6.1.5 Germany Application Performance Monitoring Market by Solution
- 10.2.6.1.5.1 Germany Application Performance Monitoring Market by Services Type
- 10.2.6.2 UK Application Performance Monitoring Market
- 10.2.6.2.1 UK Application Performance Monitoring Market by Access Type
- 10.2.6.2.2 UK Application Performance Monitoring Market by End-use
- 10.2.6.2.3 UK Application Performance Monitoring Market by Deployment
- 10.2.6.2.4 UK Application Performance Monitoring Market by Enterprise Size
- 10.2.6.2.5 UK Application Performance Monitoring Market by Solution
- 10.2.6.2.5.1 UK Application Performance Monitoring Market by Services Type
- 10.2.6.3 France Application Performance Monitoring Market
- 10.2.6.3.1 France Application Performance Monitoring Market by Access Type
- 10.2.6.3.2 France Application Performance Monitoring Market by End-use
- 10.2.6.3.3 France Application Performance Monitoring Market by Deployment
- 10.2.6.3.4 France Application Performance Monitoring Market by Enterprise Size
- 10.2.6.3.5 France Application Performance Monitoring Market by Solution
- 10.2.6.3.5.1 France Application Performance Monitoring Market by Services Type
- 10.2.6.4 Russia Application Performance Monitoring Market
- 10.2.6.4.1 Russia Application Performance Monitoring Market by Access Type
- 10.2.6.4.2 Russia Application Performance Monitoring Market by End-use
- 10.2.6.4.3 Russia Application Performance Monitoring Market by Deployment
- 10.2.6.4.4 Russia Application Performance Monitoring Market by Enterprise Size
- 10.2.6.4.5 Russia Application Performance Monitoring Market by Solution
- 10.2.6.4.5.1 Russia Application Performance Monitoring Market by Services Type
- 10.2.6.5 Spain Application Performance Monitoring Market
- 10.2.6.5.1 Spain Application Performance Monitoring Market by Access Type
- 10.2.6.5.2 Spain Application Performance Monitoring Market by End-use
- 10.2.6.5.3 Spain Application Performance Monitoring Market by Deployment
- 10.2.6.5.4 Spain Application Performance Monitoring Market by Enterprise Size
- 10.2.6.5.5 Spain Application Performance Monitoring Market by Solution
- 10.2.6.5.5.1 Spain Application Performance Monitoring Market by Services Type
- 10.2.6.6 Italy Application Performance Monitoring Market
- 10.2.6.6.1 Italy Application Performance Monitoring Market by Access Type
- 10.2.6.6.2 Italy Application Performance Monitoring Market by End-use
- 10.2.6.6.3 Italy Application Performance Monitoring Market by Deployment
- 10.2.6.6.4 Italy Application Performance Monitoring Market by Enterprise Size
- 10.2.6.6.5 Italy Application Performance Monitoring Market by Solution
- 10.2.6.6.5.1 Italy Application Performance Monitoring Market by Services Type
- 10.2.6.7 Rest of Europe Application Performance Monitoring Market
- 10.2.6.7.1 Rest of Europe Application Performance Monitoring Market by Access Type
- 10.2.6.7.2 Rest of Europe Application Performance Monitoring Market by End-use
- 10.2.6.7.3 Rest of Europe Application Performance Monitoring Market by Deployment
- 10.2.6.7.4 Rest of Europe Application Performance Monitoring Market by Enterprise Size
- 10.2.6.7.5 Rest of Europe Application Performance Monitoring Market by Solution
- 10.2.6.7.5.1 Rest of Europe Application Performance Monitoring Market by Services Type
- 10.2.6.1 Germany Application Performance Monitoring Market
- 10.2.1 Europe Application Performance Monitoring Market by Access Type
- 10.3 Asia Pacific Application Performance Monitoring Market
- 10.3.1 Asia Pacific Application Performance Monitoring Market by Access Type
- 10.3.1.1 Asia Pacific Web APM Market by Country
- 10.3.1.2 Asia Pacific Mobile APM Market by Country
- 10.3.2 Asia Pacific Application Performance Monitoring Market by End-use
- 10.3.2.1 Asia Pacific IT & Telecommunications Market by Country
- 10.3.2.2 Asia Pacific BFSI Market by Country
- 10.3.2.3 Asia Pacific Retail & E-Commerce Market by Country
- 10.3.2.4 Asia Pacific Healthcare Market by Country
- 10.3.2.5 Asia Pacific Manufacturing Market by Country
- 10.3.2.6 Asia Pacific Government Market by Country
- 10.3.2.7 Asia Pacific Media & Entertainment Market by Country
- 10.3.2.8 Asia Pacific Academics Market by Country
- 10.3.2.9 Asia Pacific Other End-use Market by Country
- 10.3.3 Asia Pacific Application Performance Monitoring Market by Deployment
- 10.3.3.1 Asia Pacific Cloud Market by Country
- 10.3.3.2 Asia Pacific On-Premises Market by Country
- 10.3.4 Asia Pacific Application Performance Monitoring Market by Enterprise Size
- 10.3.4.1 Asia Pacific Large Enterprises Market by Country
- 10.3.4.2 Asia Pacific SMEs Market by Country
- 10.3.5 Asia Pacific Application Performance Monitoring Market by Solution
- 10.3.5.1 Asia Pacific Software Market by Country
- 10.3.5.2 Asia Pacific Services Market by Country
- 10.3.5.3 Asia Pacific Application Performance Monitoring Market by Services Type
- 10.3.5.3.1 Asia Pacific Integration & Deployment Market by Country
- 10.3.5.3.2 Asia Pacific Support & Maintenance Market by Country
- 10.3.5.3.3 Asia Pacific Training & Education Market by Country
- 10.3.6 Asia Pacific Application Performance Monitoring Market by Country
- 10.3.6.1 China Application Performance Monitoring Market
- 10.3.6.1.1 China Application Performance Monitoring Market by Access Type
- 10.3.6.1.2 China Application Performance Monitoring Market by End-use
- 10.3.6.1.3 China Application Performance Monitoring Market by Deployment
- 10.3.6.1.4 China Application Performance Monitoring Market by Enterprise Size
- 10.3.6.1.5 China Application Performance Monitoring Market by Solution
- 10.3.6.1.5.1 China Application Performance Monitoring Market by Services Type
- 10.3.6.2 Japan Application Performance Monitoring Market
- 10.3.6.2.1 Japan Application Performance Monitoring Market by Access Type
- 10.3.6.2.2 Japan Application Performance Monitoring Market by End-use
- 10.3.6.2.3 Japan Application Performance Monitoring Market by Deployment
- 10.3.6.2.4 Japan Application Performance Monitoring Market by Enterprise Size
- 10.3.6.2.5 Japan Application Performance Monitoring Market by Solution
- 10.3.6.2.5.1 Japan Application Performance Monitoring Market by Services Type
- 10.3.6.3 India Application Performance Monitoring Market
- 10.3.6.3.1 India Application Performance Monitoring Market by Access Type
- 10.3.6.3.2 India Application Performance Monitoring Market by End-use
- 10.3.6.3.3 India Application Performance Monitoring Market by Deployment
- 10.3.6.3.4 India Application Performance Monitoring Market by Enterprise Size
- 10.3.6.3.5 India Application Performance Monitoring Market by Solution
- 10.3.6.3.5.1 India Application Performance Monitoring Market by Services Type
- 10.3.6.4 South Korea Application Performance Monitoring Market
- 10.3.6.4.1 South Korea Application Performance Monitoring Market by Access Type
- 10.3.6.4.2 South Korea Application Performance Monitoring Market by End-use
- 10.3.6.4.3 South Korea Application Performance Monitoring Market by Deployment
- 10.3.6.4.4 South Korea Application Performance Monitoring Market by Enterprise Size
- 10.3.6.4.5 South Korea Application Performance Monitoring Market by Solution
- 10.3.6.4.5.1 South Korea Application Performance Monitoring Market by Services Type
- 10.3.6.5 Singapore Application Performance Monitoring Market
- 10.3.6.5.1 Singapore Application Performance Monitoring Market by Access Type
- 10.3.6.5.2 Singapore Application Performance Monitoring Market by End-use
- 10.3.6.5.3 Singapore Application Performance Monitoring Market by Deployment
- 10.3.6.5.4 Singapore Application Performance Monitoring Market by Enterprise Size
- 10.3.6.5.5 Singapore Application Performance Monitoring Market by Solution
- 10.3.6.5.5.1 Singapore Application Performance Monitoring Market by Services Type
- 10.3.6.6 Malaysia Application Performance Monitoring Market
- 10.3.6.6.1 Malaysia Application Performance Monitoring Market by Access Type
- 10.3.6.6.2 Malaysia Application Performance Monitoring Market by End-use
- 10.3.6.6.3 Malaysia Application Performance Monitoring Market by Deployment
- 10.3.6.6.4 Malaysia Application Performance Monitoring Market by Enterprise Size
- 10.3.6.6.5 Malaysia Application Performance Monitoring Market by Solution
- 10.3.6.6.5.1 Malaysia Application Performance Monitoring Market by Services Type
- 10.3.6.7 Rest of Asia Pacific Application Performance Monitoring Market
- 10.3.6.7.1 Rest of Asia Pacific Application Performance Monitoring Market by Access Type
- 10.3.6.7.2 Rest of Asia Pacific Application Performance Monitoring Market by End-use
- 10.3.6.7.3 Rest of Asia Pacific Application Performance Monitoring Market by Deployment
- 10.3.6.7.4 Rest of Asia Pacific Application Performance Monitoring Market by Enterprise Size
- 10.3.6.7.5 Rest of Asia Pacific Application Performance Monitoring Market by Solution
- 10.3.6.7.5.1 Rest of Asia Pacific Application Performance Monitoring Market by Services Type
- 10.3.6.1 China Application Performance Monitoring Market
- 10.3.1 Asia Pacific Application Performance Monitoring Market by Access Type
- 10.4 LAMEA Application Performance Monitoring Market
- 10.4.1 LAMEA Application Performance Monitoring Market by Access Type
- 10.4.1.1 LAMEA Web APM Market by Country
- 10.4.1.2 LAMEA Mobile APM Market by Country
- 10.4.2 LAMEA Application Performance Monitoring Market by End-use
- 10.4.2.1 LAMEA IT & Telecommunications Market by Country
- 10.4.2.2 LAMEA BFSI Market by Country
- 10.4.2.3 LAMEA Retail & E-Commerce Market by Country
- 10.4.2.4 LAMEA Healthcare Market by Country
- 10.4.2.5 LAMEA Manufacturing Market by Country
- 10.4.2.6 LAMEA Government Market by Country
- 10.4.2.7 LAMEA Media & Entertainment Market by Country
- 10.4.2.8 LAMEA Academics Market by Country
- 10.4.2.9 LAMEA Other End-use Market by Country
- 10.4.3 LAMEA Application Performance Monitoring Market by Deployment
- 10.4.3.1 LAMEA Cloud Market by Country
- 10.4.3.2 LAMEA On-Premises Market by Country
- 10.4.4 LAMEA Application Performance Monitoring Market by Enterprise Size
- 10.4.4.1 LAMEA Large Enterprises Market by Country
- 10.4.4.2 LAMEA SMEs Market by Country
- 10.4.5 LAMEA Application Performance Monitoring Market by Solution
- 10.4.5.1 LAMEA Software Market by Country
- 10.4.5.2 LAMEA Services Market by Country
- 10.4.5.3 LAMEA Application Performance Monitoring Market by Services Type
- 10.4.5.3.1 LAMEA Integration & Deployment Market by Country
- 10.4.5.3.2 LAMEA Support & Maintenance Market by Country
- 10.4.5.3.3 LAMEA Training & Education Market by Country
- 10.4.6 LAMEA Application Performance Monitoring Market by Country
- 10.4.6.1 Brazil Application Performance Monitoring Market
- 10.4.6.1.1 Brazil Application Performance Monitoring Market by Access Type
- 10.4.6.1.2 Brazil Application Performance Monitoring Market by End-use
- 10.4.6.1.3 Brazil Application Performance Monitoring Market by Deployment
- 10.4.6.1.4 Brazil Application Performance Monitoring Market by Enterprise Size
- 10.4.6.1.5 Brazil Application Performance Monitoring Market by Solution
- 10.4.6.1.5.1 Brazil Application Performance Monitoring Market by Services Type
- 10.4.6.2 Argentina Application Performance Monitoring Market
- 10.4.6.2.1 Argentina Application Performance Monitoring Market by Access Type
- 10.4.6.2.2 Argentina Application Performance Monitoring Market by End-use
- 10.4.6.2.3 Argentina Application Performance Monitoring Market by Deployment
- 10.4.6.2.4 Argentina Application Performance Monitoring Market by Enterprise Size
- 10.4.6.2.5 Argentina Application Performance Monitoring Market by Solution
- 10.4.6.2.5.1 Argentina Application Performance Monitoring Market by Services Type
- 10.4.6.3 UAE Application Performance Monitoring Market
- 10.4.6.3.1 UAE Application Performance Monitoring Market by Access Type
- 10.4.6.3.2 UAE Application Performance Monitoring Market by End-use
- 10.4.6.3.3 UAE Application Performance Monitoring Market by Deployment
- 10.4.6.3.4 UAE Application Performance Monitoring Market by Enterprise Size
- 10.4.6.3.5 UAE Application Performance Monitoring Market by Solution
- 10.4.6.3.5.1 UAE Application Performance Monitoring Market by Services Type
- 10.4.6.4 Saudi Arabia Application Performance Monitoring Market
- 10.4.6.4.1 Saudi Arabia Application Performance Monitoring Market by Access Type
- 10.4.6.4.2 Saudi Arabia Application Performance Monitoring Market by End-use
- 10.4.6.4.3 Saudi Arabia Application Performance Monitoring Market by Deployment
- 10.4.6.4.4 Saudi Arabia Application Performance Monitoring Market by Enterprise Size
- 10.4.6.4.5 Saudi Arabia Application Performance Monitoring Market by Solution
- 10.4.6.4.5.1 Saudi Arabia Application Performance Monitoring Market by Services Type
- 10.4.6.5 South Africa Application Performance Monitoring Market
- 10.4.6.5.1 South Africa Application Performance Monitoring Market by Access Type
- 10.4.6.5.2 South Africa Application Performance Monitoring Market by End-use
- 10.4.6.5.3 South Africa Application Performance Monitoring Market by Deployment
- 10.4.6.5.4 South Africa Application Performance Monitoring Market by Enterprise Size
- 10.4.6.5.5 South Africa Application Performance Monitoring Market by Solution
- 10.4.6.5.5.1 South Africa Application Performance Monitoring Market by Services Type
- 10.4.6.6 Nigeria Application Performance Monitoring Market
- 10.4.6.6.1 Nigeria Application Performance Monitoring Market by Access Type
- 10.4.6.6.2 Nigeria Application Performance Monitoring Market by End-use
- 10.4.6.6.3 Nigeria Application Performance Monitoring Market by Deployment
- 10.4.6.6.4 Nigeria Application Performance Monitoring Market by Enterprise Size
- 10.4.6.6.5 Nigeria Application Performance Monitoring Market by Solution
- 10.4.6.6.5.1 Nigeria Application Performance Monitoring Market by Services Type
- 10.4.6.7 Rest of LAMEA Application Performance Monitoring Market
- 10.4.6.7.1 Rest of LAMEA Application Performance Monitoring Market by Access Type
- 10.4.6.7.2 Rest of LAMEA Application Performance Monitoring Market by End-use
- 10.4.6.7.3 Rest of LAMEA Application Performance Monitoring Market by Deployment
- 10.4.6.7.4 Rest of LAMEA Application Performance Monitoring Market by Enterprise Size
- 10.4.6.7.5 Rest of LAMEA Application Performance Monitoring Market by Solution
- 10.4.6.7.5.1 Rest of LAMEA Application Performance Monitoring Market by Services Type
- 10.4.6.1 Brazil Application Performance Monitoring Market
- 10.4.1 LAMEA Application Performance Monitoring Market by Access Type
Chapter 11. Company Profiles
- 11.1 Amazon Web Services, Inc. (Amazon.com, Inc.)
- 11.1.1 Company Overview
- 11.1.2 Financial Analysis
- 11.1.3 Segmental Analysis
- 11.1.4 Recent strategies and developments:
- 11.1.4.1 Product Launches and Product Expansions:
- 11.1.5 SWOT Analysis
- 11.2 Cisco Systems, Inc.
- 11.2.1 Company Overview
- 11.2.2 Financial Analysis
- 11.2.3 Regional Analysis
- 11.2.4 Research & Development Expense
- 11.2.5 Recent strategies and developments:
- 11.2.5.1 Partnerships, Collaborations, and Agreements:
- 11.2.5.2 Product Launches and Product Expansions:
- 11.2.5.3 Acquisition and Mergers:
- 11.2.6 SWOT Analysis
- 11.3 Broadcom, Inc.
- 11.3.1 Company Overview
- 11.3.2 Financial Analysis
- 11.3.3 Segmental and Regional Analysis
- 11.3.4 Research & Development Expense
- 11.3.5 Recent strategies and developments:
- 11.3.5.1 Acquisition and Mergers:
- 11.3.6 SWOT Analysis
- 11.4 Datadog, Inc.
- 11.4.1 Company Overview
- 11.4.2 Financial Analysis
- 11.4.3 Research & Development Expenses
- 11.4.4 Recent strategies and developments:
- 11.4.4.1 Partnerships, Collaborations, and Agreements:
- 11.4.4.2 Product Launches and Product Expansions:
- 11.4.4.3 Acquisition and Mergers:
- 11.4.5 SWOT Analysis:
- 11.5 Google LLC (Alphabet Inc.)
- 11.5.1 Company Overview
- 11.5.2 Financial Analysis
- 11.5.3 Segmental and Regional Analysis
- 11.5.4 Research & Development Expense
- 11.5.5 Recent strategies and developments:
- 11.5.5.1 Partnerships, Collaborations, and Agreements:
- 11.5.6 SWOT Analysis
- 11.6 IBM Corporation
- 11.6.1 Company Overview
- 11.6.2 Financial Analysis
- 11.6.3 Regional & Segmental Analysis
- 11.6.4 Research & Development Expenses
- 11.6.5 Recent strategies and developments:
- 11.6.5.1 Product Launches and Product Expansions:
- 11.6.5.2 Acquisition and Mergers:
- 11.6.6 SWOT Analysis
- 11.7 Microsoft Corporation
- 11.7.1 Company Overview
- 11.7.2 Financial Analysis
- 11.7.3 Segmental and Regional Analysis
- 11.7.4 Research & Development Expenses
- 11.7.5 Recent strategies and developments:
- 11.7.5.1 Acquisition and Mergers:
- 11.7.6 SWOT Analysis
- 11.8 Oracle Corporation
- 11.8.1 Company Overview
- 11.8.2 Financial Analysis
- 11.8.3 Segmental and Regional Analysis
- 11.8.4 Research & Development Expense
- 11.8.5 Recent strategies and developments:
- 11.8.5.1 Product Launches and Product Expansions:
- 11.8.6 SWOT Analysis
- 11.9 Open Text Corporation
- 11.9.1 Company Overview
- 11.9.2 Financial Analysis
- 11.9.3 Segmental and Regional Analysis
- 11.9.4 Research & Development Expenses
- 11.9.5 SWOT Analysis
- 11.10. Dynatrace, Inc.
- 11.10.1 Company Overview
- 11.10.2 Financial Analysis
- 11.10.3 Regional Analysis
- 11.10.4 Research & Development Expenses
- 11.10.5 Recent strategies and developments:
- 11.10.5.1 Product Launches and Product Expansions:
- 11.10.5.2 Acquisition and Mergers:
- 11.10.6 SWOT Analysis:

