|
|
市場調査レポート
商品コード
1450717
ビジョンセンサーの世界市場規模、シェアおよび動向分析レポート:センサータイプ別、エンドユーザー別、用途別、地域別の見通しと予測、2023年から2030年Global Vision Sensor Market Size, Share & Trends Analysis Report By Sensor Type (Less Than 3D, 3D, and Others), By End User, By Application (Inspection, Code Reading, Gauging, and Others), By Regional Outlook and Forecast, 2023 - 2030 |
||||||
|
|||||||
|
|||||||

| ビジョンセンサーの世界市場規模、シェアおよび動向分析レポート:センサータイプ別、エンドユーザー別、用途別、地域別の見通しと予測、2023年から2030年 |
|
出版日: 2024年02月29日
発行: KBV Research
ページ情報: 英文 253 Pages
納期: 即納可能
|

全表示
- 概要
- 図表
- 目次
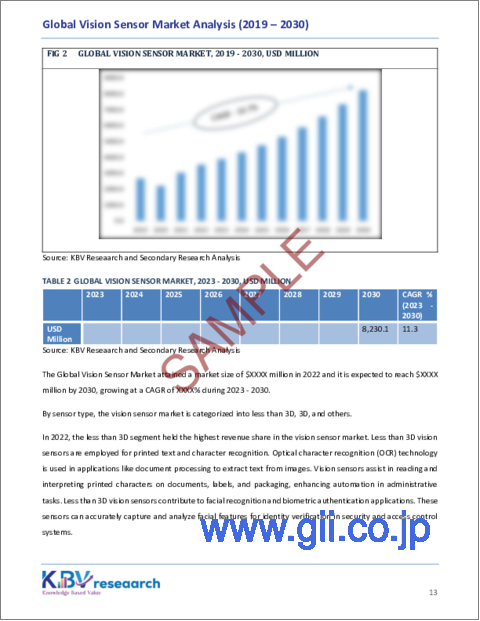
ビジョンセンサー市場規模は2030年までに82億米ドルに達すると予想されており、予測期間中に11.3%のCAGRで市場成長が見込まれます。
KBV Cardinal matrixで示された分析に基づいています。Keyence Corporationはこの市場の先駆者です。 Teledyne Technologies, Inc.、Omron Corporation、Cognex Corporationなどの企業は、市場の主要なイノベーターの一部です。たとえば、2023年 5月に、Cognex Corporationは産業用マシンビジョンシステムであるAdvantage 182ビジョンシステムを発売しました。同社はこの製品を通じて、複雑な位置特定、分類、試験作業の自動化を目指しています。 Advantage 182ビジョンシステムには、高度なマシンビジョン、バーコード読み取り、エッジ学習技術が組み込まれており、基本的な存在/不在検出や追跡用途から、正確な位置合わせや高度な色試験に至るまで、幅広いタスクを自動化できます。
市場の成長要因
インダストリー4.0では、高い製品品質と一貫性を確保するために、自動化された試験と品質管理プロセスを導入することが重視されています。これらのセンサーは製造ラインに導入され、リアルタイム試験を実行し、欠陥を特定し、製品仕様を検証します。これらのセンサーは、生産全体を通じて製品を追跡し、シリアル番号を確認し、規制基準を確実に順守する上で重要な役割を果たします。したがって、インダストリー4.0とスマート製造の採用の増加により、市場は大幅に拡大しています。
さらに、eコマースフルフィルメントセンターや物流ハブには、荷物の自動仕分けのためにビジョンセンサーが導入されています。国際貿易局によると、B2Bビジネスによる世界のeコマース売上高は過去10年間で徐々に増加しており、世界のB2Beコマース業界は2026年までに36兆米ドルの価値があると予想されていeコマースと物流の市場は大幅に拡大すると予想されます。
市場抑制要因
初期コストが高いと、システムのアップグレードや拡大の頻度が制限される場合があります。組織は、特に経済的に不確実な時期に、高コストの投資を検討する際にリスクを回避する傾向にある可能性があります。センサーシステムの実装に関連して認識される財務リスクは、投資決定の遅延または延期につながり、市場全体の成長に影響を与える可能性があります。
目次
第1章 市場範囲と調査手法
- 市場の定義
- 目的
- 市場範囲
- セグメンテーション
- 調査手法
第2章 市場要覧
第3章 市場概要
- イントロダクション
- 概要
- 市場構成とシナリオ
- 概要
- 市場に影響を与える主要要因
- 市場促進要因
- 市場抑制要因
- 市場機会
- 市場の課題
第4章 競合分析-世界
- KBVカーディナルマトリックス
- 最近の業界全体の戦略的展開
- パートナーシップ、コラボレーション、契約
- 製品の発売と製品の拡大
- 買収と合併
- 市場シェア分析(2022年)
- 主要成功戦略
- 主要戦略
- 主要な戦略的動き
- ポーターのファイブフォース分析
第5章 世界市場:センサータイプ別
- 世界の3D以下市場:地域別
- 世界の3D市場:地域別
- 世界のその他市場:地域別
第6章 世界市場:エンドユーザー別
- 世界の自動車市場:地域別
- 世界の家電市場:地域別
- 世界のエレクトロニクスと半導体市場:地域別
- 世界の医薬品市場:地域別
- 世界の食品と包装市場:地域別
- 世界のその他市場:地域別
第7章 世界市場:用途別
- 世界の試験市場:地域別
- 世界のコード読み取り市場:地域別
- 世界の計測市場:地域別
- 世界のその他市場:地域別
第8章 世界市場:地域別
- 北米
- 北米市場:国別
- 米国
- カナダ
- メキシコ
- その他の北米地域
- 北米市場:国別
- 欧州
- 欧州市場:国別
- ドイツ
- 英国
- フランス
- ロシア
- スペイン
- イタリア
- その他の欧州地域
- 欧州市場:国別
- アジア太平洋
- アジア太平洋市場:国別
- 中国
- 日本
- インド
- 韓国
- シンガポール
- マレーシア
- その他のアジア太平洋
- アジア太平洋市場:国別
- ラテンアメリカ・中東・アフリカ
- ラテンアメリカ・中東・アフリカ市場:国別
- ブラジル
- アルゼンチン
- アラブ首長国連邦
- サウジアラビア
- 南アフリカ
- ナイジェリア
- その他のラテンアメリカ・中東・アフリカ地域
- ラテンアメリカ・中東・アフリカ市場:国別
第9章 企業プロファイル
- Omron Corporation
- Basler AG
- Sick AG
- Datalogic Sp.A.(Hydra S.p.A.)
- Balluff GmbH
- Teledyne Technologies, Inc(Teledyne DALSA)
- IFM Electronics GmbH
- Keyence Corporation
- Baumer Holding AG
- Cognex Corporation
第10章 ビジョンセンサー市場の成功必須条件
LIST OF TABLES
- TABLE 1Global Vision Sensor Market, 2019 - 2022, USD Million
- TABLE 2Global Vision Sensor Market, 2023 - 2030, USD Million
- TABLE 3Partnerships, Collaborations and Agreements- Vision Sensor Market
- TABLE 4Product Launches And Product Expansions- Vision Sensor Market
- TABLE 5Acquisition and Mergers- Vision Sensor Market
- TABLE 6Global Vision Sensor Market by Sensor Type, 2019 - 2022, USD Million
- TABLE 7Global Vision Sensor Market by Sensor Type, 2023 - 2030, USD Million
- TABLE 8Global Less Than 3D Market by Region, 2019 - 2022, USD Million
- TABLE 9Global Less Than 3D Market by Region, 2023 - 2030, USD Million
- TABLE 10Global 3D Market by Region, 2019 - 2022, USD Million
- TABLE 11Global 3D Market by Region, 2023 - 2030, USD Million
- TABLE 12Global Others Market by Region, 2019 - 2022, USD Million
- TABLE 13Global Others Market by Region, 2023 - 2030, USD Million
- TABLE 14Global Vision Sensor Market by End User, 2019 - 2022, USD Million
- TABLE 15Global Vision Sensor Market by End User, 2023 - 2030, USD Million
- TABLE 16Global Automotive Market by Region, 2019 - 2022, USD Million
- TABLE 17Global Automotive Market by Region, 2023 - 2030, USD Million
- TABLE 18Global Consumer Electronics Market by Region, 2019 - 2022, USD Million
- TABLE 19Global Consumer Electronics Market by Region, 2023 - 2030, USD Million
- TABLE 20Global Electronics & Semiconductor Market by Region, 2019 - 2022, USD Million
- TABLE 21Global Electronics & Semiconductor Market by Region, 2023 - 2030, USD Million
- TABLE 22Global Pharmaceuticals Market by Region, 2019 - 2022, USD Million
- TABLE 23Global Pharmaceuticals Market by Region, 2023 - 2030, USD Million
- TABLE 24Global Food & Packaging Market by Region, 2019 - 2022, USD Million
- TABLE 25Global Food & Packaging Market by Region, 2023 - 2030, USD Million
- TABLE 26Global Others Market by Region, 2019 - 2022, USD Million
- TABLE 27Global Others Market by Region, 2023 - 2030, USD Million
- TABLE 28Global Vision Sensor Market by Application, 2019 - 2022, USD Million
- TABLE 29Global Vision Sensor Market by Application, 2023 - 2030, USD Million
- TABLE 30Global Inspection Market by Region, 2019 - 2022, USD Million
- TABLE 31Global Inspection Market by Region, 2023 - 2030, USD Million
- TABLE 32Global Code Reading Market by Region, 2019 - 2022, USD Million
- TABLE 33Global Code Reading Market by Region, 2023 - 2030, USD Million
- TABLE 34Global Gauging Market by Region, 2019 - 2022, USD Million
- TABLE 35Global Gauging Market by Region, 2023 - 2030, USD Million
- TABLE 36Global Others Market by Region, 2019 - 2022, USD Million
- TABLE 37Global Others Market by Region, 2023 - 2030, USD Million
- TABLE 38Global Vision Sensor Market by Region, 2019 - 2022, USD Million
- TABLE 39Global Vision Sensor Market by Region, 2023 - 2030, USD Million
- TABLE 40North America Vision Sensor Market, 2019 - 2022, USD Million
- TABLE 41North America Vision Sensor Market, 2023 - 2030, USD Million
- TABLE 42North America Vision Sensor Market by Sensor Type, 2019 - 2022, USD Million
- TABLE 43North America Vision Sensor Market by Sensor Type, 2023 - 2030, USD Million
- TABLE 44North America Less Than 3D Market by Country, 2019 - 2022, USD Million
- TABLE 45North America Less Than 3D Market by Country, 2023 - 2030, USD Million
- TABLE 46North America 3D Market by Country, 2019 - 2022, USD Million
- TABLE 47North America 3D Market by Country, 2023 - 2030, USD Million
- TABLE 48North America Others Market by Country, 2019 - 2022, USD Million
- TABLE 49North America Others Market by Country, 2023 - 2030, USD Million
- TABLE 50North America Vision Sensor Market by End User, 2019 - 2022, USD Million
- TABLE 51North America Vision Sensor Market by End User, 2023 - 2030, USD Million
- TABLE 52North America Automotive Market by Country, 2019 - 2022, USD Million
- TABLE 53North America Automotive Market by Country, 2023 - 2030, USD Million
- TABLE 54North America Consumer Electronics Market by Country, 2019 - 2022, USD Million
- TABLE 55North America Consumer Electronics Market by Country, 2023 - 2030, USD Million
- TABLE 56North America Electronics & Semiconductor Market by Country, 2019 - 2022, USD Million
- TABLE 57North America Electronics & Semiconductor Market by Country, 2023 - 2030, USD Million
- TABLE 58North America Pharmaceuticals Market by Country, 2019 - 2022, USD Million
- TABLE 59North America Pharmaceuticals Market by Country, 2023 - 2030, USD Million
- TABLE 60North America Food & Packaging Market by Country, 2019 - 2022, USD Million
- TABLE 61North America Food & Packaging Market by Country, 2023 - 2030, USD Million
- TABLE 62North America Others Market by Country, 2019 - 2022, USD Million
- TABLE 63North America Others Market by Country, 2023 - 2030, USD Million
- TABLE 64North America Vision Sensor Market by Application, 2019 - 2022, USD Million
- TABLE 65North America Vision Sensor Market by Application, 2023 - 2030, USD Million
- TABLE 66North America Inspection Market by Country, 2019 - 2022, USD Million
- TABLE 67North America Inspection Market by Country, 2023 - 2030, USD Million
- TABLE 68North America Code Reading Market by Country, 2019 - 2022, USD Million
- TABLE 69North America Code Reading Market by Country, 2023 - 2030, USD Million
- TABLE 70North America Gauging Market by Country, 2019 - 2022, USD Million
- TABLE 71North America Gauging Market by Country, 2023 - 2030, USD Million
- TABLE 72North America Others Market by Country, 2019 - 2022, USD Million
- TABLE 73North America Others Market by Country, 2023 - 2030, USD Million
- TABLE 74North America Vision Sensor Market by Country, 2019 - 2022, USD Million
- TABLE 75North America Vision Sensor Market by Country, 2023 - 2030, USD Million
- TABLE 76US Vision Sensor Market, 2019 - 2022, USD Million
- TABLE 77US Vision Sensor Market, 2023 - 2030, USD Million
- TABLE 78US Vision Sensor Market by Sensor Type, 2019 - 2022, USD Million
- TABLE 79US Vision Sensor Market by Sensor Type, 2023 - 2030, USD Million
- TABLE 80US Vision Sensor Market by End User, 2019 - 2022, USD Million
- TABLE 81US Vision Sensor Market by End User, 2023 - 2030, USD Million
- TABLE 82US Vision Sensor Market by Application, 2019 - 2022, USD Million
- TABLE 83US Vision Sensor Market by Application, 2023 - 2030, USD Million
- TABLE 84Canada Vision Sensor Market, 2019 - 2022, USD Million
- TABLE 85Canada Vision Sensor Market, 2023 - 2030, USD Million
- TABLE 86Canada Vision Sensor Market by Sensor Type, 2019 - 2022, USD Million
- TABLE 87Canada Vision Sensor Market by Sensor Type, 2023 - 2030, USD Million
- TABLE 88Canada Vision Sensor Market by End User, 2019 - 2022, USD Million
- TABLE 89Canada Vision Sensor Market by End User, 2023 - 2030, USD Million
- TABLE 90Canada Vision Sensor Market by Application, 2019 - 2022, USD Million
- TABLE 91Canada Vision Sensor Market by Application, 2023 - 2030, USD Million
- TABLE 92Mexico Vision Sensor Market, 2019 - 2022, USD Million
- TABLE 93Mexico Vision Sensor Market, 2023 - 2030, USD Million
- TABLE 94Mexico Vision Sensor Market by Sensor Type, 2019 - 2022, USD Million
- TABLE 95Mexico Vision Sensor Market by Sensor Type, 2023 - 2030, USD Million
- TABLE 96Mexico Vision Sensor Market by End User, 2019 - 2022, USD Million
- TABLE 97Mexico Vision Sensor Market by End User, 2023 - 2030, USD Million
- TABLE 98Mexico Vision Sensor Market by Application, 2019 - 2022, USD Million
- TABLE 99Mexico Vision Sensor Market by Application, 2023 - 2030, USD Million
- TABLE 100Rest of North America Vision Sensor Market, 2019 - 2022, USD Million
- TABLE 101Rest of North America Vision Sensor Market, 2023 - 2030, USD Million
- TABLE 102Rest of North America Vision Sensor Market by Sensor Type, 2019 - 2022, USD Million
- TABLE 103Rest of North America Vision Sensor Market by Sensor Type, 2023 - 2030, USD Million
- TABLE 104Rest of North America Vision Sensor Market by End User, 2019 - 2022, USD Million
- TABLE 105Rest of North America Vision Sensor Market by End User, 2023 - 2030, USD Million
- TABLE 106Rest of North America Vision Sensor Market by Application, 2019 - 2022, USD Million
- TABLE 107Rest of North America Vision Sensor Market by Application, 2023 - 2030, USD Million
- TABLE 108Europe Vision Sensor Market, 2019 - 2022, USD Million
- TABLE 109Europe Vision Sensor Market, 2023 - 2030, USD Million
- TABLE 110Europe Vision Sensor Market by Sensor Type, 2019 - 2022, USD Million
- TABLE 111Europe Vision Sensor Market by Sensor Type, 2023 - 2030, USD Million
- TABLE 112Europe Less Than 3D Market by Country, 2019 - 2022, USD Million
- TABLE 113Europe Less Than 3D Market by Country, 2023 - 2030, USD Million
- TABLE 114Europe 3D Market by Country, 2019 - 2022, USD Million
- TABLE 115Europe 3D Market by Country, 2023 - 2030, USD Million
- TABLE 116Europe Others Market by Country, 2019 - 2022, USD Million
- TABLE 117Europe Others Market by Country, 2023 - 2030, USD Million
- TABLE 118Europe Vision Sensor Market by End User, 2019 - 2022, USD Million
- TABLE 119Europe Vision Sensor Market by End User, 2023 - 2030, USD Million
- TABLE 120Europe Automotive Market by Country, 2019 - 2022, USD Million
- TABLE 121Europe Automotive Market by Country, 2023 - 2030, USD Million
- TABLE 122Europe Consumer Electronics Market by Country, 2019 - 2022, USD Million
- TABLE 123Europe Consumer Electronics Market by Country, 2023 - 2030, USD Million
- TABLE 124Europe Electronics & Semiconductor Market by Country, 2019 - 2022, USD Million
- TABLE 125Europe Electronics & Semiconductor Market by Country, 2023 - 2030, USD Million
- TABLE 126Europe Pharmaceuticals Market by Country, 2019 - 2022, USD Million
- TABLE 127Europe Pharmaceuticals Market by Country, 2023 - 2030, USD Million
- TABLE 128Europe Food & Packaging Market by Country, 2019 - 2022, USD Million
- TABLE 129Europe Food & Packaging Market by Country, 2023 - 2030, USD Million
- TABLE 130Europe Others Market by Country, 2019 - 2022, USD Million
- TABLE 131Europe Others Market by Country, 2023 - 2030, USD Million
- TABLE 132Europe Vision Sensor Market by Application, 2019 - 2022, USD Million
- TABLE 133Europe Vision Sensor Market by Application, 2023 - 2030, USD Million
- TABLE 134Europe Inspection Market by Country, 2019 - 2022, USD Million
- TABLE 135Europe Inspection Market by Country, 2023 - 2030, USD Million
- TABLE 136Europe Code Reading Market by Country, 2019 - 2022, USD Million
- TABLE 137Europe Code Reading Market by Country, 2023 - 2030, USD Million
- TABLE 138Europe Gauging Market by Country, 2019 - 2022, USD Million
- TABLE 139Europe Gauging Market by Country, 2023 - 2030, USD Million
- TABLE 140Europe Others Market by Country, 2019 - 2022, USD Million
- TABLE 141Europe Others Market by Country, 2023 - 2030, USD Million
- TABLE 142Europe Vision Sensor Market by Country, 2019 - 2022, USD Million
- TABLE 143Europe Vision Sensor Market by Country, 2023 - 2030, USD Million
- TABLE 144Germany Vision Sensor Market, 2019 - 2022, USD Million
- TABLE 145Germany Vision Sensor Market, 2023 - 2030, USD Million
- TABLE 146Germany Vision Sensor Market by Sensor Type, 2019 - 2022, USD Million
- TABLE 147Germany Vision Sensor Market by Sensor Type, 2023 - 2030, USD Million
- TABLE 148Germany Vision Sensor Market by End User, 2019 - 2022, USD Million
- TABLE 149Germany Vision Sensor Market by End User, 2023 - 2030, USD Million
- TABLE 150Germany Vision Sensor Market by Application, 2019 - 2022, USD Million
- TABLE 151Germany Vision Sensor Market by Application, 2023 - 2030, USD Million
- TABLE 152UK Vision Sensor Market, 2019 - 2022, USD Million
- TABLE 153UK Vision Sensor Market, 2023 - 2030, USD Million
- TABLE 154UK Vision Sensor Market by Sensor Type, 2019 - 2022, USD Million
- TABLE 155UK Vision Sensor Market by Sensor Type, 2023 - 2030, USD Million
- TABLE 156UK Vision Sensor Market by End User, 2019 - 2022, USD Million
- TABLE 157UK Vision Sensor Market by End User, 2023 - 2030, USD Million
- TABLE 158UK Vision Sensor Market by Application, 2019 - 2022, USD Million
- TABLE 159UK Vision Sensor Market by Application, 2023 - 2030, USD Million
- TABLE 160France Vision Sensor Market, 2019 - 2022, USD Million
- TABLE 161France Vision Sensor Market, 2023 - 2030, USD Million
- TABLE 162France Vision Sensor Market by Sensor Type, 2019 - 2022, USD Million
- TABLE 163France Vision Sensor Market by Sensor Type, 2023 - 2030, USD Million
- TABLE 164France Vision Sensor Market by End User, 2019 - 2022, USD Million
- TABLE 165France Vision Sensor Market by End User, 2023 - 2030, USD Million
- TABLE 166France Vision Sensor Market by Application, 2019 - 2022, USD Million
- TABLE 167France Vision Sensor Market by Application, 2023 - 2030, USD Million
- TABLE 168Russia Vision Sensor Market, 2019 - 2022, USD Million
- TABLE 169Russia Vision Sensor Market, 2023 - 2030, USD Million
- TABLE 170Russia Vision Sensor Market by Sensor Type, 2019 - 2022, USD Million
- TABLE 171Russia Vision Sensor Market by Sensor Type, 2023 - 2030, USD Million
- TABLE 172Russia Vision Sensor Market by End User, 2019 - 2022, USD Million
- TABLE 173Russia Vision Sensor Market by End User, 2023 - 2030, USD Million
- TABLE 174Russia Vision Sensor Market by Application, 2019 - 2022, USD Million
- TABLE 175Russia Vision Sensor Market by Application, 2023 - 2030, USD Million
- TABLE 176Spain Vision Sensor Market, 2019 - 2022, USD Million
- TABLE 177Spain Vision Sensor Market, 2023 - 2030, USD Million
- TABLE 178Spain Vision Sensor Market by Sensor Type, 2019 - 2022, USD Million
- TABLE 179Spain Vision Sensor Market by Sensor Type, 2023 - 2030, USD Million
- TABLE 180Spain Vision Sensor Market by End User, 2019 - 2022, USD Million
- TABLE 181Spain Vision Sensor Market by End User, 2023 - 2030, USD Million
- TABLE 182Spain Vision Sensor Market by Application, 2019 - 2022, USD Million
- TABLE 183Spain Vision Sensor Market by Application, 2023 - 2030, USD Million
- TABLE 184Italy Vision Sensor Market, 2019 - 2022, USD Million
- TABLE 185Italy Vision Sensor Market, 2023 - 2030, USD Million
- TABLE 186Italy Vision Sensor Market by Sensor Type, 2019 - 2022, USD Million
- TABLE 187Italy Vision Sensor Market by Sensor Type, 2023 - 2030, USD Million
- TABLE 188Italy Vision Sensor Market by End User, 2019 - 2022, USD Million
- TABLE 189Italy Vision Sensor Market by End User, 2023 - 2030, USD Million
- TABLE 190Italy Vision Sensor Market by Application, 2019 - 2022, USD Million
- TABLE 191Italy Vision Sensor Market by Application, 2023 - 2030, USD Million
- TABLE 192Rest of Europe Vision Sensor Market, 2019 - 2022, USD Million
- TABLE 193Rest of Europe Vision Sensor Market, 2023 - 2030, USD Million
- TABLE 194Rest of Europe Vision Sensor Market by Sensor Type, 2019 - 2022, USD Million
- TABLE 195Rest of Europe Vision Sensor Market by Sensor Type, 2023 - 2030, USD Million
- TABLE 196Rest of Europe Vision Sensor Market by End User, 2019 - 2022, USD Million
- TABLE 197Rest of Europe Vision Sensor Market by End User, 2023 - 2030, USD Million
- TABLE 198Rest of Europe Vision Sensor Market by Application, 2019 - 2022, USD Million
- TABLE 199Rest of Europe Vision Sensor Market by Application, 2023 - 2030, USD Million
- TABLE 200Asia Pacific Vision Sensor Market, 2019 - 2022, USD Million
- TABLE 201Asia Pacific Vision Sensor Market, 2023 - 2030, USD Million
- TABLE 202Asia Pacific Vision Sensor Market by Sensor Type, 2019 - 2022, USD Million
- TABLE 203Asia Pacific Vision Sensor Market by Sensor Type, 2023 - 2030, USD Million
- TABLE 204Asia Pacific Less Than 3D Market by Country, 2019 - 2022, USD Million
- TABLE 205Asia Pacific Less Than 3D Market by Country, 2023 - 2030, USD Million
- TABLE 206Asia Pacific 3D Market by Country, 2019 - 2022, USD Million
- TABLE 207Asia Pacific 3D Market by Country, 2023 - 2030, USD Million
- TABLE 208Asia Pacific Others Market by Country, 2019 - 2022, USD Million
- TABLE 209Asia Pacific Others Market by Country, 2023 - 2030, USD Million
- TABLE 210Asia Pacific Vision Sensor Market by End User, 2019 - 2022, USD Million
- TABLE 211Asia Pacific Vision Sensor Market by End User, 2023 - 2030, USD Million
- TABLE 212Asia Pacific Automotive Market by Country, 2019 - 2022, USD Million
- TABLE 213Asia Pacific Automotive Market by Country, 2023 - 2030, USD Million
- TABLE 214Asia Pacific Consumer Electronics Market by Country, 2019 - 2022, USD Million
- TABLE 215Asia Pacific Consumer Electronics Market by Country, 2023 - 2030, USD Million
- TABLE 216Asia Pacific Electronics & Semiconductor Market by Country, 2019 - 2022, USD Million
- TABLE 217Asia Pacific Electronics & Semiconductor Market by Country, 2023 - 2030, USD Million
- TABLE 218Asia Pacific Pharmaceuticals Market by Country, 2019 - 2022, USD Million
- TABLE 219Asia Pacific Pharmaceuticals Market by Country, 2023 - 2030, USD Million
- TABLE 220Asia Pacific Food & Packaging Market by Country, 2019 - 2022, USD Million
- TABLE 221Asia Pacific Food & Packaging Market by Country, 2023 - 2030, USD Million
- TABLE 222Asia Pacific Others Market by Country, 2019 - 2022, USD Million
- TABLE 223Asia Pacific Others Market by Country, 2023 - 2030, USD Million
- TABLE 224Asia Pacific Vision Sensor Market by Application, 2019 - 2022, USD Million
- TABLE 225Asia Pacific Vision Sensor Market by Application, 2023 - 2030, USD Million
- TABLE 226Asia Pacific Inspection Market by Country, 2019 - 2022, USD Million
- TABLE 227Asia Pacific Inspection Market by Country, 2023 - 2030, USD Million
- TABLE 228Asia Pacific Code Reading Market by Country, 2019 - 2022, USD Million
- TABLE 229Asia Pacific Code Reading Market by Country, 2023 - 2030, USD Million
- TABLE 230Asia Pacific Gauging Market by Country, 2019 - 2022, USD Million
- TABLE 231Asia Pacific Gauging Market by Country, 2023 - 2030, USD Million
- TABLE 232Asia Pacific Others Market by Country, 2019 - 2022, USD Million
- TABLE 233Asia Pacific Others Market by Country, 2023 - 2030, USD Million
- TABLE 234Asia Pacific Vision Sensor Market by Country, 2019 - 2022, USD Million
- TABLE 235Asia Pacific Vision Sensor Market by Country, 2023 - 2030, USD Million
- TABLE 236China Vision Sensor Market, 2019 - 2022, USD Million
- TABLE 237China Vision Sensor Market, 2023 - 2030, USD Million
- TABLE 238China Vision Sensor Market by Sensor Type, 2019 - 2022, USD Million
- TABLE 239China Vision Sensor Market by Sensor Type, 2023 - 2030, USD Million
- TABLE 240China Vision Sensor Market by End User, 2019 - 2022, USD Million
- TABLE 241China Vision Sensor Market by End User, 2023 - 2030, USD Million
- TABLE 242China Vision Sensor Market by Application, 2019 - 2022, USD Million
- TABLE 243China Vision Sensor Market by Application, 2023 - 2030, USD Million
- TABLE 244Japan Vision Sensor Market, 2019 - 2022, USD Million
- TABLE 245Japan Vision Sensor Market, 2023 - 2030, USD Million
- TABLE 246Japan Vision Sensor Market by Sensor Type, 2019 - 2022, USD Million
- TABLE 247Japan Vision Sensor Market by Sensor Type, 2023 - 2030, USD Million
- TABLE 248Japan Vision Sensor Market by End User, 2019 - 2022, USD Million
- TABLE 249Japan Vision Sensor Market by End User, 2023 - 2030, USD Million
- TABLE 250Japan Vision Sensor Market by Application, 2019 - 2022, USD Million
- TABLE 251Japan Vision Sensor Market by Application, 2023 - 2030, USD Million
- TABLE 252India Vision Sensor Market, 2019 - 2022, USD Million
- TABLE 253India Vision Sensor Market, 2023 - 2030, USD Million
- TABLE 254India Vision Sensor Market by Sensor Type, 2019 - 2022, USD Million
- TABLE 255India Vision Sensor Market by Sensor Type, 2023 - 2030, USD Million
- TABLE 256India Vision Sensor Market by End User, 2019 - 2022, USD Million
- TABLE 257India Vision Sensor Market by End User, 2023 - 2030, USD Million
- TABLE 258India Vision Sensor Market by Application, 2019 - 2022, USD Million
- TABLE 259India Vision Sensor Market by Application, 2023 - 2030, USD Million
- TABLE 260South Korea Vision Sensor Market, 2019 - 2022, USD Million
- TABLE 261South Korea Vision Sensor Market, 2023 - 2030, USD Million
- TABLE 262South Korea Vision Sensor Market by Sensor Type, 2019 - 2022, USD Million
- TABLE 263South Korea Vision Sensor Market by Sensor Type, 2023 - 2030, USD Million
- TABLE 264South Korea Vision Sensor Market by End User, 2019 - 2022, USD Million
- TABLE 265South Korea Vision Sensor Market by End User, 2023 - 2030, USD Million
- TABLE 266South Korea Vision Sensor Market by Application, 2019 - 2022, USD Million
- TABLE 267South Korea Vision Sensor Market by Application, 2023 - 2030, USD Million
- TABLE 268Singapore Vision Sensor Market, 2019 - 2022, USD Million
- TABLE 269Singapore Vision Sensor Market, 2023 - 2030, USD Million
- TABLE 270Singapore Vision Sensor Market by Sensor Type, 2019 - 2022, USD Million
- TABLE 271Singapore Vision Sensor Market by Sensor Type, 2023 - 2030, USD Million
- TABLE 272Singapore Vision Sensor Market by End User, 2019 - 2022, USD Million
- TABLE 273Singapore Vision Sensor Market by End User, 2023 - 2030, USD Million
- TABLE 274Singapore Vision Sensor Market by Application, 2019 - 2022, USD Million
- TABLE 275Singapore Vision Sensor Market by Application, 2023 - 2030, USD Million
- TABLE 276Malaysia Vision Sensor Market, 2019 - 2022, USD Million
- TABLE 277Malaysia Vision Sensor Market, 2023 - 2030, USD Million
- TABLE 278Malaysia Vision Sensor Market by Sensor Type, 2019 - 2022, USD Million
- TABLE 279Malaysia Vision Sensor Market by Sensor Type, 2023 - 2030, USD Million
- TABLE 280Malaysia Vision Sensor Market by End User, 2019 - 2022, USD Million
- TABLE 281Malaysia Vision Sensor Market by End User, 2023 - 2030, USD Million
- TABLE 282Malaysia Vision Sensor Market by Application, 2019 - 2022, USD Million
- TABLE 283Malaysia Vision Sensor Market by Application, 2023 - 2030, USD Million
- TABLE 284Rest of Asia Pacific Vision Sensor Market, 2019 - 2022, USD Million
- TABLE 285Rest of Asia Pacific Vision Sensor Market, 2023 - 2030, USD Million
- TABLE 286Rest of Asia Pacific Vision Sensor Market by Sensor Type, 2019 - 2022, USD Million
- TABLE 287Rest of Asia Pacific Vision Sensor Market by Sensor Type, 2023 - 2030, USD Million
- TABLE 288Rest of Asia Pacific Vision Sensor Market by End User, 2019 - 2022, USD Million
- TABLE 289Rest of Asia Pacific Vision Sensor Market by End User, 2023 - 2030, USD Million
- TABLE 290Rest of Asia Pacific Vision Sensor Market by Application, 2019 - 2022, USD Million
- TABLE 291Rest of Asia Pacific Vision Sensor Market by Application, 2023 - 2030, USD Million
- TABLE 292LAMEA Vision Sensor Market, 2019 - 2022, USD Million
- TABLE 293LAMEA Vision Sensor Market, 2023 - 2030, USD Million
- TABLE 294LAMEA Vision Sensor Market by Sensor Type, 2019 - 2022, USD Million
- TABLE 295LAMEA Vision Sensor Market by Sensor Type
The Global Vision Sensor Market size is expected to reach $8.2 billion by 2030, rising at a market growth of 11.3% CAGR during the forecast period.
Asia Pacific is a major player in the electronics and semiconductor industry, and vision sensors play a critical role in producing semiconductors, PCBs, and electronic components. Consequently, the Asia Pacific segment captured $1,310.5 million revenue in the market in 2022. These sensors contribute to quality assurance, inspection, and precision measurement, aligning with the high-tech manufacturing requirements of the region. The Asia Pacific region has seen rapid growth in robotics and automation, and vision sensors are integral components in robotic systems.
The major strategies followed by the market participants are Product Launches as the key developmental strategy to keep pace with the changing demands of end users. For instance, For Instance, In November, 2023, Teledyne e2v unveiled the Emerald Gen 2 CMOS image sensor line. The sensors come in 21 x 20 mm Ceramic Land Grid Array packages, and they are offered in either 8.9 MPixel or 12 MPixel resolution, available in monochrome or color, and in standard or high-speed grades. Additionally, in September, 2023, Cognex Corporation unveiled the In-Sight SnAPP sensor. The In-Sight SnAPP is crafted for simplicity and easy deployment, offering customers a straightforward entry point into machine vision technology.
Based on the Analysis presented in the KBV Cardinal matrix; Keyence Corporation is the forerunners in the Market. Companies such as Teledyne Technologies, Inc., Omron Corporation and Cognex Corporation are some of the key innovators in the Market. For Instance, In May, 2023, Cognex Corporation launched the Advantage 182 vision system, an industrial machine vision system. Through this product, the company seeks to automate intricate location, classification, and inspection tasks. The Advantage 182 vision system incorporates advanced machine vision, barcode reading, and edge learning technology to automate a wide range of tasks, spanning from basic presence/absence detection and track-and-trace applications to precise alignment and sophisticated color inspections.
Market Growth Factors
Industry 4.0 emphasizes implementing automated inspection and quality control processes to ensure high product quality and consistency. These sensors are deployed in manufacturing lines to perform real-time inspections, identify defects, and verify product specifications. These sensors play a vital role in tracking products throughout production, verifying serial numbers, and ensuring adherence to regulatory standards. Therefore, the market is expanding significantly due to the rising adoption of industry 4.0 and smart manufacturing.
Additionally, E-commerce fulfillment centers and logistics hubs deploy vision sensors for the automated sorting of packages. As per the International Trade Administration, global e-commerce sales for B2B businesses have gradually increased over the last decade, with the global B2B e-commerce industry expected to be worth USD$36 trillion by 2026. Thus, because of the rapid growth in e-commerce and logistics, the market is anticipated to increase significantly.
Market Restraining Factors
High initial costs may limit the frequency of system upgrades or expansions. Organizations may exhibit risk aversion when considering high-cost investments, particularly in economically uncertain times. The perceived financial risk associated with implementing sensor systems can result in delayed or deferred investment decisions, impacting the overall market growth.
By Sensor Type Analysis
By sensor type, the market is categorized into less than 3D, 3D, and others. In 2022, the less than 3D segment held the highest revenue share in the market. Less than 3D sensors are employed for printed text and character recognition. Optical character recognition (OCR) technology is used in applications like document processing to extract text from images. These sensors assist in reading and interpreting printed characters on documents, labels, and packaging, enhancing automation in administrative tasks.
By End User Analysis
On the basis of end user, the market is divided into automotive, electronics & semiconductor, consumer electronics, pharmaceuticals, food & packaging, and others. The electronics & semiconductor segment procured a promising growth rate in the market in 2022. These sensors play a crucial role in wafer inspection during semiconductor manufacturing. They detect defects, contaminants, and irregularities on semiconductor wafers.
By Application Analysis
Based on application, the market is classified into inspection, gauging, code reading, and others. In 2022, the inspection segment witnessed the largest revenue share in the market. These sensors are used for surface inspection in material processing industries such as steel, glass, and plastics. They can detect surface defects, irregularities, or contaminants in materials, ensuring the final products meet quality standards. Surface inspection produces high-quality materials for construction, packaging, and other applications.
By Regional Analysis
Region-wise, the market is analysed across North America, Europe, Asia Pacific, and LAMEA. In 2022, the North America region acquired a significant revenue share in the market. North America, particularly the United States, is home to a robust manufacturing sector that has embraced Industry 4.0 principles. The automotive industry in North America has extensively integrated vision sensors for applications such as advanced driver-assistance Systems (ADAS), autonomous vehicles, and manufacturing quality control.
Recent Strategies Deployed in the Market
- Feb-2024: Sick AG has signed an OEM partnership agreement with Viking Masek Robotics & Automation, a provider of innovative packaging automation solutions. Under this partnership, the companies will integrate SICK's 2D and 3D vision system components into Viking Masek Robotics & Automation's machinery to offer unique solutions to meet the needs of clients across various industries.
- Nov-2023: Teledyne e2v, a subsidiary of Teledyne Technologies, Inc., unveiled the Emerald Gen 2 CMOS image sensor line. The sensors come in 21 x 20 mm Ceramic Land Grid Array packages, and they are offered in either 8.9 MPixel or 12 MPixel resolution, available in monochrome or color, and in standard or high-speed grades. Additionally, the sensors are tailored for various machine vision applications, including inspection, sorting, pick-and-place tasks, and transportation systems.
- Nov-2023: Basler AG came into a partnership with Siemens AG, a technology company. Through this partnership, the companies aim to simplify the integration of machine vision solutions into automation systems for clients. Additionally, it will allow customers to simplify their production process, increase efficiency, lower costs, and improve quality control and transparency.
- Sep-2023: Cognex Corporation unveiled the In-Sight SnAPP vision sensor. With this product, the company has expanded its capabilities in the vision-sensing space. The In-Sight SnAPP is crafted for simplicity and easy deployment, offering customers a straightforward entry point into machine vision technology.
- Jun-2023: Sick AG unveiled the safeVisionary 2, a 3D time-of-flight (ToF) camera with Performance Level c (PL c). The product helps customers achieve full autonomy and offers 3D localization and object recognition capabilities. Additionally, this small 3D camera boosts productivity and delivers accurate 3D measurement data to improve automation processes.
List of Key Companies Profiled
- Omron Corporation
- Basler AG
- Sick AG
- Datalogic S.p.A. (Hydra S.p.A.)
- Balluff GmbH
- Teledyne Technologies, Inc. (Teledyne DALSA)
- IFM Electronics GmbH
- Keyence Corporation
- Baumer Holding AG
- Cognex Corporation
Global Vision Sensor Market Report Segmentation
By Sensor Type
- Less Than 3D
- 3D
- Others
By End User
- Automotive
- Consumer Electronics
- Electronics & Semiconductor
- Pharmaceuticals
- Food & Packaging
- Others
By Application
- Inspection
- Code Reading
- Gauging
- Others
By Geography
- North America
- US
- Canada
- Mexico
- Rest of North America
- Europe
- Germany
- UK
- France
- Russia
- Spain
- Italy
- Rest of Europe
- Asia Pacific
- China
- Japan
- India
- South Korea
- Singapore
- Malaysia
- Rest of Asia Pacific
- LAMEA
- Brazil
- Argentina
- UAE
- Saudi Arabia
- South Africa
- Nigeria
- Rest of LAMEA
Table of Contents
Chapter 1.Market Scope & Methodology
- 1.1Market Definition
- 1.2Objectives
- 1.3Market Scope
- 1.4Segmentation
- 1.4.1Global Vision Sensor Market, by Sensor Type
- 1.4.2Global Vision Sensor Market, by End User
- 1.4.3Global Vision Sensor Market, by Application
- 1.4.4Global Vision Sensor Market, by Geography
- 1.5Methodology for the research
Chapter 2.Market at a Glance
- 2.1Key Highlights
Chapter 3.Market Overview
- 3.1Introduction
- 3.1.1Overview
- 3.1.1.1Market Composition and Scenario
- 3.1.1Overview
- 3.2Key Factors Impacting the Market
- 3.2.1Market Drivers
- 3.2.2Market Restraints
- 3.2.3Market Opportunities
- 3.2.4Market Challenges
Chapter 4.Competition Analysis - Global
- 4.1KBV Cardinal Matrix
- 4.2Recent Industry Wide Strategic Developments
- 4.2.1Partnerships, Collaborations and Agreements
- 4.2.2Product Launches and Product Expansions
- 4.2.3Acquisition and Mergers
- 4.3Market Share Analysis, 2022
- 4.4Top Winning Strategies
- 4.4.1Key Leading Strategies: Percentage Distribution (2019-2024)
- 4.4.2Key Strategic Move: (Product Launches and Product Expansions: 2019, Sep - 2023, Nov) Leading Players
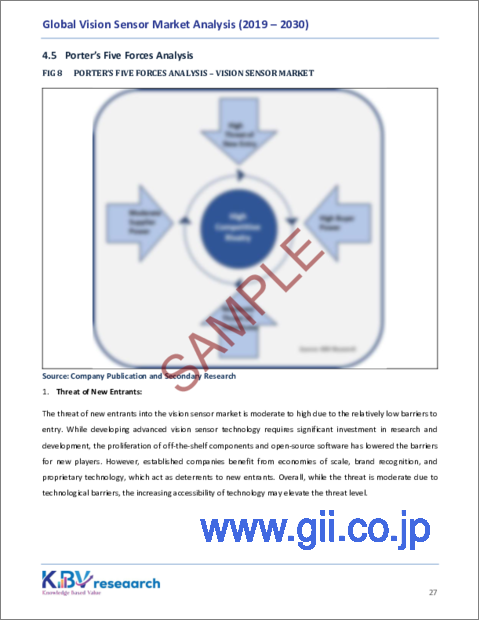
- 4.5Porter's Five Forces Analysis
Chapter 5.Global Vision Sensor Market by Sensor Type
- 5.1Global Less Than 3D Market by Region
- 5.2Global 3D Market by Region
- 5.3Global Others Market by Region
Chapter 6.Global Vision Sensor Market by End User
- 6.1Global Automotive Market by Region
- 6.2Global Consumer Electronics Market by Region
- 6.3Global Electronics & Semiconductor Market by Region
- 6.4Global Pharmaceuticals Market by Region
- 6.5Global Food & Packaging Market by Region
- 6.6Global Others Market by Region
Chapter 7.Global Vision Sensor Market by Application
- 7.1Global Inspection Market by Region
- 7.2Global Code Reading Market by Region
- 7.3Global Gauging Market by Region
- 7.4Global Others Market by Region
Chapter 8.Global Vision Sensor Market by Region
- 8.1North America Vision Sensor Market
- 8.1.1North America Vision Sensor Market by Sensor Type
- 8.1.1.1North America Less Than 3D Market by Country
- 8.1.1.2North America 3D Market by Country
- 8.1.1.3North America Others Market by Country
- 8.1.2North America Vision Sensor Market by End User
- 8.1.2.1North America Automotive Market by Country
- 8.1.2.2North America Consumer Electronics Market by Country
- 8.1.2.3North America Electronics & Semiconductor Market by Country
- 8.1.2.4North America Pharmaceuticals Market by Country
- 8.1.2.5North America Food & Packaging Market by Country
- 8.1.2.6North America Others Market by Country
- 8.1.3North America Vision Sensor Market by Application
- 8.1.3.1North America Inspection Market by Country
- 8.1.3.2North America Code Reading Market by Country
- 8.1.3.3North America Gauging Market by Country
- 8.1.3.4North America Others Market by Country
- 8.1.4North America Vision Sensor Market by Country
- 8.1.4.1US Vision Sensor Market
- 8.1.4.1.1US Vision Sensor Market by Sensor Type
- 8.1.4.1.2US Vision Sensor Market by End User
- 8.1.4.1.3US Vision Sensor Market by Application
- 8.1.4.2Canada Vision Sensor Market
- 8.1.4.2.1Canada Vision Sensor Market by Sensor Type
- 8.1.4.2.2Canada Vision Sensor Market by End User
- 8.1.4.2.3Canada Vision Sensor Market by Application
- 8.1.4.3Mexico Vision Sensor Market
- 8.1.4.3.1Mexico Vision Sensor Market by Sensor Type
- 8.1.4.3.2Mexico Vision Sensor Market by End User
- 8.1.4.3.3Mexico Vision Sensor Market by Application
- 8.1.4.4Rest of North America Vision Sensor Market
- 8.1.4.4.1Rest of North America Vision Sensor Market by Sensor Type
- 8.1.4.4.2Rest of North America Vision Sensor Market by End User
- 8.1.4.4.3Rest of North America Vision Sensor Market by Application
- 8.1.4.1US Vision Sensor Market
- 8.1.1North America Vision Sensor Market by Sensor Type
- 8.2Europe Vision Sensor Market
- 8.2.1Europe Vision Sensor Market by Sensor Type
- 8.2.1.1Europe Less Than 3D Market by Country
- 8.2.1.2Europe 3D Market by Country
- 8.2.1.3Europe Others Market by Country
- 8.2.2Europe Vision Sensor Market by End User
- 8.2.2.1Europe Automotive Market by Country
- 8.2.2.2Europe Consumer Electronics Market by Country
- 8.2.2.3Europe Electronics & Semiconductor Market by Country
- 8.2.2.4Europe Pharmaceuticals Market by Country
- 8.2.2.5Europe Food & Packaging Market by Country
- 8.2.2.6Europe Others Market by Country
- 8.2.3Europe Vision Sensor Market by Application
- 8.2.3.1Europe Inspection Market by Country
- 8.2.3.2Europe Code Reading Market by Country
- 8.2.3.3Europe Gauging Market by Country
- 8.2.3.4Europe Others Market by Country
- 8.2.4Europe Vision Sensor Market by Country
- 8.2.4.1Germany Vision Sensor Market
- 8.2.4.1.1Germany Vision Sensor Market by Sensor Type
- 8.2.4.1.2Germany Vision Sensor Market by End User
- 8.2.4.1.3Germany Vision Sensor Market by Application
- 8.2.4.2UK Vision Sensor Market
- 8.2.4.2.1UK Vision Sensor Market by Sensor Type
- 8.2.4.2.2UK Vision Sensor Market by End User
- 8.2.4.2.3UK Vision Sensor Market by Application
- 8.2.4.3France Vision Sensor Market
- 8.2.4.3.1France Vision Sensor Market by Sensor Type
- 8.2.4.3.2France Vision Sensor Market by End User
- 8.2.4.3.3France Vision Sensor Market by Application
- 8.2.4.4Russia Vision Sensor Market
- 8.2.4.4.1Russia Vision Sensor Market by Sensor Type
- 8.2.4.4.2Russia Vision Sensor Market by End User
- 8.2.4.4.3Russia Vision Sensor Market by Application
- 8.2.4.5Spain Vision Sensor Market
- 8.2.4.5.1Spain Vision Sensor Market by Sensor Type
- 8.2.4.5.2Spain Vision Sensor Market by End User
- 8.2.4.5.3Spain Vision Sensor Market by Application
- 8.2.4.6Italy Vision Sensor Market
- 8.2.4.6.1Italy Vision Sensor Market by Sensor Type
- 8.2.4.6.2Italy Vision Sensor Market by End User
- 8.2.4.6.3Italy Vision Sensor Market by Application
- 8.2.4.7Rest of Europe Vision Sensor Market
- 8.2.4.7.1Rest of Europe Vision Sensor Market by Sensor Type
- 8.2.4.7.2Rest of Europe Vision Sensor Market by End User
- 8.2.4.7.3Rest of Europe Vision Sensor Market by Application
- 8.2.4.1Germany Vision Sensor Market
- 8.2.1Europe Vision Sensor Market by Sensor Type
- 8.3Asia Pacific Vision Sensor Market
- 8.3.1Asia Pacific Vision Sensor Market by Sensor Type
- 8.3.1.1Asia Pacific Less Than 3D Market by Country
- 8.3.1.2Asia Pacific 3D Market by Country
- 8.3.1.3Asia Pacific Others Market by Country
- 8.3.2Asia Pacific Vision Sensor Market by End User
- 8.3.2.1Asia Pacific Automotive Market by Country
- 8.3.2.2Asia Pacific Consumer Electronics Market by Country
- 8.3.2.3Asia Pacific Electronics & Semiconductor Market by Country
- 8.3.2.4Asia Pacific Pharmaceuticals Market by Country
- 8.3.2.5Asia Pacific Food & Packaging Market by Country
- 8.3.2.6Asia Pacific Others Market by Country
- 8.3.3Asia Pacific Vision Sensor Market by Application
- 8.3.3.1Asia Pacific Inspection Market by Country
- 8.3.3.2Asia Pacific Code Reading Market by Country
- 8.3.3.3Asia Pacific Gauging Market by Country
- 8.3.3.4Asia Pacific Others Market by Country
- 8.3.4Asia Pacific Vision Sensor Market by Country
- 8.3.4.1China Vision Sensor Market
- 8.3.4.1.1China Vision Sensor Market by Sensor Type
- 8.3.4.1.2China Vision Sensor Market by End User
- 8.3.4.1.3China Vision Sensor Market by Application
- 8.3.4.2Japan Vision Sensor Market
- 8.3.4.2.1Japan Vision Sensor Market by Sensor Type
- 8.3.4.2.2Japan Vision Sensor Market by End User
- 8.3.4.2.3Japan Vision Sensor Market by Application
- 8.3.4.3India Vision Sensor Market
- 8.3.4.3.1India Vision Sensor Market by Sensor Type
- 8.3.4.3.2India Vision Sensor Market by End User
- 8.3.4.3.3India Vision Sensor Market by Application
- 8.3.4.4South Korea Vision Sensor Market
- 8.3.4.4.1South Korea Vision Sensor Market by Sensor Type
- 8.3.4.4.2South Korea Vision Sensor Market by End User
- 8.3.4.4.3South Korea Vision Sensor Market by Application
- 8.3.4.5Singapore Vision Sensor Market
- 8.3.4.5.1Singapore Vision Sensor Market by Sensor Type
- 8.3.4.5.2Singapore Vision Sensor Market by End User
- 8.3.4.5.3Singapore Vision Sensor Market by Application
- 8.3.4.6Malaysia Vision Sensor Market
- 8.3.4.6.1Malaysia Vision Sensor Market by Sensor Type
- 8.3.4.6.2Malaysia Vision Sensor Market by End User
- 8.3.4.6.3Malaysia Vision Sensor Market by Application
- 8.3.4.7Rest of Asia Pacific Vision Sensor Market
- 8.3.4.7.1Rest of Asia Pacific Vision Sensor Market by Sensor Type
- 8.3.4.7.2Rest of Asia Pacific Vision Sensor Market by End User
- 8.3.4.7.3Rest of Asia Pacific Vision Sensor Market by Application
- 8.3.4.1China Vision Sensor Market
- 8.3.1Asia Pacific Vision Sensor Market by Sensor Type
- 8.4LAMEA Vision Sensor Market
- 8.4.1LAMEA Vision Sensor Market by Sensor Type
- 8.4.1.1LAMEA Less Than 3D Market by Country
- 8.4.1.2LAMEA 3D Market by Country
- 8.4.1.3LAMEA Others Market by Country
- 8.4.2LAMEA Vision Sensor Market by End User
- 8.4.2.1LAMEA Automotive Market by Country
- 8.4.2.2LAMEA Consumer Electronics Market by Country
- 8.4.2.3LAMEA Electronics & Semiconductor Market by Country
- 8.4.2.4LAMEA Pharmaceuticals Market by Country
- 8.4.2.5LAMEA Food & Packaging Market by Country
- 8.4.2.6LAMEA Others Market by Country
- 8.4.3LAMEA Vision Sensor Market by Application
- 8.4.3.1LAMEA Inspection Market by Country
- 8.4.3.2LAMEA Code Reading Market by Country
- 8.4.3.3LAMEA Gauging Market by Country
- 8.4.3.4LAMEA Others Market by Country
- 8.4.4LAMEA Vision Sensor Market by Country
- 8.4.4.1Brazil Vision Sensor Market
- 8.4.4.1.1Brazil Vision Sensor Market by Sensor Type
- 8.4.4.1.2Brazil Vision Sensor Market by End User
- 8.4.4.1.3Brazil Vision Sensor Market by Application
- 8.4.4.2Argentina Vision Sensor Market
- 8.4.4.2.1Argentina Vision Sensor Market by Sensor Type
- 8.4.4.2.2Argentina Vision Sensor Market by End User
- 8.4.4.2.3Argentina Vision Sensor Market by Application
- 8.4.4.3UAE Vision Sensor Market
- 8.4.4.3.1UAE Vision Sensor Market by Sensor Type
- 8.4.4.3.2UAE Vision Sensor Market by End User
- 8.4.4.3.3UAE Vision Sensor Market by Application
- 8.4.4.4Saudi Arabia Vision Sensor Market
- 8.4.4.4.1Saudi Arabia Vision Sensor Market by Sensor Type
- 8.4.4.4.2Saudi Arabia Vision Sensor Market by End User
- 8.4.4.4.3Saudi Arabia Vision Sensor Market by Application
- 8.4.4.5South Africa Vision Sensor Market
- 8.4.4.5.1South Africa Vision Sensor Market by Sensor Type
- 8.4.4.5.2South Africa Vision Sensor Market by End User
- 8.4.4.5.3South Africa Vision Sensor Market by Application
- 8.4.4.6Nigeria Vision Sensor Market
- 8.4.4.6.1Nigeria Vision Sensor Market by Sensor Type
- 8.4.4.6.2Nigeria Vision Sensor Market by End User
- 8.4.4.6.3Nigeria Vision Sensor Market by Application
- 8.4.4.7Rest of LAMEA Vision Sensor Market
- 8.4.4.7.1Rest of LAMEA Vision Sensor Market by Sensor Type
- 8.4.4.7.2Rest of LAMEA Vision Sensor Market by End User
- 8.4.4.7.3Rest of LAMEA Vision Sensor Market by Application
- 8.4.4.1Brazil Vision Sensor Market
- 8.4.1LAMEA Vision Sensor Market by Sensor Type
Chapter 9.Company Profiles
- 9.1Omron Corporation
- 9.1.1Company Overview
- 9.1.2Financial Analysis
- 9.1.3Segmental and Regional Analysis
- 9.1.4Research & Development Expenses
- 9.1.5Recent strategies and developments:
- 9.1.5.1Product Launches and Product Expansions:
- 9.1.6SWOT Analysis
- 9.2Basler AG
- 9.2.1Company Overview
- 9.2.2Financial Analysis
- 9.2.3Regional Analysis
- 9.2.4Research & Development Expense
- 9.2.5Recent strategies and developments:
- 9.2.5.1Partnerships, Collaborations, and Agreements:
- 9.2.6SWOT Analysis
- 9.3Sick AG
- 9.3.1Company Overview
- 9.3.2Financial Analysis
- 9.3.3Segmental and Regional Analysis
- 9.3.4Research & Development Expense
- 9.3.5Recent strategies and developments:
- 9.3.5.1Partnerships, Collaborations, and Agreements:
- 9.3.5.2Product Launches and Product Expansions:
- 9.3.6SWOT Analysis
- 9.4Datalogic S.p.A. (Hydra S.p.A.)
- 9.4.1Company Overview
- 9.4.2Financial Analysis
- 9.4.3Regional & Segmental Analysis
- 9.4.4Research & Development Expenses
- 9.4.5Recent strategies and developments:
- 9.4.5.1Partnerships, Collaborations, and Agreements:
- 9.4.5.2Product Launches and Product Expansions:
- 9.4.5.3Acquisition and Mergers:
- 9.4.6SWOT Analysis
- 9.5Balluff GmbH
- 9.5.1Company Overview
- 9.5.2SWOT Analysis
- 9.6Teledyne Technologies, Inc. (Teledyne DALSA)
- 9.6.1Company Overview
- 9.6.2Financial Analysis
- 9.6.3Segmental and Regional Analysis
- 9.6.4Recent strategies and developments:
- 9.6.4.1Product Launches and Product Expansions:
- 9.6.4.2Acquisition and Mergers:
- 9.6.5SWOT Analysis
- 9.7IFM Electronics GmbH
- 9.7.1Company Overview
- 9.7.2SWOT Analysis
- 9.8Keyence Corporation
- 9.8.1Company Overview
- 9.8.2Financial Analysis
- 9.8.3Regional Analysis
- 9.8.4Research & Development Expenses
- 9.8.5Recent strategies and developments:
- 9.8.5.1Product Launches and Product Expansions:
- 9.8.6SWOT Analysis
- 9.9Baumer Holding AG
- 9.9.1Company Overview
- 9.9.2SWOT Analysis
- 9.10.Cognex Corporation
- 9.10.1Company Overview
- 9.10.2Financial Analysis
- 9.10.3Regional Analysis
- 9.10.4Research & Development Expense
- 9.10.5Recent strategies and developments:
- 9.10.5.1Product Launches and Product Expansions:
- 9.10.6SWOT Analysis

