|
|
市場調査レポート
商品コード
1401103
光電センサの世界市場規模、シェア、産業動向分析レポート:技術別、用途別、地域別展望と予測、2023年~2030年Global Photoelectric Sensors Market Size, Share & Industry Trends Analysis Report By Technology, By Application (Automotive, Electronics & Semiconductor, Packaging, Military & Aerospace, and Others), By Regional Outlook and Forecast, 2023 - 2030 |
||||||
|
|
|||||||
|
|||||||

| 光電センサの世界市場規模、シェア、産業動向分析レポート:技術別、用途別、地域別展望と予測、2023年~2030年 |
|
出版日: 2023年12月21日
発行: KBV Research
ページ情報: 英文 304 Pages
納期: 即納可能
|

全表示
- 概要
- 図表
- 目次
光電センサ市場規模は、予測期間中にCAGR 6.3%で成長し、2030年には28億米ドルに達すると予測されます。2022年の市場規模は3,749万5,100ユニットで、6.2%の成長を遂げています(2019-2022年)。
KBV Cardinalのマトリックスに示された分析によると、Schneider Electric SE、Eaton Corporation PLC、Keyence Corporation、Panasonic Holdings Corporationが光電センサ市場の先行者です。2021年2月、Keyence CorporationはStayLinked Corporationとパートナーシップを結び、このパートナーシップの下、StayLinkedのSmartTEソフトウェアがKeyenceの最新のモバイルコンピュータと頑丈なスマートデバイス、BT-A700に組み込まれました。
Rockwell Automation, Inc.、Omron Corporation、Sick AGなどの企業が、光電センサ市場の主要なイノベーターです。
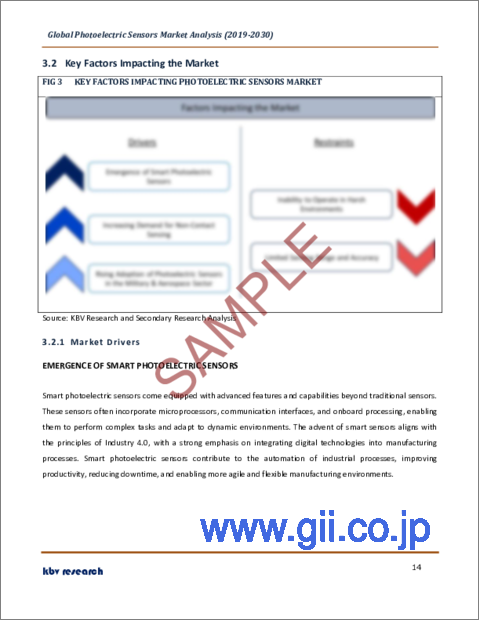
市場成長要因
スマート光電センサの出現
スマート光電センサは、従来のセンサを超える高度な機能と性能を備えています。これらのセンサは多くの場合、マイクロプロセッサ、通信インターフェース、オンボード処理を組み込んでおり、複雑なタスクの実行や動的環境への適応を可能にしています。スマートセンサの登場は、製造プロセスへのデジタル技術の統合を強く強調するインダストリー4.0の原則に沿ったものです。スマート光電センサは産業プロセスの自動化に貢献し、生産性を向上させ、ダウンタイムを削減し、より機敏で柔軟な製造環境を可能にします。この統合により、センサーの入力に基づく物体認識、パターン分析、意思決定などの高度な機能性が可能になります。AIで強化されたセンサーは、オートメーションとインテリジェント・システムの新たな可能性を開く。このように、スマート光電センサーの出現は市場にプラスの影響を与えています。
非接触センシングの需要増加
非接触センシングは、センサーと物体間の物理的接触の必要性を排除します。産業環境では、これは機器と人員の安全を確保するために極めて重要です。直接接触することなく物体を検出するセンサーの能力は、安全基準の強化に貢献し、製造環境での採用拡大につながります。デリケートなマテリアルを扱うことが多い産業では、これらのセンサによる非接触センシングがマテリアルの損傷を防ぎます。これは、電子機器製造のようなアプリケーションでは特に重要であり、部品の正確で穏やかな取り扱いは、欠陥を避けるために不可欠です。このセンサーは、透明な物体の検出から不規則な形状の識別まで、産業界のさまざまな用途に適しています。非接触センシングの需要の増加により、市場の拡大が見込まれています。
市場抑制要因
過酷な環境での動作が不可能
製造工場や施設では、粉塵、湿気、振動、極端な温度などの過酷な産業環境が一般的です。このような条件下でこれらのセンサーが効果的に動作できないことが、重要な産業用アプリケーションでの採用を制限しています。産業オートメーションと制御システムは、正確で信頼性の高い動作のためにセンサーに大きく依存しています。過酷な環境で動作できないことは、製造プロセスを混乱させ、非効率、生産遅延、潜在的な品質問題につながります。過酷な環境は建設や採掘作業で一般的で、センサーはほこりやがれき、険しい地形にさらされます。これらの条件に耐えることができないため、これらの産業における光電センサの適用性は制限されます。このような条件に耐えられない光電センサは、交通監視や車両検出などのアプリケーションで制限に直面する可能性があります。上記の要因により、市場は今後数年で減少すると予想されます。
技術展望
技術別に見ると、市場は回帰反射型、拡散型、スルービーム型に区分されます。拡散型セグメントは、2022年の市場でかなりの収益シェアを獲得しました。拡散型センサは、製造、包装、物流など様々な産業で応用されています。その汎用性と使いやすさから、多くのオートメーション・シナリオで選ばれています。拡散型センサは、コンパクトで場所を取らない設計が特徴であることが多いです。そのため、使用可能なスペースが限られている場合や、目立たず目立たないセンサーソリューションが好まれる場合に適しています。拡散型センサーの統合設計により、必要なコンポーネントが削減され、コスト効率の高いソリューションとなります。リフレクターやレシーバーユニットを別途用意する必要がないため、機器と設置の両方で全体的なコスト削減に貢献します。
用途の展望
用途別に見ると、市場は自動車、パッケージング、電子・半導体、軍事・航空宇宙、その他に細分化されます。2022年の市場では、電子・半導体分野が突出した成長率を予測しています。これらのセンサーは、コンベアシステムに沿って移動する半導体ウエハーを正確に検出します。これらのセンサーは、半導体製造工程の様々な段階で正確な位置決めと移動制御を保証します。半導体製造において、これらのセンサーはリードフレームの位置とアライメントを検出します。これは、パッケージング中に半導体チップがリードフレームに正確に取り付けられ、接着されることを保証するために極めて重要です。
地域別展望
地域別に見ると、市場は北米、欧州、アジア太平洋、LAMEAで分析されます。2022年には、アジア太平洋地域が市場で最も高い収益シェアを記録しました。日本、中国、インドなどの発展途上国における安全規制の拡大や、産業施設におけるIIoTの導入は、すべてこの地域における光電センサ生産の拡大に寄与しています。家電、自動車、繊維、工業などのエンドユーザー分野の急速な拡大は、センサによって収集されたデータを即座に集計し、製造プロセスの効率を高めるために実装することができるため、市場の成長を大幅に促進しています。
光電センサ市場で展開されている最近の戦略
パートナーシップ、コラボレーション、契約:
製品発表と製品拡張:
買収と合併
目次
第1章 市場範囲と調査手法
- 市場の定義
- 目的
- 市場範囲
- セグメンテーション
- 調査手法
第2章 市場要覧
- 主なハイライト
第3章 市場概要
- イントロダクション
- 概要
- 市場構成とシナリオ
- 概要
- 市場に影響を与える主な要因
- 市場促進要因
- 市場抑制要因
第4章 競合分析- 世界
- KBV Cardinal Matrix
- 最近の業界全体の戦略的展開
- パートナーシップ、コラボレーション、および契約
- 製品の発売と製品の拡大
- 買収と合併
- 主要成功戦略
- 主な戦略
- 主要な戦略的動き
- ポーターのファイブフォース分析
第5章 世界市場:技術別
- 世界の再帰反射市場:地域別
- 世界の拡散市場:地域別
- 世界の透過ビーム市場:地域別
第6章 世界市場:用途別
- 世界の自動車市場:地域別
- 世界のエレクトロニクスおよび半導体市場:地域別
- 世界の包装市場:地域別
- 世界の軍事および航空宇宙市場:地域別
- 世界のその他の市場:地域別
第7章 世界市場:地域別
- 北米
- 北米の市場:国別
- 米国
- カナダ
- メキシコ
- その他北米地域
- 北米の市場:国別
- 欧州
- 欧州の市場:国別
- ドイツ
- 英国
- フランス
- ロシア
- スペイン
- イタリア
- その他欧州地域
- 欧州の市場:国別
- アジア太平洋
- アジア太平洋の市場:国別
- 中国
- 日本
- インド
- 韓国
- 台湾
- マレーシア
- その他アジア太平洋地域
- アジア太平洋の市場:国別
- ラテンアメリカ・中東・アフリカ
- ラテンアメリカ・中東・アフリカの市場:国別
- ブラジル
- アルゼンチン
- アラブ首長国連邦
- サウジアラビア
- 南アフリカ
- ナイジェリア
- その他ラテンアメリカ・中東・アフリカ地域
- ラテンアメリカ・中東・アフリカの市場:国別
第8章 企業プロファイル
- Omron Corporation
- Panasonic Holdings Corporation
- Rockwell Automation, Inc
- Eaton Corporation PLC
- Keyence Corporation
- Schneider Electric SE
- Autonics Corporation
- Sick AG
- Balluff GmbH
- IFM Electronics GmbH
第9章 市場の成功必須条件
LIST OF TABLES
- TABLE 1 Global Photoelectric Sensors Market, 2019 - 2022, USD Million
- TABLE 2 Global Photoelectric Sensors Market, 2023 - 2030, USD Million
- TABLE 3 Global Photoelectric Sensors Market, 2019 - 2022, Thousand Units
- TABLE 4 Global Photoelectric Sensors Market, 2023 - 2030, Thousand Units
- TABLE 5 Partnerships, Collaborations and Agreements- Photoelectric Sensors Market
- TABLE 6 Product Launches And Product Expansions- Photoelectric Sensors Market
- TABLE 7 Acquisition and Mergers- Photoelectric Sensors Market
- TABLE 8 Global Photoelectric Sensors Market by Technology, 2019 - 2022, USD Million
- TABLE 9 Global Photoelectric Sensors Market by Technology, 2023 - 2030, USD Million
- TABLE 10 Global Photoelectric Sensors Market by Technology, 2019 - 2022, Thousand Units
- TABLE 11 Global Photoelectric Sensors Market by Technology, 2023 - 2030, Thousand Units
- TABLE 12 Global Retro-reflective Market by Region, 2019 - 2022, USD Million
- TABLE 13 Global Retro-reflective Market by Region, 2023 - 2030, USD Million
- TABLE 14 Global Retro-reflective Market by Region, 2019 - 2022, Thousand Units
- TABLE 15 Global Retro-reflective Market by Region, 2023 - 2030, Thousand Units
- TABLE 16 Global Diffused Market by Region, 2019 - 2022, USD Million
- TABLE 17 Global Diffused Market by Region, 2023 - 2030, USD Million
- TABLE 18 Global Diffused Market by Region, 2019 - 2022, Thousand Units
- TABLE 19 Global Diffused Market by Region, 2023 - 2030, Thousand Units
- TABLE 20 Global Thru-beam Market by Region, 2019 - 2022, USD Million
- TABLE 21 Global Thru-beam Market by Region, 2023 - 2030, USD Million
- TABLE 22 Global Thru-beam Market by Region, 2019 - 2022, Thousand Units
- TABLE 23 Global Thru-beam Market by Region, 2023 - 2030, Thousand Units
- TABLE 24 Global Photoelectric Sensors Market by Application, 2019 - 2022, USD Million
- TABLE 25 Global Photoelectric Sensors Market by Application, 2023 - 2030, USD Million
- TABLE 26 Global Photoelectric Sensors Market by Application, 2019 - 2022, Thousand Units
- TABLE 27 Global Photoelectric Sensors Market by Application, 2023 - 2030, Thousand Units
- TABLE 28 Global Automotive Market by Region, 2019 - 2022, USD Million
- TABLE 29 Global Automotive Market by Region, 2023 - 2030, USD Million
- TABLE 30 Global Automotive Market by Region, 2019 - 2022, Thousand Units
- TABLE 31 Global Automotive Market by Region, 2023 - 2030, Thousand Units
- TABLE 32 Global Electronics & Semiconductor Market by Region, 2019 - 2022, USD Million
- TABLE 33 Global Electronics & Semiconductor Market by Region, 2023 - 2030, USD Million
- TABLE 34 Global Electronics & Semiconductor Market by Region, 2019 - 2022, Thousand Units
- TABLE 35 Global Electronics & Semiconductor Market by Region, 2023 - 2030, Thousand Units
- TABLE 36 Global Packaging Market by Region, 2019 - 2022, USD Million
- TABLE 37 Global Packaging Market by Region, 2023 - 2030, USD Million
- TABLE 38 Global Packaging Market by Region, 2019 - 2022, Thousand Units
- TABLE 39 Global Packaging Market by Region, 2023 - 2030, Thousand Units
- TABLE 40 Global Military & Aerospace Market by Region, 2019 - 2022, USD Million
- TABLE 41 Global Military & Aerospace Market by Region, 2023 - 2030, USD Million
- TABLE 42 Global Military & Aerospace Market by Region, 2019 - 2022, Thousand Units
- TABLE 43 Global Military & Aerospace Market by Region, 2023 - 2030, Thousand Units
- TABLE 44 Global Others Market by Region, 2019 - 2022, USD Million
- TABLE 45 Global Others Market by Region, 2023 - 2030, USD Million
- TABLE 46 Global Others Market by Region, 2019 - 2022, Thousand Units
- TABLE 47 Global Others Market by Region, 2023 - 2030, Thousand Units
- TABLE 48 Global Photoelectric Sensors Market by Region, 2019 - 2022, USD Million
- TABLE 49 Global Photoelectric Sensors Market by Region, 2023 - 2030, USD Million
- TABLE 50 Global Photoelectric Sensors Market by Region, 2019 - 2022, Thousand Units
- TABLE 51 Global Photoelectric Sensors Market by Region, 2023 - 2030, Thousand Units
- TABLE 52 North America Photoelectric Sensors Market, 2019 - 2022, USD Million
- TABLE 53 North America Photoelectric Sensors Market, 2023 - 2030, USD Million
- TABLE 54 North America Photoelectric Sensors Market, 2019 - 2022, Thousand Units
- TABLE 55 North America Photoelectric Sensors Market, 2023 - 2030, Thousand Units
- TABLE 56 North America Photoelectric Sensors Market by Technology, 2019 - 2022, USD Million
- TABLE 57 North America Photoelectric Sensors Market by Technology, 2023 - 2030, USD Million
- TABLE 58 North America Photoelectric Sensors Market by Technology, 2019 - 2022, Thousand Units
- TABLE 59 North America Photoelectric Sensors Market by Technology, 2023 - 2030, Thousand Units
- TABLE 60 North America Retro-reflective Market by Country, 2019 - 2022, USD Million
- TABLE 61 North America Retro-reflective Market by Country, 2023 - 2030, USD Million
- TABLE 62 North America Retro-reflective Market by Country, 2019 - 2022, Thousand Units
- TABLE 63 North America Retro-reflective Market by Country, 2023 - 2030, Thousand Units
- TABLE 64 North America Diffused Market by Country, 2019 - 2022, USD Million
- TABLE 65 North America Diffused Market by Country, 2023 - 2030, USD Million
- TABLE 66 North America Diffused Market by Country, 2019 - 2022, Thousand Units
- TABLE 67 North America Diffused Market by Country, 2023 - 2030, Thousand Units
- TABLE 68 North America Thru-beam Market by Country, 2019 - 2022, USD Million
- TABLE 69 North America Thru-beam Market by Country, 2023 - 2030, USD Million
- TABLE 70 North America Thru-beam Market by Country, 2019 - 2022, Thousand Units
- TABLE 71 North America Thru-beam Market by Country, 2023 - 2030, Thousand Units
- TABLE 72 North America Photoelectric Sensors Market by Application, 2019 - 2022, USD Million
- TABLE 73 North America Photoelectric Sensors Market by Application, 2023 - 2030, USD Million
- TABLE 74 North America Photoelectric Sensors Market by Application, 2019 - 2022, Thousand Units
- TABLE 75 North America Photoelectric Sensors Market by Application, 2023 - 2030, Thousand Units
- TABLE 76 North America Automotive Market by Country, 2019 - 2022, USD Million
- TABLE 77 North America Automotive Market by Country, 2023 - 2030, USD Million
- TABLE 78 North America Automotive Market by Country, 2019 - 2022, Thousand Units
- TABLE 79 North America Automotive Market by Country, 2023 - 2030, Thousand Units
- TABLE 80 North America Electronics & Semiconductor Market by Country, 2019 - 2022, USD Million
- TABLE 81 North America Electronics & Semiconductor Market by Country, 2023 - 2030, USD Million
- TABLE 82 North America Electronics & Semiconductor Market by Country, 2019 - 2022, Thousand Units
- TABLE 83 North America Electronics & Semiconductor Market by Country, 2023 - 2030, Thousand Units
- TABLE 84 North America Packaging Market by Country, 2019 - 2022, USD Million
- TABLE 85 North America Packaging Market by Country, 2023 - 2030, USD Million
- TABLE 86 North America Packaging Market by Country, 2019 - 2022, Thousand Units
- TABLE 87 North America Packaging Market by Country, 2023 - 2030, Thousand Units
- TABLE 88 North America Military & Aerospace Market by Country, 2019 - 2022, USD Million
- TABLE 89 North America Military & Aerospace Market by Country, 2023 - 2030, USD Million
- TABLE 90 North America Military & Aerospace Market by Country, 2019 - 2022, Thousand Units
- TABLE 91 North America Military & Aerospace Market by Country, 2023 - 2030, Thousand Units
- TABLE 92 North America Others Market by Country, 2019 - 2022, USD Million
- TABLE 93 North America Others Market by Country, 2023 - 2030, USD Million
- TABLE 94 North America Others Market by Country, 2019 - 2022, Thousand Units
- TABLE 95 North America Others Market by Country, 2023 - 2030, Thousand Units
- TABLE 96 North America Photoelectric Sensors Market by Country, 2019 - 2022, USD Million
- TABLE 97 North America Photoelectric Sensors Market by Country, 2023 - 2030, USD Million
- TABLE 98 North America Photoelectric Sensors Market by Country, 2019 - 2022, Thousand Units
- TABLE 99 North America Photoelectric Sensors Market by Country, 2023 - 2030, Thousand Units
- TABLE 100 US Photoelectric Sensors Market, 2019 - 2022, USD Million
- TABLE 101 US Photoelectric Sensors Market, 2023 - 2030, USD Million
- TABLE 102 US Photoelectric Sensors Market, 2019 - 2022, Thousand Units
- TABLE 103 US Photoelectric Sensors Market, 2023 - 2030, Thousand Units
- TABLE 104 US Photoelectric Sensors Market by Technology, 2019 - 2022, USD Million
- TABLE 105 US Photoelectric Sensors Market by Technology, 2023 - 2030, USD Million
- TABLE 106 US Photoelectric Sensors Market by Technology, 2019 - 2022, Thousand Units
- TABLE 107 US Photoelectric Sensors Market by Technology, 2023 - 2030, Thousand Units
- TABLE 108 US Photoelectric Sensors Market by Application, 2019 - 2022, USD Million
- TABLE 109 US Photoelectric Sensors Market by Application, 2023 - 2030, USD Million
- TABLE 110 US Photoelectric Sensors Market by Application, 2019 - 2022, Thousand Units
- TABLE 111 US Photoelectric Sensors Market by Application, 2023 - 2030, Thousand Units
- TABLE 112 Canada Photoelectric Sensors Market, 2019 - 2022, USD Million
- TABLE 113 Canada Photoelectric Sensors Market, 2023 - 2030, USD Million
- TABLE 114 Canada Photoelectric Sensors Market, 2019 - 2022, Thousand Units
- TABLE 115 Canada Photoelectric Sensors Market, 2023 - 2030, Thousand Units
- TABLE 116 Canada Photoelectric Sensors Market by Technology, 2019 - 2022, USD Million
- TABLE 117 Canada Photoelectric Sensors Market by Technology, 2023 - 2030, USD Million
- TABLE 118 Canada Photoelectric Sensors Market by Technology, 2019 - 2022, Thousand Units
- TABLE 119 Canada Photoelectric Sensors Market by Technology, 2023 - 2030, Thousand Units
- TABLE 120 Canada Photoelectric Sensors Market by Application, 2019 - 2022, USD Million
- TABLE 121 Canada Photoelectric Sensors Market by Application, 2023 - 2030, USD Million
- TABLE 122 Canada Photoelectric Sensors Market by Application, 2019 - 2022, Thousand Units
- TABLE 123 Canada Photoelectric Sensors Market by Application, 2023 - 2030, Thousand Units
- TABLE 124 Mexico Photoelectric Sensors Market, 2019 - 2022, USD Million
- TABLE 125 Mexico Photoelectric Sensors Market, 2023 - 2030, USD Million
- TABLE 126 Mexico Photoelectric Sensors Market, 2019 - 2022, Thousand Units
- TABLE 127 Mexico Photoelectric Sensors Market, 2023 - 2030, Thousand Units
- TABLE 128 Mexico Photoelectric Sensors Market by Technology, 2019 - 2022, USD Million
- TABLE 129 Mexico Photoelectric Sensors Market by Technology, 2023 - 2030, USD Million
- TABLE 130 Mexico Photoelectric Sensors Market by Technology, 2019 - 2022, Thousand Units
- TABLE 131 Mexico Photoelectric Sensors Market by Technology, 2023 - 2030, Thousand Units
- TABLE 132 Mexico Photoelectric Sensors Market by Application, 2019 - 2022, USD Million
- TABLE 133 Mexico Photoelectric Sensors Market by Application, 2023 - 2030, USD Million
- TABLE 134 Mexico Photoelectric Sensors Market by Application, 2019 - 2022, Thousand Units
- TABLE 135 Mexico Photoelectric Sensors Market by Application, 2023 - 2030, Thousand Units
- TABLE 136 Rest of North America Photoelectric Sensors Market, 2019 - 2022, USD Million
- TABLE 137 Rest of North America Photoelectric Sensors Market, 2023 - 2030, USD Million
- TABLE 138 Rest of North America Photoelectric Sensors Market, 2019 - 2022, Thousand Units
- TABLE 139 Rest of North America Photoelectric Sensors Market, 2023 - 2030, Thousand Units
- TABLE 140 Rest of North America Photoelectric Sensors Market by Technology, 2019 - 2022, USD Million
- TABLE 141 Rest of North America Photoelectric Sensors Market by Technology, 2023 - 2030, USD Million
- TABLE 142 Rest of North America Photoelectric Sensors Market by Technology, 2019 - 2022, Thousand Units
- TABLE 143 Rest of North America Photoelectric Sensors Market by Technology, 2023 - 2030, Thousand Units
- TABLE 144 Rest of North America Photoelectric Sensors Market by Application, 2019 - 2022, USD Million
- TABLE 145 Rest of North America Photoelectric Sensors Market by Application, 2023 - 2030, USD Million
- TABLE 146 Rest of North America Photoelectric Sensors Market by Application, 2019 - 2022, Thousand Units
- TABLE 147 Rest of North America Photoelectric Sensors Market by Application, 2023 - 2030, Thousand Units
- TABLE 148 Europe Photoelectric Sensors Market, 2019 - 2022, USD Million
- TABLE 149 Europe Photoelectric Sensors Market, 2023 - 2030, USD Million
- TABLE 150 Europe Photoelectric Sensors Market, 2019 - 2022, Thousand Units
- TABLE 151 Europe Photoelectric Sensors Market, 2023 - 2030, Thousand Units
- TABLE 152 Europe Photoelectric Sensors Market by Technology, 2019 - 2022, USD Million
- TABLE 153 Europe Photoelectric Sensors Market by Technology, 2023 - 2030, USD Million
- TABLE 154 Europe Photoelectric Sensors Market by Technology, 2019 - 2022, Thousand Units
- TABLE 155 Europe Photoelectric Sensors Market by Technology, 2023 - 2030, Thousand Units
- TABLE 156 Europe Retro-reflective Market by Country, 2019 - 2022, USD Million
- TABLE 157 Europe Retro-reflective Market by Country, 2023 - 2030, USD Million
- TABLE 158 Europe Retro-reflective Market by Country, 2019 - 2022, Thousand Units
- TABLE 159 Europe Retro-reflective Market by Country, 2023 - 2030, Thousand Units
- TABLE 160 Europe Diffused Market by Country, 2019 - 2022, USD Million
- TABLE 161 Europe Diffused Market by Country, 2023 - 2030, USD Million
- TABLE 162 Europe Diffused Market by Country, 2019 - 2022, Thousand Units
- TABLE 163 Europe Diffused Market by Country, 2023 - 2030, Thousand Units
- TABLE 164 Europe Thru-beam Market by Country, 2019 - 2022, USD Million
- TABLE 165 Europe Thru-beam Market by Country, 2023 - 2030, USD Million
- TABLE 166 Europe Thru-beam Market by Country, 2019 - 2022, Thousand Units
- TABLE 167 Europe Thru-beam Market by Country, 2023 - 2030, Thousand Units
- TABLE 168 Europe Photoelectric Sensors Market by Application, 2019 - 2022, USD Million
- TABLE 169 Europe Photoelectric Sensors Market by Application, 2023 - 2030, USD Million
- TABLE 170 Europe Photoelectric Sensors Market by Application, 2019 - 2022, Thousand Units
- TABLE 171 Europe Photoelectric Sensors Market by Application, 2023 - 2030, Thousand Units
- TABLE 172 Europe Automotive Market by Country, 2019 - 2022, USD Million
- TABLE 173 Europe Automotive Market by Country, 2023 - 2030, USD Million
- TABLE 174 Europe Automotive Market by Country, 2019 - 2022, Thousand Units
- TABLE 175 Europe Automotive Market by Country, 2023 - 2030, Thousand Units
- TABLE 176 Europe Electronics & Semiconductor Market by Country, 2019 - 2022, USD Million
- TABLE 177 Europe Electronics & Semiconductor Market by Country, 2023 - 2030, USD Million
- TABLE 178 Europe Electronics & Semiconductor Market by Country, 2019 - 2022, Thousand Units
- TABLE 179 Europe Electronics & Semiconductor Market by Country, 2023 - 2030, Thousand Units
- TABLE 180 Europe Packaging Market by Country, 2019 - 2022, USD Million
- TABLE 181 Europe Packaging Market by Country, 2023 - 2030, USD Million
- TABLE 182 Europe Packaging Market by Country, 2019 - 2022, Thousand Units
- TABLE 183 Europe Packaging Market by Country, 2023 - 2030, Thousand Units
- TABLE 184 Europe Military & Aerospace Market by Country, 2019 - 2022, USD Million
- TABLE 185 Europe Military & Aerospace Market by Country, 2023 - 2030, USD Million
- TABLE 186 Europe Military & Aerospace Market by Country, 2019 - 2022, Thousand Units
- TABLE 187 Europe Military & Aerospace Market by Country, 2023 - 2030, Thousand Units
- TABLE 188 Europe Others Market by Country, 2019 - 2022, USD Million
- TABLE 189 Europe Others Market by Country, 2023 - 2030, USD Million
- TABLE 190 Europe Others Market by Country, 2019 - 2022, Thousand Units
- TABLE 191 Europe Others Market by Country, 2023 - 2030, Thousand Units
- TABLE 192 Europe Photoelectric Sensors Market by Country, 2019 - 2022, USD Million
- TABLE 193 Europe Photoelectric Sensors Market by Country, 2023 - 2030, USD Million
- TABLE 194 Europe Photoelectric Sensors Market by Country, 2019 - 2022, Thousand Units
- TABLE 195 Europe Photoelectric Sensors Market by Country, 2023 - 2030, Thousand Units
- TABLE 196 Germany Photoelectric Sensors Market, 2019 - 2022, USD Million
- TABLE 197 Germany Photoelectric Sensors Market, 2023 - 2030, USD Million
- TABLE 198 Germany Photoelectric Sensors Market, 2019 - 2022, Thousand Units
- TABLE 199 Germany Photoelectric Sensors Market, 2023 - 2030, Thousand Units
- TABLE 200 Germany Photoelectric Sensors Market by Technology, 2019 - 2022, USD Million
- TABLE 201 Germany Photoelectric Sensors Market by Technology, 2023 - 2030, USD Million
- TABLE 202 Germany Photoelectric Sensors Market by Technology, 2019 - 2022, Thousand Units
- TABLE 203 Germany Photoelectric Sensors Market by Technology, 2023 - 2030, Thousand Units
- TABLE 204 Germany Photoelectric Sensors Market by Application, 2019 - 2022, USD Million
- TABLE 205 Germany Photoelectric Sensors Market by Application, 2023 - 2030, USD Million
- TABLE 206 Germany Photoelectric Sensors Market by Application, 2019 - 2022, Thousand Units
- TABLE 207 Germany Photoelectric Sensors Market by Application, 2023 - 2030, Thousand Units
- TABLE 208 UK Photoelectric Sensors Market, 2019 - 2022, USD Million
- TABLE 209 UK Photoelectric Sensors Market, 2023 - 2030, USD Million
- TABLE 210 UK Photoelectric Sensors Market, 2019 - 2022, Thousand Units
- TABLE 211 UK Photoelectric Sensors Market, 2023 - 2030, Thousand Units
- TABLE 212 UK Photoelectric Sensors Market by Technology, 2019 - 2022, USD Million
- TABLE 213 UK Photoelectric Sensors Market by Technology, 2023 - 2030, USD Million
- TABLE 214 UK Photoelectric Sensors Market by Technology, 2019 - 2022, Thousand Units
- TABLE 215 UK Photoelectric Sensors Market by Technology, 2023 - 2030, Thousand Units
- TABLE 216 UK Photoelectric Sensors Market by Application, 2019 - 2022, USD Million
- TABLE 217 UK Photoelectric Sensors Market by Application, 2023 - 2030, USD Million
- TABLE 218 UK Photoelectric Sensors Market by Application, 2019 - 2022, Thousand Units
- TABLE 219 UK Photoelectric Sensors Market by Application, 2023 - 2030, Thousand Units
- TABLE 220 France Photoelectric Sensors Market, 2019 - 2022, USD Million
- TABLE 221 France Photoelectric Sensors Market, 2023 - 2030, USD Million
- TABLE 222 France Photoelectric Sensors Market, 2019 - 2022, Thousand Units
- TABLE 223 France Photoelectric Sensors Market, 2023 - 2030, Thousand Units
- TABLE 224 France Photoelectric Sensors Market by Technology, 2019 - 2022, USD Million
- TABLE 225 France Photoelectric Sensors Market by Technology, 2023 - 2030, USD Million
- TABLE 226 France Photoelectric Sensors Market by Technology, 2019 - 2022, Thousand Units
- TABLE 227 France Photoelectric Sensors Market by Technology, 2023 - 2030, Thousand Units
- TABLE 228 France Photoelectric Sensors Market by Application, 2019 - 2022, USD Million
- TABLE 229 France Photoelectric Sensors Market by Application, 2023 - 2030, USD Million
- TABLE 230 France Photoelectric Sensors Market by Application, 2019 - 2022, Thousand Units
- TABLE 231 France Photoelectric Sensors Market by Application, 2023 - 2030, Thousand Units
- TABLE 232 Russia Photoelectric Sensors Market, 2019 - 2022, USD Million
- TABLE 233 Russia Photoelectric Sensors Market, 2023 - 2030, USD Million
- TABLE 234 Russia Photoelectric Sensors Market, 2019 - 2022, Thousand Units
- TABLE 235 Russia Photoelectric Sensors Market, 2023 - 2030, Thousand Units
- TABLE 236 Russia Photoelectric Sensors Market by Technology, 2019 - 2022, USD Million
- TABLE 237 Russia Photoelectric Sensors Market by Technology, 2023 - 2030, USD Million
- TABLE 238 Russia Photoelectric Sensors Market by Technology, 2019 - 2022, Thousand Units
- TABLE 239 Russia Photoelectric Sensors Market by Technology, 2023 - 2030, Thousand Units
- TABLE 240 Russia Photoelectric Sensors Market by Application, 2019 - 2022, USD Million
- TABLE 241 Russia Photoelectric Sensors Market by Application, 2023 - 2030, USD Million
- TABLE 242 Russia Photoelectric Sensors Market by Application, 2019 - 2022, Thousand Units
- TABLE 243 Russia Photoelectric Sensors Market by Application, 2023 - 2030, Thousand Units
- TABLE 244 Spain Photoelectric Sensors Market, 2019 - 2022, USD Million
- TABLE 245 Spain Photoelectric Sensors Market, 2023 - 2030, USD Million
- TABLE 246 Spain Photoelectric Sensors Market, 2019 - 2022, Thousand Units
- TABLE 247 Spain Photoelectric Sensors Market, 2023 - 2030, Thousand Units
- TABLE 248 Spain Photoelectric Sensors Market by Technology, 2019 - 2022, USD Million
- TABLE 249 Spain Photoelectric Sensors Market by Technology, 2023 - 2030, USD Million
- TABLE 250 Spain Photoelectric Sensors Market by Technology, 2019 - 2022, Thousand Units
- TABLE 251 Spain Photoelectric Sensors Market by Technology, 2023 - 2030, Thousand Units
- TABLE 252 Spain Photoelectric Sensors Market by Application, 2019 - 2022, USD Million
- TABLE 253 Spain Photoelectric Sensors Market by Application, 2023 - 2030, USD Million
- TABLE 254 Spain Photoelectric Sensors Market by Application, 2019 - 2022, Thousand Units
- TABLE 255 Spain Photoelectric Sensors Market by Application, 2023 - 2030, Thousand Units
- TABLE 256 Italy Photoelectric Sensors Market, 2019 - 2022, USD Million
- TABLE 257 Italy Photoelectric Sensors Market, 2023 - 2030, USD Million
- TABLE 258 Italy Photoelectric Sensors Market, 2019 - 2022, Thousand Units
- TABLE 259 Italy Photoelectric Sensors Market, 2023 - 2030, Thousand Units
- TABLE 260 Italy Photoelectric Sensors Market by Technology, 2019 - 2022, USD Million
- TABLE 261 Italy Photoelectric Sensors Market by Technology, 2023 - 2030, USD Million
- TABLE 262 Italy Photoelectric Sensors Market by Technology, 2019 - 2022, Thousand Units
- TABLE 263 Italy Photoelectric Sensors Market by Technology, 2023 - 2030, Thousand Units
- TABLE 264 Italy Photoelectric Sensors Market by Application, 2019 - 2022, USD Million
- TABLE 265 Italy Photoelectric Sensors Market by Application, 2023 - 2030, USD Million
- TABLE 266 Italy Photoelectric Sensors Market by Application, 2019 - 2022, Thousand Units
- TABLE 267 Italy Photoelectric Sensors Market by Application, 2023 - 2030, Thousand Units
- TABLE 268 Rest of Europe Photoelectric Sensors Market, 2019 - 2022, USD Million
- TABLE 269 Rest of Europe Photoelectric Sensors Market, 2023 - 2030, USD Million
- TABLE 270 Rest of Europe Photoelectric Sensors Market, 2019 - 2022, Thousand Units
- TABLE 271 Rest of Europe Photoelectric Sensors Market, 2023 - 2030, Thousand Units
- TABLE 272 Rest of Europe Photoelectric Sensors Market by Technology, 2019 - 2022, USD Million
- TABLE 273 Rest of Europe Photoelectric Sensors Market by Technology, 2023 - 2030, USD Million
- TABLE 274 Rest of Europe Photoelectric Sensors Market by Technology, 2019 - 2022, Thousand Units
- TABLE 275 Rest of Europe Photoelectric Sensors Market by Technology, 2023 - 2030, Thousand Units
- TABLE 276 Rest of Europe Photoelectric Sensors Market by Application, 2019 - 2022, USD Million
- TABLE 277 Rest of Europe Photoelectric Sensors Market by Application, 2023 - 2030, USD Million
- TABLE 278 Rest of Europe Photoelectric Sensors Market by Application, 2019 - 2022, Thousand Units
- TABLE 279 Rest of Europe Photoelectric Sensors Market by Application, 2023 - 2030, Thousand Units
- TABLE 280 Asia Pacific Photoelectric Sensors Market, 2019 - 2022, USD Million
- TABLE 281 Asia Pacific Photoelectric Sensors Market, 2023 - 2030, USD Million
- TABLE 282 Asia Pacific Photoelectric Sensors Market, 2019 - 2022, Thousand Units
- TABLE 283 Asia Pacific Photoelectric Sensors Market, 2023 - 2030, Thousand Units
- TABLE 284 Asia Pacific Photoelectric Sensors Market by Technology, 2019 - 2022, USD Million
- TABLE 285 Asia Pacific Photoelectric Sensors Market by Technology, 2023 - 2030, USD Million
- TABLE 286 Asia Pacific Photoelectric Sensors Market by Technology, 2019 - 2022, Thousand Units
- TABLE 287 Asia Pacific Photoelectric Sensors Market by Technology, 2023 - 2030, Thousand Units
- TABLE 288 Asia Pacific Retro-reflective Market by Country, 2019 - 2022, USD Million
- TABLE 289 Asia Pacific Retro-reflective Market by Country, 2023 - 2030, USD Million
- TABLE 290 Asia Pacific Retro-reflective Market by Country, 2019 - 2022, Thousand Units
- TABLE 291 Asia Pacific Retro-reflective Market by Country, 2023 - 2030, Thousand Units
- TABLE 292 Asia Pacific Diffused Market by Country, 2019 - 2022, USD Million
- TABLE 293 Asia Pacific Diffused Market by Country, 2023 - 2030, USD Million
- TABLE 294 Asia Pacific Diffused Market by Country, 2019 - 2022, Thousand Units
- TABLE 295 Asia Pacific Diffused Market by Country, 2023 - 2030, Thousand Units
- TABLE 296 Asia Pacific Thru-beam Market by Country, 2019 - 2022, USD Million
- TABLE 297 Asia Pacific Thru-beam Market by Country, 2023 - 2030, USD Million
- TABLE 298 Asia Pacific Thru-beam Market by Country, 2019 - 2022, Thousand Units
- TABLE 299 Asia Pacific Thru-beam Market by Country, 2023 - 2030, Thousand Units
- TABLE 300 Asia Pacific Photoelectric Sensors Market by Application, 2019 - 2022, USD Million
- TABLE 301 Asia Pacific Photoelectric Sensors Market by Application, 2023 - 2030, USD Million
- TABLE 302 Asia Pacific Photoelectric Sensors Market by Application, 2019 - 2022, Thousand Units
- TABLE 303 Asia Pacific Photoelectric Sensors Market by Application, 2023 - 2030, Thousand Units
- TABLE 304 Asia Pacific Automotive Market by Country, 2019 - 2022, USD Million
- TABLE 305 Asia Pacific Automotive Market by Country, 2023 - 2030, USD Million
- TABLE 306 Asia Pacific Automotive Market by Country, 2019 - 2022, Thousand Units
- TABLE 307 Asia Pacific Automotive Market by Country, 2023 - 2030, Thousand Units
- TABLE 308 Asia Pacific Electronics & Semiconductor Market by Country, 2019 - 2022, USD Million
- TABLE 309 Asia Pacific Electronics & Semiconductor Market by Country, 2023 - 2030, USD Million
- TABLE 310 Asia Pacific Electronics & Semiconductor Market by Country, 2019 - 2022, Thousand Units
- TABLE 311 Asia Pacific Electronics & Semiconductor Market by Country, 2023 - 2030, Thousand Units
- TABLE 312 Asia Pacific Packaging Market by Country, 2019 - 2022, USD Million
- TABLE 313 Asia Pacific Packaging Market by Country, 2023 - 2030, USD Million
- TABLE 314 Asia Pacific Packaging Market by Country, 2019 - 2022, Thousand Units
- TABLE 315 Asia Pacific Packaging Market by Country, 2023 - 2030, Thousand Units
- TABLE 316 Asia Pacific Military & Aerospace Market by Country, 2019 - 2022, USD Million
- TABLE 317 Asia Pacific Military & Aerospace Market by Country, 2023 - 2030, USD Million
- TABLE 318 Asia Pacific Military & Aerospace Market by Country, 2019 - 2022, Thousand Units
- TABLE 319 Asia Pacific Military & Aerospace Market by Country, 2023 - 2030, Thousand Units
- TABLE 320 Asia Pacific Others Market by Country, 2019 - 2022, USD Million
- TABLE 321 Asia Pacific Others Market by Country, 2023 - 2030, USD Million
- TABLE 322 Asia Pacific Others Market by Country, 2019 - 2022, Thousand Units
- TABLE 323 Asia Pacific Others Market by Country, 2023 - 2030, Thousand Units
- TABLE 324 Asia Pacific Photoelectric Sensors Market by Country, 2019 - 2022, USD Million
- TABLE 325 Asia Pacific Photoelectric Sensors Market by Country, 2023 - 2030, USD Million
- TABLE 326 Asia Pacific Photoelectric Sensors Market by Country, 2019 - 2022, Thousand Units
- TABLE 327 Asia Pacific Photoelectric Sensors Market by Country, 2023 - 2030, Thousand Units
The Global Photoelectric Sensors Market size is expected to reach $2.8 billion by 2030, rising at a market growth of 6.3% CAGR during the forecast period. In the year 2022, the market attained a volume of 37,495.1 thousand units, experiencing a growth of 6.2% (2019-2022).
Photoelectric sensors are widely used for object detection and proximity sensing in automotive manufacturing. Therefore, the automotive segment acquired $599.6 million in 2022. These sensors can witness the presence or absence of components on assembly lines, ensuring that the right parts are in the correct position for assembly. They contribute to automating processes, reducing errors, and improving production efficiency. These sensors are employed in adaptive lighting systems that adjust the brightness and direction of headlights based on environmental conditions. These sensors detect ambient light levels, oncoming traffic, and the vehicle's speed to optimize the illumination and enhance driver visibility.
The major strategies followed by the market participants are Partnerships, Collaborations & Agreements as the key developmental strategy to keep pace with the changing demands of end users. For instance, In, October, 2023, Sick AG teamed up with Endress+Hauser Group Services AG, under this collaboration, the companies supported the customers in the areas of resource and energy efficiency. Additionally, the collaboration assisted in protecting the climate and the environment. Additionally, In, September, 2023, Rockwell Automation, Inc. came into a partnership with Everactive, Inc., under this partnership, the solutions of Everactive were combined with the Dynamix product portfolio of Rockwell Automation.
Based on the Analysis presented in the KBV Cardinal matrix; Schneider Electric SE, Eaton Corporation PLC, Keyence Corporation and Panasonic Holdings Corporation are the forerunners in the Photoelectric Sensors Market. In, February, 2021, Keyence Corporation formed a partnership with StayLinked Corporation, under this partnership, the SmartTE software of StayLinked was incorporated into the latest mobile computer and rugged smart device, the BT-A700, of Keyence.
Companies such as Rockwell Automation, Inc., Omron Corporation, Sick AG are some of the key innovators in Photoelectric Sensors Market
Market Growth Factors
Emergence of smart photoelectric sensors
Smart photoelectric sensors come equipped with advanced features and capabilities beyond traditional sensors. These sensors often incorporate microprocessors, communication interfaces, and onboard processing, enabling them to perform complex tasks and adapt to dynamic environments. The advent of smart sensors aligns with the principles of Industry 4.0, with a strong emphasis on integrating digital technologies into manufacturing processes. Smart photoelectric sensors contribute to the automation of industrial processes, improving productivity, reducing downtime, and enabling more agile and flexible manufacturing environments. This integration enables advanced functionalities such as object recognition, pattern analysis, and decision-making based on the sensor's input. AI-enhanced sensors open up new possibilities for automation and intelligent systems. Thus, the emergence of smart photoelectric sensors has positively impacted the market.
Increasing demand for non-contact sensing
Non-contact sensing eliminates the need for physical contact between sensors and objects. In industrial settings, this is crucial for ensuring equipment and personnel safety. The ability of these sensors to detect objects without direct contact contributes to implementing enhanced safety standards, leading to increased adoption in manufacturing environments. In industries where handling delicate materials is common, non-contact sensing with these sensors prevents damage to these materials. This is particularly important in applications such as electronics manufacturing, where precise and gentle handling of components is essential to avoid defects. They suit diverse applications across industries, from detecting transparent objects to identifying irregular shapes. Due to the increasing demand for non-contact sensing, the market is expected to expand.
Market Restraining Factors
Inability to operate in harsh environments
Harsh industrial environments, such as high dust, moisture, vibrations, or temperature extremes, are common in manufacturing plants and facilities. The inability of these sensors to operate effectively in these conditions limits their adoption in critical industrial applications. Industrial automation and control systems heavily rely on sensors for precise and reliable operation. The inability to operate in harsh environments can disrupt manufacturing processes, leading to inefficiencies, production delays, and potential quality issues. Harsh environments are prevalent in construction and mining operations, where sensors are exposed to dust, debris, and rugged terrain. The inability to withstand these conditions limits the applicability of photoelectric sensors in these industries. Photoelectric sensors that cannot withstand these conditions may face limitations in applications such as traffic monitoring and vehicle detection. Due to the above-mentioned factors, the market is expected to decline in the coming years.
Technology Outlook
On the basis of technology, the market is segmented into retro-reflective, diffused, and thru-beam. The diffused segment acquired a substantial revenue share in the market in 2022. Diffused sensors find applications in various industries, including manufacturing, packaging, and logistics. Their versatility and ease of use make them a go-to choose for many automation scenarios. Diffused sensors often feature a compact and space-saving design. This makes them suitable for installations where available space is limited or where a discreet and unobtrusive sensor solution is preferred. The integrated design of diffused sensors reduces the components required, making them a cost-effective solution. The absence of a separate reflector or receiver unit contributes to overall cost savings in terms of both equipment and installation.
Application Outlook
Based on application, the market is fragmented into automotive, packaging, electronic & semiconductor, military & aerospace, and others. The electronic & semiconductor segment projected a prominent growth rate in the market in 2022. These sensors precisely detect semiconductor wafers as they move along conveyor systems. These sensors ensure accurate positioning and movement control during various stages of semiconductor manufacturing processes. In semiconductor manufacturing, these sensors detect the position and alignment of lead frames. This is crucial for ensuring that the semiconductor chips are accurately mounted and bonded to the lead frames during packaging.
Regional Outlook
Region-wise, the market is analysed across North America, Europe, Asia Pacific, and LAMEA. In 2022, the Asia Pacific region registered the highest revenue share in the market. The expansion of safety regulations in developing nations such as Japan, China, and India, as well as the implementation of IIoT in industrial facilities, all contribute to the expansion of photoelectric sensor production in the region. The rapid expansion of end-user sectors such as consumer electronics, automotive, textile, and industrial is substantially driving the growth of the market because the data collected by the sensors can be immediately compiled and implemented to enhance the efficiency of manufacturing processes.
The market research report covers the analysis of key stake holders of the market. Key companies profiled in the report include Omron Corporation, Panasonic Corporation, Rockwell Automation, Inc., Eaton Corporation Plc., Keyence Corporation, Schneider Electric SE, Autonics Corporation, SICK AG, Balluff GmbH, and IFM Electronic GmbH.
Recent Strategy Deployed in the Photoelectric Sensors Market
Partnerships, Collaborations, and Agreements:
Oct-2023: Sick AG teamed up with Endress+Hauser Group Services AG, a global leader in measurement and automation technology. Under this collaboration, the companies supported the customers in the areas of resource and energy efficiency. Additionally, the collaboration assisted in protecting the climate and the environment.
Sep-2023: Rockwell Automation, Inc. came into a partnership with Everactive, Inc., a deep technology company. Under this partnership, the solutions of Everactive were combined with the Dynamix product portfolio of Rockwell Automation. Additionally, the combined system offered data to the FactoryTalk MaintenanceSuite of Rockwell Automation for condition-based monitoring and assisting the maintenance teams to decrease asset-related downtime and reduce production costs.
Aug-2022: Sick AG joined hands with Aeva Inc., a leader in next-generation sensing and perception systems. Under this collaboration, the companies incorporated the FMCW (frequency modulated continuous wave) 4D lidar into several industrial sensing and long-range sensing products of Sick AG.
Feb-2021: Keyence Corporation formed a partnership with StayLinked Corporation, a market leader in Terminal Emulation for the supply chain industry. Under this partnership, the SmartTE software of StayLinked was incorporated into the latest mobile computer and rugged smart device, the BT-A700, of Keyence. Additionally, the partnership helped establish Keyence as an innovator in Automatic Identification and Data Capture (AIDC).
Aug-2020: Schneider Electric SE formed a partnership with RS Americas, Inc., a United States-based provider of product and service solutions. Under this partnership, the companies offered a variety of digital resources to their customers. Additionally, the partnership provided the customers with several components to design and maintain cabinets and industrial control panels.
Jul-2020: IFM Electronics GmbH formed a partnership with Software AG, a German multinational software corporation. Under this partnership, the companies provided the customers with direct plug-and-play solution packages for the Internet of Things. Additionally, the partnership offered analysis of sensor data and cloud-based visualization.
Product Launches and Product Expansions:
Mar-2023: Keyence Corporation introduced the LM-X multisensor measuring solution offering optical, laser, and touch-probe measurements. The new product offers high-accuracy measurements along with a simple button-press operation.
Jan-2023: Panasonic Holdings Corporation launched hyperspectral imaging technology. The new technology helps in determining colour differences, which are negligible to the naked eye. Additionally, the new technology improves image analysis and accuracy in image recognition.
Feb-2020: Panasonic Corporation unveiled a time-of-flight (TOF) image sensor that has the features of avalanche photodiode (APD) pixels. The new product determines the 3D information of images corresponding to the position of objects at distances up to 250 m. Additionally, the new product can be used in wide-area surveillance and automotive range imaging.
Acquisition and Mergers:
Mar-2022: Schneider Electric SE completed the acquisition of Aurtra Pty Ltd., a company delivering cost-effective IOT and SaaS asset management solutions. Through this acquisition, Schneider Electric enhanced its position as a digital provider of services in the value chain of electrical distribution.
Feb-2022: Schneider Electric SE took over EnergySage, Inc., an American Boston-based company dealing in clean energy products. Through this acquisition, Schneider Electric assisted in the growth of EnergySage. Additionally, this acquisition helped the customers in their conversion to the use of renewable energy sources.
Jan-2022: Eaton Corporation PLC acquired Royal Power Solutions, a company manufacturing electrical connectivity components. Through this acquisition, Eaton Corporation enhanced its growth in the e-mobility and electrical segments.
Mar-2021: Eaton Corporation PLC completed the acquisition of Tripp Lite, an American manufacturer of power protection and connecting electrical devices. Through this acquisition, the products of Tripp Lite supplemented the distributed IT and edge computing product portfolio of Eaton Corporation. Additionally, the acquisition assisted in strengthening the single-phase UPS business.
Jan-2021: Rockwell Automation, Inc. completed the acquisition of Fiix Inc., a cloud-based, AI-powered computerized maintenance management system (CMMS). Through this acquisition, Rockwell Automation enhanced its software strategy. Additionally, the acquisition helped improve business productivity and the performance of Rockwell Automation.
Scope of the Study
Market Segments covered in the Report:
By Technology (Volume, Thousand Units, USD Billion, 2019-2030)
- Retro-reflective
- Diffused
- Thru-beam
By Application (Volume, Thousand Units, USD Billion, 2019-2030)
- Automotive
- Electronics & Semiconductor
- Packaging
- Military & Aerospace
- Others
By Geography (Volume, Thousand Units, USD Billion, 2019-2030)
- North America
- US
- Canada
- Mexico
- Rest of North America
- Europe
- Germany
- UK
- France
- Russia
- Spain
- Italy
- Rest of Europe
- Asia Pacific
- China
- Japan
- India
- South Korea
- Taiwan
- Malaysia
- Rest of Asia Pacific
- LAMEA
- Brazil
- Argentina
- UAE
- Saudi Arabia
- South Africa
- Nigeria
- Rest of LAMEA
Companies Profiled
- Omron Corporation
- Panasonic Corporation
- Rockwell Automation, Inc.
- Eaton Corporation Plc.
- Keyence Corporation
- Schneider Electric SE
- Autonics Corporation
- SICK AG
- Balluff GmbH
- IFM Electronic GmbH
Unique Offerings from KBV Research
- Exhaustive coverage
- Highest number of market tables and figures
- Subscription based model available
- Guaranteed best price
- Assured post sales research support with 10% customization free
Table of Contents
Chapter 1. Market Scope & Methodology
- 1.1 Market Definition
- 1.2 Objectives
- 1.3 Market Scope
- 1.4 Segmentation
- 1.4.1 Global Photoelectric Sensors Market, by Technology
- 1.4.2 Global Photoelectric Sensors Market, by Application
- 1.4.3 Global Photoelectric Sensors Market, by Geography
- 1.5 Methodology for the research
Chapter 2. Market at a Glance
- 2.1 Key Highlights
Chapter 3. Market Overview
- 3.1 Introduction
- 3.1.1 Overview
- 3.1.1.1 Market Composition and Scenario
- 3.1.1 Overview
- 3.2 Key Factors Impacting the Market
- 3.2.1 Market Drivers
- 3.2.2 Market Restraints
Chapter 4. Competition Analysis - Global
- 4.1 KBV Cardinal Matrix
- 4.2 Recent Industry Wide Strategic Developments
- 4.2.1 Partnerships, Collaborations and Agreements
- 4.2.2 Product Launches and Product Expansions
- 4.2.3 Acquisition and Mergers
- 4.3 Top Winning Strategies
- 4.3.1 Key Leading Strategies: Percentage Distribution (2019-2023)
- 4.3.2 Key Strategic Move: (Partnerships, Collaborations & Agreements : 2020, Jul - 2023, Oct) Leading Players
- 4.4 Porter's Five Forces Analysis
Chapter 5. Global Photoelectric Sensors Market by Technology
- 5.1 Global Retro-reflective Market by Region
- 5.2 Global Diffused Market by Region
- 5.3 Global Thru-beam Market by Region
Chapter 6. Global Photoelectric Sensors Market by Application
- 6.1 Global Automotive Market by Region
- 6.2 Global Electronics & Semiconductor Market by Region
- 6.3 Global Packaging Market by Region
- 6.4 Global Military & Aerospace Market by Region
- 6.5 Global Others Market by Region
Chapter 7. Global Photoelectric Sensors Market by Region
- 7.1 North America Photoelectric Sensors Market
- 7.1.1 North America Photoelectric Sensors Market by Technology
- 7.1.1.1 North America Retro-reflective Market by Country
- 7.1.1.2 North America Diffused Market by Country
- 7.1.1.3 North America Thru-beam Market by Country
- 7.1.2 North America Photoelectric Sensors Market by Application
- 7.1.2.1 North America Automotive Market by Country
- 7.1.2.2 North America Electronics & Semiconductor Market by Country
- 7.1.2.3 North America Packaging Market by Country
- 7.1.2.4 North America Military & Aerospace Market by Country
- 7.1.2.5 North America Others Market by Country
- 7.1.3 North America Photoelectric Sensors Market by Country
- 7.1.3.1 US Photoelectric Sensors Market
- 7.1.3.1.1 US Photoelectric Sensors Market by Technology
- 7.1.3.1.2 US Photoelectric Sensors Market by Application
- 7.1.3.2 Canada Photoelectric Sensors Market
- 7.1.3.2.1 Canada Photoelectric Sensors Market by Technology
- 7.1.3.2.2 Canada Photoelectric Sensors Market by Application
- 7.1.3.3 Mexico Photoelectric Sensors Market
- 7.1.3.3.1 Mexico Photoelectric Sensors Market by Technology
- 7.1.3.3.2 Mexico Photoelectric Sensors Market by Application
- 7.1.3.4 Rest of North America Photoelectric Sensors Market
- 7.1.3.4.1 Rest of North America Photoelectric Sensors Market by Technology
- 7.1.3.4.2 Rest of North America Photoelectric Sensors Market by Application
- 7.1.3.1 US Photoelectric Sensors Market
- 7.1.1 North America Photoelectric Sensors Market by Technology
- 7.2 Europe Photoelectric Sensors Market
- 7.2.1 Europe Photoelectric Sensors Market by Technology
- 7.2.1.1 Europe Retro-reflective Market by Country
- 7.2.1.2 Europe Diffused Market by Country
- 7.2.1.3 Europe Thru-beam Market by Country
- 7.2.2 Europe Photoelectric Sensors Market by Application
- 7.2.2.1 Europe Automotive Market by Country
- 7.2.2.2 Europe Electronics & Semiconductor Market by Country
- 7.2.2.3 Europe Packaging Market by Country
- 7.2.2.4 Europe Military & Aerospace Market by Country
- 7.2.2.5 Europe Others Market by Country
- 7.2.3 Europe Photoelectric Sensors Market by Country
- 7.2.3.1 Germany Photoelectric Sensors Market
- 7.2.3.1.1 Germany Photoelectric Sensors Market by Technology
- 7.2.3.1.2 Germany Photoelectric Sensors Market by Application
- 7.2.3.2 UK Photoelectric Sensors Market
- 7.2.3.2.1 UK Photoelectric Sensors Market by Technology
- 7.2.3.2.2 UK Photoelectric Sensors Market by Application
- 7.2.3.3 France Photoelectric Sensors Market
- 7.2.3.3.1 France Photoelectric Sensors Market by Technology
- 7.2.3.3.2 France Photoelectric Sensors Market by Application
- 7.2.3.4 Russia Photoelectric Sensors Market
- 7.2.3.4.1 Russia Photoelectric Sensors Market by Technology
- 7.2.3.4.2 Russia Photoelectric Sensors Market by Application
- 7.2.3.5 Spain Photoelectric Sensors Market
- 7.2.3.5.1 Spain Photoelectric Sensors Market by Technology
- 7.2.3.5.2 Spain Photoelectric Sensors Market by Application
- 7.2.3.6 Italy Photoelectric Sensors Market
- 7.2.3.6.1 Italy Photoelectric Sensors Market by Technology
- 7.2.3.6.2 Italy Photoelectric Sensors Market by Application
- 7.2.3.7 Rest of Europe Photoelectric Sensors Market
- 7.2.3.7.1 Rest of Europe Photoelectric Sensors Market by Technology
- 7.2.3.7.2 Rest of Europe Photoelectric Sensors Market by Application
- 7.2.3.1 Germany Photoelectric Sensors Market
- 7.2.1 Europe Photoelectric Sensors Market by Technology
- 7.3 Asia Pacific Photoelectric Sensors Market
- 7.3.1 Asia Pacific Photoelectric Sensors Market by Technology
- 7.3.1.1 Asia Pacific Retro-reflective Market by Country
- 7.3.1.2 Asia Pacific Diffused Market by Country
- 7.3.1.3 Asia Pacific Thru-beam Market by Country
- 7.3.2 Asia Pacific Photoelectric Sensors Market by Application
- 7.3.2.1 Asia Pacific Automotive Market by Country
- 7.3.2.2 Asia Pacific Electronics & Semiconductor Market by Country
- 7.3.2.3 Asia Pacific Packaging Market by Country
- 7.3.2.4 Asia Pacific Military & Aerospace Market by Country
- 7.3.2.5 Asia Pacific Others Market by Country
- 7.3.3 Asia Pacific Photoelectric Sensors Market by Country
- 7.3.3.1 China Photoelectric Sensors Market
- 7.3.3.1.1 China Photoelectric Sensors Market by Technology
- 7.3.3.1.2 China Photoelectric Sensors Market by Application
- 7.3.3.2 Japan Photoelectric Sensors Market
- 7.3.3.2.1 Japan Photoelectric Sensors Market by Technology
- 7.3.3.2.2 Japan Photoelectric Sensors Market by Application
- 7.3.3.3 India Photoelectric Sensors Market
- 7.3.3.3.1 India Photoelectric Sensors Market by Technology
- 7.3.3.3.2 India Photoelectric Sensors Market by Application
- 7.3.3.4 South Korea Photoelectric Sensors Market
- 7.3.3.4.1 South Korea Photoelectric Sensors Market by Technology
- 7.3.3.4.2 South Korea Photoelectric Sensors Market by Application
- 7.3.3.5 Taiwan Photoelectric Sensors Market
- 7.3.3.5.1 Taiwan Photoelectric Sensors Market by Technology
- 7.3.3.5.2 Taiwan Photoelectric Sensors Market by Application
- 7.3.3.6 Malaysia Photoelectric Sensors Market
- 7.3.3.6.1 Malaysia Photoelectric Sensors Market by Technology
- 7.3.3.6.2 Malaysia Photoelectric Sensors Market by Application
- 7.3.3.7 Rest of Asia Pacific Photoelectric Sensors Market
- 7.3.3.7.1 Rest of Asia Pacific Photoelectric Sensors Market by Technology
- 7.3.3.7.2 Rest of Asia Pacific Photoelectric Sensors Market by Application
- 7.3.3.1 China Photoelectric Sensors Market
- 7.3.1 Asia Pacific Photoelectric Sensors Market by Technology
- 7.4 LAMEA Photoelectric Sensors Market
- 7.4.1 LAMEA Photoelectric Sensors Market by Technology
- 7.4.1.1 LAMEA Retro-reflective Market by Country
- 7.4.1.2 LAMEA Diffused Market by Country
- 7.4.1.3 LAMEA Thru-beam Market by Country
- 7.4.2 LAMEA Photoelectric Sensors Market by Application
- 7.4.2.1 LAMEA Automotive Market by Country
- 7.4.2.2 LAMEA Electronics & Semiconductor Market by Country
- 7.4.2.3 LAMEA Packaging Market by Country
- 7.4.2.4 LAMEA Military & Aerospace Market by Country
- 7.4.2.5 LAMEA Others Market by Country
- 7.4.3 LAMEA Photoelectric Sensors Market by Country
- 7.4.3.1 Brazil Photoelectric Sensors Market
- 7.4.3.1.1 Brazil Photoelectric Sensors Market by Technology
- 7.4.3.1.2 Brazil Photoelectric Sensors Market by Application
- 7.4.3.2 Argentina Photoelectric Sensors Market
- 7.4.3.2.1 Argentina Photoelectric Sensors Market by Technology
- 7.4.3.2.2 Argentina Photoelectric Sensors Market by Application
- 7.4.3.3 UAE Photoelectric Sensors Market
- 7.4.3.3.1 UAE Photoelectric Sensors Market by Technology
- 7.4.3.3.2 UAE Photoelectric Sensors Market by Application
- 7.4.3.4 Saudi Arabia Photoelectric Sensors Market
- 7.4.3.4.1 Saudi Arabia Photoelectric Sensors Market by Technology
- 7.4.3.4.2 Saudi Arabia Photoelectric Sensors Market by Application
- 7.4.3.5 South Africa Photoelectric Sensors Market
- 7.4.3.5.1 South Africa Photoelectric Sensors Market by Technology
- 7.4.3.5.2 South Africa Photoelectric Sensors Market by Application
- 7.4.3.6 Nigeria Photoelectric Sensors Market
- 7.4.3.6.1 Nigeria Photoelectric Sensors Market by Technology
- 7.4.3.6.2 Nigeria Photoelectric Sensors Market by Application
- 7.4.3.7 Rest of LAMEA Photoelectric Sensors Market
- 7.4.3.7.1 Rest of LAMEA Photoelectric Sensors Market by Technology
- 7.4.3.7.2 Rest of LAMEA Photoelectric Sensors Market by Application
- 7.4.3.1 Brazil Photoelectric Sensors Market
- 7.4.1 LAMEA Photoelectric Sensors Market by Technology
Chapter 8. Company Profiles
- 8.1 Omron Corporation
- 8.1.1 Company Overview
- 8.1.2 Financial Analysis
- 8.1.3 Segmental and Regional Analysis
- 8.1.4 Research & Development Expenses
- 8.1.5 SWOT Analysis
- 8.2 Panasonic Holdings Corporation
- 8.2.1 Company Overview
- 8.2.2 Financial Analysis
- 8.2.3 Segmental and Regional Analysis
- 8.2.4 Research & Development Expenses
- 8.2.5 Recent strategies and developments:
- 8.2.5.1 Product Launches and Product Expansions:
- 8.2.6 SWOT Analysis
- 8.3 Rockwell Automation, Inc.
- 8.3.1 Company Overview
- 8.3.2 Financial Analysis
- 8.3.3 Segmental and Regional Analysis
- 8.3.4 Research & Development Expenses
- 8.3.5 Recent strategies and developments:
- 8.3.5.1 Partnerships, Collaborations, and Agreements:
- 8.3.5.2 Acquisition and Mergers:
- 8.3.6 SWOT Analysis
- 8.4 Eaton Corporation PLC
- 8.4.1 Company Overview
- 8.4.2 Financial Analysis
- 8.4.3 Segmental and Regional Analysis
- 8.4.4 Research & Development Expense
- 8.4.5 Recent strategies and developments:
- 8.4.5.1 Acquisition and Mergers:
- 8.4.6 SWOT Analysis
- 8.5 Keyence Corporation
- 8.5.1 Company Overview
- 8.5.2 Financial Analysis
- 8.5.3 Regional Analysis
- 8.5.4 Research & Development Expenses
- 8.5.5 Recent strategies and developments:
- 8.5.5.1 Partnerships, Collaborations, and Agreements:
- 8.5.5.2 Product Launches and Product Expansions:
- 8.5.6 SWOT Analysis
- 8.6 Schneider Electric SE
- 8.6.1 Company Overview
- 8.6.2 Financial Analysis
- 8.6.3 Segmental and Regional Analysis
- 8.6.4 Research & Development Expense
- 8.6.5 Recent strategies and developments:
- 8.6.5.1 Partnerships, Collaborations, and Agreements:
- 8.6.5.2 Acquisition and Mergers:
- 8.6.6 SWOT Analysis
- 8.7 Autonics Corporation
- 8.7.1 Company Overview
- 8.7.2 SWOT Analysis
- 8.8 Sick AG
- 8.8.1 Company Overview
- 8.8.2 Financial Analysis
- 8.8.3 Segmental and Regional Analysis
- 8.8.4 Research & Development Expense
- 8.8.5 Recent strategies and developments:
- 8.8.5.1 Partnerships, Collaborations, and Agreements:
- 8.8.6 SWOT Analysis
- 8.9 Balluff GmbH
- 8.9.1 Company Overview
- 8.9.2 SWOT Analysis
- 8.10. IFM Electronics GmbH
- 8.10.1 Company Overview
- 8.10.2 Recent strategies and developments:
- 8.10.2.1 Partnerships, Collaborations, and Agreements:
- 8.10.3 SWOT Analysis

