
|
市場調査レポート
商品コード
1959626
光電センサー市場の機会、成長要因、業界動向分析、および2026年から2035年までの予測Photoelectric Sensor Market Opportunity, Growth Drivers, Industry Trend Analysis, and Forecast 2026 - 2035 |
||||||
カスタマイズ可能
|
|||||||
| 光電センサー市場の機会、成長要因、業界動向分析、および2026年から2035年までの予測 |
|
出版日: 2026年02月06日
発行: Global Market Insights Inc.
ページ情報: 英文 190 Pages
納期: 2~3営業日
|

概要
世界の光電センサー市場は、2025年に24億米ドルと評価され、2035年までにCAGR8.1%で成長し、51億米ドルに達すると予測されています。
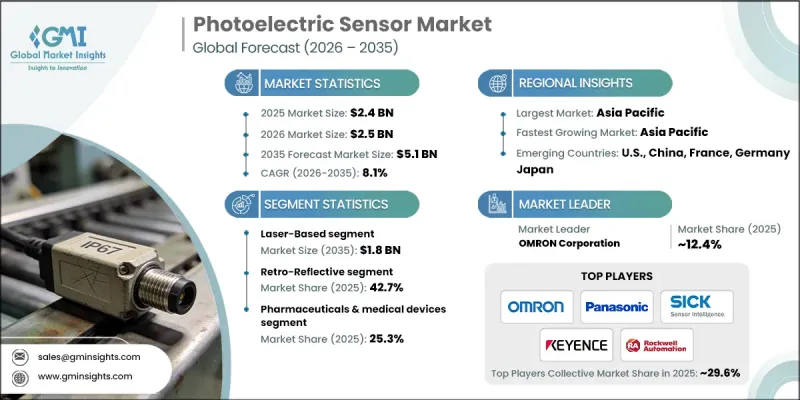
この業界の成長は、各分野におけるプロセス自動化とスマート製造の普及によって牽引されています。企業は製品の検出、計数、検査に光電センサーをますます活用しており、これにより製造業者はエラーを削減し生産効率を向上させることが可能となります。自動化物流、Eコマースのフルフィルメント、在庫管理に対する需要の高まりも導入をさらに促進しており、センサーは商品のより迅速な仕分け、追跡、精密な取り扱いを可能にします。インダストリー4.0とIoT技術の統合が市場を変革し、スマートファクトリー環境におけるリアルタイム監視、予知保全、接続された操業を実現しています。これらの接続されたセンサーは、特に自動車、電子機器、包装分野において、実用的な知見を提供し、生産ワークフローを最適化し、ダウンタイムを最小限に抑えます。さらに、小型化の動向により、コンパクトでスペース効率に優れたセンサーがPCB実装機器、ロボット、その他の限られたスペースでの用途に適し、より広範な採用を促進しています。
| 市場範囲 | |
|---|---|
| 開始年 | 2025年 |
| 予測年度 | 2026-2035 |
| 開始時価値 | 24億米ドル |
| 予測金額 | 51億米ドル |
| CAGR | 8.1% |
レーザー式光電センサー分野は、産業環境における高精度・長距離検出の需要に牽引され、2035年までに18億米ドルに達すると予測されております。レーザーセンサーは、集光された光スポットにより小型物体の正確な検出と精密な位置決めを実現し、組立ラインや半導体製造など一貫性が求められる用途において不可欠な役割を果たしております。
透過型セグメントは、2026年から2035年の間にCAGR9.5%で成長すると予想されます。透過型センサーは、高精度・長距離検出ニーズに最適であり、スマートファクトリーや高速包装作業の発展を支えています。IoT対応センシング技術や先進的な光電設計などの技術革新により、信頼性、精度、システム統合性が向上しており、メーカーによる透過型ソリューションの採用を促進しています。
北米の光電センサー市場は2025年に28.2%のシェアを占めました。同地域の成長は、製造・物流・包装分野における急速な産業オートメーション化に支えられており、センサーが精密な物体検知と効率的なワークフローを実現しています。IIoTの導入、スマートファクトリー構想、厳格な安全・品質基準が産業プラントでの導入を加速させる一方、既存市場プレイヤーは進化する産業要件に対応すべく革新を続けています。
よくあるご質問
目次
第1章 調査手法と範囲
第2章 エグゼクティブサマリー
第3章 業界考察
- エコシステム分析
- サプライヤーの情勢
- 利益率分析
- コスト構造
- 各段階における付加価値
- バリューチェーンに影響を与える要因
- ディスラプション
- 業界への影響要因
- 促進要因
- 産業オートメーションの広範な普及
- インダストリー4.0およびスマートファクトリー構想
- 包装・物流分野における需要の拡大
- 各分野における高精度センシングの需要増加
- エネルギー効率センサーへの注目の高まり
- 業界の潜在的リスク&課題
- 多額の資本支出および運営費
- レガシーシステムとの統合課題
- 市場機会
- 工業化と自動化が進む成長地域
- スマートビルにおける導入拡大
- 促進要因
- 規制情勢
- 北米
- 欧州
- アジア太平洋地域
- ラテンアメリカ
- 中東・アフリカ
- ポーターの分析
- PESTEL分析
- 技術とイノベーションの動向
- 現在の技術動向
- 新興技術
- 新興ビジネスモデル
- コンプライアンス要件
- 特許および知的財産分析
- 地政学的・貿易動向
第4章 競合情勢
- イントロダクション
- 企業の市場シェア分析
- 地域別
- 北米
- 欧州
- アジア太平洋地域
- ラテンアメリカ
- 中東・アフリカ
- 地域別
- 主要企業の競合ベンチマーキング
- 財務実績比較
- 収益
- 利益率
- 研究開発
- 製品ポートフォリオ比較
- 製品ラインの広さ
- 技術
- イノベーション
- 地域別展開比較
- 世界展開分析
- サービスネットワークのカバー率
- 地域別市場浸透率
- 競合ポジショニングマトリックス
- リーダー企業
- 課題者
- フォロワー
- ニッチプレイヤー
- 戦略的展望マトリックス
- 財務実績比較
- 主な発展, 2022-2025
- 合併・買収
- 提携および共同事業
- 技術的進歩
- 拡大と投資戦略
- デジタルトランスフォーメーションの取り組み
- 新興/スタートアップ競合の動向
第5章 市場推計・予測光源別、2022-2035
- LEDベース
- レーザーベース
- 光ファイバー
第6章 市場推計・予測:光学構成別、2022-2035
- スルービーム方式
- 再帰反射式
- 拡散反射式
第7章 市場推計・予測:検知距離別、2022-2035
- 短距離:100mm以下
- 中距離:100 mm超~1,000 mm以下
- 長距離:1,000 mm超~10,000 mm以下
- 超長距離/拡張範囲:10,000 mm超
第8章 市場推計・予測:ハウジング形状別、2022-2035
- 円筒形
- 矩形/ボックス型
- スロット/フォーク
第9章 市場推計・予測:エンドユーザー産業別、2022-2035
- 工業製造
- 自動車・輸送機器
- 食品・飲料加工
- 医薬品・医療機器
- ビルオートメーション・スマートインフラ
- 電子機器・半導体製造
- エネルギー・公益事業・インフラ
- 航空宇宙・防衛
- その他
第10章 市場推計・予測:地域別、2022-2035
- 北米
- 米国
- カナダ
- 欧州
- ドイツ
- 英国
- フランス
- スペイン
- イタリア
- オランダ
- アジア太平洋地域
- 中国
- インド
- 日本
- オーストラリア
- 韓国
- ラテンアメリカ
- ブラジル
- メキシコ
- アルゼンチン
- 中東・アフリカ
- 南アフリカ
- サウジアラビア
- アラブ首長国連邦
第11章 企業プロファイル
- OMRON Corporation
- Panasonic Industry Co., Ltd.
- SICK AG
- KEYENCE CORPORATION
- Rockwell Automation
- Balluff Inc
- OPTEX FA CO., LTD.
- Baumer
- Pepperl+Fuchs SE
- TAKEX EUROPE LTD.
- Wenglor
- Schneider Electric
- Banner Engineering Corp.
- Hans Turck GmbH &Co. KG
- Leuze Electronic Pvt. Ltd.
