|
|
市場調査レポート
商品コード
1385152
酸化亜鉛の世界市場規模、シェア、産業動向分析レポート:プロセス別、用途別、形態別、地域別展望と予測、2023年~2030年Global Zinc Oxide Market Size, Share & Industry Trends Analysis Report By Process (Indirect, Direct, Wet Chemical, and Others), By Application, By Form (Powder, Pellets, and Liquid), By Regional Outlook and Forecast, 2023 - 2030 |
||||||
|
|
|||||||
|
|||||||


| 酸化亜鉛の世界市場規模、シェア、産業動向分析レポート:プロセス別、用途別、形態別、地域別展望と予測、2023年~2030年 |
|
出版日: 2023年10月31日
発行: KBV Research
ページ情報: 英文 367 Pages
納期: 即納可能
|

- 全表示
- 概要
- 図表
- 目次
酸化亜鉛市場規模は、予測期間中にCAGR 5.6%で成長し、2030年には77億米ドルに達すると予測されます。2022年の市場規模は1,841.7キロトンに達し、4.9%の成長を遂げます(2019-2022年)。
しかし、同市場はサプライチェーンの混乱の影響を受けやすいです。鉱山の閉鎖、輸送問題、地政学的緊張などの要因は、酸化亜鉛生産の主原料である亜鉛鉱石の入手可能性に影響を与える可能性があります。酸化亜鉛は主に亜鉛鉱石から生産されます。鉱山の閉鎖、労働争議、地政学的緊張、物流上の課題など、亜鉛鉱石の供給に混乱が生じると、供給不足につながり、原料価格が上昇する可能性があります。その結果、酸化亜鉛の生産コストに影響し、市場での入手が制限される可能性があります。サプライチェーンの混乱は酸化亜鉛製造施設に生産の遅れを生じさせます。このような遅れは、原材料の調達、輸送のボトルネック、労働力不足に関連する問題から生じる可能性があります。このような遅延は、顧客への酸化亜鉛のタイムリーな納入を妨げる可能性があります。
形態の展望
形態別に見ると、市場は粉末、ペレット、液体に分類されます。液体セグメントは2022年の市場でかなりの収益シェアを占めています。酸化亜鉛は液体またはナノ粒子の形態で、日焼け止め、ローション、スキンケア製品に配合されます。酸化亜鉛配合の液状日焼け止めは、のびがよく、透明で、塗りやすいです。べたつかず軽い使用感を維持しながら効果的なUVプロテクションを提供し、快適さとプロテクションを求める現代の消費者の要求に応えます。リキッドタイプの酸化亜鉛は、リキッドファンデーション、BBクリーム、コンシーラーなどの化粧品に使用されています。滑らかなテクスチャーで、カバー力があり、UVカット効果もあります。酸化亜鉛配合のリキッド化粧品は自然な仕上がりになり、化粧品の向上と日焼け防止を求める消費者に支持されています。
プロセスの展望
プロセスは、間接法、直接法、湿式化学法、その他に分類されます。2022年の市場では、湿式化学法が大きな収益シェアを獲得しました。湿式化学法では、酸化亜鉛粒子の粒子径と形態を精密に制御できます。これは、化粧品、日焼け止め、ナノテクノロジーなどの用途で、最適な性能を発揮するために特定の粒子径が求められる場合に重要です。酸化亜鉛ナノ粒子の合成には、湿式化学法が広く用いられています。これらのナノ粒子は、そのユニークな特性と小さな粒子サイズにより、エレクトロニクス、光学、ナノ医療への応用が見出されています。湿式化学法は化粧品やパーソナルケア製品用の酸化亜鉛を製造します。
用途別展望
用途別に見ると、市場は自動車、建設、化粧品・パーソナルケア、塗料・コーティング、医薬品、農業、その他に分けられます。建築分野は2022年の市場で大きな収益シェアを獲得しました。酸化亜鉛は、壁や屋根などの外面用の建築用塗料に使用されます。これらの塗料は耐紫外線性、耐食性、耐候性を提供し、多様な環境条件下で建物の寿命と外観を保証します。酸化亜鉛は、窓やガラスファサードの日射遮蔽コーティングに使用されています。これにより、エネルギー効率が向上し、現代建築デザインの透明性と明るさを維持しながらUVカットを実現します。酸化亜鉛は建築物のエネルギー効率の高いコーティングや断熱材に使用されています。これらのコーティングは熱伝導を抑え、構造物のエネルギー効率を高め、グリーンビルディング認証をサポートします。
地域別展望
地域別に見ると、市場は北米、欧州、アジア太平洋、LAMEAで分析されます。2022年には、アジア太平洋地域が最も高い収益シェアを獲得して市場をリードしました。アジア太平洋地域は、急速な工業化と都市化が進んでおり、建設とインフラ整備が増加しています。中国、日本、韓国などの国々の自動車産業や製造業は、酸化亜鉛の主要な消費者です。アジア太平洋は技術革新の中心地であり、特にエレクトロニクスとナノテクノロジーにおいて顕著です。この地域では可処分所得が増加する中産階級が増加しており、酸化亜鉛を含むパーソナルケア、化粧品、ヘルスケア製品の需要を牽引しています。
目次
第1章 市場範囲と調査手法
- 市場の定義
- 目的
- 市場範囲
- セグメンテーション
- 調査手法
第2章 市場の概要
- 主なハイライト
第3章 市場概要
- イントロダクション
- 概要
- 市場構成とシナリオ
- 概要
- 市場に影響を与える主な要因
- 市場促進要因
- 市場抑制要因
- ポーターファイブフォース分析
第4章 世界の酸化亜鉛市場:プロセス別
- 世界の間接市場:地域別
- 世界のダイレクト市場:地域別
- 世界のウェットケミカル市場:地域別
- 世界のその他の市場:地域別
第5章 世界の酸化亜鉛市場:用途別
- 世界の自動車市場:地域別
- 世界の建設市場:地域別
- 世界の塗料およびコーティング市場:地域別
- 世界の化粧品およびパーソナルケア市場:地域別
- 世界の医薬品市場:地域別
- 世界の農業市場:地域別
- 世界のその他の市場:地域別
第6章 世界の酸化亜鉛市場:形態別
- 世界の粉末市場:地域別
- 世界のペレット市場:地域別
- 世界の液体市場:地域別
第7章 世界の酸化亜鉛市場:地域別
- 北米
- 北米の市場:国別
- 米国
- カナダ
- メキシコ
- その他北米地域
- 北米の市場:国別
- 欧州
- 欧州の市場:国別
- ドイツ
- 英国
- フランス
- ロシア
- スペイン
- イタリア
- その他欧州地域
- 欧州の市場:国別
- アジア太平洋
- アジア太平洋の市場:国別
- 中国
- 日本
- インド
- 韓国
- シンガポール
- マレーシア
- その他アジア太平洋地域
- アジア太平洋の市場:国別
- ラテンアメリカ・中東・アフリカ
- ラテンアメリカ・中東・アフリカの市場:国別
- ブラジル
- アルゼンチン
- アラブ首長国連邦
- サウジアラビア
- 南アフリカ
- ナイジェリア
- その他ラテンアメリカ・中東・アフリカ地域
- ラテンアメリカ・中東・アフリカの市場:国別
第8章 企業プロファイル
- CCL Industries, Inc
- Lanxess AG
- Tata Chemicals Ltd
- Zochem, Inc
- Toho Zinc Co, Ltd.
- Pan-Continental Chemical Co, Ltd.
- Ace Chemie Zynk Energy Limited
- AG CHEMI GROUP s r o
- HAKUSUI TECH CO, LTD.
- Mario Pilato Blat SA
第9章 市場の成功必須条件
LIST OF TABLES
- TABLE 1 Global Zinc Oxide Market, 2019 - 2022, USD Million
- TABLE 2 Global Zinc Oxide Market, 2023 - 2030, USD Million
- TABLE 3 Global Zinc Oxide Market, 2019 - 2022, Kilo Tonnes
- TABLE 4 Global Zinc Oxide Market, 2023 - 2030, Kilo Tonnes
- TABLE 5 Global Zinc Oxide Market by Process, 2019 - 2022, USD Million
- TABLE 6 Global Zinc Oxide Market by Process, 2023 - 2030, USD Million
- TABLE 7 Global Zinc Oxide Market by Process, 2019 - 2022, Kilo Tonnes
- TABLE 8 Global Zinc Oxide Market by Process, 2023 - 2030, Kilo Tonnes
- TABLE 9 Global Indirect Market by Region, 2019 - 2022, USD Million
- TABLE 10 Global Indirect Market by Region, 2023 - 2030, USD Million
- TABLE 11 Global Indirect Market by Region, 2019 - 2022, Kilo Tonnes
- TABLE 12 Global Indirect Market by Region, 2023 - 2030, Kilo Tonnes
- TABLE 13 Global Direct Market by Region, 2019 - 2022, USD Million
- TABLE 14 Global Direct Market by Region, 2023 - 2030, USD Million
- TABLE 15 Global Direct Market by Region, 2019 - 2022, Kilo Tonnes
- TABLE 16 Global Direct Market by Region, 2023 - 2030, Kilo Tonnes
- TABLE 17 Global Wet Chemical Market by Region, 2019 - 2022, USD Million
- TABLE 18 Global Wet Chemical Market by Region, 2023 - 2030, USD Million
- TABLE 19 Global Wet Chemical Market by Region, 2019 - 2022, Kilo Tonnes
- TABLE 20 Global Wet Chemical Market by Region, 2023 - 2030, Kilo Tonnes
- TABLE 21 Global Others Market by Region, 2019 - 2022, USD Million
- TABLE 22 Global Others Market by Region, 2023 - 2030, USD Million
- TABLE 23 Global Others Market by Region, 2019 - 2022, Kilo Tonnes
- TABLE 24 Global Others Market by Region, 2023 - 2030, Kilo Tonnes
- TABLE 25 Global Zinc Oxide Market by Application, 2019 - 2022, USD Million
- TABLE 26 Global Zinc Oxide Market by Application, 2023 - 2030, USD Million
- TABLE 27 Global Zinc Oxide Market by Application, 2019 - 2022, Kilo Tonnes
- TABLE 28 Global Zinc Oxide Market by Application, 2023 - 2030, Kilo Tonnes
- TABLE 29 Global Automotive Market by Region, 2019 - 2022, USD Million
- TABLE 30 Global Automotive Market by Region, 2023 - 2030, USD Million
- TABLE 31 Global Automotive Market by Region, 2019 - 2022, Kilo Tonnes
- TABLE 32 Global Automotive Market by Region, 2023 - 2030, Kilo Tonnes
- TABLE 33 Global Construction Market by Region, 2019 - 2022, USD Million
- TABLE 34 Global Construction Market by Region, 2023 - 2030, USD Million
- TABLE 35 Global Construction Market by Region, 2019 - 2022, Kilo Tonnes
- TABLE 36 Global Construction Market by Region, 2023 - 2030, Kilo Tonnes
- TABLE 37 Global Paints & Coatings Market by Region, 2019 - 2022, USD Million
- TABLE 38 Global Paints & Coatings Market by Region, 2023 - 2030, USD Million
- TABLE 39 Global Paints & Coatings Market by Region, 2019 - 2022, Kilo Tonnes
- TABLE 40 Global Paints & Coatings Market by Region, 2023 - 2030, Kilo Tonnes
- TABLE 41 Global Cosmetics & Personal Care Market by Region, 2019 - 2022, USD Million
- TABLE 42 Global Cosmetics & Personal Care Market by Region, 2023 - 2030, USD Million
- TABLE 43 Global Cosmetics & Personal Care Market by Region, 2019 - 2022, Kilo Tonnes
- TABLE 44 Global Cosmetics & Personal Care Market by Region, 2023 - 2030, Kilo Tonnes
- TABLE 45 Global Pharmaceuticals Market by Region, 2019 - 2022, USD Million
- TABLE 46 Global Pharmaceuticals Market by Region, 2023 - 2030, USD Million
- TABLE 47 Global Pharmaceuticals Market by Region, 2019 - 2022, Kilo Tonnes
- TABLE 48 Global Pharmaceuticals Market by Region, 2023 - 2030, Kilo Tonnes
- TABLE 49 Global Agriculture Market by Region, 2019 - 2022, USD Million
- TABLE 50 Global Agriculture Market by Region, 2023 - 2030, USD Million
- TABLE 51 Global Agriculture Market by Region, 2019 - 2022, Kilo Tonnes
- TABLE 52 Global Agriculture Market by Region, 2023 - 2030, Kilo Tonnes
- TABLE 53 Global Others Market by Region, 2019 - 2022, USD Million
- TABLE 54 Global Others Market by Region, 2023 - 2030, USD Million
- TABLE 55 Global Others Market by Region, 2019 - 2022, Kilo Tonnes
- TABLE 56 Global Others Market by Region, 2023 - 2030, Kilo Tonnes
- TABLE 57 Global Zinc Oxide Market by Form, 2019 - 2022, USD Million
- TABLE 58 Global Zinc Oxide Market by Form, 2023 - 2030, USD Million
- TABLE 59 Global Zinc Oxide Market by Form, 2019 - 2022, Kilo Tonnes
- TABLE 60 Global Zinc Oxide Market by Form, 2023 - 2030, Kilo Tonnes
- TABLE 61 Global Powder Market by Region, 2019 - 2022, USD Million
- TABLE 62 Global Powder Market by Region, 2023 - 2030, USD Million
- TABLE 63 Global Powder Market by Region, 2019 - 2022, Kilo Tonnes
- TABLE 64 Global Powder Market by Region, 2023 - 2030, Kilo Tonnes
- TABLE 65 Global Pellets Market by Region, 2019 - 2022, USD Million
- TABLE 66 Global Pellets Market by Region, 2023 - 2030, USD Million
- TABLE 67 Global Pellets Market by Region, 2019 - 2022, Kilo Tonnes
- TABLE 68 Global Pellets Market by Region, 2023 - 2030, Kilo Tonnes
- TABLE 69 Global Liquid Market by Region, 2019 - 2022, USD Million
- TABLE 70 Global Liquid Market by Region, 2023 - 2030, USD Million
- TABLE 71 Global Liquid Market by Region, 2019 - 2022, Kilo Tonnes
- TABLE 72 Global Liquid Market by Region, 2023 - 2030, Kilo Tonnes
- TABLE 73 Global Zinc Oxide Market by Region, 2019 - 2022, USD Million
- TABLE 74 Global Zinc Oxide Market by Region, 2023 - 2030, USD Million
- TABLE 75 Global Zinc Oxide Market by Region, 2019 - 2022, Kilo Tonnes
- TABLE 76 Global Zinc Oxide Market by Region, 2023 - 2030, Kilo Tonnes
- TABLE 77 North America Zinc Oxide Market, 2019 - 2022, USD Million
- TABLE 78 North America Zinc Oxide Market, 2023 - 2030, USD Million
- TABLE 79 North America Zinc Oxide Market, 2019 - 2022, Kilo Tonnes
- TABLE 80 North America Zinc Oxide Market, 2023 - 2030, Kilo Tonnes
- TABLE 81 North America Zinc Oxide Market by Process, 2019 - 2022, USD Million
- TABLE 82 North America Zinc Oxide Market by Process, 2023 - 2030, USD Million
- TABLE 83 North America Zinc Oxide Market by Process, 2019 - 2022, Kilo Tonnes
- TABLE 84 North America Zinc Oxide Market by Process, 2023 - 2030, Kilo Tonnes
- TABLE 85 North America Indirect Market by Country, 2019 - 2022, USD Million
- TABLE 86 North America Indirect Market by Country, 2023 - 2030, USD Million
- TABLE 87 North America Indirect Market by Country, 2019 - 2022, Kilo Tonnes
- TABLE 88 North America Indirect Market by Country, 2023 - 2030, Kilo Tonnes
- TABLE 89 North America Direct Market by Country, 2019 - 2022, USD Million
- TABLE 90 North America Direct Market by Country, 2023 - 2030, USD Million
- TABLE 91 North America Direct Market by Country, 2019 - 2022, Kilo Tonnes
- TABLE 92 North America Direct Market by Country, 2023 - 2030, Kilo Tonnes
- TABLE 93 North America Wet Chemical Market by Country, 2019 - 2022, USD Million
- TABLE 94 North America Wet Chemical Market by Country, 2023 - 2030, USD Million
- TABLE 95 North America Wet Chemical Market by Country, 2019 - 2022, Kilo Tonnes
- TABLE 96 North America Wet Chemical Market by Country, 2023 - 2030, Kilo Tonnes
- TABLE 97 North America Others Market by Country, 2019 - 2022, USD Million
- TABLE 98 North America Others Market by Country, 2023 - 2030, USD Million
- TABLE 99 North America Others Market by Country, 2019 - 2022, Kilo Tonnes
- TABLE 100 North America Others Market by Country, 2023 - 2030, Kilo Tonnes
- TABLE 101 North America Zinc Oxide Market by Application, 2019 - 2022, USD Million
- TABLE 102 North America Zinc Oxide Market by Application, 2023 - 2030, USD Million
- TABLE 103 North America Zinc Oxide Market by Application, 2019 - 2022, Kilo Tonnes
- TABLE 104 North America Zinc Oxide Market by Application, 2023 - 2030, Kilo Tonnes
- TABLE 105 North America Automotive Market by Country, 2019 - 2022, USD Million
- TABLE 106 North America Automotive Market by Country, 2023 - 2030, USD Million
- TABLE 107 North America Automotive Market by Country, 2019 - 2022, Kilo Tonnes
- TABLE 108 North America Automotive Market by Country, 2023 - 2030, Kilo Tonnes
- TABLE 109 North America Construction Market by Country, 2019 - 2022, USD Million
- TABLE 110 North America Construction Market by Country, 2023 - 2030, USD Million
- TABLE 111 North America Construction Market by Country, 2019 - 2022, Kilo Tonnes
- TABLE 112 North America Construction Market by Country, 2023 - 2030, Kilo Tonnes
- TABLE 113 North America Paints & Coatings Market by Country, 2019 - 2022, USD Million
- TABLE 114 North America Paints & Coatings Market by Country, 2023 - 2030, USD Million
- TABLE 115 North America Paints & Coatings Market by Country, 2019 - 2022, Kilo Tonnes
- TABLE 116 North America Paints & Coatings Market by Country, 2023 - 2030, Kilo Tonnes
- TABLE 117 North America Cosmetics & Personal Care Market by Country, 2019 - 2022, USD Million
- TABLE 118 North America Cosmetics & Personal Care Market by Country, 2023 - 2030, USD Million
- TABLE 119 North America Cosmetics & Personal Care Market by Country, 2019 - 2022, Kilo Tonnes
- TABLE 120 North America Cosmetics & Personal Care Market by Country, 2023 - 2030, Kilo Tonnes
- TABLE 121 North America Pharmaceuticals Market by Country, 2019 - 2022, USD Million
- TABLE 122 North America Pharmaceuticals Market by Country, 2023 - 2030, USD Million
- TABLE 123 North America Pharmaceuticals Market by Country, 2019 - 2022, Kilo Tonnes
- TABLE 124 North America Pharmaceuticals Market by Country, 2023 - 2030, Kilo Tonnes
- TABLE 125 North America Agriculture Market by Country, 2019 - 2022, USD Million
- TABLE 126 North America Agriculture Market by Country, 2023 - 2030, USD Million
- TABLE 127 North America Agriculture Market by Country, 2019 - 2022, Kilo Tonnes
- TABLE 128 North America Agriculture Market by Country, 2023 - 2030, Kilo Tonnes
- TABLE 129 North America Others Market by Country, 2019 - 2022, USD Million
- TABLE 130 North America Others Market by Country, 2023 - 2030, USD Million
- TABLE 131 North America Others Market by Country, 2019 - 2022, Kilo Tonnes
- TABLE 132 North America Others Market by Country, 2023 - 2030, Kilo Tonnes
- TABLE 133 North America Zinc Oxide Market by Form, 2019 - 2022, USD Million
- TABLE 134 North America Zinc Oxide Market by Form, 2023 - 2030, USD Million
- TABLE 135 North America Zinc Oxide Market by Form, 2019 - 2022, Kilo Tonnes
- TABLE 136 North America Zinc Oxide Market by Form, 2023 - 2030, Kilo Tonnes
- TABLE 137 North America Powder Market by Country, 2019 - 2022, USD Million
- TABLE 138 North America Powder Market by Country, 2023 - 2030, USD Million
- TABLE 139 North America Powder Market by Country, 2019 - 2022, Kilo Tonnes
- TABLE 140 North America Powder Market by Country, 2023 - 2030, Kilo Tonnes
- TABLE 141 North America Pellets Market by Country, 2019 - 2022, USD Million
- TABLE 142 North America Pellets Market by Country, 2023 - 2030, USD Million
- TABLE 143 North America Pellets Market by Country, 2019 - 2022, Kilo Tonnes
- TABLE 144 North America Pellets Market by Country, 2023 - 2030, Kilo Tonnes
- TABLE 145 North America Liquid Market by Country, 2019 - 2022, USD Million
- TABLE 146 North America Liquid Market by Country, 2023 - 2030, USD Million
- TABLE 147 North America Liquid Market by Country, 2019 - 2022, Kilo Tonnes
- TABLE 148 North America Liquid Market by Country, 2023 - 2030, Kilo Tonnes
- TABLE 149 North America Zinc Oxide Market by Country, 2019 - 2022, USD Million
- TABLE 150 North America Zinc Oxide Market by Country, 2023 - 2030, USD Million
- TABLE 151 North America Zinc Oxide Market by Country, 2019 - 2022, Kilo Tonnes
- TABLE 152 North America Zinc Oxide Market by Country, 2023 - 2030, Kilo Tonnes
- TABLE 153 US Zinc Oxide Market, 2019 - 2022, USD Million
- TABLE 154 US Zinc Oxide Market, 2023 - 2030, USD Million
- TABLE 155 US Zinc Oxide Market, 2019 - 2022, Kilo Tonnes
- TABLE 156 US Zinc Oxide Market, 2023 - 2030, Kilo Tonnes
- TABLE 157 US Zinc Oxide Market by Process, 2019 - 2022, USD Million
- TABLE 158 US Zinc Oxide Market by Process, 2023 - 2030, USD Million
- TABLE 159 US Zinc Oxide Market by Process, 2019 - 2022, Kilo Tonnes
- TABLE 160 US Zinc Oxide Market by Process, 2023 - 2030, Kilo Tonnes
- TABLE 161 US Zinc Oxide Market by Application, 2019 - 2022, USD Million
- TABLE 162 US Zinc Oxide Market by Application, 2023 - 2030, USD Million
- TABLE 163 US Zinc Oxide Market by Application, 2019 - 2022, Kilo Tonnes
- TABLE 164 US Zinc Oxide Market by Application, 2023 - 2030, Kilo Tonnes
- TABLE 165 US Zinc Oxide Market by Form, 2019 - 2022, USD Million
- TABLE 166 US Zinc Oxide Market by Form, 2023 - 2030, USD Million
- TABLE 167 US Zinc Oxide Market by Form, 2019 - 2022, Kilo Tonnes
- TABLE 168 US Zinc Oxide Market by Form, 2023 - 2030, Kilo Tonnes
- TABLE 169 Canada Zinc Oxide Market, 2019 - 2022, USD Million
- TABLE 170 Canada Zinc Oxide Market, 2023 - 2030, USD Million
- TABLE 171 Canada Zinc Oxide Market, 2019 - 2022, Kilo Tonnes
- TABLE 172 Canada Zinc Oxide Market, 2023 - 2030, Kilo Tonnes
- TABLE 173 Canada Zinc Oxide Market by Process, 2019 - 2022, USD Million
- TABLE 174 Canada Zinc Oxide Market by Process, 2023 - 2030, USD Million
- TABLE 175 Canada Zinc Oxide Market by Process, 2019 - 2022, Kilo Tonnes
- TABLE 176 Canada Zinc Oxide Market by Process, 2023 - 2030, Kilo Tonnes
- TABLE 177 Canada Zinc Oxide Market by Application, 2019 - 2022, USD Million
- TABLE 178 Canada Zinc Oxide Market by Application, 2023 - 2030, USD Million
- TABLE 179 Canada Zinc Oxide Market by Application, 2019 - 2022, Kilo Tonnes
- TABLE 180 Canada Zinc Oxide Market by Application, 2023 - 2030, Kilo Tonnes
- TABLE 181 Canada Zinc Oxide Market by Form, 2019 - 2022, USD Million
- TABLE 182 Canada Zinc Oxide Market by Form, 2023 - 2030, USD Million
- TABLE 183 Canada Zinc Oxide Market by Form, 2019 - 2022, Kilo Tonnes
- TABLE 184 Canada Zinc Oxide Market by Form, 2023 - 2030, Kilo Tonnes
- TABLE 185 Mexico Zinc Oxide Market, 2019 - 2022, USD Million
- TABLE 186 Mexico Zinc Oxide Market, 2023 - 2030, USD Million
- TABLE 187 Mexico Zinc Oxide Market, 2019 - 2022, Kilo Tonnes
- TABLE 188 Mexico Zinc Oxide Market, 2023 - 2030, Kilo Tonnes
- TABLE 189 Mexico Zinc Oxide Market by Process, 2019 - 2022, USD Million
- TABLE 190 Mexico Zinc Oxide Market by Process, 2023 - 2030, USD Million
- TABLE 191 Mexico Zinc Oxide Market by Process, 2019 - 2022, Kilo Tonnes
- TABLE 192 Mexico Zinc Oxide Market by Process, 2023 - 2030, Kilo Tonnes
- TABLE 193 Mexico Zinc Oxide Market by Application, 2019 - 2022, USD Million
- TABLE 194 Mexico Zinc Oxide Market by Application, 2023 - 2030, USD Million
- TABLE 195 Mexico Zinc Oxide Market by Application, 2019 - 2022, Kilo Tonnes
- TABLE 196 Mexico Zinc Oxide Market by Application, 2023 - 2030, Kilo Tonnes
- TABLE 197 Mexico Zinc Oxide Market by Form, 2019 - 2022, USD Million
- TABLE 198 Mexico Zinc Oxide Market by Form, 2023 - 2030, USD Million
- TABLE 199 Mexico Zinc Oxide Market by Form, 2019 - 2022, Kilo Tonnes
- TABLE 200 Mexico Zinc Oxide Market by Form, 2023 - 2030, Kilo Tonnes
- TABLE 201 Rest of North America Zinc Oxide Market, 2019 - 2022, USD Million
- TABLE 202 Rest of North America Zinc Oxide Market, 2023 - 2030, USD Million
- TABLE 203 Rest of North America Zinc Oxide Market, 2019 - 2022, Kilo Tonnes
- TABLE 204 Rest of North America Zinc Oxide Market, 2023 - 2030, Kilo Tonnes
- TABLE 205 Rest of North America Zinc Oxide Market by Process, 2019 - 2022, USD Million
- TABLE 206 Rest of North America Zinc Oxide Market by Process, 2023 - 2030, USD Million
- TABLE 207 Rest of North America Zinc Oxide Market by Process, 2019 - 2022, Kilo Tonnes
- TABLE 208 Rest of North America Zinc Oxide Market by Process, 2023 - 2030, Kilo Tonnes
- TABLE 209 Rest of North America Zinc Oxide Market by Application, 2019 - 2022, USD Million
- TABLE 210 Rest of North America Zinc Oxide Market by Application, 2023 - 2030, USD Million
- TABLE 211 Rest of North America Zinc Oxide Market by Application, 2019 - 2022, Kilo Tonnes
- TABLE 212 Rest of North America Zinc Oxide Market by Application, 2023 - 2030, Kilo Tonnes
- TABLE 213 Rest of North America Zinc Oxide Market by Form, 2019 - 2022, USD Million
- TABLE 214 Rest of North America Zinc Oxide Market by Form, 2023 - 2030, USD Million
- TABLE 215 Rest of North America Zinc Oxide Market by Form, 2019 - 2022, Kilo Tonnes
- TABLE 216 Rest of North America Zinc Oxide Market by Form, 2023 - 2030, Kilo Tonnes
- TABLE 217 Europe Zinc Oxide Market, 2019 - 2022, USD Million
- TABLE 218 Europe Zinc Oxide Market, 2023 - 2030, USD Million
- TABLE 219 Europe Zinc Oxide Market, 2019 - 2022, Kilo Tonnes
- TABLE 220 Europe Zinc Oxide Market, 2023 - 2030, Kilo Tonnes
- TABLE 221 Europe Zinc Oxide Market by Process, 2019 - 2022, USD Million
- TABLE 222 Europe Zinc Oxide Market by Process, 2023 - 2030, USD Million
- TABLE 223 Europe Zinc Oxide Market by Process, 2019 - 2022, Kilo Tonnes
- TABLE 224 Europe Zinc Oxide Market by Process, 2023 - 2030, Kilo Tonnes
- TABLE 225 Europe Indirect Market by Country, 2019 - 2022, USD Million
- TABLE 226 Europe Indirect Market by Country, 2023 - 2030, USD Million
- TABLE 227 Europe Indirect Market by Country, 2019 - 2022, Kilo Tonnes
- TABLE 228 Europe Indirect Market by Country, 2023 - 2030, Kilo Tonnes
- TABLE 229 Europe Direct Market by Country, 2019 - 2022, USD Million
- TABLE 230 Europe Direct Market by Country, 2023 - 2030, USD Million
- TABLE 231 Europe Direct Market by Country, 2019 - 2022, Kilo Tonnes
- TABLE 232 Europe Direct Market by Country, 2023 - 2030, Kilo Tonnes
- TABLE 233 Europe Wet Chemical Market by Country, 2019 - 2022, USD Million
- TABLE 234 Europe Wet Chemical Market by Country, 2023 - 2030, USD Million
- TABLE 235 Europe Wet Chemical Market by Country, 2019 - 2022, Kilo Tonnes
- TABLE 236 Europe Wet Chemical Market by Country, 2023 - 2030, Kilo Tonnes
- TABLE 237 Europe Others Market by Country, 2019 - 2022, USD Million
- TABLE 238 Europe Others Market by Country, 2023 - 2030, USD Million
- TABLE 239 Europe Others Market by Country, 2019 - 2022, Kilo Tonnes
- TABLE 240 Europe Others Market by Country, 2023 - 2030, Kilo Tonnes
- TABLE 241 Europe Zinc Oxide Market by Application, 2019 - 2022, USD Million
- TABLE 242 Europe Zinc Oxide Market by Application, 2023 - 2030, USD Million
- TABLE 243 Europe Zinc Oxide Market by Application, 2019 - 2022, Kilo Tonnes
- TABLE 244 Europe Zinc Oxide Market by Application, 2023 - 2030, Kilo Tonnes
- TABLE 245 Europe Automotive Market by Country, 2019 - 2022, USD Million
- TABLE 246 Europe Automotive Market by Country, 2023 - 2030, USD Million
- TABLE 247 Europe Automotive Market by Country, 2019 - 2022, Kilo Tonnes
- TABLE 248 Europe Automotive Market by Country, 2023 - 2030, Kilo Tonnes
- TABLE 249 Europe Construction Market by Country, 2019 - 2022, USD Million
- TABLE 250 Europe Construction Market by Country, 2023 - 2030, USD Million
- TABLE 251 Europe Construction Market by Country, 2019 - 2022, Kilo Tonnes
- TABLE 252 Europe Construction Market by Country, 2023 - 2030, Kilo Tonnes
- TABLE 253 Europe Paints & Coatings Market by Country, 2019 - 2022, USD Million
- TABLE 254 Europe Paints & Coatings Market by Country, 2023 - 2030, USD Million
- TABLE 255 Europe Paints & Coatings Market by Country, 2019 - 2022, Kilo Tonnes
- TABLE 256 Europe Paints & Coatings Market by Country, 2023 - 2030, Kilo Tonnes
- TABLE 257 Europe Cosmetics & Personal Care Market by Country, 2019 - 2022, USD Million
- TABLE 258 Europe Cosmetics & Personal Care Market by Country, 2023 - 2030, USD Million
- TABLE 259 Europe Cosmetics & Personal Care Market by Country, 2019 - 2022, Kilo Tonnes
- TABLE 260 Europe Cosmetics & Personal Care Market by Country, 2023 - 2030, Kilo Tonnes
- TABLE 261 Europe Pharmaceuticals Market by Country, 2019 - 2022, USD Million
- TABLE 262 Europe Pharmaceuticals Market by Country, 2023 - 2030, USD Million
- TABLE 263 Europe Pharmaceuticals Market by Country, 2019 - 2022, Kilo Tonnes
- TABLE 264 Europe Pharmaceuticals Market by Country, 2023 - 2030, Kilo Tonnes
- TABLE 265 Europe Agriculture Market by Country, 2019 - 2022, USD Million
- TABLE 266 Europe Agriculture Market by Country, 2023 - 2030, USD Million
- TABLE 267 Europe Agriculture Market by Country, 2019 - 2022, Kilo Tonnes
- TABLE 268 Europe Agriculture Market by Country, 2023 - 2030, Kilo Tonnes
- TABLE 269 Europe Others Market by Country, 2019 - 2022, USD Million
- TABLE 270 Europe Others Market by Country, 2023 - 2030, USD Million
- TABLE 271 Europe Others Market by Country, 2019 - 2022, Kilo Tonnes
- TABLE 272 Europe Others Market by Country, 2023 - 2030, Kilo Tonnes
- TABLE 273 Europe Zinc Oxide Market by Form, 2019 - 2022, USD Million
- TABLE 274 Europe Zinc Oxide Market by Form, 2023 - 2030, USD Million
- TABLE 275 Europe Zinc Oxide Market by Form, 2019 - 2022, Kilo Tonnes
- TABLE 276 Europe Zinc Oxide Market by Form, 2023 - 2030, Kilo Tonnes
- TABLE 277 Europe Powder Market by Country, 2019 - 2022, USD Million
- TABLE 278 Europe Powder Market by Country, 2023 - 2030, USD Million
- TABLE 279 Europe Powder Market by Country, 2019 - 2022, Kilo Tonnes
- TABLE 280 Europe Powder Market by Country, 2023 - 2030, Kilo Tonnes
- TABLE 281 Europe Pellets Market by Country, 2019 - 2022, USD Million
- TABLE 282 Europe Pellets Market by Country, 2023 - 2030, USD Million
- TABLE 283 Europe Pellets Market by Country, 2019 - 2022, Kilo Tonnes
- TABLE 284 Europe Pellets Market by Country, 2023 - 2030, Kilo Tonnes
- TABLE 285 Europe Liquid Market by Country, 2019 - 2022, USD Million
- TABLE 286 Europe Liquid Market by Country, 2023 - 2030, USD Million
- TABLE 287 Europe Liquid Market by Country, 2019 - 2022, Kilo Tonnes
- TABLE 288 Europe Liquid Market by Country, 2023 - 2030, Kilo Tonnes
- TABLE 289 Europe Zinc Oxide Market by Country, 2019 - 2022, USD Million
- TABLE 290 Europe Zinc Oxide Market by Country, 2023 - 2030, USD Million
- TABLE 291 Europe Zinc Oxide Market by Country, 2019 - 2022, Kilo Tonnes
- TABLE 292 Europe Zinc Oxide Market by Country, 2023 - 2030, Kilo Tonnes
- TABLE 293 Germany Zinc Oxide Market, 2019 - 2022, USD Million
- TABLE 294 Germany Zinc Oxide Market, 2023 - 2030, USD Million
- TABLE 295 Germany Zinc Oxide Market, 2019 - 2022, Kilo Tonnes
- TABLE 296 Germany Zinc Oxide Market, 2023 - 2030, Kilo Tonnes
- TABLE 297 Germany Zinc Oxide Market by Process, 2019 - 2022, USD Million
- TABLE 298 Germany Zinc Oxide Market by Process, 2023 - 2030, USD Million
- TABLE 299 Germany Zinc Oxide Market by Process, 2019 - 2022, Kilo Tonnes
- TABLE 300 Germany Zinc Oxide Market by Process, 2023 - 2030, Kilo Tonnes
- TABLE 301 Germany Zinc Oxide Market by Application, 2019 - 2022, USD Million
- TABLE 302 Germany Zinc Oxide Market by Application, 2023 - 2030, USD Million
- TABLE 303 Germany Zinc Oxide Market by Application, 2019 - 2022, Kilo Tonnes
- TABLE 304 Germany Zinc Oxide Market by Application, 2023 - 2030, Kilo Tonnes
- TABLE 305 Germany Zinc Oxide Market by Form, 2019 - 2022, USD Million
- TABLE 306 Germany Zinc Oxide Market by Form, 2023 - 2030, USD Million
- TABLE 307 Germany Zinc Oxide Market by Form, 2019 - 2022, Kilo Tonnes
- TABLE 308 Germany Zinc Oxide Market by Form, 2023 - 2030, Kilo Tonnes
- TABLE 309 UK Zinc Oxide Market, 2019 - 2022, USD Million
- TABLE 310 UK Zinc Oxide Market, 2023 - 2030, USD Million
- TABLE 311 UK Zinc Oxide Market, 2019 - 2022, Kilo Tonnes
- TABLE 312 UK Zinc Oxide Market, 2023 - 2030, Kilo Tonnes
- TABLE 313 UK Zinc Oxide Market by Process, 2019 - 2022, USD Million
- TABLE 314 UK Zinc Oxide Market by Process, 2023 - 2030, USD Million
- TABLE 315 UK Zinc Oxide Market by Process, 2019 - 2022, Kilo Tonnes
- TABLE 316 UK Zinc Oxide Market by Process, 2023 - 2030, Kilo Tonnes
- TABLE 317 UK Zinc Oxide Market by Application, 2019 - 2022, USD Million
- TABLE 318 UK Zinc Oxide Market by Application, 2023 - 2030, USD Million
- TABLE 319 UK Zinc Oxide Market by Application, 2019 - 2022, Kilo Tonnes
- TABLE 320 UK Zinc Oxide Market by Application, 2023 - 2030, Kilo Tonnes
- TABLE 321 UK Zinc Oxide Market by Form, 2019 - 2022, USD Million
- TABLE 322 UK Zinc Oxide Market by Form, 2023 - 2030, USD Million
- TABLE 323 UK Zinc Oxide Market by Form, 2019 - 2022, Kilo Tonnes
- TABLE 324 UK Zinc Oxide Market by Form, 2023 - 2030, Kilo Tonnes
- TABLE 325 France Zinc Oxide Market, 2019 - 2022, USD Million
- TABLE 326 France Zinc Oxide Market, 2023 - 2030, USD Million
- TABLE 327 France Zinc Oxide Market, 2019 - 2022, Kilo Tonnes
- TABLE 328 France Zinc Oxide Market, 2023 - 2030, Kilo Tonnes
- TABLE 329 France Zinc Oxide Market by Process, 2019 - 2022, USD Million
- TABLE 330 France Zinc Oxide Market by Process, 2023 - 2030, USD Million
- TABLE 331 France Zinc Oxide Market by Process, 2019 - 2022, Kilo Tonnes
- TABLE 332 France Zinc Oxide Market by Process, 2023 - 2030, Kilo Tonnes
- TABLE 333 France Zinc Oxide Market by Application, 2019 - 2022, USD Million
- TABLE 334 France Zinc Oxide Market by Application, 2023 - 2030, USD Million
- TABLE 335 France Zinc Oxide Market by Application, 2019 - 2022, Kilo Tonnes
- TABLE 336 France Zinc Oxide Market by Application, 2023 - 2030, Kilo Tonnes
- TABLE 337 France Zinc Oxide Market by Form, 2019 - 2022, USD Million
- TABLE 338 France Zinc Oxide Market by Form, 2023 - 2030, USD Million
- TABLE 339 France Zinc Oxide Market by Form, 2019 - 2022, Kilo Tonnes
- TABLE 340 France Zinc Oxide Market by Form, 2023 - 2030, Kilo Tonnes
The Global Zinc Oxide Market size is expected to reach $7.7 billion by 2030, rising at a market growth of 5.6% CAGR during the forecast period. In the year 2022, the market attained a volume of 1,841.7 Kilo Tonnes, experiencing a growth of 4.9% (2019-2022).
Zinc oxide offers wide-spectrum protection against UVA and UVB radiation and is a very effective UV filter. This is essential for sunscreen and sunblock products in the cosmetics and personal care segment, helping to prevent sunburn and skin damage. Thus, the Cosmetics & Personal Care segment generated $439.4 million revenue in the market in 2022. Zinc oxide offers a physical barrier against UV rays, as it reflects and scatters them. This is advantageous for consumers who prefer non-chemical, mineral-based sunscreens, which can be gentler on the skin and less likely to irritate. Zinc oxide has antibacterial and antiseptic properties, making it valuable in skincare products that treat acne and skin irritations. It can help soothe and heal blemishes and reduce inflammation. Some of the factors impacting the market are increasing demand in rubber and tire industry, growing construction and infrastructure development, and supply chain disruptions of zinc oxide.
The rubber industry relies on zinc oxide for vulcanization, a process that enhances the strength and durability of rubber products, including tires. As the automotive industry expands, the demand for high-quality tires has increased, increasing zinc oxide usage. It is used in the vulcanization process of rubber, a critical step in tire manufacturing. Vulcanization involves the addition of sulfur and zinc oxide to the rubber compound, which results in improved elasticity, strength, and wear resistance. These properties are essential for the safety and durability of tires. Additionally, increasing urbanization and the need for modern infrastructure have led to a surge in construction projects such as roads, bridges, buildings, and public facilities. These projects often require zinc oxide-based coatings to ensure the longevity of structures in harsh environmental conditions. Zinc oxide is used in architectural glass to enhance transparency, brightness, and UV protection. As the construction of skyscrapers and modern architectural designs becomes more prevalent, the demand for specialized glass products that incorporate zinc oxide has increased. The residential construction sector is a major consumer of coatings and paints that contain zinc oxide. As the housing industry grows, so does the demand for zinc oxide-based products.
However, the market can be sensitive to supply chain disruptions. Factors like mine closures, transportation issues, or geopolitical tensions can affect the availability of zinc ore, which is a primary raw material for zinc oxide production. Zinc oxide is primarily produced from zinc ore. Any disruption in the supply of zinc ore, whether due to mine closures, labor strikes, geopolitical tensions, or logistical challenges, can lead to shortages and drive-up raw material prices. This, in turn, affects the cost of zinc oxide production and can limit its availability in the market. Supply chain disruptions can cause zinc oxide manufacturing facilities to experience production delays. These delays can result from issues related to the procurement of raw materials, transportation bottlenecks, or labor shortages. Such delays can hinder the timely delivery of zinc oxide to customers.
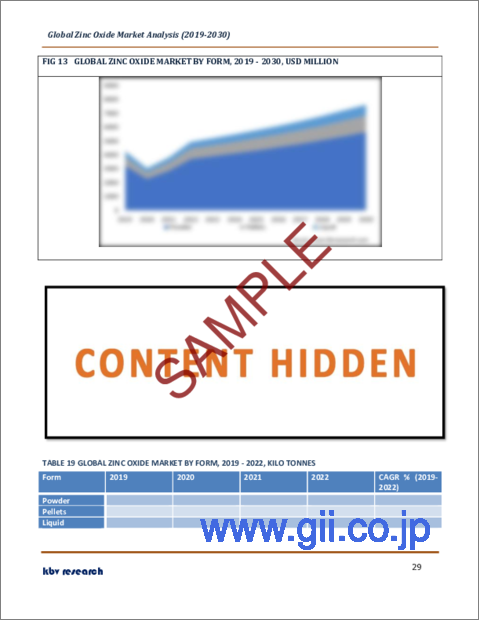
Form Outlook
By form, the market is categorized into powder, pellets, and liquid. The liquid segment covered a considerable revenue share in the market in 2022. Zinc oxide, in its liquid or nanoparticle form, is incorporated into sunscreens, lotions, and skincare products. Liquid sunscreens with zinc oxide offer enhanced spreadability, transparency, and ease of application. They provide effective UV protection while maintaining a lightweight, non-greasy feel, meeting the demands of modern consumers for comfort and protection. Liquid zinc oxide is used in cosmetics, including liquid foundations, BB creams, and concealers. It offers a smooth texture, good coverage, and UV protection. Liquid makeup products with zinc oxide provide a natural look and are favored by consumers seeking cosmetic enhancement and sun protection.
Process Outlook
Based on process, the market is classified into indirect, direct, wet chemical, and others. The wet chemical segment acquired a substantial revenue share in the market in 2022. Wet chemical methods allow for precise control of particle size and morphology of zinc oxide particles. This is important for applications in cosmetics, sunscreens, and nanotechnology, where specific particle sizes are required for optimal performance. Wet chemical methods are widely used in the synthesis of zinc oxide nanoparticles. These nanoparticles find applications in electronics, optics, and nanomedicine due to their unique properties and small particle size. Wet chemical methods produce zinc oxide for cosmetics and personal care products.
Application Outlook
On the basis of application, the market is divided into automotive, construction, cosmetics & personal care, paints & coatings, pharmaceuticals, agriculture, and others. The construction segment garnered a significant revenue share in the market in 2022. Zinc oxide is used in architectural coatings for exterior surfaces, such as walls and roofs. These coatings provide UV resistance, corrosion protection, and weatherproofing, ensuring the longevity and appearance of buildings in diverse environmental conditions. Zinc oxide is employed in sun-blocking coatings for windows and glass facades. This enhances energy efficiency and provides UV protection while maintaining transparency and brightness in modern architectural designs. Zinc oxide is used in energy-efficient coatings and insulating materials for buildings. These coatings help reduce heat transfer, enhancing the energy efficiency of structures and supporting green building certifications.
Regional Outlook
Region-wise, the market is analysed across North America, Europe, Asia Pacific, and LAMEA. In 2022, the Asia Pacific region led the market by generating the highest revenue share. Asia Pacific is experiencing rapid industrialization and urbanization, leading to increased construction and infrastructure development. The automotive and manufacturing sectors in countries like China, Japan, and South Korea are major consumers of zinc oxide. Asia Pacific is a hub for technological innovation, particularly in electronics and nanotechnology. The region's growing middle class with increasing disposable income is driving demand for personal care, cosmetics, and healthcare products that contain zinc oxide.
The market research report covers the analysis of key stake holders of the market. Key companies profiled in the report include CCL Industries, Inc., Lanxess AG, Tata Chemicals Ltd. (Tata Group), Zochem inc., Toho Zinc Co., Ltd., Pan-Continental Chemical Co., Ltd., Ace Chemie Zynk Energy Limited, AG CHEMI GROUP s.r.o., HAKUSUI TECH CO., LTD., and Mario Pilato Blat SA.
Scope of the Study
Market Segments covered in the Report:
By Process (Volume, Kilo Tonnes, USD Million, 2019-2030)
- Indirect
- Direct
- Wet Chemical
- Others
By Application (Volume, Kilo Tonnes, USD Million, 2019-2030)
- Automotive
- Construction
- Paints & Coatings
- Cosmetics & Personal Care
- Pharmaceuticals
- Agriculture
- Others
By Form (Volume, Kilo Tonnes, USD Million, 2019-2030)
- Powder
- Pellets
- Liquid
By Geography (Volume, Kilo Tonnes, USD Million, 2019-2030)
- North America
- US
- Canada
- Mexico
- Rest of North America
- Europe
- Germany
- UK
- France
- Russia
- Spain
- Italy
- Rest of Europe
- Asia Pacific
- China
- Japan
- India
- South Korea
- Singapore
- Malaysia
- Rest of Asia Pacific
- LAMEA
- Brazil
- Argentina
- UAE
- Saudi Arabia
- South Africa
- Nigeria
- Rest of LAMEA
Companies Profiled
- CCL Industries, Inc.
- Lanxess AG
- Tata Chemicals Ltd. (Tata Group)
- Zochem inc.
- Toho Zinc Co., Ltd.
- Pan-Continental Chemical Co., Ltd.
- Ace Chemie Zynk Energy Limited
- AG CHEMI GROUP s.r.o.
- HAKUSUI TECH CO., LTD.
- Mario Pilato Blat SA
Unique Offerings from KBV Research
- Exhaustive coverage
- Highest number of market tables and figures
- Subscription based model available
- Guaranteed best price
- Assured post sales research support with 10% customization free
Table of Contents
Chapter 1. Market Scope & Methodology
- 1.1 Market Definition
- 1.2 Objectives
- 1.3 Market Scope
- 1.4 Segmentation
- 1.4.1 Global Zinc Oxide Market, by Process
- 1.4.2 Global Zinc Oxide Market, by Application
- 1.4.3 Global Zinc Oxide Market, by Form
- 1.4.4 Global Zinc Oxide Market, by Geography
- 1.5 Methodology for the research
Chapter 2. Market At a Glance
- 2.1 Key Highlights
Chapter 3. Market Overview
- 3.1 Introduction
- 3.1.1 Overview
- 3.1.1.1 Market Composition and Scenario
- 3.1.1 Overview
- 3.2 Key Factors Impacting the Market
- 3.2.1 Market Drivers
- 3.2.2 Market Restraints
- 3.3 Porter Five Forces Analysis
Chapter 4. Global Zinc Oxide Market by Process
- 4.1 Global Indirect Market by Region
- 4.2 Global Direct Market by Region
- 4.3 Global Wet Chemical Market by Region
- 4.4 Global Others Market by Region
Chapter 5. Global Zinc Oxide Market by Application
- 5.1 Global Automotive Market by Region
- 5.2 Global Construction Market by Region
- 5.3 Global Paints & Coatings Market by Region
- 5.4 Global Cosmetics & Personal Care Market by Region
- 5.5 Global Pharmaceuticals Market by Region
- 5.6 Global Agriculture Market by Region
- 5.7 Global Others Market by Region
Chapter 6. Global Zinc Oxide Market by Form
- 6.1 Global Powder Market by Region
- 6.2 Global Pellets Market by Region
- 6.3 Global Liquid Market by Region
Chapter 7. Global Zinc Oxide Market by Region
- 7.1 North America Zinc Oxide Market
- 7.1.1 North America Zinc Oxide Market by Process
- 7.1.1.1 North America Indirect Market by Country
- 7.1.1.2 North America Direct Market by Country
- 7.1.1.3 North America Wet Chemical Market by Country
- 7.1.1.4 North America Others Market by Country
- 7.1.2 North America Zinc Oxide Market by Application
- 7.1.2.1 North America Automotive Market by Country
- 7.1.2.2 North America Construction Market by Country
- 7.1.2.3 North America Paints & Coatings Market by Country
- 7.1.2.4 North America Cosmetics & Personal Care Market by Country
- 7.1.2.5 North America Pharmaceuticals Market by Country
- 7.1.2.6 North America Agriculture Market by Country
- 7.1.2.7 North America Others Market by Country
- 7.1.3 North America Zinc Oxide Market by Form
- 7.1.3.1 North America Powder Market by Country
- 7.1.3.2 North America Pellets Market by Country
- 7.1.3.3 North America Liquid Market by Country
- 7.1.4 North America Zinc Oxide Market by Country
- 7.1.4.1 US Zinc Oxide Market
- 7.1.4.1.1 US Zinc Oxide Market by Process
- 7.1.4.1.2 US Zinc Oxide Market by Application
- 7.1.4.1.3 US Zinc Oxide Market by Form
- 7.1.4.2 Canada Zinc Oxide Market
- 7.1.4.2.1 Canada Zinc Oxide Market by Process
- 7.1.4.2.2 Canada Zinc Oxide Market by Application
- 7.1.4.2.3 Canada Zinc Oxide Market by Form
- 7.1.4.3 Mexico Zinc Oxide Market
- 7.1.4.3.1 Mexico Zinc Oxide Market by Process
- 7.1.4.3.2 Mexico Zinc Oxide Market by Application
- 7.1.4.3.3 Mexico Zinc Oxide Market by Form
- 7.1.4.4 Rest of North America Zinc Oxide Market
- 7.1.4.4.1 Rest of North America Zinc Oxide Market by Process
- 7.1.4.4.2 Rest of North America Zinc Oxide Market by Application
- 7.1.4.4.3 Rest of North America Zinc Oxide Market by Form
- 7.1.4.1 US Zinc Oxide Market
- 7.1.1 North America Zinc Oxide Market by Process
- 7.2 Europe Zinc Oxide Market
- 7.2.1 Europe Zinc Oxide Market by Process
- 7.2.1.1 Europe Indirect Market by Country
- 7.2.1.2 Europe Direct Market by Country
- 7.2.1.3 Europe Wet Chemical Market by Country
- 7.2.1.4 Europe Others Market by Country
- 7.2.2 Europe Zinc Oxide Market by Application
- 7.2.2.1 Europe Automotive Market by Country
- 7.2.2.2 Europe Construction Market by Country
- 7.2.2.3 Europe Paints & Coatings Market by Country
- 7.2.2.4 Europe Cosmetics & Personal Care Market by Country
- 7.2.2.5 Europe Pharmaceuticals Market by Country
- 7.2.2.6 Europe Agriculture Market by Country
- 7.2.2.7 Europe Others Market by Country
- 7.2.3 Europe Zinc Oxide Market by Form
- 7.2.3.1 Europe Powder Market by Country
- 7.2.3.2 Europe Pellets Market by Country
- 7.2.3.3 Europe Liquid Market by Country
- 7.2.4 Europe Zinc Oxide Market by Country
- 7.2.4.1 Germany Zinc Oxide Market
- 7.2.4.1.1 Germany Zinc Oxide Market by Process
- 7.2.4.1.2 Germany Zinc Oxide Market by Application
- 7.2.4.1.3 Germany Zinc Oxide Market by Form
- 7.2.4.2 UK Zinc Oxide Market
- 7.2.4.2.1 UK Zinc Oxide Market by Process
- 7.2.4.2.2 UK Zinc Oxide Market by Application
- 7.2.4.2.3 UK Zinc Oxide Market by Form
- 7.2.4.3 France Zinc Oxide Market
- 7.2.4.3.1 France Zinc Oxide Market by Process
- 7.2.4.3.2 France Zinc Oxide Market by Application
- 7.2.4.3.3 France Zinc Oxide Market by Form
- 7.2.4.4 Russia Zinc Oxide Market
- 7.2.4.4.1 Russia Zinc Oxide Market by Process
- 7.2.4.4.2 Russia Zinc Oxide Market by Application
- 7.2.4.4.3 Russia Zinc Oxide Market by Form
- 7.2.4.5 Spain Zinc Oxide Market
- 7.2.4.5.1 Spain Zinc Oxide Market by Process
- 7.2.4.5.2 Spain Zinc Oxide Market by Application
- 7.2.4.5.3 Spain Zinc Oxide Market by Form
- 7.2.4.6 Italy Zinc Oxide Market
- 7.2.4.6.1 Italy Zinc Oxide Market by Process
- 7.2.4.6.2 Italy Zinc Oxide Market by Application
- 7.2.4.6.3 Italy Zinc Oxide Market by Form
- 7.2.4.7 Rest of Europe Zinc Oxide Market
- 7.2.4.7.1 Rest of Europe Zinc Oxide Market by Process
- 7.2.4.7.2 Rest of Europe Zinc Oxide Market by Application
- 7.2.4.7.3 Rest of Europe Zinc Oxide Market by Form
- 7.2.4.1 Germany Zinc Oxide Market
- 7.2.1 Europe Zinc Oxide Market by Process
- 7.3 Asia Pacific Zinc Oxide Market
- 7.3.1 Asia Pacific Zinc Oxide Market by Process
- 7.3.1.1 Asia Pacific Indirect Market by Country
- 7.3.1.2 Asia Pacific Direct Market by Country
- 7.3.1.3 Asia Pacific Wet Chemical Market by Country
- 7.3.1.4 Asia Pacific Others Market by Country
- 7.3.2 Asia Pacific Zinc Oxide Market by Application
- 7.3.2.1 Asia Pacific Automotive Market by Country
- 7.3.2.2 Asia Pacific Construction Market by Country
- 7.3.2.3 Asia Pacific Paints & Coatings Market by Country
- 7.3.2.4 Asia Pacific Cosmetics & Personal Care Market by Country
- 7.3.2.5 Asia Pacific Pharmaceuticals Market by Country
- 7.3.2.6 Asia Pacific Agriculture Market by Country
- 7.3.2.7 Asia Pacific Others Market by Country
- 7.3.3 Asia Pacific Zinc Oxide Market by Form
- 7.3.3.1 Asia Pacific Powder Market by Country
- 7.3.3.2 Asia Pacific Pellets Market by Country
- 7.3.3.3 Asia Pacific Liquid Market by Country
- 7.3.4 Asia Pacific Zinc Oxide Market by Country
- 7.3.4.1 China Zinc Oxide Market
- 7.3.4.1.1 China Zinc Oxide Market by Process
- 7.3.4.1.2 China Zinc Oxide Market by Application
- 7.3.4.1.3 China Zinc Oxide Market by Form
- 7.3.4.2 Japan Zinc Oxide Market
- 7.3.4.2.1 Japan Zinc Oxide Market by Process
- 7.3.4.2.2 Japan Zinc Oxide Market by Application
- 7.3.4.2.3 Japan Zinc Oxide Market by Form
- 7.3.4.3 India Zinc Oxide Market
- 7.3.4.3.1 India Zinc Oxide Market by Process
- 7.3.4.3.2 India Zinc Oxide Market by Application
- 7.3.4.3.3 India Zinc Oxide Market by Form
- 7.3.4.4 South Korea Zinc Oxide Market
- 7.3.4.4.1 South Korea Zinc Oxide Market by Process
- 7.3.4.4.2 South Korea Zinc Oxide Market by Application
- 7.3.4.4.3 South Korea Zinc Oxide Market by Form
- 7.3.4.5 Singapore Zinc Oxide Market
- 7.3.4.5.1 Singapore Zinc Oxide Market by Process
- 7.3.4.5.2 Singapore Zinc Oxide Market by Application
- 7.3.4.5.3 Singapore Zinc Oxide Market by Form
- 7.3.4.6 Malaysia Zinc Oxide Market
- 7.3.4.6.1 Malaysia Zinc Oxide Market by Process
- 7.3.4.6.2 Malaysia Zinc Oxide Market by Application
- 7.3.4.6.3 Malaysia Zinc Oxide Market by Form
- 7.3.4.7 Rest of Asia Pacific Zinc Oxide Market
- 7.3.4.7.1 Rest of Asia Pacific Zinc Oxide Market by Process
- 7.3.4.7.2 Rest of Asia Pacific Zinc Oxide Market by Application
- 7.3.4.7.3 Rest of Asia Pacific Zinc Oxide Market by Form
- 7.3.4.1 China Zinc Oxide Market
- 7.3.1 Asia Pacific Zinc Oxide Market by Process
- 7.4 LAMEA Zinc Oxide Market
- 7.4.1 LAMEA Zinc Oxide Market by Process
- 7.4.1.1 LAMEA Indirect Market by Country
- 7.4.1.2 LAMEA Direct Market by Country
- 7.4.1.3 LAMEA Wet Chemical Market by Country
- 7.4.1.4 LAMEA Others Market by Country
- 7.4.2 LAMEA Zinc Oxide Market by Application
- 7.4.2.1 LAMEA Automotive Market by Country
- 7.4.2.2 LAMEA Construction Market by Country
- 7.4.2.3 LAMEA Paints & Coatings Market by Country
- 7.4.2.4 LAMEA Cosmetics & Personal Care Market by Country
- 7.4.2.5 LAMEA Pharmaceuticals Market by Country
- 7.4.2.6 LAMEA Agriculture Market by Country
- 7.4.2.7 LAMEA Others Market by Country
- 7.4.3 LAMEA Zinc Oxide Market by Form
- 7.4.3.1 LAMEA Powder Market by Country
- 7.4.3.2 LAMEA Pellets Market by Country
- 7.4.3.3 LAMEA Liquid Market by Country
- 7.4.4 LAMEA Zinc Oxide Market by Country
- 7.4.4.1 Brazil Zinc Oxide Market
- 7.4.4.1.1 Brazil Zinc Oxide Market by Process
- 7.4.4.1.2 Brazil Zinc Oxide Market by Application
- 7.4.4.1.3 Brazil Zinc Oxide Market by Form
- 7.4.4.2 Argentina Zinc Oxide Market
- 7.4.4.2.1 Argentina Zinc Oxide Market by Process
- 7.4.4.2.2 Argentina Zinc Oxide Market by Application
- 7.4.4.2.3 Argentina Zinc Oxide Market by Form
- 7.4.4.3 UAE Zinc Oxide Market
- 7.4.4.3.1 UAE Zinc Oxide Market by Process
- 7.4.4.3.2 UAE Zinc Oxide Market by Application
- 7.4.4.3.3 UAE Zinc Oxide Market by Form
- 7.4.4.4 Saudi Arabia Zinc Oxide Market
- 7.4.4.4.1 Saudi Arabia Zinc Oxide Market by Process
- 7.4.4.4.2 Saudi Arabia Zinc Oxide Market by Application
- 7.4.4.4.3 Saudi Arabia Zinc Oxide Market by Form
- 7.4.4.5 South Africa Zinc Oxide Market
- 7.4.4.5.1 South Africa Zinc Oxide Market by Process
- 7.4.4.5.2 South Africa Zinc Oxide Market by Application
- 7.4.4.5.3 South Africa Zinc Oxide Market by Form
- 7.4.4.6 Nigeria Zinc Oxide Market
- 7.4.4.6.1 Nigeria Zinc Oxide Market by Process
- 7.4.4.6.2 Nigeria Zinc Oxide Market by Application
- 7.4.4.6.3 Nigeria Zinc Oxide Market by Form
- 7.4.4.7 Rest of LAMEA Zinc Oxide Market
- 7.4.4.7.1 Rest of LAMEA Zinc Oxide Market by Process
- 7.4.4.7.2 Rest of LAMEA Zinc Oxide Market by Application
- 7.4.4.7.3 Rest of LAMEA Zinc Oxide Market by Form
- 7.4.4.1 Brazil Zinc Oxide Market
- 7.4.1 LAMEA Zinc Oxide Market by Process
Chapter 8. Company Profiles
- 8.1 CCL Industries, Inc.
- 8.1.1 Company Overview
- 8.1.2 Financial Analysis
- 8.1.3 Segmental and Regional Analysis
- 8.1.4 SWOT Analysis
- 8.2 Lanxess AG
- 8.2.1 Company Overview
- 8.2.2 Financial Analysis
- 8.2.3 Segmental and Regional Analysis
- 8.2.4 Research & Development Expenses
- 8.2.5 SWOT Analysis
- 8.3 Tata Chemicals Ltd.
- 8.3.1 Company Overview
- 8.3.2 Financial Analysis
- 8.3.3 Segmental and Regional Analysis
- 8.3.4 SWOT Analysis
- 8.4 Zochem, Inc.
- 8.4.1 Company Overview
- 8.4.2 SWOT Analysis
- 8.5 Toho Zinc Co., Ltd.
- 8.5.1 Company Overview
- 8.5.2 Financial Analysis
- 8.5.3 Segmental and Regional Analysis
- 8.5.4 Research & Development Expenses
- 8.5.5 SWOT Analysis
- 8.6 Pan-Continental Chemical Co., Ltd.
- 8.6.1 Company Overview
- 8.7 Ace Chemie Zynk Energy Limited
- 8.7.1 Company Overview
- 8.8 AG CHEMI GROUP s r. o.
- 8.8.1 Company Overview
- 8.9 HAKUSUI TECH CO., LTD.
- 8.9.1 Company Overview
- 8.10. Mario Pilato Blat SA
- 8.10.1 Company Overview
Chapter 9. Winning imperatives of Zinc Oxide Market
