|
|
市場調査レポート
商品コード
1384897
マネキンの世界市場規模、シェア、産業動向分析レポート:製品タイプ別、材料別、地域別展望と予測、2023年~2030年Global Mannequin Market Size, Share & Industry Trends Analysis Report By Product Type (Women, Men, Children, and Others), By Material (Fiberglass, Plastic, and Others), By Regional Outlook and Forecast, 2023 - 2030 |
||||||
|
|
|||||||
|
|||||||


| マネキンの世界市場規模、シェア、産業動向分析レポート:製品タイプ別、材料別、地域別展望と予測、2023年~2030年 |
|
出版日: 2023年10月31日
発行: KBV Research
ページ情報: 英文 254 Pages
納期: 即納可能
|

- 全表示
- 概要
- 図表
- 目次
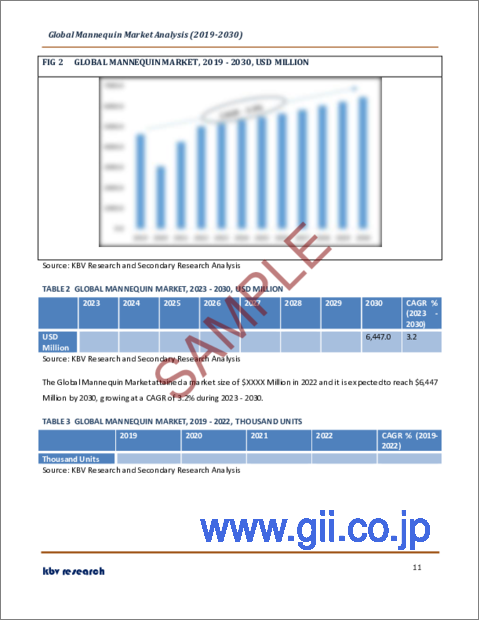
マネキン市場規模は、予測期間中にCAGR 3.2%で成長し、2030年には64億米ドルに達すると予測されます。2022年の市場規模は502万6,300台、成長率は2.8%(2019-2022年)。
しかし、持続可能性と環境への懸念が市場に影を落とし、従来の慣行に課題し、より責任ある環境に優しい製造プロセスへのシフトを促しています。主な悪影響の1つは、持続可能で環境に優しい材料や慣行を採用することに伴う生産コストの増加です。製造業者にとって、代替素材や生産技術への投資はしばしば必要であり、従来の方法よりもコストがかかる場合があります。このような生産コストの増加は、環境に優しいマネキンの価格上昇につながり、価格に敏感な顧客を遠ざける可能性があります。このように、これらの要因はすべて、今後数年間の市場の成長を妨げる可能性があります。
製品タイプの展望
製品タイプによって、市場は女性、男性、子供、その他に分けられます。子供用セグメントは、2022年の市場でかなりの成長率を確保しました。多様な年齢層、体型、民族的背景を表現した子供用そっくりマネキンが入手可能なため、包括性が促進されます。小売業者は、現実世界の多様性を反映したマネキンに子供服を展示することで、より幅広い顧客に対応することができます。着飾った子供マネキンは、売り場全体の美観に貢献します。本物そっくりの外見とスタイリッシュな服装は店の雰囲気を高め、親子連れにとってより視覚的に魅力的で魅力的なショッピング環境を作り出します。
材料の展望
材料別に見ると、市場はガラス繊維、プラスチック、その他に区分されます。2022年の市場では、グラスファイバー製が最大の収益シェアを獲得しました。ガラス繊維製のマネキンは耐久性が高く、小売環境の厳しさに耐えることができます。耐摩耗性に優れているため、小売業者にとっては長持ちする投資となります。この耐久性により、マネキンは長期にわたって魅力的な外観を維持することができます。ファイバーグラスは、非常に詳細でリアルなマネキンのデザインを可能にします。これらのマネキンは、人体のプロポーション、肌の質感、顔の特徴を正確に再現することができます。その耐久性にもかかわらず、グラスファイバー製のマネキンは比較的軽量です。このため、取り扱いや運搬、再配置が容易で、店舗ディスプレイの配置換えを頻繁に行う小売業者にとっては大きな利点となります。
地域別展望
地域別に見ると、市場は北米、欧州、アジア太平洋、LAMEAで分析されます。アジア太平洋地域は、2022年の同市場で最大の収益シェアを獲得しました。小売セクターの拡大、ファッション産業の台頭、ポップアップストア、高級品市場の拡大、カスタマイズ、季節ディスプレイ、持続可能性など、多くの要因がこの地域におけるマネキン需要の拡大を後押ししています。アジア太平洋地域の小売カレンダーは、様々な祭りや祝日で埋め尽くされており、それぞれに季節のディスプレイが必要となります。マネキンは、お祭りや季節のファッション発表会、特別な日のために、テーマに沿ったディスプレイを作るために使用されます。アジア太平洋の多くの国は人気の観光地です。観光客はショッピングを楽しむことが多く、マネキンは観光客の注目を集め、現地のファッションや商品をアピールする重要な役割を担っています。
目次
第1章 市場範囲と調査手法
- 市場の定義
- 目的
- 市場範囲
- セグメンテーション
- 調査手法
第2章 市場の概要
- 主なハイライト
第3章 市場概要
- イントロダクション
- 概要
- 市場構成とシナリオ
- 概要
- 市場に影響を与える主な要因
- 市場促進要因
- 市場抑制要因
- ポーターのファイブフォース分析
第4章 世界のマネキン市場:製品タイプ別
- 世界の女性市場:地域別
- 世界の男性市場:地域別
- 世界の子供市場:地域別
- 世界のその他の市場:地域別
第5章 世界のマネキン市場:材料別
- 世界のグラスファイバー市場:地域別
- 世界のプラスチック市場:地域別
- 世界のその他の市場:地域別
第6章 世界のマネキン市場:地域別
- 北米市場
- 欧州市場
- アジア太平洋市場
- ラテンアメリカ・中東・アフリカ市場
第7章 企業プロファイル
- Able Art Limited
- Genesis Display GMBH
- Best Mannequins BV
- 3S Mannequins Inc(Anays Concept Developers Pvt. Ltd.)
- IDW Display
- EUVEKA
- Abstract Mannequins
- Hans Boodt Manneqins
- Global Mannequins
- Bonaveri Srl
第8章 市場の成功必須条件
LIST OF TABLES
- TABLE 1 Global Mannequin Market, 2019 - 2022, USD Million
- TABLE 2 Global Mannequin Market, 2023 - 2030, USD Million
- TABLE 3 Global Mannequin Market, 2019 - 2022, Thousand Units
- TABLE 4 Global Mannequin Market, 2023 - 2030, Thousand Units
- TABLE 5 Global Mannequin Market, by Product Type, 2019 - 2022, USD Million
- TABLE 6 Global Mannequin Market, by Product Type, 2023 - 2030, USD Million
- TABLE 7 Global Mannequin Market, by Product Type, 2019 - 2022, Thousand Units
- TABLE 8 Global Mannequin Market, by Product Type, 2023 - 2030, Thousand Units
- TABLE 9 Global Women Market, by Region, 2019 - 2022, USD Million
- TABLE 10 Global Women Market, by Region, 2023 - 2030, USD Million
- TABLE 11 Global Women Market, by Region, 2019 - 2022, Thousand Units
- TABLE 12 Global Women Market, by Region, 2023 - 2030, Thousand Units
- TABLE 13 Global Men Market, by Region, 2019 - 2022, USD Million
- TABLE 14 Global Men Market, by Region, 2023 - 2030, USD Million
- TABLE 15 Global Men Market, by Region, 2019 - 2022, Thousand Units
- TABLE 16 Global Men Market, by Region, 2023 - 2030, Thousand Units
- TABLE 17 Global Children Market, by Region, 2019 - 2022, USD Million
- TABLE 18 Global Children Market, by Region, 2023 - 2030, USD Million
- TABLE 19 Global Children Market, by Region, 2019 - 2022, Thousand Units
- TABLE 20 Global Children Market, by Region, 2023 - 2030, Thousand Units
- TABLE 21 Global Others Market, by Region, 2019 - 2022, USD Million
- TABLE 22 Global Others Market, by Region, 2023 - 2030, USD Million
- TABLE 23 Global Others Market, by Region, 2019 - 2022, Thousand Units
- TABLE 24 Global Others Market, by Region, 2023 - 2030, Thousand Units
- TABLE 25 Global Mannequin Market, by Material, 2019 - 2022, USD Million
- TABLE 26 Global Mannequin Market, by Material, 2023 - 2030, USD Million
- TABLE 27 Global Mannequin Market, by Material, 2019 - 2022, Thousand Units
- TABLE 28 Global Mannequin Market, by Material, 2023 - 2030, Thousand Units
- TABLE 29 Global Fiberglass Market, by Region, 2019 - 2022, USD Million
- TABLE 30 Global Fiberglass Market, by Region, 2023 - 2030, USD Million
- TABLE 31 Global Fiberglass Market, by Region, 2019 - 2022, Thousand Units
- TABLE 32 Global Fiberglass Market, by Region, 2023 - 2030, Thousand Units
- TABLE 33 Global Plastic Market, by Region, 2019 - 2022, USD Million
- TABLE 34 Global Plastic Market, by Region, 2023 - 2030, USD Million
- TABLE 35 Global Plastic Market, by Region, 2019 - 2022, Thousand Units
- TABLE 36 Global Plastic Market, by Region, 2023 - 2030, Thousand Units
- TABLE 37 Global Others Market, by Region, 2019 - 2022, USD Million
- TABLE 38 Global Others Market, by Region, 2023 - 2030, USD Million
- TABLE 39 Global Others Market, by Region, 2019 - 2022, Thousand Units
- TABLE 40 Global Others Market, by Region, 2023 - 2030, Thousand Units
- TABLE 41 Global Mannequin Market, by Region, 2019 - 2022, USD Million
- TABLE 42 Global Mannequin Market, by Region, 2023 - 2030, USD Million
- TABLE 43 Global Mannequin Market, by Region, 2019 - 2022, Thousand Units
- TABLE 44 Global Mannequin Market, by Region, 2023 - 2030, Thousand Units
- TABLE 45 North America Mannequin Market, 2019 - 2022, USD Million
- TABLE 46 North America Mannequin Market, 2023 - 2030, USD Million
- TABLE 47 North America Mannequin Market, 2019 - 2022, Thousand Units
- TABLE 48 North America Mannequin Market, 2023 - 2030, Thousand Units
- TABLE 49 North America Mannequin Market, by Product Type, 2019 - 2022, USD Million
- TABLE 50 North America Mannequin Market, by Product Type, 2023 - 2030, USD Million
- TABLE 51 North America Mannequin Market, by Product Type, 2019 - 2022, Thousand Units
- TABLE 52 North America Mannequin Market, by Product Type, 2023 - 2030, Thousand Units
- TABLE 53 North America Women Market, by Country, 2019 - 2022, USD Million
- TABLE 54 North America Women Market, by Country, 2023 - 2030, USD Million
- TABLE 55 North America Women Market, by Country, 2019 - 2022, Thousand Units
- TABLE 56 North America Women Market, by Country, 2023 - 2030, Thousand Units
- TABLE 57 North America Men Market, by Country, 2019 - 2022, USD Million
- TABLE 58 North America Men Market, by Country, 2023 - 2030, USD Million
- TABLE 59 North America Men Market, by Country, 2019 - 2022, Thousand Units
- TABLE 60 North America Men Market, by Country, 2023 - 2030, Thousand Units
- TABLE 61 North America Children Market, by Country, 2019 - 2022, USD Million
- TABLE 62 North America Children Market, by Country, 2023 - 2030, USD Million
- TABLE 63 North America Children Market, by Country, 2019 - 2022, Thousand Units
- TABLE 64 North America Children Market, by Country, 2023 - 2030, Thousand Units
- TABLE 65 North America Others Market, by Country, 2019 - 2022, USD Million
- TABLE 66 North America Others Market, by Country, 2023 - 2030, USD Million
- TABLE 67 North America Others Market, by Country, 2019 - 2022, Thousand Units
- TABLE 68 North America Others Market, by Country, 2023 - 2030, Thousand Units
- TABLE 69 North America Mannequin Market, by Material, 2019 - 2022, USD Million
- TABLE 70 North America Mannequin Market, by Material, 2023 - 2030, USD Million
- TABLE 71 North America Mannequin Market, by Material, 2019 - 2022, Thousand Units
- TABLE 72 North America Mannequin Market, by Material, 2023 - 2030, Thousand Units
- TABLE 73 North America Fiberglass Market, by Country, 2019 - 2022, USD Million
- TABLE 74 North America Fiberglass Market, by Country, 2023 - 2030, USD Million
- TABLE 75 North America Fiberglass Market, by Country, 2019 - 2022, Thousand Units
- TABLE 76 North America Fiberglass Market, by Country, 2023 - 2030, Thousand Units
- TABLE 77 North America Plastic Market, by Country, 2019 - 2022, USD Million
- TABLE 78 North America Plastic Market, by Country, 2023 - 2030, USD Million
- TABLE 79 North America Plastic Market, by Country, 2019 - 2022, Thousand Units
- TABLE 80 North America Plastic Market, by Country, 2023 - 2030, Thousand Units
- TABLE 81 North America Others Market, by Country, 2019 - 2022, USD Million
- TABLE 82 North America Others Market, by Country, 2023 - 2030, USD Million
- TABLE 83 North America Others Market, by Country, 2019 - 2022, Thousand Units
- TABLE 84 North America Others Market, by Country, 2023 - 2030, Thousand Units
- TABLE 85 North America Mannequin Market, by Country, 2019 - 2022, USD Million
- TABLE 86 North America Mannequin Market, by Country, 2023 - 2030, USD Million
- TABLE 87 North America Mannequin Market, by Country, 2019 - 2022, Thousand Units
- TABLE 88 North America Mannequin Market, by Country, 2023 - 2030, Thousand Units
- TABLE 89 US Mannequin Market, 2019 - 2022, USD Million
- TABLE 90 US Mannequin Market, 2023 - 2030, USD Million
- TABLE 91 US Mannequin Market, 2019 - 2022, Thousand Units
- TABLE 92 US Mannequin Market, 2023 - 2030, Thousand Units
- TABLE 93 US Mannequin Market, by Product Type, 2019 - 2022, USD Million
- TABLE 94 US Mannequin Market, by Product Type, 2023 - 2030, USD Million
- TABLE 95 US Mannequin Market, by Product Type, 2019 - 2022, Thousand Units
- TABLE 96 US Mannequin Market, by Product Type, 2023 - 2030, Thousand Units
- TABLE 97 US Mannequin Market, by Material, 2019 - 2022, USD Million
- TABLE 98 US Mannequin Market, by Material, 2023 - 2030, USD Million
- TABLE 99 US Mannequin Market, by Material, 2019 - 2022, Thousand Units
- TABLE 100 US Mannequin Market, by Material, 2023 - 2030, Thousand Units
- TABLE 101 Canada Mannequin Market, 2019 - 2022, USD Million
- TABLE 102 Canada Mannequin Market, 2023 - 2030, USD Million
- TABLE 103 Canada Mannequin Market, 2019 - 2022, Thousand Units
- TABLE 104 Canada Mannequin Market, 2023 - 2030, Thousand Units
- TABLE 105 Canada Mannequin Market, by Product Type, 2019 - 2022, USD Million
- TABLE 106 Canada Mannequin Market, by Product Type, 2023 - 2030, USD Million
- TABLE 107 Canada Mannequin Market, by Product Type, 2019 - 2022, Thousand Units
- TABLE 108 Canada Mannequin Market, by Product Type, 2023 - 2030, Thousand Units
- TABLE 109 Canada Mannequin Market, by Material, 2019 - 2022, USD Million
- TABLE 110 Canada Mannequin Market, by Material, 2023 - 2030, USD Million
- TABLE 111 Canada Mannequin Market, by Material, 2019 - 2022, Thousand Units
- TABLE 112 Canada Mannequin Market, by Material, 2023 - 2030, Thousand Units
- TABLE 113 Mexico Mannequin Market, 2019 - 2022, USD Million
- TABLE 114 Mexico Mannequin Market, 2023 - 2030, USD Million
- TABLE 115 Mexico Mannequin Market, 2019 - 2022, Thousand Units
- TABLE 116 Mexico Mannequin Market, 2023 - 2030, Thousand Units
- TABLE 117 Mexico Mannequin Market, by Product Type, 2019 - 2022, USD Million
- TABLE 118 Mexico Mannequin Market, by Product Type, 2023 - 2030, USD Million
- TABLE 119 Mexico Mannequin Market, by Product Type, 2019 - 2022, Thousand Units
- TABLE 120 Mexico Mannequin Market, by Product Type, 2023 - 2030, Thousand Units
- TABLE 121 Mexico Mannequin Market, by Material, 2019 - 2022, USD Million
- TABLE 122 Mexico Mannequin Market, by Material, 2023 - 2030, USD Million
- TABLE 123 Mexico Mannequin Market, by Material, 2019 - 2022, Thousand Units
- TABLE 124 Mexico Mannequin Market, by Material, 2023 - 2030, Thousand Units
- TABLE 125 Rest of North America Mannequin Market, 2019 - 2022, USD Million
- TABLE 126 Rest of North America Mannequin Market, 2023 - 2030, USD Million
- TABLE 127 Rest of North America Mannequin Market, 2019 - 2022, Thousand Units
- TABLE 128 Rest of North America Mannequin Market, 2023 - 2030, Thousand Units
- TABLE 129 Rest of North America Mannequin Market, by Product Type, 2019 - 2022, USD Million
- TABLE 130 Rest of North America Mannequin Market, by Product Type, 2023 - 2030, USD Million
- TABLE 131 Rest of North America Mannequin Market, by Product Type, 2019 - 2022, Thousand Units
- TABLE 132 Rest of North America Mannequin Market, by Product Type, 2023 - 2030, Thousand Units
- TABLE 133 Rest of North America Mannequin Market, by Material, 2019 - 2022, USD Million
- TABLE 134 Rest of North America Mannequin Market, by Material, 2023 - 2030, USD Million
- TABLE 135 Rest of North America Mannequin Market, by Material, 2019 - 2022, Thousand Units
- TABLE 136 Rest of North America Mannequin Market, by Material, 2023 - 2030, Thousand Units
- TABLE 137 Europe Mannequin Market, 2019 - 2022, USD Million
- TABLE 138 Europe Mannequin Market, 2023 - 2030, USD Million
- TABLE 139 Europe Mannequin Market, 2019 - 2022, Thousand Units
- TABLE 140 Europe Mannequin Market, 2023 - 2030, Thousand Units
- TABLE 141 Europe Mannequin Market, by Product Type, 2019 - 2022, USD Million
- TABLE 142 Europe Mannequin Market, by Product Type, 2023 - 2030, USD Million
- TABLE 143 Europe Mannequin Market, by Product Type, 2019 - 2022, Thousand Units
- TABLE 144 Europe Mannequin Market, by Product Type, 2023 - 2030, Thousand Units
- TABLE 145 Europe Women Market, by Country, 2019 - 2022, USD Million
- TABLE 146 Europe Women Market, by Country, 2023 - 2030, USD Million
- TABLE 147 Europe Women Market, by Country, 2019 - 2022, Thousand Units
- TABLE 148 Europe Women Market, by Country, 2023 - 2030, Thousand Units
- TABLE 149 Europe Men Market, by Country, 2019 - 2022, USD Million
- TABLE 150 Europe Men Market, by Country, 2023 - 2030, USD Million
- TABLE 151 Europe Men Market, by Country, 2019 - 2022, Thousand Units
- TABLE 152 Europe Men Market, by Country, 2023 - 2030, Thousand Units
- TABLE 153 Europe Children Market, by Country, 2019 - 2022, USD Million
- TABLE 154 Europe Children Market, by Country, 2023 - 2030, USD Million
- TABLE 155 Europe Children Market, by Country, 2019 - 2022, Thousand Units
- TABLE 156 Europe Children Market, by Country, 2023 - 2030, Thousand Units
- TABLE 157 Europe Others Market, by Country, 2019 - 2022, USD Million
- TABLE 158 Europe Others Market, by Country, 2023 - 2030, USD Million
- TABLE 159 Europe Others Market, by Country, 2019 - 2022, Thousand Units
- TABLE 160 Europe Others Market, by Country, 2023 - 2030, Thousand Units
- TABLE 161 Europe Mannequin Market, by Material, 2019 - 2022, USD Million
- TABLE 162 Europe Mannequin Market, by Material, 2023 - 2030, USD Million
- TABLE 163 Europe Mannequin Market, by Material, 2019 - 2022, Thousand Units
- TABLE 164 Europe Mannequin Market, by Material, 2023 - 2030, Thousand Units
- TABLE 165 Europe Fiberglass Market, by Country, 2019 - 2022, USD Million
- TABLE 166 Europe Fiberglass Market, by Country, 2023 - 2030, USD Million
- TABLE 167 Europe Fiberglass Market, by Country, 2019 - 2022, Thousand Units
- TABLE 168 Europe Fiberglass Market, by Country, 2023 - 2030, Thousand Units
- TABLE 169 Europe Plastic Market, by Country, 2019 - 2022, USD Million
- TABLE 170 Europe Plastic Market, by Country, 2023 - 2030, USD Million
- TABLE 171 Europe Plastic Market, by Country, 2019 - 2022, Thousand Units
- TABLE 172 Europe Plastic Market, by Country, 2023 - 2030, Thousand Units
- TABLE 173 Europe Others Market, by Country, 2019 - 2022, USD Million
- TABLE 174 Europe Others Market, by Country, 2023 - 2030, USD Million
- TABLE 175 Europe Others Market, by Country, 2019 - 2022, Thousand Units
- TABLE 176 Europe Others Market, by Country, 2023 - 2030, Thousand Units
- TABLE 177 Europe Mannequin Market, by Country, 2019 - 2022, USD Million
- TABLE 178 Europe Mannequin Market, by Country, 2023 - 2030, USD Million
- TABLE 179 Europe Mannequin Market, by Country, 2019 - 2022, Thousand Units
- TABLE 180 Europe Mannequin Market, by Country, 2023 - 2030, Thousand Units
- TABLE 181 Germany Mannequin Market, 2019 - 2022, USD Million
- TABLE 182 Germany Mannequin Market, 2023 - 2030, USD Million
- TABLE 183 Germany Mannequin Market, 2019 - 2022, Thousand Units
- TABLE 184 Germany Mannequin Market, 2023 - 2030, Thousand Units
- TABLE 185 Germany Mannequin Market, by Product Type, 2019 - 2022, USD Million
- TABLE 186 Germany Mannequin Market, by Product Type, 2023 - 2030, USD Million
- TABLE 187 Germany Mannequin Market, by Product Type, 2019 - 2022, Thousand Units
- TABLE 188 Germany Mannequin Market, by Product Type, 2023 - 2030, Thousand Units
- TABLE 189 Germany Mannequin Market, by Material, 2019 - 2022, USD Million
- TABLE 190 Germany Mannequin Market, by Material, 2023 - 2030, USD Million
- TABLE 191 Germany Mannequin Market, by Material, 2019 - 2022, Thousand Units
- TABLE 192 Germany Mannequin Market, by Material, 2023 - 2030, Thousand Units
- TABLE 193 UK Mannequin Market, 2019 - 2022, USD Million
- TABLE 194 UK Mannequin Market, 2023 - 2030, USD Million
- TABLE 195 UK Mannequin Market, 2019 - 2022, Thousand Units
- TABLE 196 UK Mannequin Market, 2023 - 2030, Thousand Units
- TABLE 197 UK Mannequin Market, by Product Type, 2019 - 2022, USD Million
- TABLE 198 UK Mannequin Market, by Product Type, 2023 - 2030, USD Million
- TABLE 199 UK Mannequin Market, by Product Type, 2019 - 2022, Thousand Units
- TABLE 200 UK Mannequin Market, by Product Type, 2023 - 2030, Thousand Units
- TABLE 201 UK Mannequin Market, by Material, 2019 - 2022, USD Million
- TABLE 202 UK Mannequin Market, by Material, 2023 - 2030, USD Million
- TABLE 203 UK Mannequin Market, by Material, 2019 - 2022, Thousand Units
- TABLE 204 UK Mannequin Market, by Material, 2023 - 2030, Thousand Units
- TABLE 205 France Mannequin Market, 2019 - 2022, USD Million
- TABLE 206 France Mannequin Market, 2023 - 2030, USD Million
- TABLE 207 France Mannequin Market, 2019 - 2022, Thousand Units
- TABLE 208 France Mannequin Market, 2023 - 2030, Thousand Units
- TABLE 209 France Mannequin Market, by Product Type, 2019 - 2022, USD Million
- TABLE 210 France Mannequin Market, by Product Type, 2023 - 2030, USD Million
- TABLE 211 France Mannequin Market, by Product Type, 2019 - 2022, Thousand Units
- TABLE 212 France Mannequin Market, by Product Type, 2023 - 2030, Thousand Units
- TABLE 213 France Mannequin Market, by Material, 2019 - 2022, USD Million
- TABLE 214 France Mannequin Market, by Material, 2023 - 2030, USD Million
- TABLE 215 France Mannequin Market, by Material, 2019 - 2022, Thousand Units
- TABLE 216 France Mannequin Market, by Material, 2023 - 2030, Thousand Units
- TABLE 217 Russia Mannequin Market, 2019 - 2022, USD Million
- TABLE 218 Russia Mannequin Market, 2023 - 2030, USD Million
- TABLE 219 Russia Mannequin Market, 2019 - 2022, Thousand Units
- TABLE 220 Russia Mannequin Market, 2023 - 2030, Thousand Units
- TABLE 221 Russia Mannequin Market, by Product Type, 2019 - 2022, USD Million
- TABLE 222 Russia Mannequin Market, by Product Type, 2023 - 2030, USD Million
- TABLE 223 Russia Mannequin Market, by Product Type, 2019 - 2022, Thousand Units
- TABLE 224 Russia Mannequin Market, by Product Type, 2023 - 2030, Thousand Units
- TABLE 225 Russia Mannequin Market, by Material, 2019 - 2022, USD Million
- TABLE 226 Russia Mannequin Market, by Material, 2023 - 2030, USD Million
- TABLE 227 Russia Mannequin Market, by Material, 2019 - 2022, Thousand Units
- TABLE 228 Russia Mannequin Market, by Material, 2023 - 2030, Thousand Units
- TABLE 229 Spain Mannequin Market, 2019 - 2022, USD Million
- TABLE 230 Spain Mannequin Market, 2023 - 2030, USD Million
- TABLE 231 Spain Mannequin Market, 2019 - 2022, Thousand Units
- TABLE 232 Spain Mannequin Market, 2023 - 2030, Thousand Units
- TABLE 233 Spain Mannequin Market, by Product Type, 2019 - 2022, USD Million
- TABLE 234 Spain Mannequin Market, by Product Type, 2023 - 2030, USD Million
- TABLE 235 Spain Mannequin Market, by Product Type, 2019 - 2022, Thousand Units
- TABLE 236 Spain Mannequin Market, by Product Type, 2023 - 2030, Thousand Units
- TABLE 237 Spain Mannequin Market, by Material, 2019 - 2022, USD Million
- TABLE 238 Spain Mannequin Market, by Material, 2023 - 2030, USD Million
- TABLE 239 Spain Mannequin Market, by Material, 2019 - 2022, Thousand Units
- TABLE 240 Spain Mannequin Market, by Material, 2023 - 2030, Thousand Units
- TABLE 241 Italy Mannequin Market, 2019 - 2022, USD Million
- TABLE 242 Italy Mannequin Market, 2023 - 2030, USD Million
- TABLE 243 Italy Mannequin Market, 2019 - 2022, Thousand Units
- TABLE 244 Italy Mannequin Market, 2023 - 2030, Thousand Units
- TABLE 245 Italy Mannequin Market, by Product Type, 2019 - 2022, USD Million
- TABLE 246 Italy Mannequin Market, by Product Type, 2023 - 2030, USD Million
- TABLE 247 Italy Mannequin Market, by Product Type, 2019 - 2022, Thousand Units
- TABLE 248 Italy Mannequin Market, by Product Type, 2023 - 2030, Thousand Units
- TABLE 249 Italy Mannequin Market, by Material, 2019 - 2022, USD Million
- TABLE 250 Italy Mannequin Market, by Material, 2023 - 2030, USD Million
- TABLE 251 Italy Mannequin Market, by Material, 2019 - 2022, Thousand Units
- TABLE 252 Italy Mannequin Market, by Material, 2023 - 2030, Thousand Units
- TABLE 253 Rest of Europe Mannequin Market, 2019 - 2022, USD Million
- TABLE 254 Rest of Europe Mannequin Market, 2023 - 2030, USD Million
- TABLE 255 Rest of Europe Mannequin Market, 2019 - 2022, Thousand Units
- TABLE 256 Rest of Europe Mannequin Market, 2023 - 2030, Thousand Units
- TABLE 257 Rest of Europe Mannequin Market, by Product Type, 2019 - 2022, USD Million
- TABLE 258 Rest of Europe Mannequin Market, by Product Type, 2023 - 2030, USD Million
- TABLE 259 Rest of Europe Mannequin Market, by Product Type, 2019 - 2022, Thousand Units
- TABLE 260 Rest of Europe Mannequin Market, by Product Type, 2023 - 2030, Thousand Units
- TABLE 261 Rest of Europe Mannequin Market, by Material, 2019 - 2022, USD Million
- TABLE 262 Rest of Europe Mannequin Market, by Material, 2023 - 2030, USD Million
- TABLE 263 Rest of Europe Mannequin Market, by Material, 2019 - 2022, Thousand Units
- TABLE 264 Rest of Europe Mannequin Market, by Material, 2023 - 2030, Thousand Units
- TABLE 265 Asia Pacific Mannequin Market, 2019 - 2022, USD Million
- TABLE 266 Asia Pacific Mannequin Market, 2023 - 2030, USD Million
- TABLE 267 Asia Pacific Mannequin Market, 2019 - 2022, Thousand Units
- TABLE 268 Asia Pacific Mannequin Market, 2023 - 2030, Thousand Units
- TABLE 269 Asia Pacific Mannequin Market, by Product Type, 2019 - 2022, USD Million
- TABLE 270 Asia Pacific Mannequin Market, by Product Type, 2023 - 2030, USD Million
- TABLE 271 Asia Pacific Mannequin Market, by Product Type, 2019 - 2022, Thousand Units
- TABLE 272 Asia Pacific Mannequin Market, by Product Type, 2023 - 2030, Thousand Units
- TABLE 273 Asia Pacific Women Market, by Country, 2019 - 2022, USD Million
- TABLE 274 Asia Pacific Women Market, by Country, 2023 - 2030, USD Million
- TABLE 275 Asia Pacific Women Market, by Country, 2019 - 2022, Thousand Units
- TABLE 276 Asia Pacific Women Market, by Country, 2023 - 2030, Thousand Units
- TABLE 277 Asia Pacific Men Market, by Country, 2019 - 2022, USD Million
- TABLE 278 Asia Pacific Men Market, by Country, 2023 - 2030, USD Million
- TABLE 279 Asia Pacific Men Market, by Country, 2019 - 2022, Thousand Units
- TABLE 280 Asia Pacific Men Market, by Country, 2023 - 2030, Thousand Units
- TABLE 281 Asia Pacific Children Market, by Country, 2019 - 2022, USD Million
- TABLE 282 Asia Pacific Children Market, by Country, 2023 - 2030, USD Million
- TABLE 283 Asia Pacific Children Market, by Country, 2019 - 2022, Thousand Units
- TABLE 284 Asia Pacific Children Market, by Country, 2023 - 2030, Thousand Units
- TABLE 285 Asia Pacific Others Market, by Country, 2019 - 2022, USD Million
- TABLE 286 Asia Pacific Others Market, by Country, 2023 - 2030, USD Million
- TABLE 287 Asia Pacific Others Market, by Country, 2019 - 2022, Thousand Units
- TABLE 288 Asia Pacific Others Market, by Country, 2023 - 2030, Thousand Units
- TABLE 289 Asia Pacific Mannequin Market, by Material, 2019 - 2022, USD Million
- TABLE 290 Asia Pacific Mannequin Market, by Material, 2023 - 2030, USD Million
- TABLE 291 Asia Pacific Mannequin Market, by Material, 2019 - 2022, Thousand Units
- TABLE 292 Asia Pacific Mannequin Market, by Material, 2023 - 2030, Thousand Units
- TABLE 293 Asia Pacific Fiberglass Market, by Country, 2019 - 2022, USD Million
- TABLE 294 Asia Pacific Fiberglass Market, by Country, 2023 - 2030, USD Million
- TABLE 295 Asia Pacific Fiberglass Market, by Country, 2019 - 2022, Thousand Units
- TABLE 296 Asia Pacific Fiberglass Market, by Country, 2023 - 2030, Thousand Units
- TABLE 297 Asia Pacific Plastic Market, by Country, 2019 - 2022, USD Million
- TABLE 298 Asia Pacific Plastic Market, by Country, 2023 - 2030, USD Million
- TABLE 299 Asia Pacific Plastic Market, by Country, 2019 - 2022, Thousand Units
- TABLE 300 Asia Pacific Plastic Market, by Country, 2023 - 2030, Thousand Units
- TABLE 301 Asia Pacific Others Market, by Country, 2019 - 2022, USD Million
- TABLE 302 Asia Pacific Others Market, by Country, 2023 - 2030, USD Million
- TABLE 303 Asia Pacific Others Market, by Country, 2019 - 2022, Thousand Units
- TABLE 304 Asia Pacific Others Market, by Country, 2023 - 2030, Thousand Units
- TABLE 305 Asia Pacific Mannequin Market, by Country, 2019 - 2022, USD Million
- TABLE 306 Asia Pacific Mannequin Market, by Country, 2023 - 2030, USD Million
- TABLE 307 Asia Pacific Mannequin Market, by Country, 2019 - 2022, Thousand Units
- TABLE 308 Asia Pacific Mannequin Market, by Country, 2023 - 2030, Thousand Units
The Global Mannequin Market size is expected to reach $6.4 billion by 2030, rising at a market growth of 3.2% CAGR during the forecast period. In the year 2022, the market attained a volume of 5,026.3 thousand units, experiencing a growth of 2.8% (2019-2022).
The retail industry continues to grow in North America, driven by population growth and economic stability. As new stores and shopping centers open, retailers require mannequins to create attractive and engaging displays to showcase their products. Therefore, the North American region would register 1/4th share of the market by 2030. The concept of pop-up stores has gained popularity in North America. These temporary retail spaces rely on mannequins to quickly set up attractive displays and engage customers during short-term retail events. Some of the factors impacting the market are expansion of the apparel and fashion industry, rapid integration of technology in mannequins, and sustainability & environmental concerns.
The apparel and fashion industry places immense emphasis on visual merchandising to engage and attract customers. Mannequins serve as essential tools in this process, helping retailers create eye-catching displays that showcase the latest trends and collections. The result is a dynamic and immersive shopping environment that captures the essence of a brand's designs. In the fast-paced fashion world, seasonal collections and changing trends are the norm. Mannequins are versatile tools that can be easily updated to reflect these shifts. They enable retailers to swiftly adapt to new styles, ensuring that the latest designs are prominently displayed and readily available to customers. Additionally, one of the most notable positive impacts of technology integration is the ability to create interactive and engaging displays. Mannequins equipped with digital screens, augmented reality (AR) features and interactive touchscreens have revolutionized the way retailers connect with their customers. These interactive mannequins can provide real-time product information, styling tips, and even virtual try-on experiences. A customer can make a more informed purchase decision, for instance, by scanning a QR code on a mannequin's display to instantly see how a particular outfit would look on them. Technology has aided in creating a more immersive and customer-centric shopping experience. Thus, the technological integration in mannequins has increased their demand, which in turn will aid in the expansion of the market.
However, sustainability and environmental concerns have cast a shadow over the market, challenging its traditional practices and prompting a shift towards more responsible and eco-friendly manufacturing processes. One of the key negative impacts is the increased production costs associated with adopting sustainable and environmentally friendly materials and practices. It is frequently necessary for manufacturers to make investments in alternative materials and production techniques, which can be more costly than traditional methods. This increase in production costs can lead to higher prices for eco-friendly mannequins, potentially deterring price-sensitive customers. Thus, all of these factors may hamper the growth of the market in the coming years.
Product Type Outlook
Based on product type, the market is divided into women, men, children, and others. The children segment procured a considerable growth rate in the market in 2022. The availability of children's lookalike mannequins representing diverse age groups, body types, and ethnic backgrounds promotes inclusivity. Retailers can cater to a broader range of customers by displaying their children's clothing on mannequins that reflect real-world diversity. Well-dressed children mannequins contribute to the overall aesthetics of the retail space. Their life-like appearance and stylish clothing enhance the ambiance of the store, creating a more visually appealing and inviting shopping environment for parents and children.
Material Outlook
On the basis of the material, the market is segmented into fiberglass, plastic, and others. The fiberglass segment acquired the largest revenue share in the market in 2022. Fiberglass mannequins are highly durable and can withstand the rigors of the retail environment. They are resistant to wear and tear, making them a long-lasting investment for retailers. This durability ensures that the mannequins maintain their attractive appearance over time. Fiberglass allows for highly detailed and realistic mannequin designs. These mannequins can accurately replicate human body proportions, skin textures, and facial features. Despite their durability, fiberglass mannequins are relatively lightweight. This makes them easy to handle, transport, and reposition, a significant advantage for retailers who frequently rearrange store displays.
Regional Outlook
Region-wise, the market is analyzed across North America, Europe, Asia Pacific, and LAMEA. The Asia Pacific region garnered the maximum revenue share in the market in 2022. A number of factors, including the expansion of the retail sector, the rise of the fashion industry, pop-up stores, the expansion of the luxury market, customization, seasonal displays, and sustainability, are driving the growing demand for mannequins in the region. The retail calendar in the Asia Pacific is filled with various festivals and holidays, each requiring seasonal displays. Mannequins are used to create themed displays for festivals, seasonal fashion launches, and special occasions. Many countries in the Asia Pacific are popular tourist destinations. Tourists often engage in shopping, and mannequins play a crucial role in attracting their attention and promoting local fashion and products.
The market research report covers the analysis of key stake holders of the market. Key companies profiled in the report include Able Art Limited, Genesis Display GMBH, Best Mannequins BV, 3S Mannequins Inc. (Anasys Concept Developers Pvt. Ltd.), IDW Display, EUVEKA, Abstract Mannequins, Hans Boodt Manneqins, Global Mannequins, and Bonaveri Srl.
Scope of the Study
Market Segments covered in the Report:
By Product Type (Volume, Thousand Units, USD Million, 2019-2030)
- Women
- Men
- Children
- Others
By Material (Volume, Thousand Units, USD Million, 2019-2030)
- Fiberglass
- Plastic
- Others
By Geography (Volume, Thousand Units, USD Million, 2019-2030)
- North America
- US
- Canada
- Mexico
- Rest of North America
- Europe
- Germany
- UK
- France
- Russia
- Spain
- Italy
- Rest of Europe
- Asia Pacific
- China
- Japan
- India
- South Korea
- Singapore
- Malaysia
- Rest of Asia Pacific
- LAMEA
- Brazil
- Argentina
- UAE
- Saudi Arabia
- South Africa
- Nigeria
- Rest of LAMEA
Companies Profiled
- Able Art Limited
- Genesis Display GMBH
- Best Mannequins BV
- 3S Mannequins Inc. (Anasys Concept Developers Pvt. Ltd.)
- IDW Display
- EUVEKA
- Abstract Mannequins
- Hans Boodt Manneqins
- Global Mannequins
- Bonaveri Srl
Unique Offerings from KBV Research
- Exhaustive coverage
- Highest number of market tables and figures
- Subscription based model available
- Guaranteed best price
- Assured post sales research support with 10% customization free
Table of Contents
Chapter 1. Market Scope & Methodology
- 1.1 Market Definition
- 1.2 Objectives
- 1.3 Market Scope
- 1.4 Segmentation
- 1.4.1 Global Mannequin Market, by Product Type
- 1.4.2 Global Mannequin Market, by Material
- 1.4.3 Global Mannequin Market, by Geography
- 1.5 Methodology for the research
Chapter 2. Market at a Glance
- 2.1 Key Highlights
Chapter 3. Market Overview
- 3.1 Introduction
- 3.1.1 Overview
- 3.1.1.1 Market Composition and Scenario
- 3.1.1 Overview
- 3.2 Key Factors Impacting the Market
- 3.2.1 Market Drivers
- 3.2.2 Market Restraints
- 3.3 Porter's Five Forces Analysis
Chapter 4. Global Mannequin Market, by Product Type
- 4.1 Global Women Market, by Region
- 4.2 Global Men Market, by Region
- 4.3 Global Children Market, by Region
- 4.4 Global Others Market, by Region
Chapter 5. Global Mannequin Market, by Material
- 5.1 Global Fiberglass Market, by Region
- 5.2 Global Plastic Market, by Region
- 5.3 Global Others Market, by Region
Chapter 6. Global Mannequin Market, by Region
- 6.1 North America Mannequin Market
- 6.1.1 North America Mannequin Market, by Product Type
- 6.1.1.1 North America Women Market, by Country
- 6.1.1.2 North America Men Market, by Country
- 6.1.1.3 North America Children Market, by Country
- 6.1.1.4 North America Others Market, by Country
- 6.1.2 North America Mannequin Market, by Material
- 6.1.2.1 North America Fiberglass Market, by Country
- 6.1.2.2 North America Plastic Market, by Country
- 6.1.2.3 North America Others Market, by Country
- 6.1.3 North America Mannequin Market, by Country
- 6.1.3.1 US Mannequin Market
- 6.1.3.1.1 US Mannequin Market, by Product Type
- 6.1.3.1.2 US Mannequin Market, by Material
- 6.1.3.2 Canada Mannequin Market
- 6.1.3.2.1 Canada Mannequin Market, by Product Type
- 6.1.3.2.2 Canada Mannequin Market, by Material
- 6.1.3.3 Mexico Mannequin Market
- 6.1.3.3.1 Mexico Mannequin Market, by Product Type
- 6.1.3.3.2 Mexico Mannequin Market, by Material
- 6.1.3.4 Rest of North America Mannequin Market
- 6.1.3.4.1 Rest of North America Mannequin Market, by Product Type
- 6.1.3.4.2 Rest of North America Mannequin Market, by Material
- 6.1.3.1 US Mannequin Market
- 6.1.1 North America Mannequin Market, by Product Type
- 6.2 Europe Mannequin Market
- 6.2.1 Europe Mannequin Market, by Product Type
- 6.2.1.1 Europe Women Market, by Country
- 6.2.1.2 Europe Men Market, by Country
- 6.2.1.3 Europe Children Market, by Country
- 6.2.1.4 Europe Others Market, by Country
- 6.2.2 Europe Mannequin Market, by Material
- 6.2.2.1 Europe Fiberglass Market, by Country
- 6.2.2.2 Europe Plastic Market, by Country
- 6.2.2.3 Europe Others Market, by Country
- 6.2.3 Europe Mannequin Market, by Country
- 6.2.3.1 Germany Mannequin Market
- 6.2.3.1.1 Germany Mannequin Market, by Product Type
- 6.2.3.1.2 Germany Mannequin Market, by Material
- 6.2.3.2 UK Mannequin Market
- 6.2.3.2.1 UK Mannequin Market, by Product Type
- 6.2.3.2.2 UK Mannequin Market, by Material
- 6.2.3.3 France Mannequin Market
- 6.2.3.3.1 France Mannequin Market, by Product Type
- 6.2.3.3.2 France Mannequin Market, by Material
- 6.2.3.4 Russia Mannequin Market
- 6.2.3.4.1 Russia Mannequin Market, by Product Type
- 6.2.3.4.2 Russia Mannequin Market, by Material
- 6.2.3.5 Spain Mannequin Market
- 6.2.3.5.1 Spain Mannequin Market, by Product Type
- 6.2.3.5.2 Spain Mannequin Market, by Material
- 6.2.3.6 Italy Mannequin Market
- 6.2.3.6.1 Italy Mannequin Market, by Product Type
- 6.2.3.6.2 Italy Mannequin Market, by Material
- 6.2.3.7 Rest of Europe Mannequin Market
- 6.2.3.7.1 Rest of Europe Mannequin Market, by Product Type
- 6.2.3.7.2 Rest of Europe Mannequin Market, by Material
- 6.2.3.1 Germany Mannequin Market
- 6.2.1 Europe Mannequin Market, by Product Type
- 6.3 Asia Pacific Mannequin Market
- 6.3.1 Asia Pacific Mannequin Market, by Product Type
- 6.3.1.1 Asia Pacific Women Market, by Country
- 6.3.1.2 Asia Pacific Men Market, by Country
- 6.3.1.3 Asia Pacific Children Market, by Country
- 6.3.1.4 Asia Pacific Others Market, by Country
- 6.3.2 Asia Pacific Mannequin Market, by Material
- 6.3.2.1 Asia Pacific Fiberglass Market, by Country
- 6.3.2.2 Asia Pacific Plastic Market, by Country
- 6.3.2.3 Asia Pacific Others Market, by Country
- 6.3.3 Asia Pacific Mannequin Market, by Country
- 6.3.3.1 China Mannequin Market
- 6.3.3.1.1 China Mannequin Market, by Product Type
- 6.3.3.1.2 China Mannequin Market, by Material
- 6.3.3.2 Japan Mannequin Market
- 6.3.3.2.1 Japan Mannequin Market, by Product Type
- 6.3.3.2.2 Japan Mannequin Market, by Material
- 6.3.3.3 India Mannequin Market
- 6.3.3.3.1 India Mannequin Market, by Product Type
- 6.3.3.3.2 India Mannequin Market, by Material
- 6.3.3.4 South Korea Mannequin Market
- 6.3.3.4.1 South Korea Mannequin Market, by Product Type
- 6.3.3.4.2 South Korea Mannequin Market, by Material
- 6.3.3.5 Singapore Mannequin Market
- 6.3.3.5.1 Singapore Mannequin Market, by Product Type
- 6.3.3.5.2 Singapore Mannequin Market, by Material
- 6.3.3.6 Malaysia Mannequin Market
- 6.3.3.6.1 Malaysia Mannequin Market, by Product Type
- 6.3.3.6.2 Malaysia Mannequin Market, by Material
- 6.3.3.7 Rest of Asia Pacific Mannequin Market
- 6.3.3.7.1 Rest of Asia Pacific Mannequin Market, by Product Type
- 6.3.3.7.2 Rest of Asia Pacific Mannequin Market, by Material
- 6.3.3.1 China Mannequin Market
- 6.3.1 Asia Pacific Mannequin Market, by Product Type
- 6.4 LAMEA Mannequin Market
- 6.4.1 LAMEA Mannequin Market, by Product Type
- 6.4.1.1 LAMEA Women Market, by Country
- 6.4.1.2 LAMEA Men Market, by Country
- 6.4.1.3 LAMEA Children Market, by Country
- 6.4.1.4 LAMEA Others Market, by Country
- 6.4.2 LAMEA Mannequin Market, by Material
- 6.4.2.1 LAMEA Fiberglass Market, by Country
- 6.4.2.2 LAMEA Plastic Market, by Country
- 6.4.2.3 LAMEA Others Market, by Country
- 6.4.3 LAMEA Mannequin Market, by Country
- 6.4.3.1 Brazil Mannequin Market
- 6.4.3.1.1 Brazil Mannequin Market, by Product Type
- 6.4.3.1.2 Brazil Mannequin Market, by Material
- 6.4.3.2 Argentina Mannequin Market
- 6.4.3.2.1 Argentina Mannequin Market, by Product Type
- 6.4.3.2.2 Argentina Mannequin Market, by Material
- 6.4.3.3 UAE Mannequin Market
- 6.4.3.3.1 UAE Mannequin Market, by Product Type
- 6.4.3.3.2 UAE Mannequin Market, by Material
- 6.4.3.4 Saudi Arabia Mannequin Market
- 6.4.3.4.1 Saudi Arabia Mannequin Market, by Product Type
- 6.4.3.4.2 Saudi Arabia Mannequin Market, by Material
- 6.4.3.5 South Africa Mannequin Market
- 6.4.3.5.1 South Africa Mannequin Market, by Product Type
- 6.4.3.5.2 South Africa Mannequin Market, by Material
- 6.4.3.6 Nigeria Mannequin Market
- 6.4.3.6.1 Nigeria Mannequin Market, by Product Type
- 6.4.3.6.2 Nigeria Mannequin Market, by Material
- 6.4.3.7 Rest of LAMEA Mannequin Market
- 6.4.3.7.1 Rest of LAMEA Mannequin Market, by Product Type
- 6.4.3.7.2 Rest of LAMEA Mannequin Market, by Material
- 6.4.3.1 Brazil Mannequin Market
- 6.4.1 LAMEA Mannequin Market, by Product Type
Chapter 7. Company Profiles
- 7.1 Able Art Limited
- 7.1.1 Company Overview
- 7.1.2 SWOT Analysis
- 7.2 Genesis Display GMBH
- 7.2.1 Company Overview
- 7.2.2 SWOT Analysis
- 7.3 Best Mannequins BV
- 7.3.1 Company Overview
- 7.3.2 SWOT Analysis
- 7.4 3S Mannequins Inc. (Anays Concept Developers Pvt. Ltd.)
- 7.4.1 Company Overview
- 7.4.2 SWOT Analysis
- 7.5 IDW Display
- 7.5.1 Company Overview
- 7.5.2 SWOT Analysis
- 7.6 EUVEKA
- 7.6.1 Company Overview
- 7.6.2 SWOT Analysis
- 7.7 Abstract Mannequins
- 7.7.1 Company Overview
- 7.7.2 SWOT Analysis
- 7.8 Hans Boodt Manneqins
- 7.8.1 Company Overview
- 7.8.2 SWOT Analysis
- 7.9 Global Mannequins
- 7.9.1 Company Overview
- 7.9.2 SWOT Analysis
- 7.10. Bonaveri Srl
- 7.10.1 Company Overview
- 7.10.2 SWOT Analysis
