|
|
市場調査レポート
商品コード
1373629
アンモニアの世界市場規模、シェア、産業動向分析レポート:製品形態別、用途別、地域別の展望と予測、2023年~2030年Global Ammonia Market Size, Share & Industry Trends Analysis Report By Product Form (Anhydrous, and Aqueous), By Application (Fertilizers, Refrigerants, Pharmaceuticals, Textile), By Regional Outlook and Forecast, 2023 - 2030 |
||||||
|
|
|||||||
|
|||||||


| アンモニアの世界市場規模、シェア、産業動向分析レポート:製品形態別、用途別、地域別の展望と予測、2023年~2030年 |
|
出版日: 2023年09月30日
発行: KBV Research
ページ情報: 英文 288 Pages
納期: 即納可能
|

- 全表示
- 概要
- 図表
- 目次
アンモニア市場規模は、予測期間中にCAGR 5.6%で成長し、2030年には3,067億米ドルに達すると予測されます。2022年の市場規模は2,13,071.9キロトンに達し、4.6%の成長率を記録する(2019-2022年)。
さらに、鉱業は爆薬、特に硝酸アンモニウムベースの爆薬を製造するためにアンモニアに依存しています。硝酸アンモニウムは、発破や掘削などの作業に鉱業や建設部門で使用される重要な成分です。硝酸アンモニウムは、浸出や鉱石の精錬などの冶金プロセスにおいて、浸出剤や溶媒として使用されます。鉱石から貴重な金属を抽出する役割を果たします。アンモニアは、一部の採掘作業で粉塵抑制のために使用されます。粉塵を抑制し、採掘環境の安全性を向上させることができます。農業以外にも用途を拡大することで、アンモニア市場は多様化し、単一分野への依存度が低下しています。鉱業のアンモニア需要は、採掘活動の拡大に伴って伸びており、特に採掘事業が盛んな新興経済国での需要が伸びています。以上のような要因が、今後数年間の市場成長を牽引すると思われます。
しかし、個人の大半は蒸気やガスを吸入することでNH3にさらされています。この物質は自然界に存在し、クリーニング製品にも含まれているため、人々はそうした発生源にさらされている可能性が高いです。NH3は、目、表皮、呼吸器、口腔に接触すると直ちに影響を及ぼします。溶液や空気中のアンモニア濃度が低いと、目や表皮を急速に刺激します。濃度が高くなると、重度の火傷や傷害を引き起こす可能性があります。工業用洗浄剤のような高濃度の溶液と接触すると、皮膚火傷や永久的な目の損傷、失明などの腐食性傷害を引き起こす可能性があります。これらの影響に加え、高濃度の溶液を飲み込むと、胃、喉、口に腐食性の害をもたらします。今後、市場の成長はこうした要因によって妨げられると思われます。
製品形態の展望
製品形態によって、市場は水系と無水系に区分されます。2022年には、水性セグメントが市場でかなりの収益シェアを獲得しました。これは、取り扱いが容易で生産者が容易に入手できるためです。さらに、NH3をベースとする窒素肥料は、収量の向上、作物の効果的な保護、農業サイクルの改善をもたらします。窒素含有率が82%と高いため、この無水製品をベースにした肥料は農業で広く利用されています。しかし、この肥料は気温が低いときよりも高いときの方が効果が高いです。その刺激臭と高い気化温度により、無水アンモニアは溶剤や冷媒として有用です。液化NH3は合成繊維、医薬品の製造、鉱石からの金属採掘にも利用されます。
アプリケーションの展望
用途に基づき、市場は肥料、冷媒、医薬品、繊維、その他に細分化されます。2022年には、肥料分野が市場で最も高い収益シェアを占めました。窒素肥料は溶解性が高く、植物が迅速かつ効果的に吸収できるため、農家はますます窒素肥料を利用するようになっています。つまり、窒素肥料は、分解して栄養素を放出するのに時間を要する有機肥料よりも、植物の成長に必要な窒素を迅速に供給できるのです。アンモニアは最も頻繁に利用される窒素肥料のひとつで、窒素産業の基本化合物です。また、NH3ベースの肥料は様々な形態で製造することができ、様々な農業環境と作物に適合させることができます。
地域別展望
地域別に見ると、市場は北米、欧州、アジア太平洋、LAMEAで分析されます。2022年には、アジア太平洋地域が市場で最も高い収益シェアを生み出しました。アジア太平洋地域は、中国、インド、日本などの国々からの大量消費により市場を独占しています。中国は世界最大のアンモニア生産・消費国のひとつです。同国のアンモニア需要は、肥料、繊維、医薬品、鉱業などの農業産業における用途の増加により増加しています。中国は窒素(N)肥料の消費量で世界をリードしています。日本は繊維生産で長い伝統を持ち、技術用繊維の最大手メーカーの1つです。したがって、上記のすべての要因が予測期間中の市場需要を増加させる可能性が高いです。
目次
第1章 市場範囲と調査手法
- 市場の定義
- 目的
- 市場範囲
- セグメンテーション
- 調査手法
第2章 市場の概要
- 主なハイライト
第3章 市場概要
- イントロダクション
- 概要
- 市場構成とシナリオ
- 概要
- 市場に影響を与える主な要因
- 市場促進要因
- 市場抑制要因
- ポーターファイブフォース分析
第4章 アンモニア市場で展開される戦略
第5章 世界のアンモニア市場:製品形態別
- 世界の無水市場:地域別
- 世界の水市場:地域別
第6章 世界の市場:、アプリケーション別
- 世界の肥料市場:地域別
- 世界の冷媒市場:地域別
- 世界の医薬品市場:地域別
- 世界の繊維市場:地域別
- 世界のその他の市場:地域別
第7章 世界の市場:、地域別
- 北米の市場
- 北米の市場:製品形態別
- 北米の国別無水市場
- 北米の国別水市場
- 北米の市場:用途別
- 北米の国別肥料市場
- 北米の国別冷媒市場
- 国別の北米医薬品市場
- 国別の北米繊維市場
- 北米その他の国別市場
- 北米の市場:国別
- 米国のアンモニア市場
- メキシコのアンモニア市場
- カナダのアンモニア市場
- 残りの北米の市場
- 北米の市場:製品形態別
- 欧州の市場
- 欧州の市場:製品形態別
- 欧州の国別無水市場
- 欧州の国別水市場
- 欧州の市場:用途別
- 欧州の国別肥料市場
- 欧州の国別冷媒市場
- 国別の欧州医薬品市場
- 国別の欧州繊維市場
- 欧州その他の国別市場
- 欧州の市場:国別
- ロシアのアンモニア市場
- フランスのアンモニア市場
- ドイツのアンモニア市場
- 英国のアンモニア市場
- スペインのアンモニア市場
- イタリアのアンモニア市場
- 残りの欧州の市場
- 欧州の市場:製品形態別
- アジア太平洋の市場
- アジア太平洋の市場:製品形態別
- アジア太平洋地域の国別無水市場
- アジア太平洋地域の国別水市場
- アジア太平洋の市場:用途別
- アジア太平洋地域の国別肥料市場
- アジア太平洋地域の国別冷媒市場
- アジア太平洋地域の国別医薬品市場
- 国別のアジア太平洋繊維市場
- アジア太平洋地域その他の国別市場
- アジア太平洋の市場:国別
- 中国アンモニア市場
- インドのアンモニア市場
- タイのアンモニア市場
- 日本のアンモニア市場
- 韓国のアンモニア市場
- オーストラリアのアンモニア市場
- 残りのアジア太平洋の市場
- アジア太平洋の市場:製品形態別
- ラテンアメリカ・中東・アフリカの市場
- ラテンアメリカ・中東・アフリカの市場:製品形態別
- 国別LAMEA無水市場
- 国別LAMEA水市場
- ラテンアメリカ・中東・アフリカの市場:用途別
- 国別のLAMEA肥料市場
- 国別LAMEA冷媒市場
- 国別のLAMEA医薬品市場
- 国別LAMEA繊維市場
- 国別LAMEAその他市場
- ラテンアメリカ・中東・アフリカの市場:国別
- ブラジルのアンモニア市場
- アルゼンチンのアンモニア市場
- 南アフリカのアンモニア市場
- ナイジェリアのアンモニア市場
- モロッコのアンモニア市場
- チリのアンモニア市場
- 残りのラテンアメリカ・中東・アフリカの市場
- ラテンアメリカ・中東・アフリカの市場:製品形態別
第8章 企業プロファイル
- SABIC(Saudi Arabian Oil Company)
- Linde PLC
- Yara International ASA
- Nutrien Limited
- BASF SE
- Sumitomo Chemical Co, Ltd.
- Koch Industries, Inc(Molex LLC)
- CF Industries Holdings, Inc
- Qatar Fertiliser Company(Industries Qatar)
- PJSC Togliattiazot
第9章 アンモニア市場の勝利の必須条件
LIST OF TABLES
- TABLE 1 Global Ammonia Market, 2019 - 2022, USD Million
- TABLE 2 Global Ammonia Market, 2023 - 2030, USD Million
- TABLE 3 Global Ammonia Market, 2019 - 2022, Kilo Tonnes
- TABLE 4 Global Ammonia Market, 2023 - 2030, Kilo Tonnes
- TABLE 5 Global Ammonia Market, By Product Form, 2019 - 2022, USD Million
- TABLE 6 Global Ammonia Market, By Product Form, 2023 - 2030, USD Million
- TABLE 7 Global Ammonia Market, By Product Form, 2019 - 2022, Kilo Tonnes
- TABLE 8 Global Ammonia Market, By Product Form, 2023 - 2030, Kilo Tonnes
- TABLE 9 Global Anhydrous Market, By Region, 2019 - 2022, USD Million
- TABLE 10 Global Anhydrous Market, By Region, 2023 - 2030, USD Million
- TABLE 11 Global Anhydrous Market, By Region, 2019 - 2022, Kilo Tonnes
- TABLE 12 Global Anhydrous Market, By Region, 2023 - 2030, Kilo Tonnes
- TABLE 13 Global Aqueous Market, By Region, 2019 - 2022, USD Million
- TABLE 14 Global Aqueous Market, By Region, 2023 - 2030, USD Million
- TABLE 15 Global Aqueous Market, By Region, 2019 - 2022, Kilo Tonnes
- TABLE 16 Global Aqueous Market, By Region, 2023 - 2030, Kilo Tonnes
- TABLE 17 Global Ammonia Market, By Application, 2019 - 2022, USD Million
- TABLE 18 Global Ammonia Market, By Application, 2023 - 2030, USD Million
- TABLE 19 Global Ammonia Market, By Application, 2019 - 2022, Kilo Tonnes
- TABLE 20 Global Ammonia Market, By Application, 2023 - 2030, Kilo Tonnes
- TABLE 21 Global Fertilizers Market, By Region, 2019 - 2022, USD Million
- TABLE 22 Global Fertilizers Market, By Region, 2023 - 2030, USD Million
- TABLE 23 Global Fertilizers Market, By Region, 2019 - 2022, Kilo Tonnes
- TABLE 24 Global Fertilizers Market, By Region, 2023 - 2030, Kilo Tonnes
- TABLE 25 Global Refrigerants Market, By Region, 2019 - 2022, USD Million
- TABLE 26 Global Refrigerants Market, By Region, 2023 - 2030, USD Million
- TABLE 27 Global Refrigerants Market, By Region, 2019 - 2022, Kilo Tonnes
- TABLE 28 Global Refrigerants Market, By Region, 2023 - 2030, Kilo Tonnes
- TABLE 29 Global Pharmaceuticals Market, By Region, 2019 - 2022, USD Million
- TABLE 30 Global Pharmaceuticals Market, By Region, 2023 - 2030, USD Million
- TABLE 31 Global Pharmaceuticals Market, By Region, 2019 - 2022, Kilo Tonnes
- TABLE 32 Global Pharmaceuticals Market, By Region, 2023 - 2030, Kilo Tonnes
- TABLE 33 Global Textile Market, By Region, 2019 - 2022, USD Million
- TABLE 34 Global Textile Market, By Region, 2023 - 2030, USD Million
- TABLE 35 Global Textile Market, By Region, 2019 - 2022, Kilo Tonnes
- TABLE 36 Global Textile Market, By Region, 2023 - 2030, Kilo Tonnes
- TABLE 37 Global Others Market, By Region, 2019 - 2022, USD Million
- TABLE 38 Global Others Market, By Region, 2023 - 2030, USD Million
- TABLE 39 Global Others Market, By Region, 2019 - 2022, Kilo Tonnes
- TABLE 40 Global Others Market, By Region, 2023 - 2030, Kilo Tonnes
- TABLE 41 Global Ammonia Market, By Region, 2019 - 2022, USD Million
- TABLE 42 Global Ammonia Market, By Region, 2023 - 2030, USD Million
- TABLE 43 Global Ammonia Market, By Region, 2019 - 2022, Kilo Tonnes
- TABLE 44 Global Ammonia Market, By Region, 2023 - 2030, Kilo Tonnes
- TABLE 45 North America Ammonia Market, 2019 - 2022, USD Million
- TABLE 46 North America Ammonia Market, 2023 - 2030, USD Million
- TABLE 47 North America Ammonia Market, 2019 - 2022, Kilo Tonnes
- TABLE 48 North America Ammonia Market, 2023 - 2030, Kilo Tonnes
- TABLE 49 North America Ammonia Market, By Product Form, 2019 - 2022, USD Million
- TABLE 50 North America Ammonia Market, By Product Form, 2023 - 2030, USD Million
- TABLE 51 North America Ammonia Market, By Product Form, 2019 - 2022, Kilo Tonnes
- TABLE 52 North America Ammonia Market, By Product Form, 2023 - 2030, Kilo Tonnes
- TABLE 53 North America Anhydrous Market, By Country, 2019 - 2022, USD Million
- TABLE 54 North America Anhydrous Market, By Country, 2023 - 2030, USD Million
- TABLE 55 North America Anhydrous Market, By Country, 2019 - 2022, Kilo Tonnes
- TABLE 56 North America Anhydrous Market, By Country, 2023 - 2030, Kilo Tonnes
- TABLE 57 North America Aqueous Market, By Country, 2019 - 2022, USD Million
- TABLE 58 North America Aqueous Market, By Country, 2023 - 2030, USD Million
- TABLE 59 North America Aqueous Market, By Country, 2019 - 2022, Kilo Tonnes
- TABLE 60 North America Aqueous Market, By Country, 2023 - 2030, Kilo Tonnes
- TABLE 61 North America Ammonia Market, By Application, 2019 - 2022, USD Million
- TABLE 62 North America Ammonia Market, By Application, 2023 - 2030, USD Million
- TABLE 63 North America Ammonia Market, By Application, 2019 - 2022, Kilo Tonnes
- TABLE 64 North America Ammonia Market, By Application, 2023 - 2030, Kilo Tonnes
- TABLE 65 North America Fertilizers Market, By Country, 2019 - 2022, USD Million
- TABLE 66 North America Fertilizers Market, By Country, 2023 - 2030, USD Million
- TABLE 67 North America Fertilizers Market, By Country, 2019 - 2022, Kilo Tonnes
- TABLE 68 North America Fertilizers Market, By Country, 2023 - 2030, Kilo Tonnes
- TABLE 69 North America Refrigerants Market, By Country, 2019 - 2022, USD Million
- TABLE 70 North America Refrigerants Market, By Country, 2023 - 2030, USD Million
- TABLE 71 North America Refrigerants Market, By Country, 2019 - 2022, Kilo Tonnes
- TABLE 72 North America Refrigerants Market, By Country, 2023 - 2030, Kilo Tonnes
- TABLE 73 North America Pharmaceuticals Market, By Country, 2019 - 2022, USD Million
- TABLE 74 North America Pharmaceuticals Market, By Country, 2023 - 2030, USD Million
- TABLE 75 North America Pharmaceuticals Market, By Country, 2019 - 2022, Kilo Tonnes
- TABLE 76 North America Pharmaceuticals Market, By Country, 2023 - 2030, Kilo Tonnes
- TABLE 77 North America Textile Market, By Country, 2019 - 2022, USD Million
- TABLE 78 North America Textile Market, By Country, 2023 - 2030, USD Million
- TABLE 79 North America Textile Market, By Country, 2019 - 2022, Kilo Tonnes
- TABLE 80 North America Textile Market, By Country, 2023 - 2030, Kilo Tonnes
- TABLE 81 North America Others Market, By Country, 2019 - 2022, USD Million
- TABLE 82 North America Others Market, By Country, 2023 - 2030, USD Million
- TABLE 83 North America Others Market, By Country, 2019 - 2022, Kilo Tonnes
- TABLE 84 North America Others Market, By Country, 2023 - 2030, Kilo Tonnes
- TABLE 85 North America Ammonia Market, By Country, 2019 - 2022, USD Million
- TABLE 86 North America Ammonia Market, By Country, 2023 - 2030, USD Million
- TABLE 87 North America Ammonia Market, By Country, 2019 - 2022, Kilo Tonnes
- TABLE 88 North America Ammonia Market, By Country, 2023 - 2030, Kilo Tonnes
- TABLE 89 US Ammonia Market, 2019 - 2022, USD Million
- TABLE 90 US Ammonia Market, 2023 - 2030, USD Million
- TABLE 91 US Ammonia Market, 2019 - 2022, Kilo Tonnes
- TABLE 92 US Ammonia Market, 2023 - 2030, Kilo Tonnes
- TABLE 93 US Ammonia Market, By Product Form, 2019 - 2022, USD Million
- TABLE 94 US Ammonia Market, By Product Form, 2023 - 2030, USD Million
- TABLE 95 US Ammonia Market, By Product Form, 2019 - 2022, Kilo Tonnes
- TABLE 96 US Ammonia Market, By Product Form, 2023 - 2030, Kilo Tonnes
- TABLE 97 US Ammonia Market, By Application, 2019 - 2022, USD Million
- TABLE 98 US Ammonia Market, By Application, 2023 - 2030, USD Million
- TABLE 99 US Ammonia Market, By Application, 2019 - 2022, Kilo Tonnes
- TABLE 100 US Ammonia Market, By Application, 2023 - 2030, Kilo Tonnes
- TABLE 101 Mexico Ammonia Market, 2019 - 2022, USD Million
- TABLE 102 Mexico Ammonia Market, 2023 - 2030, USD Million
- TABLE 103 Mexico Ammonia Market, 2019 - 2022, Kilo Tonnes
- TABLE 104 Mexico Ammonia Market, 2023 - 2030, Kilo Tonnes
- TABLE 105 Mexico Ammonia Market, By Product Form, 2019 - 2022, USD Million
- TABLE 106 Mexico Ammonia Market, By Product Form, 2023 - 2030, USD Million
- TABLE 107 Mexico Ammonia Market, By Product Form, 2019 - 2022, Kilo Tonnes
- TABLE 108 Mexico Ammonia Market, By Product Form, 2023 - 2030, Kilo Tonnes
- TABLE 109 Mexico Ammonia Market, By Application, 2019 - 2022, USD Million
- TABLE 110 Mexico Ammonia Market, By Application, 2023 - 2030, USD Million
- TABLE 111 Mexico Ammonia Market, By Application, 2019 - 2022, Kilo Tonnes
- TABLE 112 Mexico Ammonia Market, By Application, 2023 - 2030, Kilo Tonnes
- TABLE 113 Canada Ammonia Market, 2019 - 2022, USD Million
- TABLE 114 Canada Ammonia Market, 2023 - 2030, USD Million
- TABLE 115 Canada Ammonia Market, 2019 - 2022, Kilo Tonnes
- TABLE 116 Canada Ammonia Market, 2023 - 2030, Kilo Tonnes
- TABLE 117 Canada Ammonia Market, By Product Form, 2019 - 2022, USD Million
- TABLE 118 Canada Ammonia Market, By Product Form, 2023 - 2030, USD Million
- TABLE 119 Canada Ammonia Market, By Product Form, 2019 - 2022, Kilo Tonnes
- TABLE 120 Canada Ammonia Market, By Product Form, 2023 - 2030, Kilo Tonnes
- TABLE 121 Canada Ammonia Market, By Application, 2019 - 2022, USD Million
- TABLE 122 Canada Ammonia Market, By Application, 2023 - 2030, USD Million
- TABLE 123 Canada Ammonia Market, By Application, 2019 - 2022, Kilo Tonnes
- TABLE 124 Canada Ammonia Market, By Application, 2023 - 2030, Kilo Tonnes
- TABLE 125 Rest of North America Ammonia Market, 2019 - 2022, USD Million
- TABLE 126 Rest of North America Ammonia Market, 2023 - 2030, USD Million
- TABLE 127 Rest of North America Ammonia Market, 2019 - 2022, Kilo Tonnes
- TABLE 128 Rest of North America Ammonia Market, 2023 - 2030, Kilo Tonnes
- TABLE 129 Rest of North America Ammonia Market, By Product Form, 2019 - 2022, USD Million
- TABLE 130 Rest of North America Ammonia Market, By Product Form, 2023 - 2030, USD Million
- TABLE 131 Rest of North America Ammonia Market, By Product Form, 2019 - 2022, Kilo Tonnes
- TABLE 132 Rest of North America Ammonia Market, By Product Form, 2023 - 2030, Kilo Tonnes
- TABLE 133 Rest of North America Ammonia Market, By Application, 2019 - 2022, USD Million
- TABLE 134 Rest of North America Ammonia Market, By Application, 2023 - 2030, USD Million
- TABLE 135 Rest of North America Ammonia Market, By Application, 2019 - 2022, Kilo Tonnes
- TABLE 136 Rest of North America Ammonia Market, By Application, 2023 - 2030, Kilo Tonnes
- TABLE 137 Europe Ammonia Market, 2019 - 2022, USD Million
- TABLE 138 Europe Ammonia Market, 2023 - 2030, USD Million
- TABLE 139 Europe Ammonia Market, 2019 - 2022, Kilo Tonnes
- TABLE 140 Europe Ammonia Market, 2023 - 2030, Kilo Tonnes
- TABLE 141 Europe Ammonia Market, By Product Form, 2019 - 2022, USD Million
- TABLE 142 Europe Ammonia Market, By Product Form, 2023 - 2030, USD Million
- TABLE 143 Europe Ammonia Market, By Product Form, 2019 - 2022, Kilo Tonnes
- TABLE 144 Europe Ammonia Market, By Product Form, 2023 - 2030, Kilo Tonnes
- TABLE 145 Europe Anhydrous Market, By Country, 2019 - 2022, USD Million
- TABLE 146 Europe Anhydrous Market, By Country, 2023 - 2030, USD Million
- TABLE 147 Europe Anhydrous Market, By Country, 2019 - 2022, Kilo Tonnes
- TABLE 148 Europe Anhydrous Market, By Country, 2023 - 2030, Kilo Tonnes
- TABLE 149 Europe Aqueous Market, By Country, 2019 - 2022, USD Million
- TABLE 150 Europe Aqueous Market, By Country, 2023 - 2030, USD Million
- TABLE 151 Europe Aqueous Market, By Country, 2019 - 2022, Kilo Tonnes
- TABLE 152 Europe Aqueous Market, By Country, 2023 - 2030, Kilo Tonnes
- TABLE 153 Europe Ammonia Market, By Application, 2019 - 2022, USD Million
- TABLE 154 Europe Ammonia Market, By Application, 2023 - 2030, USD Million
- TABLE 155 Europe Ammonia Market, By Application, 2019 - 2022, Kilo Tonnes
- TABLE 156 Europe Ammonia Market, By Application, 2023 - 2030, Kilo Tonnes
- TABLE 157 Europe Fertilizers Market, By Country, 2019 - 2022, USD Million
- TABLE 158 Europe Fertilizers Market, By Country, 2023 - 2030, USD Million
- TABLE 159 Europe Fertilizers Market, By Country, 2019 - 2022, Kilo Tonnes
- TABLE 160 Europe Fertilizers Market, By Country, 2023 - 2030, Kilo Tonnes
- TABLE 161 Europe Refrigerants Market, By Country, 2019 - 2022, USD Million
- TABLE 162 Europe Refrigerants Market, By Country, 2023 - 2030, USD Million
- TABLE 163 Europe Refrigerants Market, By Country, 2019 - 2022, Kilo Tonnes
- TABLE 164 Europe Refrigerants Market, By Country, 2023 - 2030, Kilo Tonnes
- TABLE 165 Europe Pharmaceuticals Market, By Country, 2019 - 2022, USD Million
- TABLE 166 Europe Pharmaceuticals Market, By Country, 2023 - 2030, USD Million
- TABLE 167 Europe Pharmaceuticals Market, By Country, 2019 - 2022, Kilo Tonnes
- TABLE 168 Europe Pharmaceuticals Market, By Country, 2023 - 2030, Kilo Tonnes
- TABLE 169 Europe Textile Market, By Country, 2019 - 2022, USD Million
- TABLE 170 Europe Textile Market, By Country, 2023 - 2030, USD Million
- TABLE 171 Europe Textile Market, By Country, 2019 - 2022, Kilo Tonnes
- TABLE 172 Europe Textile Market, By Country, 2023 - 2030, Kilo Tonnes
- TABLE 173 Europe Others Market, By Country, 2019 - 2022, USD Million
- TABLE 174 Europe Others Market, By Country, 2023 - 2030, USD Million
- TABLE 175 Europe Others Market, By Country, 2019 - 2022, Kilo Tonnes
- TABLE 176 Europe Others Market, By Country, 2023 - 2030, Kilo Tonnes
- TABLE 177 Europe Ammonia Market, By Country, 2019 - 2022, USD Million
- TABLE 178 Europe Ammonia Market, By Country, 2023 - 2030, USD Million
- TABLE 179 Europe Ammonia Market, By Country, 2019 - 2022, Kilo Tonnes
- TABLE 180 Europe Ammonia Market, By Country, 2023 - 2030, Kilo Tonnes
- TABLE 181 Russia Ammonia Market, 2019 - 2022, USD Million
- TABLE 182 Russia Ammonia Market, 2023 - 2030, USD Million
- TABLE 183 Russia Ammonia Market, 2019 - 2022, Kilo Tonnes
- TABLE 184 Russia Ammonia Market, 2023 - 2030, Kilo Tonnes
- TABLE 185 Russia Ammonia Market, By Product Form, 2019 - 2022, USD Million
- TABLE 186 Russia Ammonia Market, By Product Form, 2023 - 2030, USD Million
- TABLE 187 Russia Ammonia Market, By Product Form, 2019 - 2022, Kilo Tonnes
- TABLE 188 Russia Ammonia Market, By Product Form, 2023 - 2030, Kilo Tonnes
- TABLE 189 Russia Ammonia Market, By Application, 2019 - 2022, USD Million
- TABLE 190 Russia Ammonia Market, By Application, 2023 - 2030, USD Million
- TABLE 191 Russia Ammonia Market, By Application, 2019 - 2022, Kilo Tonnes
- TABLE 192 Russia Ammonia Market, By Application, 2023 - 2030, Kilo Tonnes
- TABLE 193 France Ammonia Market, 2019 - 2022, USD Million
- TABLE 194 France Ammonia Market, 2023 - 2030, USD Million
- TABLE 195 France Ammonia Market, 2019 - 2022, Kilo Tonnes
- TABLE 196 France Ammonia Market, 2023 - 2030, Kilo Tonnes
- TABLE 197 France Ammonia Market, By Product Form, 2019 - 2022, USD Million
- TABLE 198 France Ammonia Market, By Product Form, 2023 - 2030, USD Million
- TABLE 199 France Ammonia Market, By Product Form, 2019 - 2022, Kilo Tonnes
- TABLE 200 France Ammonia Market, By Product Form, 2023 - 2030, Kilo Tonnes
- TABLE 201 France Ammonia Market, By Application, 2019 - 2022, USD Million
- TABLE 202 France Ammonia Market, By Application, 2023 - 2030, USD Million
- TABLE 203 France Ammonia Market, By Application, 2019 - 2022, Kilo Tonnes
- TABLE 204 France Ammonia Market, By Application, 2023 - 2030, Kilo Tonnes
- TABLE 205 Germany Ammonia Market, 2019 - 2022, USD Million
- TABLE 206 Germany Ammonia Market, 2023 - 2030, USD Million
- TABLE 207 Germany Ammonia Market, 2019 - 2022, Kilo Tonnes
- TABLE 208 Germany Ammonia Market, 2023 - 2030, Kilo Tonnes
- TABLE 209 Germany Ammonia Market, By Product Form, 2019 - 2022, USD Million
- TABLE 210 Germany Ammonia Market, By Product Form, 2023 - 2030, USD Million
- TABLE 211 Germany Ammonia Market, By Product Form, 2019 - 2022, Kilo Tonnes
- TABLE 212 Germany Ammonia Market, By Product Form, 2023 - 2030, Kilo Tonnes
- TABLE 213 Germany Ammonia Market, By Application, 2019 - 2022, USD Million
- TABLE 214 Germany Ammonia Market, By Application, 2023 - 2030, USD Million
- TABLE 215 Germany Ammonia Market, By Application, 2019 - 2022, Kilo Tonnes
- TABLE 216 Germany Ammonia Market, By Application, 2023 - 2030, Kilo Tonnes
- TABLE 217 UK Ammonia Market, 2019 - 2022, USD Million
- TABLE 218 UK Ammonia Market, 2023 - 2030, USD Million
- TABLE 219 UK Ammonia Market, 2019 - 2022, Kilo Tonnes
- TABLE 220 UK Ammonia Market, 2023 - 2030, Kilo Tonnes
- TABLE 221 UK Ammonia Market, By Product Form, 2019 - 2022, USD Million
- TABLE 222 UK Ammonia Market, By Product Form, 2023 - 2030, USD Million
- TABLE 223 UK Ammonia Market, By Product Form, 2019 - 2022, Kilo Tonnes
- TABLE 224 UK Ammonia Market, By Product Form, 2023 - 2030, Kilo Tonnes
- TABLE 225 UK Ammonia Market, By Application, 2019 - 2022, USD Million
- TABLE 226 UK Ammonia Market, By Application, 2023 - 2030, USD Million
- TABLE 227 UK Ammonia Market, By Application, 2019 - 2022, Kilo Tonnes
- TABLE 228 UK Ammonia Market, By Application, 2023 - 2030, Kilo Tonnes
- TABLE 229 Spain Ammonia Market, 2019 - 2022, USD Million
- TABLE 230 Spain Ammonia Market, 2023 - 2030, USD Million
- TABLE 231 Spain Ammonia Market, 2019 - 2022, Kilo Tonnes
- TABLE 232 Spain Ammonia Market, 2023 - 2030, Kilo Tonnes
- TABLE 233 Spain Ammonia Market, By Product Form, 2019 - 2022, USD Million
- TABLE 234 Spain Ammonia Market, By Product Form, 2023 - 2030, USD Million
- TABLE 235 Spain Ammonia Market, By Product Form, 2019 - 2022, Kilo Tonnes
- TABLE 236 Spain Ammonia Market, By Product Form, 2023 - 2030, Kilo Tonnes
- TABLE 237 Spain Ammonia Market, By Application, 2019 - 2022, USD Million
- TABLE 238 Spain Ammonia Market, By Application, 2023 - 2030, USD Million
- TABLE 239 Spain Ammonia Market, By Application, 2019 - 2022, Kilo Tonnes
- TABLE 240 Spain Ammonia Market, By Application, 2023 - 2030, Kilo Tonnes
- TABLE 241 Italy Ammonia Market, 2019 - 2022, USD Million
- TABLE 242 Italy Ammonia Market, 2023 - 2030, USD Million
- TABLE 243 Italy Ammonia Market, 2019 - 2022, Kilo Tonnes
- TABLE 244 Italy Ammonia Market, 2023 - 2030, Kilo Tonnes
- TABLE 245 Italy Ammonia Market, By Product Form, 2019 - 2022, USD Million
- TABLE 246 Italy Ammonia Market, By Product Form, 2023 - 2030, USD Million
- TABLE 247 Italy Ammonia Market, By Product Form, 2019 - 2022, Kilo Tonnes
- TABLE 248 Italy Ammonia Market, By Product Form, 2023 - 2030, Kilo Tonnes
- TABLE 249 Italy Ammonia Market, By Application, 2019 - 2022, USD Million
- TABLE 250 Italy Ammonia Market, By Application, 2023 - 2030, USD Million
- TABLE 251 Italy Ammonia Market, By Application, 2019 - 2022, Kilo Tonnes
- TABLE 252 Italy Ammonia Market, By Application, 2023 - 2030, Kilo Tonnes
- TABLE 253 Rest of Europe Ammonia Market, 2019 - 2022, USD Million
- TABLE 254 Rest of Europe Ammonia Market, 2023 - 2030, USD Million
- TABLE 255 Rest of Europe Ammonia Market, 2019 - 2022, Kilo Tonnes
- TABLE 256 Rest of Europe Ammonia Market, 2023 - 2030, Kilo Tonnes
- TABLE 257 Rest of Europe Ammonia Market, By Product Form, 2019 - 2022, USD Million
- TABLE 258 Rest of Europe Ammonia Market, By Product Form, 2023 - 2030, USD Million
- TABLE 259 Rest of Europe Ammonia Market, By Product Form, 2019 - 2022, Kilo Tonnes
- TABLE 260 Rest of Europe Ammonia Market, By Product Form, 2023 - 2030, Kilo Tonnes
- TABLE 261 Rest of Europe Ammonia Market, By Application, 2019 - 2022, USD Million
- TABLE 262 Rest of Europe Ammonia Market, By Application, 2023 - 2030, USD Million
- TABLE 263 Rest of Europe Ammonia Market, By Application, 2019 - 2022, Kilo Tonnes
- TABLE 264 Rest of Europe Ammonia Market, By Application, 2023 - 2030, Kilo Tonnes
The Global Ammonia Market size is expected to reach $306.7 billion by 2030, rising at a market growth of 5.6% CAGR during the forecast period. In the year 2022, the market attained a volume of 2,13,071.9 Kilo Tonnes, experiencing a growth of 4.6% (2019-2022).
Ammonia is not commonly used in textiles, but its derivative, ammonium hydroxide (NH4OH), often referred to as ammonia solution or simply ammonia, has some applications in the textile industry. Therefore, textile sector generated $11,509.5 million revenue share in 2022. In the textile industry, desizing removes sizing agents applied to warp yarns to make them more resistant to abrasion during weaving. Ammonium hydroxide can be used as a desizing agent to break down and remove these sizing materials from textiles. Ammonium hydroxide is sometimes used as a component of dye pastes and printing inks. It can help in the fixation of dyes on textiles during the printing process, particularly in pigment printing. Some of the factors impacting the market are rising fertilizer consumption and increased agricultural production, growing applications in the refrigeration systems and mining industry, and impacts of exposure to high concentrations of NH3 on humans.
Modern farming practices, including precision agriculture, emphasize optimizing fertilizer application to maximize yields while minimizing waste. This approach can result in increased ammonia use per hectare of cultivated land. Many governments support agricultural development and food security by subsidizing fertilizers or implementing policies to promote their use. Such initiatives can stimulate ammonia consumption in agriculture. Fertilizers, including those produced with ammonia, allow farmers to diversify crops and cultivate higher-value, nutrient-demanding varieties. This diversification can lead to greater ammonia utilization. The growth in fertilizer consumption driven by the need for increased agricultural production contributes to the expansion of the ammonia market.
Additionally, the mining industry relies on ammonia to produce explosives, particularly ammonium nitrate-based explosives. Ammonium nitrate is a vital component used in the mining and construction sectors for tasks such as blasting and excavation. It is used as a leaching agent or solvent in metallurgical processes, such as leaching and ore refining. It plays a role in extracting valuable metals from ores. Ammonia is used in some mining operations for dust suppression. It can help control dust and improve safety in mining environments. Expanding applications beyond agriculture has diversified the ammonia market, reducing dependence on a single sector. The mining industry's demand for ammonia has grown as mining activities have expanded, particularly in emerging economies with substantial mining operations. The above factors will lead the market growth in the coming years.
However, the majority of individuals are exposed to NH3 by inhaling vapors or gas. Since the substance occurs naturally and is present in cleaning products, people are likely exposed to such sources. It has an immediate effect upon contact with the eyes, epidermis, respiratory tract, and oral cavity. Low ammonia concentrations in solutions or air can rapidly irritate the eyes and epidermis. Greater concentration may result in severe burning and injuries. Any contact with highly concentrated solutions, such as industrial cleaners, can result in corrosive injuries, such as skin burns and permanent eye damage or blindness. In addition to these effects, swallowing solutions at high concentrations cause corrosive harm to the stomach, throat, and mouth. In the future, market growth will be hampered by these factors.
Product Form Outlook
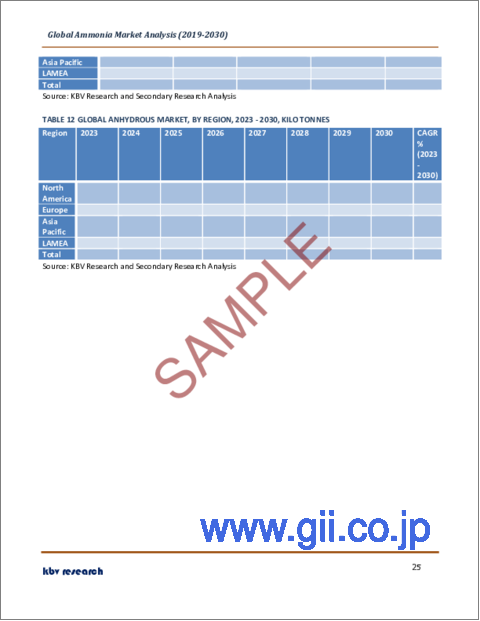
On the basis of product form, the market is segmented into aqueous and anhydrous. In 2022, the aqueous segment acquired a substantial revenue share in the market. This is because it is easy to handle and easily available to producers. In addition, nitrogenous fertilizers based on NH3 offer improved yield, effective protection for crops, and improved farming cycles. Due to its increased nitrogen content of 82%, this anhydrous product-based fertilizer is utilized extensively in agriculture. However, it is more efficacious in warmer temperatures than in cooler temperatures. Its pungent odor and high vaporization temperature make anhydrous ammonia useful as a solvent and refrigerant. Liquefied NH3 is also utilized in producing synthetic fibers, pharmaceuticals, and mining metals from ore.
Application Outlook
Based on application, the market is fragmented into fertilizers, refrigerants, pharmaceuticals, textile, and others. In 2022, the fertilizers segment held the highest revenue share in the market. Farmers increasingly utilize nitrogenous fertilizers due to their high solubility, which enables plants to absorb them swiftly and effectively. This means they can supply the nitrogen necessary for plant growth more quickly than organic fertilizers, which require time to break down and release nutrients. Ammonia is one of the most frequently utilized nitrogenous fertilizers and is the fundamental compound of the nitrogen industry. In addition, NH3-based fertilizers can be manufactured in various forms and adapted to various agricultural settings and crops.
Regional Outlook
Region-wise, the market is analysed across North America, Europe, Asia Pacific, and LAMEA. In 2022, the Asia Pacific region generated the highest revenue share in the market. The Asia-Pacific region dominates the market due to large consumption from countries such as China, India, Japan, and others. China is one of the largest producer and consumer of ammonia in the world. The demand for ammonia in the country is rising due to increasing applications in the agriculture industry, such as fertilizers, textiles, pharmaceuticals, and mining. China leads the world in nitrogen (N) fertilizer consumption. Japan has a long tradition in textile production and is one of the largest manufacturers of technical textiles. Thus, all the above-mentioned factors will likely increase the market demand during the forecast period.
The market research report covers the analysis of key stake holders of the market. Key companies profiled in the report include SABIC (Saudi Arabian Oil Company), Linde PLC, Yara International ASA, Nutrien Limited, BASF SE, Sumitomo Chemical Co., Ltd., Koch Industries, Inc. (Molex LLC), CF Industries Holdings, Inc., Qatar Fertiliser Company (Industries Qatar), and PJSC Togliattiazot.
Strategies deployed in Ammonia Market
Apr-2023: Yara International ASA teamed up with VNG, a company specializing in natural gas distribution and renewable energy solutions. Through this collaboration, both companies would work in the realm of clean ammonia, which would actively facilitate the ambitious execution strategies detailed in the German Hydrogen Strategy. Further, this collaboration between Yara International ASA and VNG would greatly advance and ease the ongoing efforts associated with expanding the capacity of "Green Port Rostock" and launching new industrial initiatives related to clean ammonia and hydrogen.
Mar-2023: Sumitomo Chemical Co., Ltd. entered into a partnership with H2Pro, a technology company specializing in advanced water management solutions for sports turf and landscape irrigation. Through this partnership, Sumitomo Chemical Co., Ltd. would incorporate H2Pro's E-TAC electrolyzes, primarily for application in large-scale green ammonia projects, spanning hundreds of megawatts. Further, H2Pro would supply Sumitomo with data to assist in the strategic planning of its green hydrogen project pipeline.
Mar-2023: Linde PLC came into collaboration with Aramco, a state-owned oil and gas giant headquartered in Dhahran, Saudi Arabia. Through this collaboration, both companies have proposed the construction of a demonstration plant in northern Germany to showcase their newly developed ammonia cracking technology. Further, the two firms would leverage their expertise and competencies in industrial R&D, low-carbon hydrogen, and the advancement of ammonia-cracking technology.
Mar-2023: CF Industries Holdings, Inc. signed an agreement to acquire the Waggaman Ammonia Production Facility of Incitec Pivot Limited, an Australian multinational corporation that specializes in fertilizer and explosives manufacturing for agricultural and industrial markets. Through this acquisition, CF Industries Holdings, Inc. would be able to leverage its established ammonia production capabilities in the industry.
Jan-2023: Sumitomo Chemical Co., Ltd. completed the acquisition of FBSciences Holdings, Inc., a biotechnology company specializing in sustainable agricultural solutions and plant health products. Through this acquisition, Sumitomo Chemical Co., Ltd. aims to enhance its biorational business by leveraging its global presence and resources in conjunction with FBS's product range and technological expertise, with a concurrent effort to discover fresh synergies between biorational solutions and traditional crop protection products.
Jan-2023: Yara International ASA signed an agreement with JERA, a company with a primary focus on electricity generation and natural gas supply. Through this agreement, both companies would aim to work together on blue ammonia production in the US Gulf, with the goal of producing over 1 million metric tons annually.
Jan-2023: CF Industries Holdings, Inc. signed an agreement with JERA Co., Inc., a company engaged in electricity generation and natural gas supply. Through this agreement, both companies would be able to explore the optimal method for CF Industries to deliver clean ammonia to JERA through a long-term offtake arrangement. Further, both companies anticipate assessing various supply possibilities.
Oct-2022: Nutrien Limited entered into a partnership with thyssenkrupp Uhde, a company specializing in the design and construction of industrial plants and technologies. Through this partnership, thyssenkrupp Uhde would act as a technology provider and partner for the upcoming clean ammonia production facility for Nutrien Limited.
May-2021: Yara International ASA came into collaboration with JERA Co., Inc., a company specializing in the generation and supply of electricity and natural gas. Through this collaboration, both companies would explore potential cooperation in the following areas such as enhancements to the Yara Pilbara Fertilizer plant in Australia to enable the manufacture of blue ammonia and in the development of new projects for the production of blue and green ammonia.
Sep-2020: BASF SE completed the acquisition of proprietary Glu-L™ technology for L-glufosinate ammonium through its acquisition from AgriMetis™, a biotechnology company specializing in innovative solutions for sustainable agriculture and crop protection. With this acquisition, BASF SE would provide its customers with an enhanced weed control product featuring an improved formulation for more efficient protection against unwanted weeds.
Scope of the Study
Market Segments covered in the Report:
By Product Form (Volume, Kilo Tonnes, USD Million, 2019-2030)
- Anhydrous
- Aqueous
By Application (Volume, Kilo Tonnes, USD Million, 2019-2030)
- Fertilizers
- Refrigerants
- Pharmaceuticals
- Textile
- Others
By Geography (Volume, Kilo Tonnes, USD Million, 2019-2030)
- North America
- US
- Mexico
- Canada
- Rest of North America
- Europe
- Russia
- France
- Germany
- UK
- Spain
- Italy
- Rest of Europe
- Asia Pacific
- China
- India
- Thailand
- Japan
- South Korea
- Australia
- Malaysia
- Rest of Asia Pacific
- LAMEA
- Brazil
- Argentina
- South Africa
- Nigeria
- Morocco
- Chile
- Rest of LAMEA
Companies Profiled
- SABIC (Saudi Arabian Oil Company)
- Linde PLC
- Yara International ASA
- Nutrien Limited
- BASF SE
- Sumitomo Chemical Co., Ltd.
- Koch Industries, Inc. (Molex LLC)
- CF Industries Holdings, Inc.
- Qatar Fertiliser Company (Industries Qatar)
- PJSC Togliattiazot
Unique Offerings from KBV Research
- Exhaustive coverage
- Highest number of market tables and figures
- Subscription based model available
- Guaranteed best price
- Assured post sales research support with 10% customization free
Table of Contents
Chapter 1. Market Scope & Methodology
- 1.1 Market Definition
- 1.2 Objectives
- 1.3 Market Scope
- 1.4 Segmentation
- 1.4.1 Global Ammonia Market, by Product Form
- 1.4.2 Global Ammonia Market, by Application
- 1.4.3 Global Ammonia Market, by Geography
- 1.5 Methodology for the research
Chapter 2. Market At a Glance
- 2.1 Key Highlights
Chapter 3. Market Overview
- 3.1 Introduction
- 3.1.1 Overview
- 3.1.1.1 Market Composition and Scenario
- 3.1.1 Overview
- 3.2 Key Factors Impacting the Market
- 3.2.1 Market Drivers
- 3.2.2 Market Restraints
- 3.3 Porter Five Forces Analysis
Chapter 4. Strategies Deployed in Ammonia Market
Chapter 5. Global Ammonia Market, By Product Form
- 5.1 Global Anhydrous Market, By Region
- 5.2 Global Aqueous Market, By Region
Chapter 6. Global Ammonia Market, By Application
- 6.1 Global Fertilizers Market, By Region
- 6.2 Global Refrigerants Market, By Region
- 6.3 Global Pharmaceuticals Market, By Region
- 6.4 Global Textile Market, By Region
- 6.5 Global Others Market, By Region
Chapter 7. Global Ammonia Market, By Region
- 7.1 North America Ammonia Market
- 7.1.1 North America Ammonia Market, By Product Form
- 7.1.1.1 North America Anhydrous Market, By Country
- 7.1.1.2 North America Aqueous Market, By Country
- 7.1.2 North America Ammonia Market, By Application
- 7.1.2.1 North America Fertilizers Market, By Country
- 7.1.2.2 North America Refrigerants Market, By Country
- 7.1.2.3 North America Pharmaceuticals Market, By Country
- 7.1.2.4 North America Textile Market, By Country
- 7.1.2.5 North America Others Market, By Country
- 7.1.3 North America Ammonia Market, By Country
- 7.1.3.1 US Ammonia Market
- 7.1.3.1.1 US Ammonia Market, By Product Form
- 7.1.3.1.2 US Ammonia Market, By Application
- 7.1.3.2 Mexico Ammonia Market
- 7.1.3.2.1 Mexico Ammonia Market, By Product Form
- 7.1.3.2.2 Mexico Ammonia Market, By Application
- 7.1.3.3 Canada Ammonia Market
- 7.1.3.3.1 Canada Ammonia Market, By Product Form
- 7.1.3.3.2 Canada Ammonia Market, By Application
- 7.1.3.4 Rest of North America Ammonia Market
- 7.1.3.4.1 Rest of North America Ammonia Market, By Product Form
- 7.1.3.4.2 Rest of North America Ammonia Market, By Application
- 7.1.3.1 US Ammonia Market
- 7.1.1 North America Ammonia Market, By Product Form
- 7.2 Europe Ammonia Market
- 7.2.1 Europe Ammonia Market, By Product Form
- 7.2.1.1 Europe Anhydrous Market, By Country
- 7.2.1.2 Europe Aqueous Market, By Country
- 7.2.2 Europe Ammonia Market, By Application
- 7.2.2.1 Europe Fertilizers Market, By Country
- 7.2.2.2 Europe Refrigerants Market, By Country
- 7.2.2.3 Europe Pharmaceuticals Market, By Country
- 7.2.2.4 Europe Textile Market, By Country
- 7.2.2.5 Europe Others Market, By Country
- 7.2.3 Europe Ammonia Market, By Country
- 7.2.3.1 Russia Ammonia Market
- 7.2.3.1.1 Russia Ammonia Market, By Product Form
- 7.2.3.1.2 Russia Ammonia Market, By Application
- 7.2.3.2 France Ammonia Market
- 7.2.3.2.1 France Ammonia Market, By Product Form
- 7.2.3.2.2 France Ammonia Market, By Application
- 7.2.3.3 Germany Ammonia Market
- 7.2.3.3.1 Germany Ammonia Market, By Product Form
- 7.2.3.3.2 Germany Ammonia Market, By Application
- 7.2.3.4 UK Ammonia Market
- 7.2.3.4.1 UK Ammonia Market, By Product Form
- 7.2.3.4.2 UK Ammonia Market, By Application
- 7.2.3.5 Spain Ammonia Market
- 7.2.3.5.1 Spain Ammonia Market, By Product Form
- 7.2.3.5.2 Spain Ammonia Market, By Application
- 7.2.3.6 Italy Ammonia Market
- 7.2.3.6.1 Italy Ammonia Market, By Product Form
- 7.2.3.6.2 Italy Ammonia Market, By Application
- 7.2.3.7 Rest of Europe Ammonia Market
- 7.2.3.7.1 Rest of Europe Ammonia Market, By Product Form
- 7.2.3.7.2 Rest of Europe Ammonia Market, By Application
- 7.2.3.1 Russia Ammonia Market
- 7.2.1 Europe Ammonia Market, By Product Form
- 7.3 Asia Pacific Ammonia Market
- 7.3.1 Asia Pacific Ammonia Market, By Product Form
- 7.3.1.1 Asia Pacific Anhydrous Market, By Country
- 7.3.1.2 Asia Pacific Aqueous Market, By Country
- 7.3.2 Asia Pacific Ammonia Market, By Application
- 7.3.2.1 Asia Pacific Fertilizers Market, By Country
- 7.3.2.2 Asia Pacific Refrigerants Market, By Country
- 7.3.2.3 Asia Pacific Pharmaceuticals Market, By Country
- 7.3.2.4 Asia Pacific Textile Market, By Country
- 7.3.2.5 Asia Pacific Others Market, By Country
- 7.3.3 Asia Pacific Ammonia Market, By Country
- 7.3.3.1 China Ammonia Market
- 7.3.3.1.1 China Ammonia Market, By Product Form
- 7.3.3.1.2 China Ammonia Market, By Application
- 7.3.3.2 India Ammonia Market
- 7.3.3.2.1 India Ammonia Market, By Product Form
- 7.3.3.2.2 India Ammonia Market, By Application
- 7.3.3.3 Thailand Ammonia Market
- 7.3.3.3.1 Thailand Ammonia Market, By Product Form
- 7.3.3.3.2 Thailand Ammonia Market, By Application
- 7.3.3.4 Japan Ammonia Market
- 7.3.3.4.1 Japan Ammonia Market, By Product Form
- 7.3.3.4.2 Japan Ammonia Market, By Application
- 7.3.3.5 South Korea Ammonia Market
- 7.3.3.5.1 South Korea Ammonia Market, By Product Form
- 7.3.3.5.2 South Korea Ammonia Market, By Application
- 7.3.3.6 Australia Ammonia Market
- 7.3.3.6.1 Australia Ammonia Market, By Product Form
- 7.3.3.6.2 Australia Ammonia Market, By Application
- 7.3.3.7 Rest of Asia Pacific Ammonia Market
- 7.3.3.7.1 Rest of Asia Pacific Ammonia Market, By Product Form
- 7.3.3.7.2 Rest of Asia Pacific Ammonia Market, By Application
- 7.3.3.1 China Ammonia Market
- 7.3.1 Asia Pacific Ammonia Market, By Product Form
- 7.4 LAMEA Ammonia Market
- 7.4.1 LAMEA Ammonia Market, By Product Form
- 7.4.1.1 LAMEA Anhydrous Market, By Country
- 7.4.1.2 LAMEA Aqueous Market, By Country
- 7.4.2 LAMEA Ammonia Market, By Application
- 7.4.2.1 LAMEA Fertilizers Market, By Country
- 7.4.2.2 LAMEA Refrigerants Market, By Country
- 7.4.2.3 LAMEA Pharmaceuticals Market, By Country
- 7.4.2.4 LAMEA Textile Market, By Country
- 7.4.2.5 LAMEA Others Market, By Country
- 7.4.3 LAMEA Ammonia Market, By Country
- 7.4.3.1 Brazil Ammonia Market
- 7.4.3.1.1 Brazil Ammonia Market, By Product Form
- 7.4.3.1.2 Brazil Ammonia Market, By Application
- 7.4.3.2 Argentina Ammonia Market
- 7.4.3.2.1 Argentina Ammonia Market, By Product Form
- 7.4.3.2.2 Argentina Ammonia Market, By Application
- 7.4.3.3 South Africa Ammonia Market
- 7.4.3.3.1 South Africa Ammonia Market, By Product Form
- 7.4.3.3.2 South Africa Ammonia Market, By Application
- 7.4.3.4 Nigeria Ammonia Market
- 7.4.3.4.1 Nigeria Ammonia Market, By Product Form
- 7.4.3.4.2 Nigeria Ammonia Market, By Application
- 7.4.3.5 Morocco Ammonia Market
- 7.4.3.5.1 Morocco Ammonia Market, By Product Form
- 7.4.3.5.2 Morocco Ammonia Market, By Application
- 7.4.3.6 Chile Ammonia Market
- 7.4.3.6.1 Chile Ammonia Market, By Product Form
- 7.4.3.6.2 Chile Ammonia Market, By Application
- 7.4.3.7 Rest of LAMEA Ammonia Market
- 7.4.3.7.1 Rest of LAMEA Ammonia Market, By Product Form
- 7.4.3.7.2 Rest of LAMEA Ammonia Market, By Application
- 7.4.3.1 Brazil Ammonia Market
- 7.4.1 LAMEA Ammonia Market, By Product Form
Chapter 8. Company Profiles
- 8.1 SABIC (Saudi Arabian Oil Company)
- 8.1.1 Company Overview
- 8.1.2 Financial Analysis
- 8.1.3 Segmental and Regional Analysis
- 8.1.4 SWOT Analysis
- 8.2 Linde PLC
- 8.2.1 Company Overview
- 8.2.2 Financial Analysis
- 8.2.3 Segmental Analysis
- 8.2.4 Research & Development Expenses
- 8.2.5 Recent strategies and developments:
- 8.2.5.1 Partnerships, Collaborations, and Agreements:
- 8.2.6 SWOT Analysis
- 8.3 Yara International ASA
- 8.3.1 Company Overview
- 8.3.2 Financial Analysis
- 8.3.3 Regional Analysis
- 8.3.4 Research & Development Expenses
- 8.3.5 Recent strategies and developments:
- 8.3.5.1 Partnerships, Collaborations, and Agreements:
- 8.3.6 SWOT Analysis
- 8.4 Nutrien Limited
- 8.4.1 Company Overview
- 8.4.2 Financial Analysis
- 8.4.3 Segmental and Regional Analysis
- 8.4.4 Recent strategies and developments:
- 8.4.4.1 Partnerships, Collaborations, and Agreements:
- 8.4.5 SWOT Analysis
- 8.5 BASF SE
- 8.5.1 Company Overview
- 8.5.2 Financial Analysis
- 8.5.3 Segmental and Regional Analysis
- 8.5.4 Research & Development Expense
- 8.5.5 Recent strategies and developments:
- 8.5.5.1 Acquisition and Mergers:
- 8.5.6 SWOT Analysis
- 8.6 Sumitomo Chemical Co., Ltd.
- 8.6.1 Company Overview
- 8.6.2 Financial Analysis
- 8.6.3 Segmental and Regional Analysis
- 8.6.4 Research & Development Expenses
- 8.6.5 Recent strategies and developments:
- 8.6.5.1 Partnerships, Collaborations, and Agreements:
- 8.6.5.2 Acquisition and Mergers:
- 8.6.6 SWOT Analysis
- 8.7 Koch Industries, Inc. (Molex LLC)
- 8.7.1 Company Overview
- 8.7.2 SWOT Analysis
- 8.8 CF Industries Holdings, Inc.
- 8.8.1 Company Overview
- 8.8.2 Financial Analysis
- 8.8.3 Segmental and Regional Analysis
- 8.8.4 Recent strategies and developments:
- 8.8.4.1 Partnerships, Collaborations, and Agreements:
- 8.8.4.2 Acquisition and Mergers:
- 8.8.5 SWOT Analysis
- 8.9 Qatar Fertiliser Company (Industries Qatar)
- 8.9.1 Company Overview
- 8.9.2 Financial Analysis
- 8.9.3 SWOT Analysis
- 8.10. PJSC Togliattiazot
- 8.10.1 Company Overview
- 8.10.2 SWOT Analysis
