|
|
市場調査レポート
商品コード
1353419
カリの世界市場規模、シェア、産業動向分析レポート:製品別、最終用途別、地域別展望と予測、2023年~2030年Global Potash Market Size, Share & Industry Trends Analysis Report By Product (Potassium Chloride, Potassium Nitrate, Potassium Sulphate, and Others), By End-use (Agriculture and Non-Agriculture), By Regional Outlook and Forecast, 2023 - 2030 |
||||||
|
|
|||||||
|
|||||||


| カリの世界市場規模、シェア、産業動向分析レポート:製品別、最終用途別、地域別展望と予測、2023年~2030年 |
|
出版日: 2023年08月31日
発行: KBV Research
ページ情報: 英文 279 Pages
納期: 即納可能
|

- 全表示
- 概要
- 図表
- 目次
カリ市場規模は、予測期間中にCAGR 5.4%で成長し、2030年までに826億米ドルに達すると予測されます。2022年の市場規模は1,19,552.2キロトンに達し、4.6%の成長(2019-2022年)を遂げています。
しかし、その複雑な製造要件のため、SOP肥料は高価です。SOPの製造に使われる一般的な技術のひとつにマンハイム法があります。この製法はコストが高いため、SOPは割高です。このプロセスで製品別として生産される塩酸は販売できないため、これを採用するメーカーはSOPの販売で製造コストを回収せざるを得ないです。このため、SOPは通常、塩化カリウムに比べて1トン当たり150ドル以上高いです。このため、SOP製造コストの高さが、予測期間を通じて市場の拡大を妨げる可能性があります。
製品の展望
製品によって、市場は塩化カリウム、硫酸カリウム、硝酸カリウム、その他に区分されます。2つの重要な栄養素であるカリウムと硝酸塩は、両方の可溶性形態である硝酸カリウムに含まれています。硝酸カリウムは、果物、野菜、花など様々な作物の肥料として使用されます。硝酸カリウムには、特に溶解性が高く、塩化物を含まない栄養源が必要な場合に利点があります。このような土壌では、窒素のすべてが硝酸塩としてすぐに植物に取り込まれるため、土壌の変換や微生物の活動を追加する必要がないです。農家は、品質と生産量を向上させるため、高価値作物や非伝統的な野菜を栽培する際に、硝酸塩ベースの栄養源を選択することがあります。
エンドユーザーの展望
最終用途に基づいて、市場は農業と非農業に細分化されます。2022年には、農業セグメントが市場で最大の収益シェアを占めました。この拡大は、農業部門が作物の成長を促進し、収量を最大化し、世界の食糧安全保障を保証する能力を有しているためです。この重要な栄養素は、根の形成、植物の成長、植物の生長を促進することによって作物の健康をサポートします。需要の増加に対応して農業生産高を増加させるために使用される混合肥料における重要性が増しているため、カリは現在の農業技術において重要な要素とみなされるようになっています。農家は、世界人口の拡大とそれに伴う食糧消費の増加に対応するため、常に農業生産の拡大を試みています。
地域別展望
地域別に見ると、市場は北米、欧州、アジア太平洋、LAMEAで分析されます。2022年には、アジア太平洋地域が最大の収益シェアを獲得し、市場を独占しました。これは主に、中国やインドなどの先進国における製品需要の増加に起因します。これらの国々の巨大な農業産業は、その膨大な人口にサービスを提供し、食糧生産の大幅な増加を求めています。小麦、米、トウモロコシ、野菜といった作物の開発が、中国のカリ需要の主な原因です。さらにインドでは、小麦、米、サトウキビ、綿花などの作物が農業の中心となっています。アジア太平洋地域は、人口の増加、都市化の進展、持続可能な農業への継続的な動きなど、いくつかの要因によって高い製品需要があります。
目次
第1章 市場範囲と調査手法
- 市場の定義
- 目的
- 市場範囲
- セグメンテーション
- 調査手法
第2章 市場の概要
- 主なハイライト
第3章 市場概要
- イントロダクション
- 概要
- 市場構成とシナリオ
- 概要
- 市場に影響を与える主な要因
- 市場促進要因
- 市場抑制要因
- ポーターファイブフォース分析
第4章 カリ市場で展開された戦略
第5章 世界のカリ市場:製品別
- 世界の塩化カリウム市場:地域別
- 世界の硝酸カリウム市場:地域別
- 世界の硫酸カリウム市場:地域別
- 世界のその他の市場:地域別
第6章 世界のカリ市場:最終用途別
- 世界の農業市場:地域別
- 世界の非農業市場:地域別
第7章 世界のカリ市場:地域別
- 北米
- 北米の市場:国別
- 米国
- メキシコ
- カナダ
- その他北米地域
- 北米の市場:国別
- 欧州
- 欧州の市場:国別
- ロシア
- フランス
- ドイツ
- 英国
- スペイン
- イタリア
- その他欧州地域
- 欧州の市場:国別
- アジア太平洋
- アジア太平洋の市場:国別
- 中国
- インド
- タイ
- 日本
- 韓国
- オーストラリア
- その他アジア太平洋地域
- アジア太平洋の市場:国別
- ラテンアメリカ・中東・アフリカ
- ラテンアメリカ・中東・アフリカの市場:国別
- ブラジル
- アルゼンチン
- 南アフリカ
- ナイジェリア
- モロッコ
- チリ
- その他ラテンアメリカ・中東・アフリカ地域
- ラテンアメリカ・中東・アフリカの市場:国別
第8章 企業プロファイル
- The Mosaic Company
- Rio Tinto PLC(Rio Tinto International Holdings Limited)
- Compass Minerals International, Inc
- Nutrien Limited
- Western Nutrients Corporation
- Yara International ASA
- BHP Group Limited
- Encanto Potash Corp
- Red Metal Limited
- Intrepid Potash Inc
第9章 カリ市場にとって勝利は必須
LIST OF TABLES
- TABLE 1 Global Potash Market, 2019 - 2022, USD Million
- TABLE 2 Global Potash Market, 2023 - 2030, USD Million
- TABLE 3 Global Potash Market, 2019 - 2022, Kilo Tonnes
- TABLE 4 Global Potash Market, 2023 - 2030, Kilo Tonnes
- TABLE 5 Global Potash Market by Product, 2019 - 2022, USD Million
- TABLE 6 Global Potash Market by Product, 2023 - 2030, USD Million
- TABLE 7 Global Potash Market by Product, 2019 - 2022, Kilo Tonnes
- TABLE 8 Global Potash Market by Product, 2023 - 2030, Kilo Tonnes
- TABLE 9 Global Potassium Chloride Market by Region, 2019 - 2022, USD Million
- TABLE 10 Global Potassium Chloride Market by Region, 2023 - 2030, USD Million
- TABLE 11 Global Potassium Chloride Market by Region, 2019 - 2022, Kilo Tonnes
- TABLE 12 Global Potassium Chloride Market by Region, 2023 - 2030, Kilo Tonnes
- TABLE 13 Global Potassium Nitrate Market by Region, 2019 - 2022, USD Million
- TABLE 14 Global Potassium Nitrate Market by Region, 2023 - 2030, USD Million
- TABLE 15 Global Potassium Nitrate Market by Region, 2019 - 2022, Kilo Tonnes
- TABLE 16 Global Potassium Nitrate Market by Region, 2023 - 2030, Kilo Tonnes
- TABLE 17 Global Potassium Sulphate Market by Region, 2019 - 2022, USD Million
- TABLE 18 Global Potassium Sulphate Market by Region, 2023 - 2030, USD Million
- TABLE 19 Global Potassium Sulphate Market by Region, 2019 - 2022, Kilo Tonnes
- TABLE 20 Global Potassium Sulphate Market by Region, 2023 - 2030, Kilo Tonnes
- TABLE 21 Global Others Market by Region, 2019 - 2022, USD Million
- TABLE 22 Global Others Market by Region, 2023 - 2030, USD Million
- TABLE 23 Global Others Market by Region, 2019 - 2022, Kilo Tonnes
- TABLE 24 Global Others Market by Region, 2023 - 2030, Kilo Tonnes
- TABLE 25 Global Potash Market by End-use, 2019 - 2022, USD Million
- TABLE 26 Global Potash Market by End-use, 2023 - 2030, USD Million
- TABLE 27 Global Potash Market by End-use, 2019 - 2022, Kilo Tonnes
- TABLE 28 Global Potash Market by End-use, 2023 - 2030, Kilo Tonnes
- TABLE 29 Global Agriculture Market by Region, 2019 - 2022, USD Million
- TABLE 30 Global Agriculture Market by Region, 2023 - 2030, USD Million
- TABLE 31 Global Agriculture Market by Region, 2019 - 2022, Kilo Tonnes
- TABLE 32 Global Agriculture Market by Region, 2023 - 2030, Kilo Tonnes
- TABLE 33 Global Non-Agriculture Market by Region, 2019 - 2022, USD Million
- TABLE 34 Global Non-Agriculture Market by Region, 2023 - 2030, USD Million
- TABLE 35 Global Non-Agriculture Market by Region, 2019 - 2022, Kilo Tonnes
- TABLE 36 Global Non-Agriculture Market by Region, 2023 - 2030, Kilo Tonnes
- TABLE 37 Global Potash Market by Region, 2019 - 2022, USD Million
- TABLE 38 Global Potash Market by Region, 2023 - 2030, USD Million
- TABLE 39 Global Potash Market by Region, 2019 - 2022, Kilo Tonnes
- TABLE 40 Global Potash Market by Region, 2023 - 2030, Kilo Tonnes
- TABLE 41 North America Potash Market, 2019 - 2022, USD Million
- TABLE 42 North America Potash Market, 2023 - 2030, USD Million
- TABLE 43 North America Potash Market, 2019 - 2022, Kilo Tonnes
- TABLE 44 North America Potash Market, 2023 - 2030, Kilo Tonnes
- TABLE 45 North America Potash Market by Product, 2019 - 2022, USD Million
- TABLE 46 North America Potash Market by Product, 2023 - 2030, USD Million
- TABLE 47 North America Potash Market by Product, 2019 - 2022, Kilo Tonnes
- TABLE 48 North America Potash Market by Product, 2023 - 2030, Kilo Tonnes
- TABLE 49 North America Potassium Chloride Market by Country, 2019 - 2022, USD Million
- TABLE 50 North America Potassium Chloride Market by Country, 2023 - 2030, USD Million
- TABLE 51 North America Potassium Chloride Market by Country, 2019 - 2022, Kilo Tonnes
- TABLE 52 North America Potassium Chloride Market by Country, 2023 - 2030, Kilo Tonnes
- TABLE 53 North America Potassium Nitrate Market by Country, 2019 - 2022, USD Million
- TABLE 54 North America Potassium Nitrate Market by Country, 2023 - 2030, USD Million
- TABLE 55 North America Potassium Nitrate Market by Country, 2019 - 2022, Kilo Tonnes
- TABLE 56 North America Potassium Nitrate Market by Country, 2023 - 2030, Kilo Tonnes
- TABLE 57 North America Potassium Sulphate Market by Country, 2019 - 2022, USD Million
- TABLE 58 North America Potassium Sulphate Market by Country, 2023 - 2030, USD Million
- TABLE 59 North America Potassium Sulphate Market by Country, 2019 - 2022, Kilo Tonnes
- TABLE 60 North America Potassium Sulphate Market by Country, 2023 - 2030, Kilo Tonnes
- TABLE 61 North America Others Market by Country, 2019 - 2022, USD Million
- TABLE 62 North America Others Market by Country, 2023 - 2030, USD Million
- TABLE 63 North America Others Market by Country, 2019 - 2022, Kilo Tonnes
- TABLE 64 North America Others Market by Country, 2023 - 2030, Kilo Tonnes
- TABLE 65 North America Potash Market by End-use, 2019 - 2022, USD Million
- TABLE 66 North America Potash Market by End-use, 2023 - 2030, USD Million
- TABLE 67 North America Potash Market by End-use, 2019 - 2022, Kilo Tonnes
- TABLE 68 North America Potash Market by End-use, 2023 - 2030, Kilo Tonnes
- TABLE 69 North America Agriculture Market by Country, 2019 - 2022, USD Million
- TABLE 70 North America Agriculture Market by Country, 2023 - 2030, USD Million
- TABLE 71 North America Agriculture Market by Country, 2019 - 2022, Kilo Tonnes
- TABLE 72 North America Agriculture Market by Country, 2023 - 2030, Kilo Tonnes
- TABLE 73 North America Non-Agriculture Market by Country, 2019 - 2022, USD Million
- TABLE 74 North America Non-Agriculture Market by Country, 2023 - 2030, USD Million
- TABLE 75 North America Non-Agriculture Market by Country, 2019 - 2022, Kilo Tonnes
- TABLE 76 North America Non-Agriculture Market by Country, 2023 - 2030, Kilo Tonnes
- TABLE 77 North America Potash Market by Country, 2019 - 2022, USD Million
- TABLE 78 North America Potash Market by Country, 2023 - 2030, USD Million
- TABLE 79 North America Potash Market by Country, 2019 - 2022, Kilo Tonnes
- TABLE 80 North America Potash Market by Country, 2023 - 2030, Kilo Tonnes
- TABLE 81 US Potash Market, 2019 - 2022, USD Million
- TABLE 82 US Potash Market, 2023 - 2030, USD Million
- TABLE 83 US Potash Market, 2019 - 2022, Kilo Tonnes
- TABLE 84 US Potash Market, 2023 - 2030, Kilo Tonnes
- TABLE 85 US Potash Market by Product, 2019 - 2022, USD Million
- TABLE 86 US Potash Market by Product, 2023 - 2030, USD Million
- TABLE 87 US Potash Market by Product, 2019 - 2022, Kilo Tonnes
- TABLE 88 US Potash Market by Product, 2023 - 2030, Kilo Tonnes
- TABLE 89 US Potash Market by End-use, 2019 - 2022, USD Million
- TABLE 90 US Potash Market by End-use, 2023 - 2030, USD Million
- TABLE 91 US Potash Market by End-use, 2019 - 2022, Kilo Tonnes
- TABLE 92 US Potash Market by End-use, 2023 - 2030, Kilo Tonnes
- TABLE 93 Mexico Potash Market, 2019 - 2022, USD Million
- TABLE 94 Mexico Potash Market, 2023 - 2030, USD Million
- TABLE 95 Mexico Potash Market, 2019 - 2022, Kilo Tonnes
- TABLE 96 Mexico Potash Market, 2023 - 2030, Kilo Tonnes
- TABLE 97 Mexico Potash Market by Product, 2019 - 2022, USD Million
- TABLE 98 Mexico Potash Market by Product, 2023 - 2030, USD Million
- TABLE 99 Mexico Potash Market by Product, 2019 - 2022, Kilo Tonnes
- TABLE 100 Mexico Potash Market by Product, 2023 - 2030, Kilo Tonnes
- TABLE 101 Mexico Potash Market by End-use, 2019 - 2022, USD Million
- TABLE 102 Mexico Potash Market by End-use, 2023 - 2030, USD Million
- TABLE 103 Mexico Potash Market by End-use, 2019 - 2022, Kilo Tonnes
- TABLE 104 Mexico Potash Market by End-use, 2023 - 2030, Kilo Tonnes
- TABLE 105 Canada Potash Market, 2019 - 2022, USD Million
- TABLE 106 Canada Potash Market, 2023 - 2030, USD Million
- TABLE 107 Canada Potash Market, 2019 - 2022, Kilo Tonnes
- TABLE 108 Canada Potash Market, 2023 - 2030, Kilo Tonnes
- TABLE 109 Canada Potash Market by Product, 2019 - 2022, USD Million
- TABLE 110 Canada Potash Market by Product, 2023 - 2030, USD Million
- TABLE 111 Canada Potash Market by Product, 2019 - 2022, Kilo Tonnes
- TABLE 112 Canada Potash Market by Product, 2023 - 2030, Kilo Tonnes
- TABLE 113 Canada Potash Market by End-use, 2019 - 2022, USD Million
- TABLE 114 Canada Potash Market by End-use, 2023 - 2030, USD Million
- TABLE 115 Canada Potash Market by End-use, 2019 - 2022, Kilo Tonnes
- TABLE 116 Canada Potash Market by End-use, 2023 - 2030, Kilo Tonnes
- TABLE 117 Rest of North America Potash Market, 2019 - 2022, USD Million
- TABLE 118 Rest of North America Potash Market, 2023 - 2030, USD Million
- TABLE 119 Rest of North America Potash Market, 2019 - 2022, Kilo Tonnes
- TABLE 120 Rest of North America Potash Market, 2023 - 2030, Kilo Tonnes
- TABLE 121 Rest of North America Potash Market by Product, 2019 - 2022, USD Million
- TABLE 122 Rest of North America Potash Market by Product, 2023 - 2030, USD Million
- TABLE 123 Rest of North America Potash Market by Product, 2019 - 2022, Kilo Tonnes
- TABLE 124 Rest of North America Potash Market by Product, 2023 - 2030, Kilo Tonnes
- TABLE 125 Rest of North America Potash Market by End-use, 2019 - 2022, USD Million
- TABLE 126 Rest of North America Potash Market by End-use, 2023 - 2030, USD Million
- TABLE 127 Rest of North America Potash Market by End-use, 2019 - 2022, Kilo Tonnes
- TABLE 128 Rest of North America Potash Market by End-use, 2023 - 2030, Kilo Tonnes
- TABLE 129 Europe Potash Market, 2019 - 2022, USD Million
- TABLE 130 Europe Potash Market, 2023 - 2030, USD Million
- TABLE 131 Europe Potash Market, 2019 - 2022, Kilo Tonnes
- TABLE 132 Europe Potash Market, 2023 - 2030, Kilo Tonnes
- TABLE 133 Europe Potash Market by Product, 2019 - 2022, USD Million
- TABLE 134 Europe Potash Market by Product, 2023 - 2030, USD Million
- TABLE 135 Europe Potash Market by Product, 2019 - 2022, Kilo Tonnes
- TABLE 136 Europe Potash Market by Product, 2023 - 2030, Kilo Tonnes
- TABLE 137 Europe Potassium Chloride Market by Country, 2019 - 2022, USD Million
- TABLE 138 Europe Potassium Chloride Market by Country, 2023 - 2030, USD Million
- TABLE 139 Europe Potassium Chloride Market by Country, 2019 - 2022, Kilo Tonnes
- TABLE 140 Europe Potassium Chloride Market by Country, 2023 - 2030, Kilo Tonnes
- TABLE 141 Europe Potassium Nitrate Market by Country, 2019 - 2022, USD Million
- TABLE 142 Europe Potassium Nitrate Market by Country, 2023 - 2030, USD Million
- TABLE 143 Europe Potassium Nitrate Market by Country, 2019 - 2022, Kilo Tonnes
- TABLE 144 Europe Potassium Nitrate Market by Country, 2023 - 2030, Kilo Tonnes
- TABLE 145 Europe Potassium Sulphate Market by Country, 2019 - 2022, USD Million
- TABLE 146 Europe Potassium Sulphate Market by Country, 2023 - 2030, USD Million
- TABLE 147 Europe Potassium Sulphate Market by Country, 2019 - 2022, Kilo Tonnes
- TABLE 148 Europe Potassium Sulphate Market by Country, 2023 - 2030, Kilo Tonnes
- TABLE 149 Europe Others Market by Country, 2019 - 2022, USD Million
- TABLE 150 Europe Others Market by Country, 2023 - 2030, USD Million
- TABLE 151 Europe Others Market by Country, 2019 - 2022, Kilo Tonnes
- TABLE 152 Europe Others Market by Country, 2023 - 2030, Kilo Tonnes
- TABLE 153 Europe Potash Market by End-use, 2019 - 2022, USD Million
- TABLE 154 Europe Potash Market by End-use, 2023 - 2030, USD Million
- TABLE 155 Europe Potash Market by End-use, 2019 - 2022, Kilo Tonnes
- TABLE 156 Europe Potash Market by End-use, 2023 - 2030, Kilo Tonnes
- TABLE 157 Europe Agriculture Market by Country, 2019 - 2022, USD Million
- TABLE 158 Europe Agriculture Market by Country, 2023 - 2030, USD Million
- TABLE 159 Europe Agriculture Market by Country, 2019 - 2022, Kilo Tonnes
- TABLE 160 Europe Agriculture Market by Country, 2023 - 2030, Kilo Tonnes
- TABLE 161 Europe Non-Agriculture Market by Country, 2019 - 2022, USD Million
- TABLE 162 Europe Non-Agriculture Market by Country, 2023 - 2030, USD Million
- TABLE 163 Europe Non-Agriculture Market by Country, 2019 - 2022, Kilo Tonnes
- TABLE 164 Europe Non-Agriculture Market by Country, 2023 - 2030, Kilo Tonnes
- TABLE 165 Europe Potash Market by Country, 2019 - 2022, USD Million
- TABLE 166 Europe Potash Market by Country, 2023 - 2030, USD Million
- TABLE 167 Europe Potash Market by Country, 2019 - 2022, Kilo Tonnes
- TABLE 168 Europe Potash Market by Country, 2023 - 2030, Kilo Tonnes
- TABLE 169 Russia Potash Market, 2019 - 2022, USD Million
- TABLE 170 Russia Potash Market, 2023 - 2030, USD Million
- TABLE 171 Russia Potash Market, 2019 - 2022, Kilo Tonnes
- TABLE 172 Russia Potash Market, 2023 - 2030, Kilo Tonnes
- TABLE 173 Russia Potash Market by Product, 2019 - 2022, USD Million
- TABLE 174 Russia Potash Market by Product, 2023 - 2030, USD Million
- TABLE 175 Russia Potash Market by Product, 2019 - 2022, Kilo Tonnes
- TABLE 176 Russia Potash Market by Product, 2023 - 2030, Kilo Tonnes
- TABLE 177 Russia Potash Market by End-use, 2019 - 2022, USD Million
- TABLE 178 Russia Potash Market by End-use, 2023 - 2030, USD Million
- TABLE 179 Russia Potash Market by End-use, 2019 - 2022, Kilo Tonnes
- TABLE 180 Russia Potash Market by End-use, 2023 - 2030, Kilo Tonnes
- TABLE 181 France Potash Market, 2019 - 2022, USD Million
- TABLE 182 France Potash Market, 2023 - 2030, USD Million
- TABLE 183 France Potash Market, 2019 - 2022, Kilo Tonnes
- TABLE 184 France Potash Market, 2023 - 2030, Kilo Tonnes
- TABLE 185 France Potash Market by Product, 2019 - 2022, USD Million
- TABLE 186 France Potash Market by Product, 2023 - 2030, USD Million
- TABLE 187 France Potash Market by Product, 2019 - 2022, Kilo Tonnes
- TABLE 188 France Potash Market by Product, 2023 - 2030, Kilo Tonnes
- TABLE 189 France Potash Market by End-use, 2019 - 2022, USD Million
- TABLE 190 France Potash Market by End-use, 2023 - 2030, USD Million
- TABLE 191 France Potash Market by End-use, 2019 - 2022, Kilo Tonnes
- TABLE 192 France Potash Market by End-use, 2023 - 2030, Kilo Tonnes
- TABLE 193 Germany Potash Market, 2019 - 2022, USD Million
- TABLE 194 Germany Potash Market, 2023 - 2030, USD Million
- TABLE 195 Germany Potash Market, 2019 - 2022, Kilo Tonnes
- TABLE 196 Germany Potash Market, 2023 - 2030, Kilo Tonnes
- TABLE 197 Germany Potash Market by Product, 2019 - 2022, USD Million
- TABLE 198 Germany Potash Market by Product, 2023 - 2030, USD Million
- TABLE 199 Germany Potash Market by Product, 2019 - 2022, Kilo Tonnes
- TABLE 200 Germany Potash Market by Product, 2023 - 2030, Kilo Tonnes
- TABLE 201 Germany Potash Market by End-use, 2019 - 2022, USD Million
- TABLE 202 Germany Potash Market by End-use, 2023 - 2030, USD Million
- TABLE 203 Germany Potash Market by End-use, 2019 - 2022, Kilo Tonnes
- TABLE 204 Germany Potash Market by End-use, 2023 - 2030, Kilo Tonnes
- TABLE 205 UK Potash Market, 2019 - 2022, USD Million
- TABLE 206 UK Potash Market, 2023 - 2030, USD Million
- TABLE 207 UK Potash Market, 2019 - 2022, Kilo Tonnes
- TABLE 208 UK Potash Market, 2023 - 2030, Kilo Tonnes
- TABLE 209 UK Potash Market by Product, 2019 - 2022, USD Million
- TABLE 210 UK Potash Market by Product, 2023 - 2030, USD Million
- TABLE 211 UK Potash Market by Product, 2019 - 2022, Kilo Tonnes
- TABLE 212 UK Potash Market by Product, 2023 - 2030, Kilo Tonnes
- TABLE 213 UK Potash Market by End-use, 2019 - 2022, USD Million
- TABLE 214 UK Potash Market by End-use, 2023 - 2030, USD Million
- TABLE 215 UK Potash Market by End-use, 2019 - 2022, Kilo Tonnes
- TABLE 216 UK Potash Market by End-use, 2023 - 2030, Kilo Tonnes
- TABLE 217 Spain Potash Market, 2019 - 2022, USD Million
- TABLE 218 Spain Potash Market, 2023 - 2030, USD Million
- TABLE 219 Spain Potash Market, 2019 - 2022, Kilo Tonnes
- TABLE 220 Spain Potash Market, 2023 - 2030, Kilo Tonnes
- TABLE 221 Spain Potash Market by Product, 2019 - 2022, USD Million
- TABLE 222 Spain Potash Market by Product, 2023 - 2030, USD Million
- TABLE 223 Spain Potash Market by Product, 2019 - 2022, Kilo Tonnes
- TABLE 224 Spain Potash Market by Product, 2023 - 2030, Kilo Tonnes
- TABLE 225 Spain Potash Market by End-use, 2019 - 2022, USD Million
- TABLE 226 Spain Potash Market by End-use, 2023 - 2030, USD Million
- TABLE 227 Spain Potash Market by End-use, 2019 - 2022, Kilo Tonnes
- TABLE 228 Spain Potash Market by End-use, 2023 - 2030, Kilo Tonnes
- TABLE 229 Italy Potash Market, 2019 - 2022, USD Million
- TABLE 230 Italy Potash Market, 2023 - 2030, USD Million
- TABLE 231 Italy Potash Market, 2019 - 2022, Kilo Tonnes
- TABLE 232 Italy Potash Market, 2023 - 2030, Kilo Tonnes
- TABLE 233 Italy Potash Market by Product, 2019 - 2022, USD Million
- TABLE 234 Italy Potash Market by Product, 2023 - 2030, USD Million
- TABLE 235 Italy Potash Market by Product, 2019 - 2022, Kilo Tonnes
- TABLE 236 Italy Potash Market by Product, 2023 - 2030, Kilo Tonnes
- TABLE 237 Italy Potash Market by End-use, 2019 - 2022, USD Million
- TABLE 238 Italy Potash Market by End-use, 2023 - 2030, USD Million
- TABLE 239 Italy Potash Market by End-use, 2019 - 2022, Kilo Tonnes
- TABLE 240 Italy Potash Market by End-use, 2023 - 2030, Kilo Tonnes
- TABLE 241 Rest of Europe Potash Market, 2019 - 2022, USD Million
- TABLE 242 Rest of Europe Potash Market, 2023 - 2030, USD Million
- TABLE 243 Rest of Europe Potash Market, 2019 - 2022, Kilo Tonnes
- TABLE 244 Rest of Europe Potash Market, 2023 - 2030, Kilo Tonnes
- TABLE 245 Rest of Europe Potash Market by Product, 2019 - 2022, USD Million
- TABLE 246 Rest of Europe Potash Market by Product, 2023 - 2030, USD Million
- TABLE 247 Rest of Europe Potash Market by Product, 2019 - 2022, Kilo Tonnes
- TABLE 248 Rest of Europe Potash Market by Product, 2023 - 2030, Kilo Tonnes
- TABLE 249 Rest of Europe Potash Market by End-use, 2019 - 2022, USD Million
- TABLE 250 Rest of Europe Potash Market by End-use, 2023 - 2030, USD Million
- TABLE 251 Rest of Europe Potash Market by End-use, 2019 - 2022, Kilo Tonnes
- TABLE 252 Rest of Europe Potash Market by End-use, 2023 - 2030, Kilo Tonnes
- TABLE 253 Asia Pacific Potash Market, 2019 - 2022, USD Million
- TABLE 254 Asia Pacific Potash Market, 2023 - 2030, USD Million
- TABLE 255 Asia Pacific Potash Market, 2019 - 2022, Kilo Tonnes
- TABLE 256 Asia Pacific Potash Market, 2023 - 2030, Kilo Tonnes
- TABLE 257 Asia Pacific Potash Market by Product, 2019 - 2022, USD Million
- TABLE 258 Asia Pacific Potash Market by Product, 2023 - 2030, USD Million
- TABLE 259 Asia Pacific Potash Market by Product, 2019 - 2022, Kilo Tonnes
- TABLE 260 Asia Pacific Potash Market by Product, 2023 - 2030, Kilo Tonnes
- TABLE 261 Asia Pacific Potassium Chloride Market by Country, 2019 - 2022, USD Million
- TABLE 262 Asia Pacific Potassium Chloride Market by Country, 2023 - 2030, USD Million
- TABLE 263 Asia Pacific Potassium Chloride Market by Country, 2019 - 2022, Kilo Tonnes
- TABLE 264 Asia Pacific Potassium Chloride Market by Country, 2023 - 2030, Kilo Tonnes
- TABLE 265 Asia Pacific Potassium Nitrate Market by Country, 2019 - 2022, USD Million
- TABLE 266 Asia Pacific Potassium Nitrate Market by Country, 2023 - 2030, USD Million
- TABLE 267 Asia Pacific Potassium Nitrate Market by Country, 2019 - 2022, Kilo Tonnes
- TABLE 268 Asia Pacific Potassium Nitrate Market by Country, 2023 - 2030, Kilo Tonnes
- TABLE 269 Asia Pacific Potassium Sulphate Market by Country, 2019 - 2022, USD Million
- TABLE 270 Asia Pacific Potassium Sulphate Market by Country, 2023 - 2030, USD Million
- TABLE 271 Asia Pacific Potassium Sulphate Market by Country, 2019 - 2022, Kilo Tonnes
- TABLE 272 Asia Pacific Potassium Sulphate Market by Country, 2023 - 2030, Kilo Tonnes
- TABLE 273 Asia Pacific Others Market by Country, 2019 - 2022, USD Million
- TABLE 274 Asia Pacific Others Market by Country, 2023 - 2030, USD Million
- TABLE 275 Asia Pacific Others Market by Country, 2019 - 2022, Kilo Tonnes
- TABLE 276 Asia Pacific Others Market by Country, 2023 - 2030, Kilo Tonnes
- TABLE 277 Asia Pacific Potash Market by End-use, 2019 - 2022, USD Million
- TABLE 278 Asia Pacific Potash Market by End-use, 2023 - 2030, USD Million
- TABLE 279 Asia Pacific Potash Market by End-use, 2019 - 2022, Kilo Tonnes
- TABLE 280 Asia Pacific Potash Market by End-use, 2023 - 2030, Kilo Tonnes
- TABLE 281 Asia Pacific Agriculture Market by Country, 2019 - 2022, USD Million
- TABLE 282 Asia Pacific Agriculture Market by Country, 2023 - 2030, USD Million
- TABLE 283 Asia Pacific Agriculture Market by Country, 2019 - 2022, Kilo Tonnes
- TABLE 284 Asia Pacific Agriculture Market by Country, 2023 - 2030, Kilo Tonnes
- TABLE 285 Asia Pacific Non-Agriculture Market by Country, 2019 - 2022, USD Million
- TABLE 286 Asia Pacific Non-Agriculture Market by Country, 2023 - 2030, USD Million
- TABLE 287 Asia Pacific Non-Agriculture Market by Country, 2019 - 2022, Kilo Tonnes
- TABLE 288 Asia Pacific Non-Agriculture Market by Country, 2023 - 2030, Kilo Tonnes
- TABLE 289 Asia Pacific Potash Market by Country, 2019 - 2022, USD Million
- TABLE 290 Asia Pacific Potash Market by Country, 2023 - 2030, USD Million
- TABLE 291 Asia Pacific Potash Market by Country, 2019 - 2022, Kilo Tonnes
- TABLE 292 Asia Pacific Potash Market by Country, 2023 - 2030, Kilo Tonnes
The Global Potash Market size is expected to reach $82.6 billion by 2030, rising at a market growth of 5.4% CAGR during the forecast period. In the year 2022, the market attained a volume of 1,19,552.2 kilo tonnes, experiencing a growth of 4.6% (2019-2022).
The United States and Canada are primarily responsible for the increase in market demand in the North American region. Consequently, the North America Region acquired $11.9 billion revenue in the market in 2022. The agricultural sectors in these nations are sizable and support a wide variety of crops. The region's demand mostly depends on producing essential crops, including soybeans, corn, wheat, and canola. The need for potash in North America is further made more pressing by adopting cutting-edge farming methods and precision agriculture techniques. Some of the factors impacting the market are growing need to boost food production, increased adoption of precision farming, and high cost of SOP.
Due to changes in people's eating patterns, the demand for food has increased faster than the population. This has caused the need for pesticides and fertilizer to increase. These herbicides and fertilizers increase crop yield, soil fertility, and output. As a result, it is anticipated that demand for potassium chloride will rise in lockstep with the expansion of the agricultural sector. Additionally, there is an overall improvement in plant quality due to the rising demand for high-performance fertilizers, increasing potash fertilizer applicability, and adding potash fertilizer. It extends shelf life, another vital fueling the market's expansion. Growing environmental awareness will encourage market value expansion even further. Global warming has had a significant impact on climatic conditions around the world. Additionally, an essential factor that significantly influences agriculture is the climate. With the aid of precision agricultural tools, farmers can efficiently and adequately apply potash, guaranteeing crops receive the proper nutrients while lowering the possibility of environmental impact. Farmers can maximize their potash usage by using precision agriculture, which improves crop yields and has a smaller negative ecological impact. Given this, the market is predicted to expand in the coming years due to the increased use of precision farming.
However, Due to their intricate manufacturing requirements, SOP fertilizers are pricey. One of the popular techniques used to produce SOPs is the Mannheim process. Because of the high cost of this process, SOP is more expensive. Because the hydrochloric acid produced as a byproduct of this process cannot be sold, the manufacturers who employ it are forced to recoup their manufacturing costs through the sales of SOP. Due to this, SOP usually costs more than $150 per ton compared to potassium chloride. Because of this, the high cost of SOP manufacturing may hinder market expansion of the market throughout the projection period.
Product Outlook
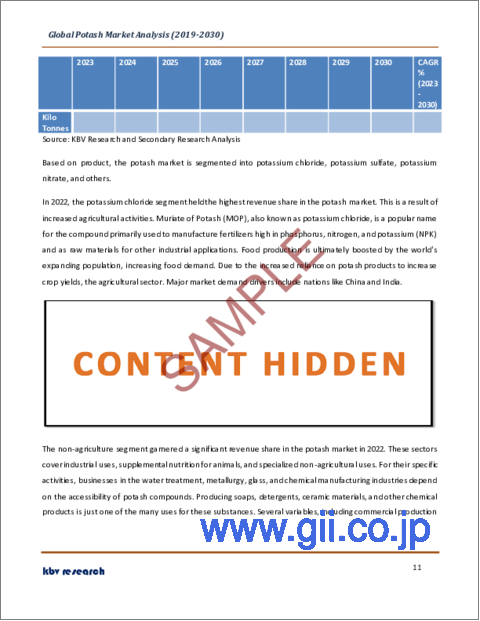
Based on product, the market is segmented into potassium chloride, potassium sulfate, potassium nitrate, and others. Two crucial nutrients, potassium and nitrate, are found in potassium nitrate, a soluble form of both. It is used as a fertilizer for various crops, including fruits, vegetables, and flowers. Potassium nitrate has advantages, especially when a highly soluble, chloride-free nutrient source is needed. There is no need for additional soil transformation or microbial activity in these soils because all of the nitrogen is immediately available for uptake by the plant as nitrate. Farmers occasionally choose nitrate-based nutritional supplies while cultivating high-value/non-traditional crops and vegetables to boost quality and output.
End User Outlook
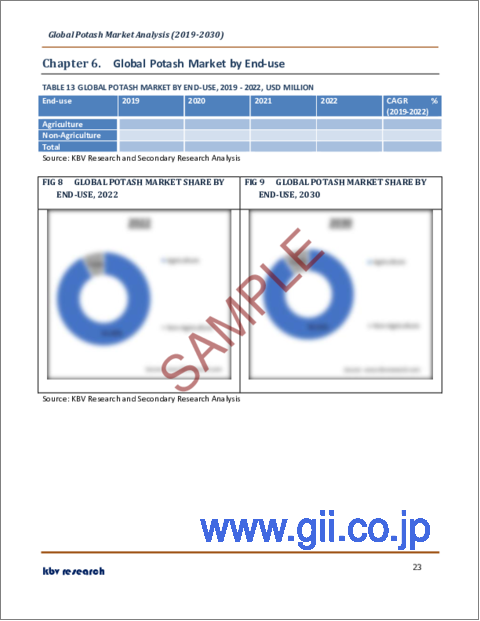
On the basis of end-use, the market is fragmented into agriculture and non-agriculture. In 2022, the agriculture segment witnessed the largest revenue share in the market. This expansion is credited to the agricultural sector's capacity to boost crop growth, maximize yields, and guarantee food security worldwide. This vital nutrient supports crop health by promoting root formation, plant growth, and plant growth. Due to its increasing importance in fertilizer mixes used to increase agricultural output in response to increased demand, potash has come to be regarded as a crucial component of current farming techniques. Farmers constantly attempt to boost agricultural production in response to the expanding global population and the resulting rise in food consumption, which results in a persistent and significant need for potash-based fertilizers.
Regional Outlook
Region-wise, the market is analyzed across North America, Europe, Asia Pacific, and LAMEA. In 2022, the Asia Pacific region dominated the market by generating the maximum revenue share. This is mainly attributed to increased product demand in developed nations like China and India. These nations' huge agricultural industries, which serve their sizable populations, call for a significant increase in food production. The development of crops like wheat, rice, corn, and vegetables is chiefly responsible for China's demand for potash. Additionally, crops, including wheat, rice, sugarcane, and cotton, are the primary agricultural focus in India. The Asia Pacific region experiences high product demand, primarily driven by several factors, including the region's expanding population, increasing urbanization, and ongoing movement toward sustainable agriculture.
The market research report covers the analysis of key stakeholders of the market. Key companies profiled in the report include The Mosaic Company, Rio Tinto PLC, Compass Minerals International, Inc., Nutrien Limited, western nutrients corporation, Yara International ASA, BHP Group Limited, Encanto Potash Corp., Red Metal Ltd., and Intrepid Potash Inc.
Strategies Deployed in Potash Market
Jul-2022: Nutrien Limited announced the acquisition of Casa do Adubo S.A., a family-founded Casa do Adubo started in 1937 as Irmaos Chiabai, trading goods in Afonso Claudio, ES. Through this acquisition, Nutrien would take over 10 Agrodistribuidor Casal distribution centres and 39 retail outlets under the brands Casa do Adubo and Acre, Bahia, Esprito Santo, Maranho, Mato Grosso, etc.
May-2022: Rio Tinto PLC announced collaboration with BHP, a company providing resources for a cleaner future, including copper for renewable energy. Through this collaboration, both the companies hope to take advantage of the excellent inventions and ideas. Moreover, both want to identify methods to make tailings facilities safer and more environmentally friendly.
Mar-2021: The Mosaic Company entered a partnership with Sound Agriculture. This partnership aimed to bring a revolutionary nutrient efficiency product to market to accelerate yields across major row crops and improve soil health. The companies would team up on the development and distribution of a proprietary mix of Sound Agriculture's bio-inspired chemistry and key micronutrients.
Mar-2021: The Mosaic Company came into collaboration with AgBiome, a biotechnology company. This collaboration aimed to develop, discover, and introduce biological alternatives to boost soil fertility. In addition, Mosaic and AgBiome would support the development of advanced agricultural technologies, which facilitate farmers to boost nutrient usage efficiency and ultimately decrease fertilizer loss to the environment.
Apr-2020: Nutrien entered into a definitive agreement to purchase 100 percent of the equity of the Tec Agro Group. This acquisition would support the company's strategy to bring whole-farm solutions to the Brazilian customers.
Apr-2019: Nutrien took over Ruralco Holdings Limited in Australia. Through this acquisition, the combination of Ruralco's business with Nutrien's Landmark operations would offer significant advantages for all stakeholders and boost the delivery of products and services to Australian farmers. The combination would also offer Australian growers with advanced solutions offerings to allow them to better compete in global markets.
Scope of the Study
Market Segments covered in the Report:
By Product (Volume, Kilo Tonnes, USD Million, 2019-2030)
- Potassium Chloride
- Potassium Nitrate
- Potassium Sulphate
- Others
By End User (Volume, Kilo Tonnes, USD Million, 2019-2030)
- Agriculture
- Non-Agriculture
By Geography (Volume, Kilo Tonnes, USD Million, 2019-2030)
- North America
- US
- Mexico
- Canada
- Rest of North America
- Europe
- Russia
- France
- Germany
- UK
- Spain
- Italy
- Rest of Europe
- Asia Pacific
- China
- India
- Thailand
- Japan
- South Korea
- Australia
- Rest of Asia Pacific
- LAMEA
- Brazil
- Argentina
- South Africa
- Nigeria
- Morocco
- Chile
- Rest of LAMEA
Companies Profiled
- The Mosaic Company
- Rio Tinto PLC
- Compass Minerals International, Inc.
- Nutrien Limited
- Western nutrients corporation
- Yara International ASA
- BHP Group Limited
- Encanto Potash Corp.
- Red Metal Ltd.
- Intrepid Potash Inc.
Unique Offerings from KBV Research
- Exhaustive coverage
- Highest number of market tables and figures
- Subscription based model available
- Guaranteed best price
- Assured post sales research support with 10% customization free
Table of Contents
Chapter 1. Market Scope & Methodology
- 1.1 Market Definition
- 1.2 Objectives
- 1.3 Market Scope
- 1.4 Segmentation
- 1.4.1 Global Potash Market, by Product
- 1.4.2 Global Potash Market, by End Use
- 1.4.3 Global Potash Market, by Geography
- 1.5 Methodology for the research
Chapter 2. Market At a Glance
- 2.1 Key Highlights
Chapter 3. Market Overview
- 3.1 Introduction
- 3.1.1 Overview
- 3.1.1.1 Market Composition and Scenario
- 3.1.1 Overview
- 3.2 Key Factors Impacting the Market
- 3.2.1 Market Drivers
- 3.2.2 Market Restraints
- 3.3 Porter Five Forces Analysis
Chapter 4. Strategies Deployed in-Potash Market
Chapter 5. Global Potash Market by Product
- 5.1 Global Potassium Chloride Market by Region
- 5.2 Global Potassium Nitrate Market by Region
- 5.3 Global Potassium Sulphate Market by Region
- 5.4 Global Others Market by Region
Chapter 6. Global Potash Market by End-use
- 6.1 Global Agriculture Market by Region
- 6.2 Global Non-Agriculture Market by Region
Chapter 7. Global Potash Market by Region
- 7.1 North America Potash Market
- 7.1.1 North America Potash Market by Product
- 7.1.1.1 North America Potassium Chloride Market by Country
- 7.1.1.2 North America Potassium Nitrate Market by Country
- 7.1.1.3 North America Potassium Sulphate Market by Country
- 7.1.1.4 North America Others Market by Country
- 7.1.2 North America Potash Market by End-use
- 7.1.2.1 North America Agriculture Market by Country
- 7.1.2.2 North America Non-Agriculture Market by Country
- 7.1.3 North America Potash Market by Country
- 7.1.3.1 US Potash Market
- 7.1.3.1.1 US Potash Market by Product
- 7.1.3.1.2 US Potash Market by End-use
- 7.1.3.2 Mexico Potash Market
- 7.1.3.2.1 Mexico Potash Market by Product
- 7.1.3.2.2 Mexico Potash Market by End-use
- 7.1.3.3 Canada Potash Market
- 7.1.3.3.1 Canada Potash Market by Product
- 7.1.3.3.2 Canada Potash Market by End-use
- 7.1.3.4 Rest of North America Potash Market
- 7.1.3.4.1 Rest of North America Potash Market by Product
- 7.1.3.4.2 Rest of North America Potash Market by End-use
- 7.1.3.1 US Potash Market
- 7.1.1 North America Potash Market by Product
- 7.2 Europe Potash Market
- 7.2.1 Europe Potash Market by Product
- 7.2.1.1 Europe Potassium Chloride Market by Country
- 7.2.1.2 Europe Potassium Nitrate Market by Country
- 7.2.1.3 Europe Potassium Sulphate Market by Country
- 7.2.1.4 Europe Others Market by Country
- 7.2.2 Europe Potash Market by End-use
- 7.2.2.1 Europe Agriculture Market by Country
- 7.2.2.2 Europe Non-Agriculture Market by Country
- 7.2.3 Europe Potash Market by Country
- 7.2.3.1 Russia Potash Market
- 7.2.3.1.1 Russia Potash Market by Product
- 7.2.3.1.2 Russia Potash Market by End-use
- 7.2.3.2 France Potash Market
- 7.2.3.2.1 France Potash Market by Product
- 7.2.3.2.2 France Potash Market by End-use
- 7.2.3.3 Germany Potash Market
- 7.2.3.3.1 Germany Potash Market by Product
- 7.2.3.3.2 Germany Potash Market by End-use
- 7.2.3.4 UK Potash Market
- 7.2.3.4.1 UK Potash Market by Product
- 7.2.3.4.2 UK Potash Market by End-use
- 7.2.3.5 Spain Potash Market
- 7.2.3.5.1 Spain Potash Market by Product
- 7.2.3.5.2 Spain Potash Market by End-use
- 7.2.3.6 Italy Potash Market
- 7.2.3.6.1 Italy Potash Market by Product
- 7.2.3.6.2 Italy Potash Market by End-use
- 7.2.3.7 Rest of Europe Potash Market
- 7.2.3.7.1 Rest of Europe Potash Market by Product
- 7.2.3.7.2 Rest of Europe Potash Market by End-use
- 7.2.3.1 Russia Potash Market
- 7.2.1 Europe Potash Market by Product
- 7.3 Asia Pacific Potash Market
- 7.3.1 Asia Pacific Potash Market by Product
- 7.3.1.1 Asia Pacific Potassium Chloride Market by Country
- 7.3.1.2 Asia Pacific Potassium Nitrate Market by Country
- 7.3.1.3 Asia Pacific Potassium Sulphate Market by Country
- 7.3.1.4 Asia Pacific Others Market by Country
- 7.3.2 Asia Pacific Potash Market by End-use
- 7.3.2.1 Asia Pacific Agriculture Market by Country
- 7.3.2.2 Asia Pacific Non-Agriculture Market by Country
- 7.3.3 Asia Pacific Potash Market by Country
- 7.3.3.1 China Potash Market
- 7.3.3.1.1 China Potash Market by Product
- 7.3.3.1.2 China Potash Market by End-use
- 7.3.3.2 India Potash Market
- 7.3.3.2.1 India Potash Market by Product
- 7.3.3.2.2 India Potash Market by End-use
- 7.3.3.3 Thailand Potash Market
- 7.3.3.3.1 Thailand Potash Market by Product
- 7.3.3.3.2 Thailand Potash Market by End-use
- 7.3.3.4 Japan Potash Market
- 7.3.3.4.1 Japan Potash Market by Product
- 7.3.3.4.2 Japan Potash Market by End-use
- 7.3.3.5 South Korea Potash Market
- 7.3.3.5.1 South Korea Potash Market by Product
- 7.3.3.5.2 South Korea Potash Market by End-use
- 7.3.3.6 Australia Potash Market
- 7.3.3.6.1 Australia Potash Market by Product
- 7.3.3.6.2 Australia Potash Market by End-use
- 7.3.3.7 Rest of Asia Pacific Potash Market
- 7.3.3.7.1 Rest of Asia Pacific Potash Market by Product
- 7.3.3.7.2 Rest of Asia Pacific Potash Market by End-use
- 7.3.3.1 China Potash Market
- 7.3.1 Asia Pacific Potash Market by Product
- 7.4 LAMEA Potash Market
- 7.4.1 LAMEA Potash Market by Product
- 7.4.1.1 LAMEA Potassium Chloride Market by Country
- 7.4.1.2 LAMEA Potassium Nitrate Market by Country
- 7.4.1.3 LAMEA Potassium Sulphate Market by Country
- 7.4.1.4 LAMEA Others Market by Country
- 7.4.2 LAMEA Potash Market by End-use
- 7.4.2.1 LAMEA Agriculture Market by Country
- 7.4.2.2 LAMEA Non-Agriculture Market by Country
- 7.4.3 LAMEA Potash Market by Country
- 7.4.3.1 Brazil Potash Market
- 7.4.3.1.1 Brazil Potash Market by Product
- 7.4.3.1.2 Brazil Potash Market by End-use
- 7.4.3.2 Argentina Potash Market
- 7.4.3.2.1 Argentina Potash Market by Product
- 7.4.3.2.2 Argentina Potash Market by End-use
- 7.4.3.3 South Africa Potash Market
- 7.4.3.3.1 South Africa Potash Market by Product
- 7.4.3.3.2 South Africa Potash Market by End-use
- 7.4.3.4 Nigeria Potash Market
- 7.4.3.4.1 Nigeria Potash Market by Product
- 7.4.3.4.2 Nigeria Potash Market by End-use
- 7.4.3.5 Morocco Potash Market
- 7.4.3.5.1 Morocco Potash Market by Product
- 7.4.3.5.2 Morocco Potash Market by End-use
- 7.4.3.6 Chile Potash Market
- 7.4.3.6.1 Chile Potash Market by Product
- 7.4.3.6.2 Chile Potash Market by End-use
- 7.4.3.7 Rest of LAMEA Potash Market
- 7.4.3.7.1 Rest of LAMEA Potash Market by Product
- 7.4.3.7.2 Rest of LAMEA Potash Market by End-use
- 7.4.3.1 Brazil Potash Market
- 7.4.1 LAMEA Potash Market by Product
Chapter 8. Company Profiles
- 8.1 The Mosaic Company
- 8.1.1 Company Overview
- 8.1.2 Financial Analysis
- 8.1.3 Segmental and Regional Analysis
- 8.1.4 Recent strategies and developments:
- 8.1.4.1 Partnerships, Collaborations, and Agreements:
- 8.1.5 SWOT Analysis
- 8.2 Rio Tinto PLC (Rio Tinto International Holdings Limited)
- 8.2.1 Company Overview
- 8.2.2 Financial Analysis
- 8.2.3 Segmental and Regional Analysis
- 8.2.4 Research & Development Expenses
- 8.2.5 Recent strategies and developments:
- 8.2.5.1 Partnerships, Collaborations, and Agreements:
- 8.2.6 SWOT Analysis
- 8.3 Compass Minerals International, Inc.
- 8.3.1 Company Overview
- 8.3.2 Financial Analysis
- 8.3.3 Segmental and Regional Analysis
- 8.3.4 SWOT Analysis
- 8.4 Nutrien Limited
- 8.4.1 Company Overview
- 8.4.2 Financial Analysis
- 8.4.3 Segmental and Regional Analysis
- 8.4.4 Recent strategies and developments:
- 8.4.4.1 Acquisition and Mergers:
- 8.4.5 SWOT Analysis
- 8.5 Western Nutrients Corporation
- 8.5.1 Company Overview
- 8.5.2 SWOT Analysis
- 8.6 Yara International ASA
- 8.6.1 Company Overview
- 8.6.2 Financial Analysis
- 8.6.3 Regional Analysis
- 8.6.4 Research & Development Expenses
- 8.6.5 SWOT Analysis
- 8.7 BHP Group Limited
- 8.7.1 Company Overview
- 8.7.2 Financial Analysis
- 8.7.3 Segmental and Regional Analysis
- 8.7.4 SWOT Analysis
- 8.8 Encanto Potash Corp.
- 8.8.1 Company Overview
- 8.8.2 SWOT Analysis
- 8.9 Red Metal Limited
- 8.9.1 Company Overview
- 8.9.2 Financial Analysis
- 8.9.3 SWOT Analysis
- 8.10. Intrepid Potash Inc.
- 8.10.1 Company Overview
- 8.10.2 Financial Analysis
- 8.10.3 Segmental Analysis
- 8.10.4 SWOT Analysis
