|
|
市場調査レポート
商品コード
1645633
カリの世界市場 2025~2029年Global Potash Market 2025-2029 |
||||||
|
|||||||
カスタマイズ可能
|
|||||||

| カリの世界市場 2025~2029年 |
|
出版日: 2025年01月17日
発行: TechNavio
ページ情報: 英文 204 Pages
納期: 即納可能
|

全表示
- 概要
- 図表
- 目次
カリ市場は2024~2029年に168億1,820万米ドル、予測期間中のCAGRは4.9%で成長すると予測されます。
当レポートでは、カリ市場の全体的な分析、市場規模・予測、動向、成長促進要因、課題、約25のベンダーを網羅したベンダー分析などを掲載しています。
現在の市場シナリオ、最新動向と促進要因、市場環境全体に関する最新分析を提供しています。肥料需要の拡大、食品加工用途におけるカリとその誘導体の使用、アジア太平洋におけるカリの高い需要などが市場を牽引しています。
| 市場範囲 | |
|---|---|
| 基準年 | 2025年 |
| 終了年 | 2029年 |
| 予測期間 | 2025~2029年 |
| 成長モメンタム | 加速 |
| 前年比[2025年] | 4.7% |
| CAGR | 4.9% |
| 増分額 | 168億1,820万米ドル |
本調査では、世界のカリ生産能力の増加が、今後数年間のカリ市場成長を促進する主要理由の1つであると特定しています。また、精密農業の採用や水耕栽培におけるカリの応用拡大が、市場の大きな需要につながります。
目次
第1章 エグゼクティブサマリー
- 市場概要
第2章 Technavio分析
- 価格・ライフサイクル・顧客購入バスケット・採用率・購入基準の分析
- インプットの重要性と差別化の要因
- 混乱の要因
- 促進要因と課題の影響
第3章 市場情勢
- 市場エコシステム
- 市場の特徴
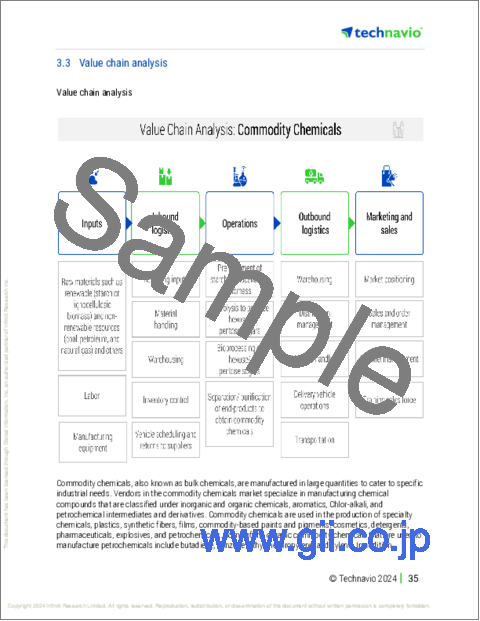
- バリューチェーン分析
第4章 市場規模
- 市場の定義
- 市場セグメント分析
- 市場規模 2024年
- 市場の展望 2024~2029年
第5章 市場規模実績
- カリの世界市場 2019~2023年
- エンドユーザー別セグメント分析 2019~2023年
- 製品別セグメント分析 2019~2023年
- 地域別セグメント分析 2019~2023年
- 国別セグメント分析 2019~2023年
第6章 定性分析
- AIの影響-カリの世界市場
第7章 ファイブフォース分析
- ファイブフォースの要約
- 買い手の交渉力
- 供給企業の交渉力
- 新規参入業者の脅威
- 代替品の脅威
- 競争の脅威
- 市況
第8章 市場セグメンテーション:エンドユーザー別
- 市場セグメント
- 比較:エンドユーザー別
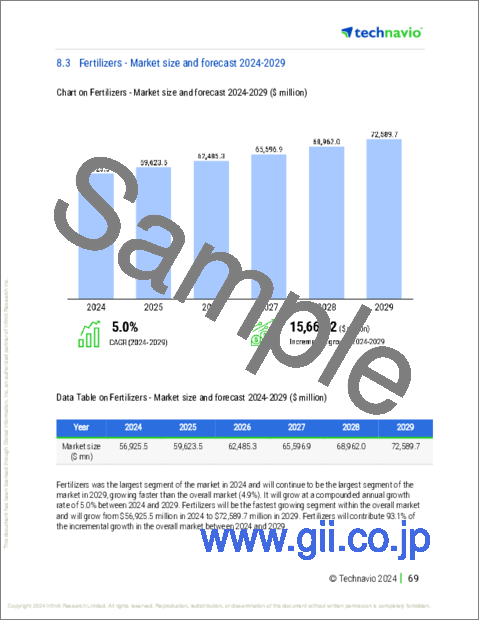
- 肥料:市場規模と予測 2024~2029年
- 一般産業:市場規模と予測 2024~2029年
- その他:市場規模と予測 2024~2029年
- 市場機会:エンドユーザー別
第9章 市場セグメンテーション:製品別
- 市場セグメント
- 比較:製品別
- 塩化カリウム:市場規模と予測 2024~2029年
- 硫酸カリウム:市場規模と予測 2024~2029年
- 硝酸カリウム:市場規模と予測 2024~2029年
- その他:市場規模と予測 2024~2029年
- 市場機会:製品別
第10章 顧客情勢
- 顧客情勢概要
第11章 地域別情勢
- 地域別セグメンテーション
- 比較:地域別
- アジア太平洋:市場規模と予測 2024~2029年
- 北米:市場規模と予測 2024~2029年
- 欧州:市場規模と予測 2024~2029年
- 南米:市場規模と予測 2024~2029年
- 中東・アフリカ:市場規模と予測 2024~2029年
- 米国:市場規模と予測 2024~2029年
- 中国:市場規模と予測 2024~2029年
- インド:市場規模と予測 2024~2029年
- ラオス人民民主共和国:市場規模と予測 2024~2029年
- 日本:市場規模と予測 2024~2029年
- カナダ:市場規模と予測 2024~2029年
- ロシア:市場規模と予測 2024~2029年
- 韓国:市場規模と予測 2024~2029年
- ブラジル:市場規模と予測 2024~2029年
- ドイツ:市場規模と予測 2024~2029年
- 地域情勢による市場機会
第12章 促進要因・課題・機会・抑制要因
- 市場促進要因
- 市場課題
- 促進要因と課題の影響
- 市場機会・抑制要因
第13章 競合情勢
- 概要
- 競合情勢
- 混乱の状況
- 産業のリスク
第14章 競合分析
- 企業プロファイル
- 企業ランキング指数
- 企業の市場ポジショニング
- Agrimin Ltd.
- Arab Potash Co. Plc
- EuroChem Group AG
- Evergrow
- Haifa Negev technologies Ltd.
- HELM AG
- Indian Potash Ltd.
- Intrepid Potash Inc.
- Israel Chemicals Ltd.
- JSC Belarusian Potash Co.
- Kalium Lakes Ltd.
- KS Aktiengesellschaft
- Nutrien Ltd.
- PJSC Uralkali
- The Mosaic Co.
第15章 付録
Exhibits:
- Exhibits1: Executive Summary - Chart on Market Overview
- Exhibits2: Executive Summary - Data Table on Market Overview
- Exhibits3: Executive Summary - Chart on Global Market Characteristics
- Exhibits4: Executive Summary - Chart on Market By Geographical Landscape
- Exhibits5: Executive Summary - Chart on Market Segmentation by End-user
- Exhibits6: Executive Summary - Chart on Market Segmentation by Product
- Exhibits7: Executive Summary - Chart on Incremental Growth
- Exhibits8: Executive Summary - Data Table on Incremental Growth
- Exhibits9: Executive Summary - Chart on Company Market Positioning
- Exhibits10: Analysis of price sensitivity, lifecycle, customer purchase basket, adoption rates, and purchase criteria
- Exhibits11: Overview on criticality of inputs and factors of differentiation
- Exhibits12: Overview on factors of disruption
- Exhibits13: Impact of drivers and challenges in 2024 and 2029
- Exhibits14: Parent Market
- Exhibits15: Data Table on - Parent Market
- Exhibits16: Market characteristics analysis
- Exhibits17: Value chain analysis
- Exhibits18: Offerings of companies included in the market definition
- Exhibits19: Market segments
- Exhibits20: Chart on Global - Market size and forecast 2024-2029 ($ million)
- Exhibits21: Data Table on Global - Market size and forecast 2024-2029 ($ million)
- Exhibits22: Chart on Global Market: Year-over-year growth 2024-2029 (%)
- Exhibits23: Data Table on Global Market: Year-over-year growth 2024-2029 (%)
- Exhibits24: Historic Market Size - Data Table on Global Potash Market 2019 - 2023 ($ million)
- Exhibits25: Historic Market Size - End-user Segment 2019 - 2023 ($ million)
- Exhibits26: Historic Market Size - Product Segment 2019 - 2023 ($ million)
- Exhibits27: Historic Market Size - Geography Segment 2019 - 2023 ($ million)
- Exhibits28: Historic Market Size - Country Segment 2019 - 2023 ($ million)
- Exhibits29: Five forces analysis - Comparison between 2024 and 2029
- Exhibits30: Bargaining power of buyers - Impact of key factors 2024 and 2029
- Exhibits31: Bargaining power of suppliers - Impact of key factors in 2024 and 2029
- Exhibits32: Threat of new entrants - Impact of key factors in 2024 and 2029
- Exhibits33: Threat of substitutes - Impact of key factors in 2024 and 2029
- Exhibits34: Threat of rivalry - Impact of key factors in 2024 and 2029
- Exhibits35: Chart on Market condition - Five forces 2024 and 2029
- Exhibits36: Chart on End-user - Market share 2024-2029 (%)
- Exhibits37: Data Table on End-user - Market share 2024-2029 (%)
- Exhibits38: Chart on Comparison by End-user
- Exhibits39: Data Table on Comparison by End-user
- Exhibits40: Chart on Fertilizers - Market size and forecast 2024-2029 ($ million)
- Exhibits41: Data Table on Fertilizers - Market size and forecast 2024-2029 ($ million)
- Exhibits42: Chart on Fertilizers - Year-over-year growth 2024-2029 (%)
- Exhibits43: Data Table on Fertilizers - Year-over-year growth 2024-2029 (%)
- Exhibits44: Chart on General industrial - Market size and forecast 2024-2029 ($ million)
- Exhibits45: Data Table on General industrial - Market size and forecast 2024-2029 ($ million)
- Exhibits46: Chart on General industrial - Year-over-year growth 2024-2029 (%)
- Exhibits47: Data Table on General industrial - Year-over-year growth 2024-2029 (%)
- Exhibits48: Chart on Others - Market size and forecast 2024-2029 ($ million)
- Exhibits49: Data Table on Others - Market size and forecast 2024-2029 ($ million)
- Exhibits50: Chart on Others - Year-over-year growth 2024-2029 (%)
- Exhibits51: Data Table on Others - Year-over-year growth 2024-2029 (%)
- Exhibits52: Market opportunity by End-user ($ million)
- Exhibits53: Data Table on Market opportunity by End-user ($ million)
- Exhibits54: Chart on Product - Market share 2024-2029 (%)
- Exhibits55: Data Table on Product - Market share 2024-2029 (%)
- Exhibits56: Chart on Comparison by Product
- Exhibits57: Data Table on Comparison by Product
- Exhibits58: Chart on Muriate of potash - Market size and forecast 2024-2029 ($ million)
- Exhibits59: Data Table on Muriate of potash - Market size and forecast 2024-2029 ($ million)
- Exhibits60: Chart on Muriate of potash - Year-over-year growth 2024-2029 (%)
- Exhibits61: Data Table on Muriate of potash - Year-over-year growth 2024-2029 (%)
- Exhibits62: Chart on Sulfate of potash - Market size and forecast 2024-2029 ($ million)
- Exhibits63: Data Table on Sulfate of potash - Market size and forecast 2024-2029 ($ million)
- Exhibits64: Chart on Sulfate of potash - Year-over-year growth 2024-2029 (%)
- Exhibits65: Data Table on Sulfate of potash - Year-over-year growth 2024-2029 (%)
- Exhibits66: Chart on Potassium nitrate - Market size and forecast 2024-2029 ($ million)
- Exhibits67: Data Table on Potassium nitrate - Market size and forecast 2024-2029 ($ million)
- Exhibits68: Chart on Potassium nitrate - Year-over-year growth 2024-2029 (%)
- Exhibits69: Data Table on Potassium nitrate - Year-over-year growth 2024-2029 (%)
- Exhibits70: Chart on Others - Market size and forecast 2024-2029 ($ million)
- Exhibits71: Data Table on Others - Market size and forecast 2024-2029 ($ million)
- Exhibits72: Chart on Others - Year-over-year growth 2024-2029 (%)
- Exhibits73: Data Table on Others - Year-over-year growth 2024-2029 (%)
- Exhibits74: Market opportunity by Product ($ million)
- Exhibits75: Data Table on Market opportunity by Product ($ million)
- Exhibits76: Analysis of price sensitivity, lifecycle, customer purchase basket, adoption rates, and purchase criteria
- Exhibits77: Chart on Market share By Geographical Landscape 2024-2029 (%)
- Exhibits78: Data Table on Market share By Geographical Landscape 2024-2029 (%)
- Exhibits79: Chart on Geographic comparison
- Exhibits80: Data Table on Geographic comparison
- Exhibits81: Chart on APAC - Market size and forecast 2024-2029 ($ million)
- Exhibits82: Data Table on APAC - Market size and forecast 2024-2029 ($ million)
- Exhibits83: Chart on APAC - Year-over-year growth 2024-2029 (%)
- Exhibits84: Data Table on APAC - Year-over-year growth 2024-2029 (%)
- Exhibits85: Chart on North America - Market size and forecast 2024-2029 ($ million)
- Exhibits86: Data Table on North America - Market size and forecast 2024-2029 ($ million)
- Exhibits87: Chart on North America - Year-over-year growth 2024-2029 (%)
- Exhibits88: Data Table on North America - Year-over-year growth 2024-2029 (%)
- Exhibits89: Chart on Europe - Market size and forecast 2024-2029 ($ million)
- Exhibits90: Data Table on Europe - Market size and forecast 2024-2029 ($ million)
- Exhibits91: Chart on Europe - Year-over-year growth 2024-2029 (%)
- Exhibits92: Data Table on Europe - Year-over-year growth 2024-2029 (%)
- Exhibits93: Chart on South America - Market size and forecast 2024-2029 ($ million)
- Exhibits94: Data Table on South America - Market size and forecast 2024-2029 ($ million)
- Exhibits95: Chart on South America - Year-over-year growth 2024-2029 (%)
- Exhibits96: Data Table on South America - Year-over-year growth 2024-2029 (%)
- Exhibits97: Chart on Middle East and Africa - Market size and forecast 2024-2029 ($ million)
- Exhibits98: Data Table on Middle East and Africa - Market size and forecast 2024-2029 ($ million)
- Exhibits99: Chart on Middle East and Africa - Year-over-year growth 2024-2029 (%)
- Exhibits100: Data Table on Middle East and Africa - Year-over-year growth 2024-2029 (%)
- Exhibits101: Chart on US - Market size and forecast 2024-2029 ($ million)
- Exhibits102: Data Table on US - Market size and forecast 2024-2029 ($ million)
- Exhibits103: Chart on US - Year-over-year growth 2024-2029 (%)
- Exhibits104: Data Table on US - Year-over-year growth 2024-2029 (%)
- Exhibits105: Chart on China - Market size and forecast 2024-2029 ($ million)
- Exhibits106: Data Table on China - Market size and forecast 2024-2029 ($ million)
- Exhibits107: Chart on China - Year-over-year growth 2024-2029 (%)
- Exhibits108: Data Table on China - Year-over-year growth 2024-2029 (%)
- Exhibits109: Chart on India - Market size and forecast 2024-2029 ($ million)
- Exhibits110: Data Table on India - Market size and forecast 2024-2029 ($ million)
- Exhibits111: Chart on India - Year-over-year growth 2024-2029 (%)
- Exhibits112: Data Table on India - Year-over-year growth 2024-2029 (%)
- Exhibits113: Chart on Lao Peoples Democratic Republic - Market size and forecast 2024-2029 ($ million)
- Exhibits114: Data Table on Lao Peoples Democratic Republic - Market size and forecast 2024-2029 ($ million)
- Exhibits115: Chart on Lao Peoples Democratic Republic - Year-over-year growth 2024-2029 (%)
- Exhibits116: Data Table on Lao Peoples Democratic Republic - Year-over-year growth 2024-2029 (%)
- Exhibits117: Chart on Japan - Market size and forecast 2024-2029 ($ million)
- Exhibits118: Data Table on Japan - Market size and forecast 2024-2029 ($ million)
- Exhibits119: Chart on Japan - Year-over-year growth 2024-2029 (%)
- Exhibits120: Data Table on Japan - Year-over-year growth 2024-2029 (%)
- Exhibits121: Chart on Canada - Market size and forecast 2024-2029 ($ million)
- Exhibits122: Data Table on Canada - Market size and forecast 2024-2029 ($ million)
- Exhibits123: Chart on Canada - Year-over-year growth 2024-2029 (%)
- Exhibits124: Data Table on Canada - Year-over-year growth 2024-2029 (%)
- Exhibits125: Chart on Russia - Market size and forecast 2024-2029 ($ million)
- Exhibits126: Data Table on Russia - Market size and forecast 2024-2029 ($ million)
- Exhibits127: Chart on Russia - Year-over-year growth 2024-2029 (%)
- Exhibits128: Data Table on Russia - Year-over-year growth 2024-2029 (%)
- Exhibits129: Chart on South Korea - Market size and forecast 2024-2029 ($ million)
- Exhibits130: Data Table on South Korea - Market size and forecast 2024-2029 ($ million)
- Exhibits131: Chart on South Korea - Year-over-year growth 2024-2029 (%)
- Exhibits132: Data Table on South Korea - Year-over-year growth 2024-2029 (%)
- Exhibits133: Chart on Brazil - Market size and forecast 2024-2029 ($ million)
- Exhibits134: Data Table on Brazil - Market size and forecast 2024-2029 ($ million)
- Exhibits135: Chart on Brazil - Year-over-year growth 2024-2029 (%)
- Exhibits136: Data Table on Brazil - Year-over-year growth 2024-2029 (%)
- Exhibits137: Chart on Germany - Market size and forecast 2024-2029 ($ million)
- Exhibits138: Data Table on Germany - Market size and forecast 2024-2029 ($ million)
- Exhibits139: Chart on Germany - Year-over-year growth 2024-2029 (%)
- Exhibits140: Data Table on Germany - Year-over-year growth 2024-2029 (%)
- Exhibits141: Market opportunity By Geographical Landscape ($ million)
- Exhibits142: Data Tables on Market opportunity By Geographical Landscape ($ million)
- Exhibits143: Impact of drivers and challenges in 2024 and 2029
- Exhibits144: Overview on criticality of inputs and factors of differentiation
- Exhibits145: Overview on factors of disruption
- Exhibits146: Impact of key risks on business
- Exhibits147: Companies covered
- Exhibits148: Company ranking index
- Exhibits149: Matrix on companies position and classification
- Exhibits150: Agrimin Ltd. - Overview
- Exhibits151: Agrimin Ltd. - Product / Service
- Exhibits152: Agrimin Ltd. - Key offerings
- Exhibits153: SWOT
- Exhibits154: Arab Potash Co. Plc - Overview
- Exhibits155: Arab Potash Co. Plc - Product / Service
- Exhibits156: Arab Potash Co. Plc - Key offerings
- Exhibits157: SWOT
- Exhibits158: EuroChem Group AG - Overview
- Exhibits159: EuroChem Group AG - Product / Service
- Exhibits160: EuroChem Group AG - Key offerings
- Exhibits161: SWOT
- Exhibits162: Evergrow - Overview
- Exhibits163: Evergrow - Product / Service
- Exhibits164: Evergrow - Key offerings
- Exhibits165: SWOT
- Exhibits166: Haifa Negev technologies Ltd. - Overview
- Exhibits167: Haifa Negev technologies Ltd. - Product / Service
- Exhibits168: Haifa Negev technologies Ltd. - Key offerings
- Exhibits169: SWOT
- Exhibits170: HELM AG - Overview
- Exhibits171: HELM AG - Product / Service
- Exhibits172: HELM AG - Key news
- Exhibits173: HELM AG - Key offerings
- Exhibits174: SWOT
- Exhibits175: Indian Potash Ltd. - Overview
- Exhibits176: Indian Potash Ltd. - Product / Service
- Exhibits177: Indian Potash Ltd. - Key offerings
- Exhibits178: SWOT
- Exhibits179: Intrepid Potash Inc. - Overview
- Exhibits180: Intrepid Potash Inc. - Product / Service
- Exhibits181: Intrepid Potash Inc. - Key offerings
- Exhibits182: SWOT
- Exhibits183: Israel Chemicals Ltd. - Overview
- Exhibits184: Israel Chemicals Ltd. - Business segments
- Exhibits185: Israel Chemicals Ltd. - Key offerings
- Exhibits186: Israel Chemicals Ltd. - Segment focus
- Exhibits187: SWOT
- Exhibits188: JSC Belarusian Potash Co. - Overview
- Exhibits189: JSC Belarusian Potash Co. - Product / Service
- Exhibits190: JSC Belarusian Potash Co. - Key offerings
- Exhibits191: SWOT
- Exhibits192: Kalium Lakes Ltd. - Overview
- Exhibits193: Kalium Lakes Ltd. - Product / Service
- Exhibits194: Kalium Lakes Ltd. - Key offerings
- Exhibits195: SWOT
- Exhibits196: KS Aktiengesellschaft - Overview
- Exhibits197: KS Aktiengesellschaft - Product / Service
- Exhibits198: KS Aktiengesellschaft - Key offerings
- Exhibits199: SWOT
- Exhibits200: Nutrien Ltd. - Overview
- Exhibits201: Nutrien Ltd. - Business segments
- Exhibits202: Nutrien Ltd. - Key offerings
- Exhibits203: Nutrien Ltd. - Segment focus
- Exhibits204: SWOT
- Exhibits205: PJSC Uralkali - Overview
- Exhibits206: PJSC Uralkali - Product / Service
- Exhibits207: PJSC Uralkali - Key offerings
- Exhibits208: SWOT
- Exhibits209: The Mosaic Co. - Overview
- Exhibits210: The Mosaic Co. - Business segments
- Exhibits211: The Mosaic Co. - Key offerings
- Exhibits212: The Mosaic Co. - Segment focus
- Exhibits213: SWOT
- Exhibits214: Inclusions checklist
- Exhibits215: Exclusions checklist
- Exhibits216: Currency conversion rates for US$
- Exhibits217: Research methodology
- Exhibits218: Information sources
- Exhibits219: Data validation
- Exhibits220: Validation techniques employed for market sizing
- Exhibits221: Data synthesis
- Exhibits222: 360 degree market analysis
- Exhibits223: List of abbreviations
The potash market is forecasted to grow by USD 16818.2 mn during 2024-2029, accelerating at a CAGR of 4.9% during the forecast period. The report on the potash market provides a holistic analysis, market size and forecast, trends, growth drivers, and challenges, as well as vendor analysis covering around 25 vendors.
The report offers an up-to-date analysis regarding the current market scenario, the latest trends and drivers, and the overall market environment. The market is driven by growing demand for fertilizers, use of potash and its derivatives in food processing applications, and high demand for potash in apac.
| Market Scope | |
|---|---|
| Base Year | 2025 |
| End Year | 2029 |
| Series Year | 2025-2029 |
| Growth Momentum | Accelerate |
| YOY 2025 | 4.7% |
| CAGR | 4.9% |
| Incremental Value | $16818.2 mn |
Technavio's potash market is segmented as below:
By End-user
- Fertilizers
- General industrial
- Others
By Product
- Muriate of potash
- Sulfate of potash
- Potassium nitrate
- Others
By Geographical Landscape
- APAC
- North America
- Europe
- South America
- Middle East and Africa
This study identifies the increasing global potash production capacity as one of the prime reasons driving the potash market growth during the next few years. Also, adoption of precision farming and increasing application of potash in hydroponics will lead to sizable demand in the market.
The report on the potash market covers the following areas:
- Potash Market sizing
- Potash Market forecast
- Potash Market industry analysis
The robust vendor analysis is designed to help clients improve their market position, and in line with this, this report provides a detailed analysis of several leading potash market vendors that include Agrimin Ltd., Arab Potash Co. Plc, Compass Minerals International Inc., EuroChem Group AG, Evergrow, GUJARAT AKSHA FERTILIZER CO., Haifa Negev technologies Ltd., HELM AG, Indian Potash Ltd., Intrepid Potash Inc., Israel Chemicals Ltd., JSC Belarusian Potash Co., Kalium Lakes Ltd., Kiran Chemicals, KS Aktiengesellschaft, Nutrien Ltd., PJSC Uralkali, Tessenderlo Group NV, The Mosaic Co., and Yara International ASA. Also, the potash market analysis report includes information on upcoming trends and challenges that will influence market growth. This is to help companies strategize and leverage all forthcoming growth opportunities.
The study was conducted using an objective combination of primary and secondary information including inputs from key participants in the industry. The report contains a comprehensive market and vendor landscape in addition to an analysis of the key vendors.
The publisher presents a detailed picture of the market by the way of study, synthesis, and summation of data from multiple sources by an analysis of key parameters such as profit, pricing, competition, and promotions. It presents various market facets by identifying the key industry influencers. The data presented is comprehensive, reliable, and a result of extensive primary and secondary research. The market research reports provide a complete competitive landscape and an in-depth vendor selection methodology and analysis using qualitative and quantitative research to forecast accurate market growth.
Table of Contents
1 Executive Summary
- 1.1 Market overview
- Executive Summary - Chart on Market Overview
- Executive Summary - Data Table on Market Overview
- Executive Summary - Chart on Global Market Characteristics
- Executive Summary - Chart on Market By Geographical Landscape
- Executive Summary - Chart on Market Segmentation by End-user
- Executive Summary - Chart on Market Segmentation by Product
- Executive Summary - Chart on Incremental Growth
- Executive Summary - Data Table on Incremental Growth
- Executive Summary - Chart on Company Market Positioning
2 Technavio Analysis
- 2.1 Analysis of price sensitivity, lifecycle, customer purchase basket, adoption rates, and purchase criteria
- Analysis of price sensitivity, lifecycle, customer purchase basket, adoption rates, and purchase criteria
- 2.2 Criticality of inputs and Factors of differentiation
- Overview on criticality of inputs and factors of differentiation
- 2.3 Factors of disruption
- Overview on factors of disruption
- 2.4 Impact of drivers and challenges
- Impact of drivers and challenges in 2024 and 2029
3 Market Landscape
- 3.1 Market ecosystem
- Parent Market
- Data Table on - Parent Market
- 3.2 Market characteristics
- Market characteristics analysis
- 3.3 Value chain analysis
- Value chain analysis
4 Market Sizing
- 4.1 Market definition
- Offerings of companies included in the market definition
- 4.2 Market segment analysis
- Market segments
- 4.3 Market size 2024
- 4.4 Market outlook: Forecast for 2024-2029
- Chart on Global - Market size and forecast 2024-2029 ($ million)
- Data Table on Global - Market size and forecast 2024-2029 ($ million)
- Chart on Global Market: Year-over-year growth 2024-2029 (%)
- Data Table on Global Market: Year-over-year growth 2024-2029 (%)
5 Historic Market Size
- 5.1 Global Potash Market 2019 - 2023
- Historic Market Size - Data Table on Global Potash Market 2019 - 2023 ($ million)
- 5.2 End-user segment analysis 2019 - 2023
- Historic Market Size - End-user Segment 2019 - 2023 ($ million)
- 5.3 Product segment analysis 2019 - 2023
- Historic Market Size - Product Segment 2019 - 2023 ($ million)
- 5.4 Geography segment analysis 2019 - 2023
- Historic Market Size - Geography Segment 2019 - 2023 ($ million)
- 5.5 Country segment analysis 2019 - 2023
- Historic Market Size - Country Segment 2019 - 2023 ($ million)
6 Qualitative Analysis
- 6.1 Impact of AI on Global Potash Market
7 Five Forces Analysis
- 7.1 Five forces summary
- Five forces analysis - Comparison between 2024 and 2029
- 7.2 Bargaining power of buyers
- Bargaining power of buyers - Impact of key factors 2024 and 2029
- 7.3 Bargaining power of suppliers
- Bargaining power of suppliers - Impact of key factors in 2024 and 2029
- 7.4 Threat of new entrants
- Threat of new entrants - Impact of key factors in 2024 and 2029
- 7.5 Threat of substitutes
- Threat of substitutes - Impact of key factors in 2024 and 2029
- 7.6 Threat of rivalry
- Threat of rivalry - Impact of key factors in 2024 and 2029
- 7.7 Market condition
- Chart on Market condition - Five forces 2024 and 2029
8 Market Segmentation by End-user
- 8.1 Market segments
- Chart on End-user - Market share 2024-2029 (%)
- Data Table on End-user - Market share 2024-2029 (%)
- 8.2 Comparison by End-user
- Chart on Comparison by End-user
- Data Table on Comparison by End-user
- 8.3 Fertilizers - Market size and forecast 2024-2029
- Chart on Fertilizers - Market size and forecast 2024-2029 ($ million)
- Data Table on Fertilizers - Market size and forecast 2024-2029 ($ million)
- Chart on Fertilizers - Year-over-year growth 2024-2029 (%)
- Data Table on Fertilizers - Year-over-year growth 2024-2029 (%)
- 8.4 General industrial - Market size and forecast 2024-2029
- Chart on General industrial - Market size and forecast 2024-2029 ($ million)
- Data Table on General industrial - Market size and forecast 2024-2029 ($ million)
- Chart on General industrial - Year-over-year growth 2024-2029 (%)
- Data Table on General industrial - Year-over-year growth 2024-2029 (%)
- 8.5 Others - Market size and forecast 2024-2029
- Chart on Others - Market size and forecast 2024-2029 ($ million)
- Data Table on Others - Market size and forecast 2024-2029 ($ million)
- Chart on Others - Year-over-year growth 2024-2029 (%)
- Data Table on Others - Year-over-year growth 2024-2029 (%)
- 8.6 Market opportunity by End-user
- Market opportunity by End-user ($ million)
- Data Table on Market opportunity by End-user ($ million)
9 Market Segmentation by Product
- 9.1 Market segments
- Chart on Product - Market share 2024-2029 (%)
- Data Table on Product - Market share 2024-2029 (%)
- 9.2 Comparison by Product
- Chart on Comparison by Product
- Data Table on Comparison by Product
- 9.3 Muriate of potash - Market size and forecast 2024-2029
- Chart on Muriate of potash - Market size and forecast 2024-2029 ($ million)
- Data Table on Muriate of potash - Market size and forecast 2024-2029 ($ million)
- Chart on Muriate of potash - Year-over-year growth 2024-2029 (%)
- Data Table on Muriate of potash - Year-over-year growth 2024-2029 (%)
- 9.4 Sulfate of potash - Market size and forecast 2024-2029
- Chart on Sulfate of potash - Market size and forecast 2024-2029 ($ million)
- Data Table on Sulfate of potash - Market size and forecast 2024-2029 ($ million)
- Chart on Sulfate of potash - Year-over-year growth 2024-2029 (%)
- Data Table on Sulfate of potash - Year-over-year growth 2024-2029 (%)
- 9.5 Potassium nitrate - Market size and forecast 2024-2029
- Chart on Potassium nitrate - Market size and forecast 2024-2029 ($ million)
- Data Table on Potassium nitrate - Market size and forecast 2024-2029 ($ million)
- Chart on Potassium nitrate - Year-over-year growth 2024-2029 (%)
- Data Table on Potassium nitrate - Year-over-year growth 2024-2029 (%)
- 9.6 Others - Market size and forecast 2024-2029
- Chart on Others - Market size and forecast 2024-2029 ($ million)
- Data Table on Others - Market size and forecast 2024-2029 ($ million)
- Chart on Others - Year-over-year growth 2024-2029 (%)
- Data Table on Others - Year-over-year growth 2024-2029 (%)
- 9.7 Market opportunity by Product
- Market opportunity by Product ($ million)
- Data Table on Market opportunity by Product ($ million)
10 Customer Landscape
- 10.1 Customer landscape overview
- Analysis of price sensitivity, lifecycle, customer purchase basket, adoption rates, and purchase criteria
11 Geographic Landscape
- 11.1 Geographic segmentation
- Chart on Market share By Geographical Landscape 2024-2029 (%)
- Data Table on Market share By Geographical Landscape 2024-2029 (%)
- 11.2 Geographic comparison
- Chart on Geographic comparison
- Data Table on Geographic comparison
- 11.3 APAC - Market size and forecast 2024-2029
- Chart on APAC - Market size and forecast 2024-2029 ($ million)
- Data Table on APAC - Market size and forecast 2024-2029 ($ million)
- Chart on APAC - Year-over-year growth 2024-2029 (%)
- Data Table on APAC - Year-over-year growth 2024-2029 (%)
- 11.4 North America - Market size and forecast 2024-2029
- Chart on North America - Market size and forecast 2024-2029 ($ million)
- Data Table on North America - Market size and forecast 2024-2029 ($ million)
- Chart on North America - Year-over-year growth 2024-2029 (%)
- Data Table on North America - Year-over-year growth 2024-2029 (%)
- 11.5 Europe - Market size and forecast 2024-2029
- Chart on Europe - Market size and forecast 2024-2029 ($ million)
- Data Table on Europe - Market size and forecast 2024-2029 ($ million)
- Chart on Europe - Year-over-year growth 2024-2029 (%)
- Data Table on Europe - Year-over-year growth 2024-2029 (%)
- 11.6 South America - Market size and forecast 2024-2029
- Chart on South America - Market size and forecast 2024-2029 ($ million)
- Data Table on South America - Market size and forecast 2024-2029 ($ million)
- Chart on South America - Year-over-year growth 2024-2029 (%)
- Data Table on South America - Year-over-year growth 2024-2029 (%)
- 11.7 Middle East and Africa - Market size and forecast 2024-2029
- Chart on Middle East and Africa - Market size and forecast 2024-2029 ($ million)
- Data Table on Middle East and Africa - Market size and forecast 2024-2029 ($ million)
- Chart on Middle East and Africa - Year-over-year growth 2024-2029 (%)
- Data Table on Middle East and Africa - Year-over-year growth 2024-2029 (%)
- 11.8 US - Market size and forecast 2024-2029
- Chart on US - Market size and forecast 2024-2029 ($ million)
- Data Table on US - Market size and forecast 2024-2029 ($ million)
- Chart on US - Year-over-year growth 2024-2029 (%)
- Data Table on US - Year-over-year growth 2024-2029 (%)
- 11.9 China - Market size and forecast 2024-2029
- Chart on China - Market size and forecast 2024-2029 ($ million)
- Data Table on China - Market size and forecast 2024-2029 ($ million)
- Chart on China - Year-over-year growth 2024-2029 (%)
- Data Table on China - Year-over-year growth 2024-2029 (%)
- 11.10 India - Market size and forecast 2024-2029
- Chart on India - Market size and forecast 2024-2029 ($ million)
- Data Table on India - Market size and forecast 2024-2029 ($ million)
- Chart on India - Year-over-year growth 2024-2029 (%)
- Data Table on India - Year-over-year growth 2024-2029 (%)
- 11.11 Lao Peoples Democratic Republic - Market size and forecast 2024-2029
- Chart on Lao Peoples Democratic Republic - Market size and forecast 2024-2029 ($ million)
- Data Table on Lao Peoples Democratic Republic - Market size and forecast 2024-2029 ($ million)
- Chart on Lao Peoples Democratic Republic - Year-over-year growth 2024-2029 (%)
- Data Table on Lao Peoples Democratic Republic - Year-over-year growth 2024-2029 (%)
- 11.12 Japan - Market size and forecast 2024-2029
- Chart on Japan - Market size and forecast 2024-2029 ($ million)
- Data Table on Japan - Market size and forecast 2024-2029 ($ million)
- Chart on Japan - Year-over-year growth 2024-2029 (%)
- Data Table on Japan - Year-over-year growth 2024-2029 (%)
- 11.13 Canada - Market size and forecast 2024-2029
- Chart on Canada - Market size and forecast 2024-2029 ($ million)
- Data Table on Canada - Market size and forecast 2024-2029 ($ million)
- Chart on Canada - Year-over-year growth 2024-2029 (%)
- Data Table on Canada - Year-over-year growth 2024-2029 (%)
- 11.14 Russia - Market size and forecast 2024-2029
- Chart on Russia - Market size and forecast 2024-2029 ($ million)
- Data Table on Russia - Market size and forecast 2024-2029 ($ million)
- Chart on Russia - Year-over-year growth 2024-2029 (%)
- Data Table on Russia - Year-over-year growth 2024-2029 (%)
- 11.15 South Korea - Market size and forecast 2024-2029
- Chart on South Korea - Market size and forecast 2024-2029 ($ million)
- Data Table on South Korea - Market size and forecast 2024-2029 ($ million)
- Chart on South Korea - Year-over-year growth 2024-2029 (%)
- Data Table on South Korea - Year-over-year growth 2024-2029 (%)
- 11.16 Brazil - Market size and forecast 2024-2029
- Chart on Brazil - Market size and forecast 2024-2029 ($ million)
- Data Table on Brazil - Market size and forecast 2024-2029 ($ million)
- Chart on Brazil - Year-over-year growth 2024-2029 (%)
- Data Table on Brazil - Year-over-year growth 2024-2029 (%)
- 11.17 Germany - Market size and forecast 2024-2029
- Chart on Germany - Market size and forecast 2024-2029 ($ million)
- Data Table on Germany - Market size and forecast 2024-2029 ($ million)
- Chart on Germany - Year-over-year growth 2024-2029 (%)
- Data Table on Germany - Year-over-year growth 2024-2029 (%)
- 11.18 Market opportunity By Geographical Landscape
- Market opportunity By Geographical Landscape ($ million)
- Data Tables on Market opportunity By Geographical Landscape ($ million)
12 Drivers, Challenges, and Opportunity/Restraints
- 12.1 Market drivers
- 12.2 Market challenges
- 12.3 Impact of drivers and challenges
- Impact of drivers and challenges in 2024 and 2029
- 12.4 Market opportunities/restraints
13 Competitive Landscape
- 13.1 Overview
- 13.2 Competitive Landscape
- Overview on criticality of inputs and factors of differentiation
- 13.3 Landscape disruption
- Overview on factors of disruption
- 13.4 Industry risks
- Impact of key risks on business
14 Competitive Analysis
- 14.1 Companies profiled
- Companies covered
- 14.2 Company ranking index
- Company ranking index
- 14.3 Market positioning of companies
- Matrix on companies position and classification
- 14.4 Agrimin Ltd.
- Agrimin Ltd. - Overview
- Agrimin Ltd. - Product / Service
- Agrimin Ltd. - Key offerings
- SWOT
- 14.5 Arab Potash Co. Plc
- Arab Potash Co. Plc - Overview
- Arab Potash Co. Plc - Product / Service
- Arab Potash Co. Plc - Key offerings
- SWOT
- 14.6 EuroChem Group AG
- EuroChem Group AG - Overview
- EuroChem Group AG - Product / Service
- EuroChem Group AG - Key offerings
- SWOT
- 14.7 Evergrow
- Evergrow - Overview
- Evergrow - Product / Service
- Evergrow - Key offerings
- SWOT
- 14.8 Haifa Negev technologies Ltd.
- Haifa Negev technologies Ltd. - Overview
- Haifa Negev technologies Ltd. - Product / Service
- Haifa Negev technologies Ltd. - Key offerings
- SWOT
- 14.9 HELM AG
- HELM AG - Overview
- HELM AG - Product / Service
- HELM AG - Key news
- HELM AG - Key offerings
- SWOT
- 14.10 Indian Potash Ltd.
- Indian Potash Ltd. - Overview
- Indian Potash Ltd. - Product / Service
- Indian Potash Ltd. - Key offerings
- SWOT
- 14.11 Intrepid Potash Inc.
- Intrepid Potash Inc. - Overview
- Intrepid Potash Inc. - Product / Service
- Intrepid Potash Inc. - Key offerings
- SWOT
- 14.12 Israel Chemicals Ltd.
- Israel Chemicals Ltd. - Overview
- Israel Chemicals Ltd. - Business segments
- Israel Chemicals Ltd. - Key offerings
- Israel Chemicals Ltd. - Segment focus
- SWOT
- 14.13 JSC Belarusian Potash Co.
- JSC Belarusian Potash Co. - Overview
- JSC Belarusian Potash Co. - Product / Service
- JSC Belarusian Potash Co. - Key offerings
- SWOT
- 14.14 Kalium Lakes Ltd.
- Kalium Lakes Ltd. - Overview
- Kalium Lakes Ltd. - Product / Service
- Kalium Lakes Ltd. - Key offerings
- SWOT
- 14.15 KS Aktiengesellschaft
- KS Aktiengesellschaft - Overview
- KS Aktiengesellschaft - Product / Service
- KS Aktiengesellschaft - Key offerings
- SWOT
- 14.16 Nutrien Ltd.
- Nutrien Ltd. - Overview
- Nutrien Ltd. - Business segments
- Nutrien Ltd. - Key offerings
- Nutrien Ltd. - Segment focus
- SWOT
- 14.17 PJSC Uralkali
- PJSC Uralkali - Overview
- PJSC Uralkali - Product / Service
- PJSC Uralkali - Key offerings
- SWOT
- 14.18 The Mosaic Co.
- The Mosaic Co. - Overview
- The Mosaic Co. - Business segments
- The Mosaic Co. - Key offerings
- The Mosaic Co. - Segment focus
- SWOT
15 Appendix
- 15.1 Scope of the report
- 15.2 Inclusions and exclusions checklist
- Inclusions checklist
- Exclusions checklist
- 15.3 Currency conversion rates for US$
- Currency conversion rates for US$
- 15.4 Research methodology
- Research methodology
- 15.5 Data procurement
- Information sources
- 15.6 Data validation
- Data validation
- 15.7 Validation techniques employed for market sizing
- Validation techniques employed for market sizing
- 15.8 Data synthesis
- Data synthesis
- 15.9 360 degree market analysis
- 360 degree market analysis
- 15.10 List of abbreviations
- List of abbreviations
