|
|
市場調査レポート
商品コード
1353034
バイオ殺虫剤の世界市場規模、シェア、産業動向分析レポート:供給源別、用途別、地域別の展望と予測、2023年~2030年Global Bioinsecticides Market Size, Share & Industry Trends Analysis Report By Source (Microbials, Plants, and Others), By Application (Cereals & Grains, Oilseed & Pulses, Fruits & Vegetables, and Others), By Regional Outlook and Forecast, 2023 - 2030 |
||||||
|
|
|||||||
|
|||||||


| バイオ殺虫剤の世界市場規模、シェア、産業動向分析レポート:供給源別、用途別、地域別の展望と予測、2023年~2030年 |
|
出版日: 2023年08月31日
発行: KBV Research
ページ情報: 英文 293 Pages
納期: 即納可能
|

- 全表示
- 概要
- 図表
- 目次
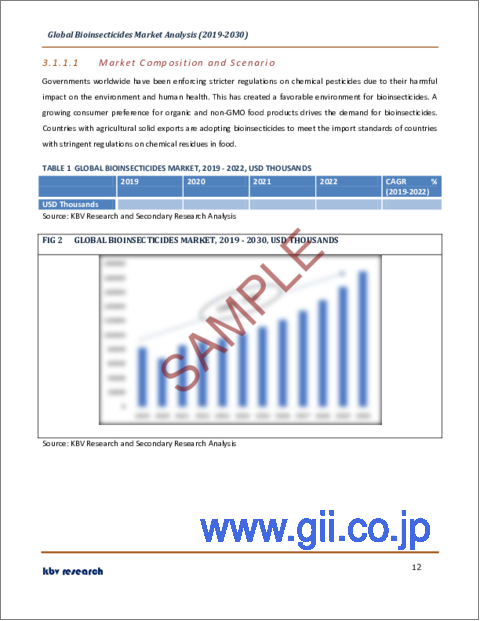
バイオ殺虫剤市場規模は、予測期間中にCAGR 10.2%の市場成長率で上昇し、2030年には1億8,990万米ドルに達すると予測されます。2022年の市場規模は1,918.3キロリットルに達し、2.2%の成長を遂げる(2019-2022年)。
KBV Cardinalのマトリックスに示された分析によると、Bayer AGとCertis USA LLC(三井物産)が市場の先行者です。2023年2月、サーティス・バイオロジカルズは、使いやすい粒状製剤からなる微生物殺菌剤、ソイルガードを発売しました。シンジェンタAGグループ、BASF SE、住友化学などの企業は、市場の主要なイノベーターです。
市場成長要因
害虫復活問題の増加
抵抗性と生態系の不均衡による害虫の復活の増加は、持続可能で効果的な害虫管理ソリューションの必要性を生み出しています。バイオ殺虫剤は、環境にやさしく標的を絞ったアプローチにより、農業における害虫の復活がもたらす課題を軽減するための貴重な手段を提供します。害虫の復活の増加は、まさにバイオ殺虫剤の成長の原動力のひとつです。化学農薬の使用による生態系の破壊など、害虫復活の根本原因に対処することで、生物殺虫剤は農業システムの長期的な持続可能性に貢献します。したがって、これらすべての要因が市場の成長を後押ししています。
有機食品の採用の増加
有機食品の採用は、健康への懸念、環境意識、消費者の嗜好の変化などさまざまな要因によって、過去数年にわたって増加傾向にあります。有機食品は、化学合成農薬、化学肥料、遺伝子組み換え作物(GMO)、その他特定の添加物や加工方法を避けた方法で生産されます。オーガニック食品は多くの場合、特定の生産基準の遵守を保証する公認団体によって認証されています。この認証により、消費者はオーガニックという主張の信憑性を確信することができます。バイオ殺虫剤は有機生産の重要な要素として台頭してきています。したがって、有機製品の需要が増加するにつれて、需要も増加すると思われます。
市場抑制要因
バイオ殺虫剤の寿命の短さ
バイオ殺虫剤の貯蔵寿命が比較的短いことは、これらの製品に関連する課題のひとつです。生物または天然化合物に由来するバイオ殺虫剤は、合成化学殺虫剤と比較して寿命が限られている場合があります。対象となる害虫が不在の場合、生物殺虫剤は目的を失い、有効寿命が短くなる可能性があります。また、バイオ殺虫剤の貯蔵寿命が比較的短いため、生産、貯蔵、流通に関連するコストが増加し、商業的な実行可能性に影響を与える可能性があります。したがって、バイオ殺虫剤の寿命の短さは、上記の要因とともに市場の成長を妨げる可能性があります。
供給源の展望
供給源に基づき、市場は微生物、植物、その他に区分されます。2022年の市場では、植物セグメントが大きな収益シェアを占めています。これらのバイオ殺虫剤は、害虫に対する植物の自然な防御メカニズムを利用します。非標的生物への害が少なく、環境への影響が少なく、有機農法での使用に適している場合が多いため、合成化学農薬に代わる環境に優しい選択肢となります。例えば、リモネンは柑橘類由来の天然殺虫剤です。接触殺虫剤で、昆虫のワックス状のクチクラを破壊し、脱水症状を起こして死に至らしめる。リモネンベースの製品は、家庭用殺虫スプレーによく使われています。
用途別展望
用途別に見ると、市場は穀物・穀類、油糧種子・豆類、果物・野菜、その他に分けられます。2022年には、穀物・穀類セグメントが市場で最も高い売上シェアを記録しました。これらの農産物の消費は、米、大麦、トウモロコシ、オート麦、小麦、ソルガムなどの穀物や穀物の栄養的利点のために増加しています。中国や米国では小麦やトウモロコシの栽培が盛んであるため、アジア太平洋や北米では穀物や穀類に主に適用されています。通常、穀物や穀類には作物保護剤が推奨されます。
地域別展望
地域別に見ると、市場は北米、欧州、アジア太平洋、LAMEAで分析されます。アジア太平洋地域は2022年に市場で最大の収益シェアを獲得しました。国連食糧農業機関(FAO)と経済協力開発機構(OECD)のデータによると、アジア太平洋地域は世界最大の農産物生産地です。人口増加のため、この地域の耕地は減少しているが、一方で食糧需要は増加しています。そのため、生産者は作物の収穫量を増やすために生物殺虫剤を使用するようになっています。この地域の特徴は、安価な労働力と天然素材が豊富にあることです。
目次
第1章 市場範囲と調査手法
- 市場の定義
- 目的
- 市場範囲
- セグメンテーション
- 調査手法
第2章 市場の概要
- 主なハイライト
第3章 市場概要
- イントロダクション
- 概要
- 市場構成とシナリオ
- 概要
- 市場に影響を与える主な要因
- 市場促進要因
- 市場抑制要因
第4章 競合分析- 世界
- KBV Cardinal Matrix
- 最近の業界全体の戦略的展開
- パートナーシップ、コラボレーション、および契約
- 製品の発売と製品の拡大
- 買収と合併
- 主要成功戦略
- 主な戦略
- 主要な戦略的動き
- ポーターのファイブフォース分析
第5章 世界のバイオ殺虫剤市場:ソース別
- 世界の微生物市場:地域別
- 世界の植物市場:地域別
- 世界のその他の市場:地域別
第6章 世界のバイオ殺虫剤市場:用途別
- 世界の穀物および穀物市場:地域別
- 世界の油糧種子および豆類市場:地域別
- 世界の青果市場:地域別
- 世界のその他の市場:地域別
第7章 世界のバイオ殺虫剤市場:地域別
- 北米
- 北米の市場:国別
- 米国
- カナダ
- メキシコ
- その他北米地域
- 北米の市場:国別
- 欧州
- 欧州の市場:国別
- ロシア
- フランス
- ドイツ
- ポーランド
- 英国
- イタリア
- その他欧州地域
- 欧州の市場:国別
- アジア太平洋
- アジア太平洋の市場:国別
- 中国
- インド
- インドネシア
- オーストラリア
- 韓国
- 日本
- その他アジア太平洋地域
- アジア太平洋の市場:国別
- ラテンアメリカ・中東・アフリカ
- ラテンアメリカ・中東・アフリカの市場:国別
- ブラジル
- アルゼンチン
- エジプト
- 南アフリカ
- モロッコ
- ナイジェリア
- その他ラテンアメリカ・中東・アフリカ地域
- ラテンアメリカ・中東・アフリカの市場:国別
第8章 企業プロファイル
- BASF SE
- Bayer AG
- Certis USA LLC(Mitsui & Co, Ltd.)
- Novozymes A/S(Novo Holdings A/S)
- Biobest Group NV
- Syngenta AG Group
- Nufarm Ltd
- Sumitomo Chemical Co, Ltd.
- Ginkgo Bioworks Holdings, Inc
- Vestaron Corporation
第9章 バイオ殺虫剤市場の勝利は必須
LIST OF TABLES
- TABLE 1 Global Bioinsecticides Market, 2019 - 2022, USD Thousands
- TABLE 2 Global Bioinsecticides Market, 2023 - 2030, USD Thousands
- TABLE 3 Global Bioinsecticides Market, 2019 - 2022, Kilo Litres
- TABLE 4 Global Bioinsecticides Market, 2023 - 2030, Kilo Litres
- TABLE 5 Partnerships, Collaborations and Agreements- Bioinsecticides Market
- TABLE 6 Product Launches And Product Expansions- Bioinsecticides Market
- TABLE 7 Acquisition and Mergers- Bioinsecticides Market
- TABLE 8 Global Bioinsecticides Market by Source, 2019 - 2022, USD Thousands
- TABLE 9 Global Bioinsecticides Market by Source, 2023 - 2030, USD Thousands
- TABLE 10 Global Bioinsecticides Market by Source, 2019 - 2022, Kilo Litres
- TABLE 11 Global Bioinsecticides Market by Source, 2023 - 2030, Kilo Litres
- TABLE 12 Global Microbials Market by Region, 2019 - 2022, USD Thousands
- TABLE 13 Global Microbials Market by Region, 2023 - 2030, USD Thousands
- TABLE 14 Global Microbials Market by Region, 2019 - 2022, Kilo Litres
- TABLE 15 Global Microbials Market by Region, 2023 - 2030, Kilo Litres
- TABLE 16 Global Plants Market by Region, 2019 - 2022, USD Thousands
- TABLE 17 Global Plants Market by Region, 2023 - 2030, USD Thousands
- TABLE 18 Global Plants Market by Region, 2019 - 2022, Kilo Litres
- TABLE 19 Global Plants Market by Region, 2023 - 2030, Kilo Litres
- TABLE 20 Global Others Market by Region, 2019 - 2022, USD Thousands
- TABLE 21 Global Others Market by Region, 2023 - 2030, USD Thousands
- TABLE 22 Global Others Market by Region, 2019 - 2022, Kilo Litres
- TABLE 23 Global Others Market by Region, 2023 - 2030, Kilo Litres
- TABLE 24 Global Bioinsecticides Market by Application, 2019 - 2022, USD Thousands
- TABLE 25 Global Bioinsecticides Market by Application, 2023 - 2030, USD Thousands
- TABLE 26 Global Bioinsecticides Market by Application, 2019 - 2022, Kilo Litres
- TABLE 27 Global Bioinsecticides Market by Application, 2023 - 2030, Kilo Litres
- TABLE 28 Global Cereals & Grains Market by Region, 2019 - 2022, USD Thousands
- TABLE 29 Global Cereals & Grains Market by Region, 2023 - 2030, USD Thousands
- TABLE 30 Global Cereals & Grains Market by Region, 2019 - 2022, Kilo Litres
- TABLE 31 Global Cereals & Grains Market by Region, 2023 - 2030, Kilo Litres
- TABLE 32 Global Oilseed & Pulses Market by Region, 2019 - 2022, USD Thousands
- TABLE 33 Global Oilseed & Pulses Market by Region, 2023 - 2030, USD Thousands
- TABLE 34 Global Oilseed & Pulses Market by Region, 2019 - 2022, Kilo Litres
- TABLE 35 Global Oilseed & Pulses Market by Region, 2023 - 2030, Kilo Litres
- TABLE 36 Global Fruits & Vegetables Market by Region, 2019 - 2022, USD Thousands
- TABLE 37 Global Fruits & Vegetables Market by Region, 2023 - 2030, USD Thousands
- TABLE 38 Global Fruits & Vegetables Market by Region, 2019 - 2022, Kilo Litres
- TABLE 39 Global Fruits & Vegetables Market by Region, 2023 - 2030, Kilo Litres
- TABLE 40 Global Others Market by Region, 2019 - 2022, USD Thousands
- TABLE 41 Global Others Market by Region, 2023 - 2030, USD Thousands
- TABLE 42 Global Others Market by Region, 2019 - 2022, Kilo Litres
- TABLE 43 Global Others Market by Region, 2023 - 2030, Kilo Litres
- TABLE 44 Global Bioinsecticides Market by Region, 2019 - 2022, USD Thousands
- TABLE 45 Global Bioinsecticides Market by Region, 2023 - 2030, USD Thousands
- TABLE 46 Global Bioinsecticides Market by Region, 2019 - 2022, Kilo Litres
- TABLE 47 Global Bioinsecticides Market by Region, 2023 - 2030, Kilo Litres
- TABLE 48 North America Bioinsecticides Market, 2019 - 2022, USD Thousands
- TABLE 49 North America Bioinsecticides Market, 2023 - 2030, USD Thousands
- TABLE 50 North America Bioinsecticides Market, 2019 - 2022, Kilo Litres
- TABLE 51 North America Bioinsecticides Market, 2023 - 2030, Kilo Litres
- TABLE 52 North America Bioinsecticides Market by Source, 2019 - 2022, USD Thousands
- TABLE 53 North America Bioinsecticides Market by Source, 2023 - 2030, USD Thousands
- TABLE 54 North America Bioinsecticides Market by Source, 2019 - 2022, Kilo Litres
- TABLE 55 North America Bioinsecticides Market by Source, 2023 - 2030, Kilo Litres
- TABLE 56 North America Microbials Market by Country, 2019 - 2022, USD Thousands
- TABLE 57 North America Microbials Market by Country, 2023 - 2030, USD Thousands
- TABLE 58 North America Microbials Market by Country, 2019 - 2022, Kilo Litres
- TABLE 59 North America Microbials Market by Country, 2023 - 2030, Kilo Litres
- TABLE 60 North America Plants Market by Country, 2019 - 2022, USD Thousands
- TABLE 61 North America Plants Market by Country, 2023 - 2030, USD Thousands
- TABLE 62 North America Plants Market by Country, 2019 - 2022, Kilo Litres
- TABLE 63 North America Plants Market by Country, 2023 - 2030, Kilo Litres
- TABLE 64 North America Others Market by Country, 2019 - 2022, USD Thousands
- TABLE 65 North America Others Market by Country, 2023 - 2030, USD Thousands
- TABLE 66 North America Others Market by Country, 2019 - 2022, Kilo Litres
- TABLE 67 North America Others Market by Country, 2023 - 2030, Kilo Litres
- TABLE 68 North America Bioinsecticides Market by Application, 2019 - 2022, USD Thousands
- TABLE 69 North America Bioinsecticides Market by Application, 2023 - 2030, USD Thousands
- TABLE 70 North America Bioinsecticides Market by Application, 2019 - 2022, Kilo Litres
- TABLE 71 North America Bioinsecticides Market by Application, 2023 - 2030, Kilo Litres
- TABLE 72 North America Cereals & Grains Market by Country, 2019 - 2022, USD Thousands
- TABLE 73 North America Cereals & Grains Market by Country, 2023 - 2030, USD Thousands
- TABLE 74 North America Cereals & Grains Market by Country, 2019 - 2022, Kilo Litres
- TABLE 75 North America Cereals & Grains Market by Country, 2023 - 2030, Kilo Litres
- TABLE 76 North America Oilseed & Pulses Market by Country, 2019 - 2022, USD Thousands
- TABLE 77 North America Oilseed & Pulses Market by Country, 2023 - 2030, USD Thousands
- TABLE 78 North America Oilseed & Pulses Market by Country, 2019 - 2022, Kilo Litres
- TABLE 79 North America Oilseed & Pulses Market by Country, 2023 - 2030, Kilo Litres
- TABLE 80 North America Fruits & Vegetables Market by Country, 2019 - 2022, USD Thousands
- TABLE 81 North America Fruits & Vegetables Market by Country, 2023 - 2030, USD Thousands
- TABLE 82 North America Fruits & Vegetables Market by Country, 2019 - 2022, Kilo Litres
- TABLE 83 North America Fruits & Vegetables Market by Country, 2023 - 2030, Kilo Litres
- TABLE 84 North America Others Market by Country, 2019 - 2022, USD Thousands
- TABLE 85 North America Others Market by Country, 2023 - 2030, USD Thousands
- TABLE 86 North America Others Market by Country, 2019 - 2022, Kilo Litres
- TABLE 87 North America Others Market by Country, 2023 - 2030, Kilo Litres
- TABLE 88 North America Bioinsecticides Market by Country, 2019 - 2022, USD Thousands
- TABLE 89 North America Bioinsecticides Market by Country, 2023 - 2030, USD Thousands
- TABLE 90 North America Bioinsecticides Market by Country, 2019 - 2022, Kilo Litres
- TABLE 91 North America Bioinsecticides Market by Country, 2023 - 2030, Kilo Litres
- TABLE 92 US Bioinsecticides Market, 2019 - 2022, USD Thousands
- TABLE 93 US Bioinsecticides Market, 2023 - 2030, USD Thousands
- TABLE 94 US Bioinsecticides Market, 2019 - 2022, Kilo Litres
- TABLE 95 US Bioinsecticides Market, 2023 - 2030, Kilo Litres
- TABLE 96 US Bioinsecticides Market by Source, 2019 - 2022, USD Thousands
- TABLE 97 US Bioinsecticides Market by Source, 2023 - 2030, USD Thousands
- TABLE 98 US Bioinsecticides Market by Source, 2019 - 2022, Kilo Litres
- TABLE 99 US Bioinsecticides Market by Source, 2023 - 2030, Kilo Litres
- TABLE 100 US Bioinsecticides Market by Application, 2019 - 2022, USD Thousands
- TABLE 101 US Bioinsecticides Market by Application, 2023 - 2030, USD Thousands
- TABLE 102 US Bioinsecticides Market by Application, 2019 - 2022, Kilo Litres
- TABLE 103 US Bioinsecticides Market by Application, 2023 - 2030, Kilo Litres
- TABLE 104 Canada Bioinsecticides Market, 2019 - 2022, USD Thousands
- TABLE 105 Canada Bioinsecticides Market, 2023 - 2030, USD Thousands
- TABLE 106 Canada Bioinsecticides Market, 2019 - 2022, Kilo Litres
- TABLE 107 Canada Bioinsecticides Market, 2023 - 2030, Kilo Litres
- TABLE 108 Canada Bioinsecticides Market by Source, 2019 - 2022, USD Thousands
- TABLE 109 Canada Bioinsecticides Market by Source, 2023 - 2030, USD Thousands
- TABLE 110 Canada Bioinsecticides Market by Source, 2019 - 2022, Kilo Litres
- TABLE 111 Canada Bioinsecticides Market by Source, 2023 - 2030, Kilo Litres
- TABLE 112 Canada Bioinsecticides Market by Application, 2019 - 2022, USD Thousands
- TABLE 113 Canada Bioinsecticides Market by Application, 2023 - 2030, USD Thousands
- TABLE 114 Canada Bioinsecticides Market by Application, 2019 - 2022, Kilo Litres
- TABLE 115 Canada Bioinsecticides Market by Application, 2023 - 2030, Kilo Litres
- TABLE 116 Mexico Bioinsecticides Market, 2019 - 2022, USD Thousands
- TABLE 117 Mexico Bioinsecticides Market, 2023 - 2030, USD Thousands
- TABLE 118 Mexico Bioinsecticides Market, 2019 - 2022, Kilo Litres
- TABLE 119 Mexico Bioinsecticides Market, 2023 - 2030, Kilo Litres
- TABLE 120 Mexico Bioinsecticides Market by Source, 2019 - 2022, USD Thousands
- TABLE 121 Mexico Bioinsecticides Market by Source, 2023 - 2030, USD Thousands
- TABLE 122 Mexico Bioinsecticides Market by Source, 2019 - 2022, Kilo Litres
- TABLE 123 Mexico Bioinsecticides Market by Source, 2023 - 2030, Kilo Litres
- TABLE 124 Mexico Bioinsecticides Market by Application, 2019 - 2022, USD Thousands
- TABLE 125 Mexico Bioinsecticides Market by Application, 2023 - 2030, USD Thousands
- TABLE 126 Mexico Bioinsecticides Market by Application, 2019 - 2022, Kilo Litres
- TABLE 127 Mexico Bioinsecticides Market by Application, 2023 - 2030, Kilo Litres
- TABLE 128 Rest of North America Bioinsecticides Market, 2019 - 2022, USD Thousands
- TABLE 129 Rest of North America Bioinsecticides Market, 2023 - 2030, USD Thousands
- TABLE 130 Rest of North America Bioinsecticides Market, 2019 - 2022, Kilo Litres
- TABLE 131 Rest of North America Bioinsecticides Market, 2023 - 2030, Kilo Litres
- TABLE 132 Rest of North America Bioinsecticides Market by Source, 2019 - 2022, USD Thousands
- TABLE 133 Rest of North America Bioinsecticides Market by Source, 2023 - 2030, USD Thousands
- TABLE 134 Rest of North America Bioinsecticides Market by Source, 2019 - 2022, Kilo Litres
- TABLE 135 Rest of North America Bioinsecticides Market by Source, 2023 - 2030, Kilo Litres
- TABLE 136 Rest of North America Bioinsecticides Market by Application, 2019 - 2022, USD Thousands
- TABLE 137 Rest of North America Bioinsecticides Market by Application, 2023 - 2030, USD Thousands
- TABLE 138 Rest of North America Bioinsecticides Market by Application, 2019 - 2022, Kilo Litres
- TABLE 139 Rest of North America Bioinsecticides Market by Application, 2023 - 2030, Kilo Litres
- TABLE 140 Europe Bioinsecticides Market, 2019 - 2022, USD Thousands
- TABLE 141 Europe Bioinsecticides Market, 2023 - 2030, USD Thousands
- TABLE 142 Europe Bioinsecticides Market, 2019 - 2022, Kilo Litres
- TABLE 143 Europe Bioinsecticides Market, 2023 - 2030, Kilo Litres
- TABLE 144 Europe Bioinsecticides Market by Source, 2019 - 2022, USD Thousands
- TABLE 145 Europe Bioinsecticides Market by Source, 2023 - 2030, USD Thousands
- TABLE 146 Europe Bioinsecticides Market by Source, 2019 - 2022, Kilo Litres
- TABLE 147 Europe Bioinsecticides Market by Source, 2023 - 2030, Kilo Litres
- TABLE 148 Europe Microbials Market by Country, 2019 - 2022, USD Thousands
- TABLE 149 Europe Microbials Market by Country, 2023 - 2030, USD Thousands
- TABLE 150 Europe Microbials Market by Country, 2019 - 2022, Kilo Litres
- TABLE 151 Europe Microbials Market by Country, 2023 - 2030, Kilo Litres
- TABLE 152 Europe Plants Market by Country, 2019 - 2022, USD Thousands
- TABLE 153 Europe Plants Market by Country, 2023 - 2030, USD Thousands
- TABLE 154 Europe Plants Market by Country, 2019 - 2022, Kilo Litres
- TABLE 155 Europe Plants Market by Country, 2023 - 2030, Kilo Litres
- TABLE 156 Europe Others Market by Country, 2019 - 2022, USD Thousands
- TABLE 157 Europe Others Market by Country, 2023 - 2030, USD Thousands
- TABLE 158 Europe Others Market by Country, 2019 - 2022, Kilo Litres
- TABLE 159 Europe Others Market by Country, 2023 - 2030, Kilo Litres
- TABLE 160 Europe Bioinsecticides Market by Application, 2019 - 2022, USD Thousands
- TABLE 161 Europe Bioinsecticides Market by Application, 2023 - 2030, USD Thousands
- TABLE 162 Europe Bioinsecticides Market by Application, 2019 - 2022, Kilo Litres
- TABLE 163 Europe Bioinsecticides Market by Application, 2023 - 2030, Kilo Litres
- TABLE 164 Europe Cereals & Grains Market by Country, 2019 - 2022, USD Thousands
- TABLE 165 Europe Cereals & Grains Market by Country, 2023 - 2030, USD Thousands
- TABLE 166 Europe Cereals & Grains Market by Country, 2019 - 2022, Kilo Litres
- TABLE 167 Europe Cereals & Grains Market by Country, 2023 - 2030, Kilo Litres
- TABLE 168 Europe Oilseed & Pulses Market by Country, 2019 - 2022, USD Thousands
- TABLE 169 Europe Oilseed & Pulses Market by Country, 2023 - 2030, USD Thousands
- TABLE 170 Europe Oilseed & Pulses Market by Country, 2019 - 2022, Kilo Litres
- TABLE 171 Europe Oilseed & Pulses Market by Country, 2023 - 2030, Kilo Litres
- TABLE 172 Europe Fruits & Vegetables Market by Country, 2019 - 2022, USD Thousands
- TABLE 173 Europe Fruits & Vegetables Market by Country, 2023 - 2030, USD Thousands
- TABLE 174 Europe Fruits & Vegetables Market by Country, 2019 - 2022, Kilo Litres
- TABLE 175 Europe Fruits & Vegetables Market by Country, 2023 - 2030, Kilo Litres
- TABLE 176 Europe Others Market by Country, 2019 - 2022, USD Thousands
- TABLE 177 Europe Others Market by Country, 2023 - 2030, USD Thousands
- TABLE 178 Europe Others Market by Country, 2019 - 2022, Kilo Litres
- TABLE 179 Europe Others Market by Country, 2023 - 2030, Kilo Litres
- TABLE 180 Europe Bioinsecticides Market by Country, 2019 - 2022, USD Thousands
- TABLE 181 Europe Bioinsecticides Market by Country, 2023 - 2030, USD Thousands
- TABLE 182 Europe Bioinsecticides Market by Country, 2019 - 2022, Kilo Litres
- TABLE 183 Europe Bioinsecticides Market by Country, 2023 - 2030, Kilo Litres
- TABLE 184 Russia Bioinsecticides Market, 2019 - 2022, USD Thousands
- TABLE 185 Russia Bioinsecticides Market, 2023 - 2030, USD Thousands
- TABLE 186 Russia Bioinsecticides Market, 2019 - 2022, Kilo Litres
- TABLE 187 Russia Bioinsecticides Market, 2023 - 2030, Kilo Litres
- TABLE 188 Russia Bioinsecticides Market by Source, 2019 - 2022, USD Thousands
- TABLE 189 Russia Bioinsecticides Market by Source, 2023 - 2030, USD Thousands
- TABLE 190 Russia Bioinsecticides Market by Source, 2019 - 2022, Kilo Litres
- TABLE 191 Russia Bioinsecticides Market by Source, 2023 - 2030, Kilo Litres
- TABLE 192 Russia Bioinsecticides Market by Application, 2019 - 2022, USD Thousands
- TABLE 193 Russia Bioinsecticides Market by Application, 2023 - 2030, USD Thousands
- TABLE 194 Russia Bioinsecticides Market by Application, 2019 - 2022, Kilo Litres
- TABLE 195 Russia Bioinsecticides Market by Application, 2023 - 2030, Kilo Litres
- TABLE 196 France Bioinsecticides Market, 2019 - 2022, USD Thousands
- TABLE 197 France Bioinsecticides Market, 2023 - 2030, USD Thousands
- TABLE 198 France Bioinsecticides Market, 2019 - 2022, Kilo Litres
- TABLE 199 France Bioinsecticides Market, 2023 - 2030, Kilo Litres
- TABLE 200 France Bioinsecticides Market by Source, 2019 - 2022, USD Thousands
- TABLE 201 France Bioinsecticides Market by Source, 2023 - 2030, USD Thousands
- TABLE 202 France Bioinsecticides Market by Source, 2019 - 2022, Kilo Litres
- TABLE 203 France Bioinsecticides Market by Source, 2023 - 2030, Kilo Litres
- TABLE 204 France Bioinsecticides Market by Application, 2019 - 2022, USD Thousands
- TABLE 205 France Bioinsecticides Market by Application, 2023 - 2030, USD Thousands
- TABLE 206 France Bioinsecticides Market by Application, 2019 - 2022, Kilo Litres
- TABLE 207 France Bioinsecticides Market by Application, 2023 - 2030, Kilo Litres
- TABLE 208 Germany Bioinsecticides Market, 2019 - 2022, USD Thousands
- TABLE 209 Germany Bioinsecticides Market, 2023 - 2030, USD Thousands
- TABLE 210 Germany Bioinsecticides Market, 2019 - 2022, Kilo Litres
- TABLE 211 Germany Bioinsecticides Market, 2023 - 2030, Kilo Litres
- TABLE 212 Germany Bioinsecticides Market by Source, 2019 - 2022, USD Thousands
- TABLE 213 Germany Bioinsecticides Market by Source, 2023 - 2030, USD Thousands
- TABLE 214 Germany Bioinsecticides Market by Source, 2019 - 2022, Kilo Litres
- TABLE 215 Germany Bioinsecticides Market by Source, 2023 - 2030, Kilo Litres
- TABLE 216 Germany Bioinsecticides Market by Application, 2019 - 2022, USD Thousands
- TABLE 217 Germany Bioinsecticides Market by Application, 2023 - 2030, USD Thousands
- TABLE 218 Germany Bioinsecticides Market by Application, 2019 - 2022, Kilo Litres
- TABLE 219 Germany Bioinsecticides Market by Application, 2023 - 2030, Kilo Litres
- TABLE 220 Poland Bioinsecticides Market, 2019 - 2022, USD Thousands
- TABLE 221 Poland Bioinsecticides Market, 2023 - 2030, USD Thousands
- TABLE 222 Poland Bioinsecticides Market, 2019 - 2022, Kilo Litres
- TABLE 223 Poland Bioinsecticides Market, 2023 - 2030, Kilo Litres
- TABLE 224 Poland Bioinsecticides Market by Source, 2019 - 2022, USD Thousands
- TABLE 225 Poland Bioinsecticides Market by Source, 2023 - 2030, USD Thousands
- TABLE 226 Poland Bioinsecticides Market by Source, 2019 - 2022, Kilo Litres
- TABLE 227 Poland Bioinsecticides Market by Source, 2023 - 2030, Kilo Litres
- TABLE 228 Poland Bioinsecticides Market by Application, 2019 - 2022, USD Thousands
- TABLE 229 Poland Bioinsecticides Market by Application, 2023 - 2030, USD Thousands
- TABLE 230 Poland Bioinsecticides Market by Application, 2019 - 2022, Kilo Litres
- TABLE 231 Poland Bioinsecticides Market by Application, 2023 - 2030, Kilo Litres
- TABLE 232 UK Bioinsecticides Market, 2019 - 2022, USD Thousands
- TABLE 233 UK Bioinsecticides Market, 2023 - 2030, USD Thousands
- TABLE 234 UK Bioinsecticides Market, 2019 - 2022, Kilo Litres
- TABLE 235 UK Bioinsecticides Market, 2023 - 2030, Kilo Litres
- TABLE 236 UK Bioinsecticides Market by Source, 2019 - 2022, USD Thousands
- TABLE 237 UK Bioinsecticides Market by Source, 2023 - 2030, USD Thousands
- TABLE 238 UK Bioinsecticides Market by Source, 2019 - 2022, Kilo Litres
- TABLE 239 UK Bioinsecticides Market by Source, 2023 - 2030, Kilo Litres
- TABLE 240 UK Bioinsecticides Market by Application, 2019 - 2022, USD Thousands
- TABLE 241 UK Bioinsecticides Market by Application, 2023 - 2030, USD Thousands
- TABLE 242 UK Bioinsecticides Market by Application, 2019 - 2022, Kilo Litres
- TABLE 243 UK Bioinsecticides Market by Application, 2023 - 2030, Kilo Litres
- TABLE 244 Italy Bioinsecticides Market, 2019 - 2022, USD Thousands
- TABLE 245 Italy Bioinsecticides Market, 2023 - 2030, USD Thousands
- TABLE 246 Italy Bioinsecticides Market, 2019 - 2022, Kilo Litres
- TABLE 247 Italy Bioinsecticides Market, 2023 - 2030, Kilo Litres
- TABLE 248 Italy Bioinsecticides Market by Source, 2019 - 2022, USD Thousands
- TABLE 249 Italy Bioinsecticides Market by Source, 2023 - 2030, USD Thousands
- TABLE 250 Italy Bioinsecticides Market by Source, 2019 - 2022, Kilo Litres
- TABLE 251 Italy Bioinsecticides Market by Source, 2023 - 2030, Kilo Litres
- TABLE 252 Italy Bioinsecticides Market by Application, 2019 - 2022, USD Thousands
- TABLE 253 Italy Bioinsecticides Market by Application, 2023 - 2030, USD Thousands
- TABLE 254 Italy Bioinsecticides Market by Application, 2019 - 2022, Kilo Litres
- TABLE 255 Italy Bioinsecticides Market by Application, 2023 - 2030, Kilo Litres
- TABLE 256 Rest of Europe Bioinsecticides Market, 2019 - 2022, USD Thousands
- TABLE 257 Rest of Europe Bioinsecticides Market, 2023 - 2030, USD Thousands
- TABLE 258 Rest of Europe Bioinsecticides Market, 2019 - 2022, Kilo Litres
- TABLE 259 Rest of Europe Bioinsecticides Market, 2023 - 2030, Kilo Litres
- TABLE 260 Rest of Europe Bioinsecticides Market by Source, 2019 - 2022, USD Thousands
- TABLE 261 Rest of Europe Bioinsecticides Market by Source, 2023 - 2030, USD Thousands
- TABLE 262 Rest of Europe Bioinsecticides Market by Source, 2019 - 2022, Kilo Litres
- TABLE 263 Rest of Europe Bioinsecticides Market by Source, 2023 - 2030, Kilo Litres
- TABLE 264 Rest of Europe Bioinsecticides Market by Application, 2019 - 2022, USD Thousands
- TABLE 265 Rest of Europe Bioinsecticides Market by Application, 2023 - 2030, USD Thousands
- TABLE 266 Rest of Europe Bioinsecticides Market by Application, 2019 - 2022, Kilo Litres
- TABLE 267 Rest of Europe Bioinsecticides Market by Application, 2023 - 2030, Kilo Litres
- TABLE 268 Asia Pacific Bioinsecticides Market, 2019 - 2022, USD Thousands
- TABLE 269 Asia Pacific Bioinsecticides Market, 2023 - 2030, USD Thousands
- TABLE 270 Asia Pacific Bioinsecticides Market, 2019 - 2022, Kilo Litres
- TABLE 271 Asia Pacific Bioinsecticides Market, 2023 - 2030, Kilo Litres
- TABLE 272 Asia Pacific Bioinsecticides Market by Source, 2019 - 2022, USD Thousands
- TABLE 273 Asia Pacific Bioinsecticides Market by Source, 2023 - 2030, USD Thousands
- TABLE 274 Asia Pacific Bioinsecticides Market by Source, 2019 - 2022, Kilo Litres
- TABLE 275 Asia Pacific Bioinsecticides Market by Source, 2023 - 2030, Kilo Litres
- TABLE 276 Asia Pacific Microbials Market by Country, 2019 - 2022, USD Thousands
- TABLE 277 Asia Pacific Microbials Market by Country, 2023 - 2030, USD Thousands
- TABLE 278 Asia Pacific Microbials Market by Country, 2019 - 2022, Kilo Litres
- TABLE 279 Asia Pacific Microbials Market by Country, 2023 - 2030, Kilo Litres
- TABLE 280 Asia Pacific Plants Market by Country, 2019 - 2022, USD Thousands
- TABLE 281 Asia Pacific Plants Market by Country, 2023 - 2030, USD Thousands
- TABLE 282 Asia Pacific Plants Market by Country, 2019 - 2022, Kilo Litres
- TABLE 283 Asia Pacific Plants Market by Country, 2023 - 2030, Kilo Litres
- TABLE 284 Asia Pacific Others Market by Country, 2019 - 2022, USD Thousands
- TABLE 285 Asia Pacific Others Market by Country, 2023 - 2030, USD Thousands
- TABLE 286 Asia Pacific Others Market by Country, 2019 - 2022, Kilo Litres
- TABLE 287 Asia Pacific Others Market by Country, 2023 - 2030, Kilo Litres
- TABLE 288 Asia Pacific Bioinsecticides Market by Application, 2019 - 2022, USD Thousands
- TABLE 289 Asia Pacific Bioinsecticides Market by Application, 2023 - 2030, USD Thousands
- TABLE 290 Asia Pacific Bioinsecticides Market by Application, 2019 - 2022, Kilo Litres
- TABLE 291 Asia Pacific Bioinsecticides Market by Application, 2023 - 2030, Kilo Litres
- TABLE 292 Asia Pacific Cereals & Grains Market by Country, 2019 - 2022, USD Thousands
- TABLE 293 Asia Pacific Cereals & Grains Market by Country, 2023 - 2030, USD Thousands
- TABLE 294 Asia Pacific Cereals & Grains Market by Country, 2019 - 2022, Kilo Litres
- TABLE 295 Asia Pacific Cereals & Grains Market by Country, 2023 - 2030, Kilo Litres
- TABLE 296 Asia Pacific Oilseed & Pulses Market by Country, 2019 - 2022, USD Thousands
- TABLE 297 Asia Pacific Oilseed & Pulses Market by Country, 2023 - 2030, USD Thousands
- TABLE 298 Asia Pacific Oilseed & Pulses Market by Country, 2019 - 2022, Kilo Litres
- TABLE 299 Asia Pacific Oilseed & Pulses Market by Country, 2023 - 2030, Kilo Litres
- TABLE 300 Asia Pacific Fruits & Vegetables Market by Country, 2019 - 2022, USD Thousands
- TABLE 301 Asia Pacific Fruits & Vegetables Market by Country, 2023 - 2030, USD Thousands
- TABLE 302 Asia Pacific Fruits & Vegetables Market by Country, 2019 - 2022, Kilo Litres
- TABLE 303 Asia Pacific Fruits & Vegetables Market by Country, 2023 - 2030, Kilo Litres
- TABLE 304 Asia Pacific Others Market by Country, 2019 - 2022, USD Thousands
- TABLE 305 Asia Pacific Others Market by Country, 2023 - 2030, USD Thousands
- TABLE 306 Asia Pacific Others Market by Country, 2019 - 2022, Kilo Litres
- TABLE 307 Asia Pacific Others Market by Country, 2023 - 2030, Kilo Litres
- TABLE 308 Asia Pacific Bioinsecticides Market by Country, 2019 - 2022, USD Thousands
- TABLE 309 Asia Pacific Bioinsecticides Market by Country, 2023 - 2030, USD Thousands
- TABLE 310 Asia Pacific Bioinsecticides Market by Country, 2019 - 2022, Kilo Litres
- TABLE 311 Asia Pacific Bioinsecticides Market by Country, 2023 - 2030, Kilo Litres
- TABLE 312 China Bioinsecticides Market, 2019 - 2022, USD Thousands
- TABLE 313 China Bioinsecticides Market, 2023 - 2030, USD Thousands
- TABLE 314 China Bioinsecticides Market, 2019 - 2022, Kilo Litres
- TABLE 315 China Bioinsecticides Market, 2023 - 2030, Kilo Litres
- TABLE 316 China Bioinsecticides Market by Source, 2019 - 2022, USD Thousands
- TABLE 317 China Bioinsecticides Market by Source, 2023 - 2030, USD Thousands
- TABLE 318 China Bioinsecticides Market by Source, 2019 - 2022, Kilo Litres
- TABLE 319 China Bioinsecticides Market by Source, 2023 - 2030, Kilo Litres
- TABLE 320 China Bioinsecticides Market by Application, 2019 - 2022, USD Thousands
- TABLE 321 China Bioinsecticides Market by Application, 2023 - 2030, USD Thousands
- TABLE 322 China Bioinsecticides Market by Application, 2019 - 2022, Kilo Litres
- TABLE 323 China Bioinsecticides Market by Application, 2023 - 2030, Kilo Litres
- TABLE 324 India Bioinsecticides Market, 2019 - 2022, USD Thousands
- TABLE 325 India Bioinsecticides Market, 2023 - 2030, USD Thousands
- TABLE 326 India Bioinsecticides Market, 2019 - 2022, Kilo Litres
- TABLE 327 India Bioinsecticides Market, 2023 - 2030, Kilo Litres
- TABLE 328 India Bioinsecticides Market by Source, 2019 - 2022, USD Thousands
- TABLE 329 India Bioinsecticides Market by Source, 2023 - 2030, USD Thousands
- TABLE 330 India Bioinsecticides Market by Source, 2019 - 2022, Kilo Litres
- TABLE 331 India Bioinsecticides Market by Source, 2023 - 2030, Kilo Litres
- TABLE 332 India Bioinsecticides Market by Application, 2019 - 2022, USD Thousands
- TABLE 333 India Bioinsecticides Market by Application, 2023 - 2030, USD Thousands
- TABLE 334 India Bioinsecticides Market by Application, 2019 - 2022, Kilo Litres
- TABLE 335 India Bioinsecticides Market by Application, 2023 - 2030, Kilo Litres
The Global Bioinsecticides Market size is expected to reach $189.9 million by 2030, rising at a market growth of 10.2% CAGR during the forecast period. In the year 2022, the market attained a volume of 1,918.3 Kilo Litres, experiencing a growth of 2.2% (2019-2022).
Due to the expanding demand for eco-friendly and sustainable pest management solutions. Hence, the North America region is poised to acquire more than 30% share of the market by 2030. In addition, North America is home to several companies specializing in producing and developing bioinsecticides. These businesses are continually developing new and improved products that are more effective and simpler.
The major strategies followed by the market participants are Product Launches as the key developmental strategy to keep pace with the changing demands of end users. For instance, In March, 2021, Bayer launched Vynyty Citrus, the biological and pheromone-based crop protection product to control pests on citrus farms. In May, 2023, BASF announced the launch of Cimegra, an insecticide providing control of prevalent and difficult-to-control chewing insects.
Based on the Analysis presented in the KBV Cardinal matrix; Bayer AG and Certis USA LLC (Mitsui & Co., Ltd.) are the forerunners in the Market. In February, 2023, Certis Biologicals rolled out SoilGard, a microbial fungicide consisting of an easily usable granular formulation. Companies such as Syngenta AG Group, BASF SE and Sumitomo Chemical Co., Ltd. are some of the key innovators in Market.
Market Growth Factors
Increasing issues of pest resurgence
The increase in pest resurgence due to resistance and ecological imbalances has created a need for sustainable and effective pest management solutions. Bioinsecticides, with their environmentally friendly and targeted approach, offer a valuable tool for mitigating the challenges posed by pest resurgence in agriculture. The increase in pest resurgence is indeed one of the driving factors behind the growth of bioinsecticides. By addressing the root causes of pest resurgence, such as the disruption of ecosystems through chemical pesticide use, bioinsecticides contribute to the long-term sustainability of agricultural systems. Hence, all these factors are propelling the growth of the market.
Rise in adoption of organic food
The adoption of organic food has been a growing trend over the past several years, driven by various factors, including health concerns, environmental awareness, and changing consumer preferences. Organic food is produced using methods that avoid synthetic pesticides, chemical fertilizers, genetically modified organisms (GMOs), and certain other additives or processing methods. Organic food is often certified by recognized organizations that ensure adherence to specific production standards. This certification provides consumers with confidence in the authenticity of organic claims. Bioinsecticides are emerging as an important component of organic production. Therefore, as the demand for organic products increases, the demand will also increase.
Market Restraining Factors
Brief life span of bioinsecticides
The relatively short shelf life of bioinsecticides is one of the challenges associated with these products. Bioinsecticides, which are derived from living organisms or natural compounds, can have a limited lifespan compared to some synthetic chemical pesticides. When the target pest is absent, the bioinsecticide may not have a purpose, reducing its effective life span. Also, bioinsecticides' relatively short shelf life can impact their commercial viability, as it may increase the costs associated with production, storage, and distribution. Hence, the short life span of bioinsecticides along with the factors mentioned above can hamper the growth of the market.
Source Outlook
Based on source, the market is segmented into microbials, plants, and others. The plants segment witnessed a significant revenue share in the market in 2022. These bioinsecticides harness the plant's natural defense mechanisms against insect pests. They offer an eco-friendly alternative to synthetic chemical pesticides, as they are often less harmful to non-target organisms, have lower environmental impact, and may be suitable for use in organic farming. For example, limonene is a natural insecticide derived from citrus fruits. It is a contact insecticide that disrupts the waxy cuticle of insects, leading to their dehydration and death. Limonene-based products are often used in household insect sprays.
Application Outlook
On the basis of application, the market is divided into cereals & grains, oilseeds & pulses, fruits & vegetables, and others. In 2022, the cereals and grains segment registered the highest revenue shares in the market. The consumption of these agriculture produce has increased due to the nutritional benefits of cereals and grains like rice, barley, maize, oats, wheat, and sorghum. These are predominantly applied to cereals and grains in Asia Pacific and North America due to the extensive wheat and maize cultivation in China and the United States. Typically, crop protection agents are recommended for cereals and grains.
Regional Outlook
Region-wise, the market is analyzed across North America, Europe, Asia Pacific, and LAMEA. The Asia Pacific region acquired the maximum revenue share in the market in 2022. Based on the data from the Food and Agricultural Organization (FAO) and the Organization for Economic Co-operation and Development (OECD), the Asia Pacific region is the world's biggest producer of agricultural commodities. Due to population growth, arable land in the region is diminishing while food demand is rising. Therefore, producers progressively employ bioinsecticides to increase crop yield. The region is distinguished by its abundance of inexpensive labor and natural materials.
The market research report covers the analysis of key stakeholders of the market. Key companies profiled in the report include BASF SE, Bayer AG, Certis USA LLC (Mitsui & Co., Ltd.), Novozymes A/S (Novo Holdings A/S), Biobest Group NV, Syngenta AG Group, Nufarm Ltd., Sumitomo Chemical Co., Ltd., Ginkgo Bioworks Holdings, Inc., and Vestaron Corporation
Recent Strategies Deployed in Bioinsecticides Market
Partnerships, Collaborations and Agreements:
Apr-2023: Syngenta partnered with Biotalys, an Agricultural Technology (AgTech) company protecting crops and food. This collaboration aims to research, develop, and market the latest biocontrol solutions to manage important pests in a wide variety of crops. Moreover, this solution would be based on Biotalys' AGROBODY™ technology and would provide a new mode of action to expand farmers' access to novel technologies that counter the threat of pest resistance and advance sustainable culture.
Feb-2023: Bayer collaborated with Kimitec, a biotechnology company that provides natural and innovative agricultural solutions. This collaboration aims to bring modern Biologicals to millions of growers globally. Furthermore, both companies would focus on boosting the development and marketing of biological crop protection solutions and biostimulants.
Jun-2022: Certis Biologicals collaborated with Novozymes, a company specializing in biosolutions. This collaboration aims to bring new solutions to row crop growers at a time when effective crop protection is more crucial than ever.
Jun-2022: Bayer came into collaboration with AgroSpheres, Inc., a leader in developing the next generation of environmentally friendly crop protection products. Following this collaboration, both companies would aim to build novel modalities of biologicals for usage as crop protection products.
Jun-2022: Novozymes came into partnership with Biotalys, an Agricultural Technology company protecting crops and food with protein-based biocontrol solutions. The partnership aims to broaden opportunities for Evoca™*, Biotalys' first proprietary biocontrol.
Jun-2022: Novozymes collaborated with Certis Biologicals, a pioneer in the development of biological pesticides. Through this collaboration, Novozymes aims to provide additional, efficacious solutions for growers of traditional row crops. Moreover, this would bring new solutions to row crop growers at a time when effective crop protection is more crucial than ever.
Jun-2022: Bayer signed an agreement with MustGrow Biologics Corp., an agriculture biotechnology company focused on the development and commercialization of natural biological technologies. Under this agreement, both Bayer and MustGrow Biologics Corp. aim to analyse MustGrow's biological technologies to find efficacy and commercial potential in key agricultural regions.
Product Launches and Product Expansions:
Jul-2023: Syngenta India released Incipio and Simodis, plant protection solutions for vegetables, paddy, and cotton, in India. The launched products are based on PLINAZOLIN technology, delivering effective defense against multiple pests, making sure enhanced yields and crop quality.
May-2023: BASF announced the launch of Cimegra, an insecticide providing control of prevalent and difficult-to-control chewing insects. With this launch, the company aims to offer Indonesian farmers effective and long-lasting protection of their crops.
Feb-2023: Certis Biologicals rolled out SoilGard, a microbial fungicide. The product consists of an easily usable granular formulation that includes a living, naturally occurring soil fungus that is antagonistic to plant pathogenic fungi including fusarium, pythium, and Rhizoctonia.
Feb-2023: Certis Biologicals introduced Kocide 50DF, the formulatin of the Copper Biofungicide. The Kocide 50DF comes with proven efficacy that growers have relied upon for generations, to serve more growers who require solutions to protect their crops sustainably and effectively.
Jan-2023: BASF introduced Axalion Active, a novel insecticide active ingredient that controls harmful piercing and sucking insect pests, across Australia. The product would be used for Axalion-containing products including fruits, soybeans, legumes, cotton, cereals, beets, vegetables, oilseed rape, and ornamentals.
Apr-2022: BASF released Exponus, an insecticide for farmers in India. With this launch, farmers would be able to protect their crops and accelerate productivity. The leading solution is powered by BASF's new active ingredient, Broflanilide® in a specialized formulation. Moreover, the product delivers the latest mode of action for the control of key insect pests and provides farmers with a powerful, rapid &diverse tool for controlling a variety of insect pests and overcoming resistance to prevailing chemistries, as part of an integrated pest management program.
Acquisitions and Mergers:
Jan-2023: Valent BioSciences LLC completed the acquisition of FBSciences Holdings, Inc., a leader in the discovery and commercialization of naturally derived plant, soil, and climate health solutions. Through this acquisition, Valent BioSciences and its parent company, Sumitomo Chemical Co., Ltd., provide an advanced suite of combined biorational solutions, consisting of biostimulants, biopesticides, and crop nutrition solutions.
Jan-2022: Syngenta Crop Protection completed the acquisition of NemaTrident and UniSpore, the two next-generation bioinsecticides by Bionema, a creator of natural biopesticides, biostimulants and biofertilizers. This acquisition aims to combat rising resistance and a broad range of insects and pests in horticulture and ornamentals, turf amenities, and forestry, providing customers with better choices.
Scope of the Study
Market Segments covered in the Report:
By Source (Volume, Kilo Litres, USD Thousands, 2019-2030)
- Microbials
- Plants
- Others
By Application (Volume, Kilo Litres, USD Thousands, 2019-2030)
- Cereals & Grains
- Oilseed & Pulses
- Fruits & Vegetables
- Others
By Geography (Volume, Kilo Litres, USD Thousands, 2019-2030)
- North America
- US
- Canada
- Mexico
- Rest of North America
- Europe
- Russia
- France
- Germany
- Poland
- UK
- Italy
- Rest of Europe
- Asia Pacific
- China
- India
- Indonesia
- Australia
- South Korea
- Japan
- Rest of Asia Pacific
- LAMEA
- Brazil
- Argentina
- Egypt
- South Africa
- Morocco
- Nigeria
- Rest of LAMEA
Companies Profiled
- BASF SE
- Bayer AG
- Certis USA LLC (Mitsui & Co., Ltd.)
- Novozymes A/S (Novo Holdings A/S)
- Biobest Group NV
- Syngenta AG Group
- Nufarm Ltd.
- Sumitomo Chemical Co., Ltd.
- Ginkgo Bioworks Holdings, Inc.
- Vestaron Corporation
Unique Offerings from KBV Research
- Exhaustive coverage
- Highest number of market tables and figures
- Subscription based model available
- Guaranteed best price
- Assured post sales research support with 10% customization free
Table of Contents
Chapter 1. Market Scope & Methodology
- 1.1 Market Definition
- 1.2 Objectives
- 1.3 Market Scope
- 1.4 Segmentation
- 1.4.1 Global Bioinsecticides Market, by Source
- 1.4.2 Global Bioinsecticides Market, by Application
- 1.4.3 Global Bioinsecticides Market, by Geography
- 1.5 Methodology for the research
Chapter 2. Market at a Glance
- 2.1 Key Highlights
Chapter 3. Market Overview
- 3.1 Introduction
- 3.1.1 Overview
- 3.1.1.1 Market Composition and Scenario
- 3.1.1 Overview
- 3.2 Key Factors Impacting the Market
- 3.2.1 Market Drivers
- 3.2.2 Market Restraints
Chapter 4. Competition Analysis - Global
- 4.1 KBV Cardinal Matrix
- 4.2 Recent Industry Wide Strategic Developments
- 4.2.1 Partnerships, Collaborations and Agreements
- 4.2.2 Product Launches and Product Expansions
- 4.2.3 Acquisition and Mergers
- 4.3 Top Winning Strategies
- 4.3.1 Key Leading Strategies: Percentage Distribution (2019-2023)
- 4.3.2 Key Strategic Move: (Product Launches and Product Expansions: 2020, Sep - 2023, Jul) Leading Players
- 4.4 Porter's Five Forces Analysis
Chapter 5. Global Bioinsecticides Market by Source
- 5.1 Global Microbials Market by Region
- 5.2 Global Plants Market by Region
- 5.3 Global Others Market by Region
Chapter 6. Global Bioinsecticides Market by Application
- 6.1 Global Cereals & Grains Market by Region
- 6.2 Global Oilseed & Pulses Market by Region
- 6.3 Global Fruits & Vegetables Market by Region
- 6.4 Global Others Market by Region
Chapter 7. Global Bioinsecticides Market by Region
- 7.1 North America Bioinsecticides Market
- 7.1.1 North America Bioinsecticides Market by Source
- 7.1.1.1 North America Microbials Market by Country
- 7.1.1.2 North America Plants Market by Country
- 7.1.1.3 North America Others Market by Country
- 7.1.2 North America Bioinsecticides Market by Application
- 7.1.2.1 North America Cereals & Grains Market by Country
- 7.1.2.2 North America Oilseed & Pulses Market by Country
- 7.1.2.3 North America Fruits & Vegetables Market by Country
- 7.1.2.4 North America Others Market by Country
- 7.1.3 North America Bioinsecticides Market by Country
- 7.1.3.1 US Bioinsecticides Market
- 7.1.3.1.1 US Bioinsecticides Market by Source
- 7.1.3.1.2 US Bioinsecticides Market by Application
- 7.1.3.2 Canada Bioinsecticides Market
- 7.1.3.2.1 Canada Bioinsecticides Market by Source
- 7.1.3.2.2 Canada Bioinsecticides Market by Application
- 7.1.3.3 Mexico Bioinsecticides Market
- 7.1.3.3.1 Mexico Bioinsecticides Market by Source
- 7.1.3.3.2 Mexico Bioinsecticides Market by Application
- 7.1.3.4 Rest of North America Bioinsecticides Market
- 7.1.3.4.1 Rest of North America Bioinsecticides Market by Source
- 7.1.3.4.2 Rest of North America Bioinsecticides Market by Application
- 7.1.3.1 US Bioinsecticides Market
- 7.1.1 North America Bioinsecticides Market by Source
- 7.2 Europe Bioinsecticides Market
- 7.2.1 Europe Bioinsecticides Market by Source
- 7.2.1.1 Europe Microbials Market by Country
- 7.2.1.2 Europe Plants Market by Country
- 7.2.1.3 Europe Others Market by Country
- 7.2.2 Europe Bioinsecticides Market by Application
- 7.2.2.1 Europe Cereals & Grains Market by Country
- 7.2.2.2 Europe Oilseed & Pulses Market by Country
- 7.2.2.3 Europe Fruits & Vegetables Market by Country
- 7.2.2.4 Europe Others Market by Country
- 7.2.3 Europe Bioinsecticides Market by Country
- 7.2.3.1 Russia Bioinsecticides Market
- 7.2.3.1.1 Russia Bioinsecticides Market by Source
- 7.2.3.1.2 Russia Bioinsecticides Market by Application
- 7.2.3.2 France Bioinsecticides Market
- 7.2.3.2.1 France Bioinsecticides Market by Source
- 7.2.3.2.2 France Bioinsecticides Market by Application
- 7.2.3.3 Germany Bioinsecticides Market
- 7.2.3.3.1 Germany Bioinsecticides Market by Source
- 7.2.3.3.2 Germany Bioinsecticides Market by Application
- 7.2.3.4 Poland Bioinsecticides Market
- 7.2.3.4.1 Poland Bioinsecticides Market by Source
- 7.2.3.4.2 Poland Bioinsecticides Market by Application
- 7.2.3.5 UK Bioinsecticides Market
- 7.2.3.5.1 UK Bioinsecticides Market by Source
- 7.2.3.5.2 UK Bioinsecticides Market by Application
- 7.2.3.6 Italy Bioinsecticides Market
- 7.2.3.6.1 Italy Bioinsecticides Market by Source
- 7.2.3.6.2 Italy Bioinsecticides Market by Application
- 7.2.3.7 Rest of Europe Bioinsecticides Market
- 7.2.3.7.1 Rest of Europe Bioinsecticides Market by Source
- 7.2.3.7.2 Rest of Europe Bioinsecticides Market by Application
- 7.2.3.1 Russia Bioinsecticides Market
- 7.2.1 Europe Bioinsecticides Market by Source
- 7.3 Asia Pacific Bioinsecticides Market
- 7.3.1 Asia Pacific Bioinsecticides Market by Source
- 7.3.1.1 Asia Pacific Microbials Market by Country
- 7.3.1.2 Asia Pacific Plants Market by Country
- 7.3.1.3 Asia Pacific Others Market by Country
- 7.3.2 Asia Pacific Bioinsecticides Market by Application
- 7.3.2.1 Asia Pacific Cereals & Grains Market by Country
- 7.3.2.2 Asia Pacific Oilseed & Pulses Market by Country
- 7.3.2.3 Asia Pacific Fruits & Vegetables Market by Country
- 7.3.2.4 Asia Pacific Others Market by Country
- 7.3.3 Asia Pacific Bioinsecticides Market by Country
- 7.3.3.1 China Bioinsecticides Market
- 7.3.3.1.1 China Bioinsecticides Market by Source
- 7.3.3.1.2 China Bioinsecticides Market by Application
- 7.3.3.2 India Bioinsecticides Market
- 7.3.3.2.1 India Bioinsecticides Market by Source
- 7.3.3.2.2 India Bioinsecticides Market by Application
- 7.3.3.3 Indonesia Bioinsecticides Market
- 7.3.3.3.1 Indonesia Bioinsecticides Market by Source
- 7.3.3.3.2 Indonesia Bioinsecticides Market by Application
- 7.3.3.4 Australia Bioinsecticides Market
- 7.3.3.4.1 Australia Bioinsecticides Market by Source
- 7.3.3.4.2 Australia Bioinsecticides Market by Application
- 7.3.3.5 South Korea Bioinsecticides Market
- 7.3.3.5.1 South Korea Bioinsecticides Market by Source
- 7.3.3.5.2 South Korea Bioinsecticides Market by Application
- 7.3.3.6 Japan Bioinsecticides Market
- 7.3.3.6.1 Japan Bioinsecticides Market by Source
- 7.3.3.6.2 Japan Bioinsecticides Market by Application
- 7.3.3.7 Rest of Asia Pacific Bioinsecticides Market
- 7.3.3.7.1 Rest of Asia Pacific Bioinsecticides Market by Source
- 7.3.3.7.2 Rest of Asia Pacific Bioinsecticides Market by Application
- 7.3.3.1 China Bioinsecticides Market
- 7.3.1 Asia Pacific Bioinsecticides Market by Source
- 7.4 LAMEA Bioinsecticides Market
- 7.4.1 LAMEA Bioinsecticides Market by Source
- 7.4.1.1 LAMEA Microbials Market by Country
- 7.4.1.2 LAMEA Plants Market by Country
- 7.4.1.3 LAMEA Others Market by Country
- 7.4.2 LAMEA Bioinsecticides Market by Application
- 7.4.2.1 LAMEA Cereals & Grains Market by Country
- 7.4.2.2 LAMEA Oilseed & Pulses Market by Country
- 7.4.2.3 LAMEA Fruits & Vegetables Market by Country
- 7.4.2.4 LAMEA Others Market by Country
- 7.4.3 LAMEA Bioinsecticides Market by Country
- 7.4.3.1 Brazil Bioinsecticides Market
- 7.4.3.1.1 Brazil Bioinsecticides Market by Source
- 7.4.3.1.2 Brazil Bioinsecticides Market by Application
- 7.4.3.2 Argentina Bioinsecticides Market
- 7.4.3.2.1 Argentina Bioinsecticides Market by Source
- 7.4.3.2.2 Argentina Bioinsecticides Market by Application
- 7.4.3.3 Egypt Bioinsecticides Market
- 7.4.3.3.1 Egypt Bioinsecticides Market by Source
- 7.4.3.3.2 Egypt Bioinsecticides Market by Application
- 7.4.3.4 South Africa Bioinsecticides Market
- 7.4.3.4.1 South Africa Bioinsecticides Market by Source
- 7.4.3.4.2 South Africa Bioinsecticides Market by Application
- 7.4.3.5 Morocco Bioinsecticides Market
- 7.4.3.5.1 Morocco Bioinsecticides Market by Source
- 7.4.3.5.2 Morocco Bioinsecticides Market by Application
- 7.4.3.6 Nigeria Bioinsecticides Market
- 7.4.3.6.1 Nigeria Bioinsecticides Market by Source
- 7.4.3.6.2 Nigeria Bioinsecticides Market by Application
- 7.4.3.7 Rest of LAMEA Bioinsecticides Market
- 7.4.3.7.1 Rest of LAMEA Bioinsecticides Market by Source
- 7.4.3.7.2 Rest of LAMEA Bioinsecticides Market by Application
- 7.4.3.1 Brazil Bioinsecticides Market
- 7.4.1 LAMEA Bioinsecticides Market by Source
Chapter 8. Company Profiles
- 8.1 BASF SE
- 8.1.1 Company Overview
- 8.1.2 Financial Analysis
- 8.1.3 Segmental and Regional Analysis
- 8.1.4 Research & Development Expense
- 8.1.5 Recent strategies and developments:
- 8.1.5.1 Product Launches and Product Expansions:
- 8.1.6 SWOT Analysis
- 8.2 Bayer AG
- 8.2.1 Company Overview
- 8.2.2 Financial Analysis
- 8.2.3 Segmental and Regional Analysis
- 8.2.4 Research & Development Expense
- 8.2.5 Recent strategies and developments:
- 8.2.5.1 Partnerships, Collaborations, and Agreements:
- 8.2.5.2 Product Launches and Product Expansions:
- 8.2.6 SWOT Analysis
- 8.3 Certis USA LLC (Mitsui & Co., Ltd.)
- 8.3.1 Company Overview
- 8.3.2 Financial Analysis
- 8.3.3 Segmental and Regional Analysis
- 8.3.4 Recent strategies and developments:
- 8.3.4.1 Partnerships, Collaborations, and Agreements:
- 8.3.4.2 Product Launches and Product Expansions:
- 8.3.5 SWOT Analysis
- 8.4 Novozymes A/S (Novo Holdings A/S)
- 8.4.1 Company Overview
- 8.4.2 Financial Analysis
- 8.4.3 Regional Analysis
- 8.4.4 Research & Development Expense
- 8.4.5 Recent strategies and developments:
- 8.4.5.1 Partnerships, Collaborations, and Agreements:
- 8.4.6 SWOT Analysis
- 8.5 Biobest Group NV
- 8.5.1 Company Overview
- 8.5.2 SWOT Analysis
- 8.6 Syngenta AG Group
- 8.6.1 Company Overview
- 8.6.2 Financial Analysis
- 8.6.3 Segmental and Regional Analysis
- 8.6.4 Research & Development Expenses
- 8.6.5 Recent strategies and developments:
- 8.6.5.1 Partnerships, Collaborations, and Agreements:
- 8.6.5.2 Product Launches and Product Expansions:
- 8.6.5.3 Acquisition and Mergers:
- 8.6.6 SWOT Analysis
- 8.7 Nufarm Ltd.
- 8.7.1 Company Overview
- 8.7.2 Financial Analysis
- 8.7.3 Segmental and Regional Analysis
- 8.7.4 Research & Development Expenses
- 8.7.5 SWOT Analysis
- 8.8 Sumitomo Chemical Co., Ltd.
- 8.8.1 Company Overview
- 8.8.2 Financial Analysis
- 8.8.3 Segmental and Regional Analysis
- 8.8.4 Research & Development Expenses
- 8.8.5 Recent Strategies and developments:
- 8.8.5.1 Acquisition and Mergers:
- 8.8.6 SWOT Analysis
- 8.9 Ginkgo Bioworks Holdings, Inc.
- 8.9.1 Company Overview
- 8.9.2 Financial Analysis
- 8.9.3 Segmental and Regional Analysis
- 8.9.4 Research & Development Expenses
- 8.9.5 Recent strategies and developments:
- 8.9.5.1 Partnerships, Collaborations, and Agreements:
- 8.9.6 SWOT Analysis
- 8.10. Vestaron Corporation
- 8.10.1 Company Overview
