|
|
市場調査レポート
商品コード
1335905
機械学習の世界市場規模、シェア、産業動向分析レポート:企業規模別(大企業、中小企業)、コンポーネント別(サービス、ソフトウェア、ハードウェア)、最終用途別、地域別の展望と予測、2023年~2030年Global Machine Learning Market Size, Share & Industry Trends Analysis Report By Enterprise Size (Large Enterprises, and SMEs), By Component (Services, Software, and Hardware), By End-use, By Regional Outlook and Forecast, 2023 - 2030 |
||||||
|
|
|||||||
|
|||||||


| 機械学習の世界市場規模、シェア、産業動向分析レポート:企業規模別(大企業、中小企業)、コンポーネント別(サービス、ソフトウェア、ハードウェア)、最終用途別、地域別の展望と予測、2023年~2030年 |
|
出版日: 2023年07月31日
発行: KBV Research
ページ情報: 英文 280 Pages
納期: 即納可能
|

- 全表示
- 概要
- 図表
- 目次
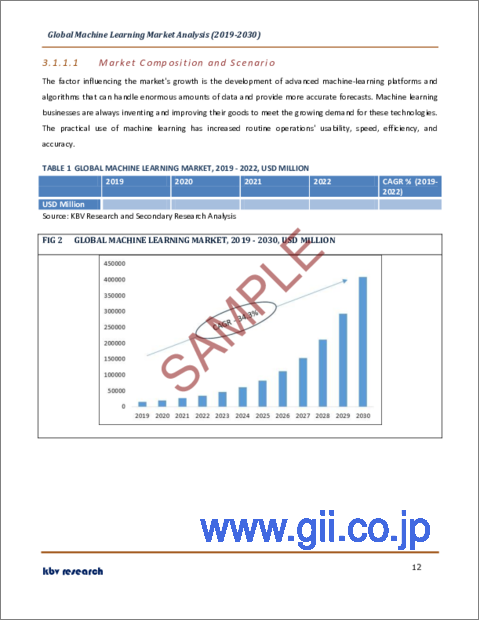
機械学習市場規模は2030年までに4,084億米ドルに達すると予測され、予測期間中のCAGRは36.7%の市場成長率で上昇する見込みです。
KBV Cardinalのマトリックスに掲載された分析によると、Google LLC(Alphabet Inc.)とMicrosoft Corporationが同市場における先駆者です。2022年3月、グーグルはBTとパートナーシップを結び、優れた顧客体験を提供し、コストとリスクを削減し、より多くの収益源を創出し、BTが何百もの新しいビジネス・ユースケースにアクセスできるようにすることで、デジタル・オファリングと超パーソナライズされた顧客エンゲージメントの開発に関する目標を固めました。IBM Corporation、Hewlett-Packard enterprise Company、Intel Corporationなどの企業が、この市場における主要なイノベーターです。
市場成長要因
インテリジェント・オートメーションによるビジネス変革への需要の高まり
意思決定や業務効率を高めるためのデータへの依存度が高まるにつれ、インテリジェントなビジネスプロセスに対するニーズが高まっています。このようなプロセスでは、機械学習アルゴリズムを使用して意思決定を自動化し、企業運営を合理化することで、生産性と利益を向上させます。AutoMLを活用することで、企業はパフォーマンスを向上させ、コストを削減し、プロセスを合理化することができ、競争優位に立つことができます。また、AIを活用した自動化により、生産性が大幅に向上することが実証されています。機械学習モデルの作成と展開を自動化することで、自動化市場は企業がこれらの成果を達成するのを支援することができます。
迅速な意思決定とコスト削減
企業はAutoMLソリューションを採用することで、コストのかかるインフラへの投資や専門人材の雇用にかかる費用を節約することができます。さらに、業務の有効性を高め、意思決定を強化することで、AIソリューションの迅速な開発と導入がコスト削減につながる可能性があります。AutoML技術を採用する企業が増えるにつれ、新たな使用事例やアプリケーションが急増し、イノベーションと市場成長が促進されると思われます。さらに、機械学習の民主化は、企業が提供するサービスを拡大し、新たな市場を開拓するのに役立ち、売上と市場シェアを拡大する可能性があります。
市場抑制要因
法的・倫理的問題
機械学習には、時には機密データや個人情報を含む大量のデータが必要となります。個人や組織は、プライバシーやセキュリティ上の懸念から、ML目的のためにデータを提供することをためらうかもしれないです。機械学習(ML)を利用する際には、業界特有の規則、消費者保護法、差別禁止法など、様々な法律や規制の枠組みを遵守しなければならないです。これらの基準に従わない場合、法的責任、金銭的罰金、イメージダウン、社会的信用の低下などが生じる可能性があります。組織は、ML導入で起こりうる法的問題のために、確信が持てず、警戒心を抱くかもしれないです。これらの要因は、今後数年間の市場拡大を妨げると予想されます。
企業規模の展望
企業規模によって、市場は中小企業と大企業に区分されます。2022年には、大企業セグメントが市場で最大の収益シェアを占める。大企業では、クラウドベースの機械学習プラットフォームとサービスの利用が増加しています。機械学習モデルのトレーニングやデプロイは、クラウドプラットフォームのスケーラブルで手頃なアーキテクチャによって実現可能になっています。Google Cloud AI Platform、Amazon Web Services(AWS)、Microsoft Azure Machine Learningのようなサービスは、事前に構築されたモデル、分散トレーニング機能、インフラ管理を提供するため、機械学習は大企業にとって大きなインフラ支出を必要としないです。
コンポーネントの展望
コンポーネントに基づき、市場はサービス、ソフトウェア、ハードウェアに分けられます。ハードウェア・セグメントは、2022年の市場においてかなりの収益シェアを獲得しました。これは、機械学習用に設計されたギアの人気が高まっていることに関連している可能性があります。AIやMLの機能を備えた特殊なシリコンプロセッサーの開発が、ハードウェアの普及を後押ししています。SambaNova Systemsのような企業によって、より強力な処理装置が生み出されるにつれて、市場は拡大し続けると予測されます。
エンドユーザー別展望
エンドユーザー別では、ヘルスケア、BFSI、小売、広告・メディア、自動車・運輸、農業、製造、その他に分類されます。2022年には、広告・メディア分野が最大の収益シェアで市場を独占しました。主要動向のひとつはハイパー・パーソナライゼーションで、機械学習アルゴリズムが膨大なユーザーデータを調査し、関連性の高い個別の広告を作成することで、エンゲージメントとコンバージョン率を高めています。現在、広告詐欺を特定するために機械学習を採用することにかなりの重点が置かれています。
地域別展望
地域別に見ると、市場は北米、欧州、アジア太平洋、LAMEAで分析されます。2022年には、北米地域が最大の収益シェアで市場をリードしました。北米では、機械学習の社会的影響力の拡大により、道徳的なAIや責任あるAIの実践に注目が集まっています。機械学習モデルやアルゴリズムを開発する際、組織では公正さ、説明責任、公開性が優先されます。バイアスは軽減され、プライバシーは保護され、AIの応用に関する倫理的な問題に取り組んでいます。この分野における機械学習の適切な利用を監督するために、法的枠組み、規則、基準が作られつつあります。
目次
第1章 市場範囲と調査手法
- 市場の定義
- 目的
- 市場範囲
- セグメンテーション
- 調査手法
第2章 市場の概要
- 主なハイライト
第3章 市場概要
- イントロダクション
- 概要
- 市場構成とシナリオ
- 概要
- 市場に影響を与える主な要因
- 市場促進要因
- 市場抑制要因
第4章 競合分析- 世界
- KBVカーディナルマトリックス
- 最近の業界全体の戦略的展開
- パートナーシップ、コラボレーション、および契約
- 製品の発売と製品の拡大
- 買収と合併
- 市場シェア分析2021
- 主要成功戦略
- 主な戦略
- 主要な戦略的動き
- ポーターのファイブフォース分析
第5章 世界の機械学習市場:企業規模別
- 世界の大企業市場:地域別
- 世界の中小企業市場:地域別
第6章 世界の機械学習市場:コンポーネント別
- 世界サービス市場:地域別
- 世界のソフトウェア市場:地域別
- 世界のハードウェア市場:地域別
第7章 世界の機械学習市場:最終用途別
- 世界の広告およびメディア市場:地域別
- 世界のBFSI市場:地域別
- 世界の自動車および輸送市場:地域別
- 世界の製造業市場:地域別
- 世界の農業市場:地域別
- 世界の小売市場:地域別
- 世界のヘルスケア市場:地域別
- 世界のその他の市場:地域別
第8章 世界の機械学習市場:地域別
- 北米
- 北米の市場:国別
- 米国
- カナダ
- メキシコ
- その他北米地域
- 北米の市場:国別
- 欧州
- 欧州の市場:国別
- ドイツ
- 英国
- フランス
- ロシア
- スペイン
- イタリア
- その他欧州地域
- 欧州の市場:国別
- アジア太平洋
- アジア太平洋の市場:国別
- 中国
- 日本
- インド
- 韓国
- シンガポール
- マレーシア
- その他アジア太平洋地域
- アジア太平洋の市場:国別
- ラテンアメリカ・中東・アフリカ
- ラテンアメリカ・中東・アフリカの市場:国別
- ブラジル
- アルゼンチン
- アラブ首長国連邦
- サウジアラビア
- 南アフリカ
- ナイジェリア
- その他ラテンアメリカ・中東・アフリカ地域
- ラテンアメリカ・中東・アフリカの市場:国別
第9章 企業プロファイル
- Amazon Web Services, Inc(Amazon.com, Inc.)
- Baidu, Inc
- Google LLC(Alphabet Inc)
- H2Oai, Inc.
- Hewlett Packard Enterprise Company(HP Development Company LP.)
- Intel Corporation
- IBM Corporation
- Microsoft Corporation
- SAS Institute, Inc
- SAP SE
第10章 機械学習市場での勝利は必須
LIST OF TABLES
- TABLE 1 Global Machine Learning Market, 2019 - 2022, USD Million
- TABLE 2 Global Machine Learning Market, 2023 - 2030, USD Million
- TABLE 3 Partnerships, Collaborations and Agreements- Machine Learning Market
- TABLE 4 Product Launches And Product Expansions- Machine Learning Market
- TABLE 5 Acquisition and Mergers- Machine Learning Market
- TABLE 6 Global Machine Learning Market by Enterprise Size, 2019 - 2022, USD Million
- TABLE 7 Global Machine Learning Market by Enterprise Size, 2023 - 2030, USD Million
- TABLE 8 Global Large Enterprises Market by Region, 2019 - 2022, USD Million
- TABLE 9 Global Large Enterprises Market by Region, 2023 - 2030, USD Million
- TABLE 10 Global SMEs Market by Region, 2019 - 2022, USD Million
- TABLE 11 Global SMEs Market by Region, 2023 - 2030, USD Million
- TABLE 12 Global Machine Learning Market by Component, 2019 - 2022, USD Million
- TABLE 13 Global Machine Learning Market by Component, 2023 - 2030, USD Million
- TABLE 14 Global Services Market by Region, 2019 - 2022, USD Million
- TABLE 15 Global Services Market by Region, 2023 - 2030, USD Million
- TABLE 16 Global Software Market by Region, 2019 - 2022, USD Million
- TABLE 17 Global Software Market by Region, 2023 - 2030, USD Million
- TABLE 18 Global Hardware Market by Region, 2019 - 2022, USD Million
- TABLE 19 Global Hardware Market by Region, 2023 - 2030, USD Million
- TABLE 20 Global Machine Learning Market by End-use, 2019 - 2022, USD Million
- TABLE 21 Global Machine Learning Market by End-use, 2023 - 2030, USD Million
- TABLE 22 Global Advertising & Media Market by Region, 2019 - 2022, USD Million
- TABLE 23 Global Advertising & Media Market by Region, 2023 - 2030, USD Million
- TABLE 24 Global BFSI Market by Region, 2019 - 2022, USD Million
- TABLE 25 Global BFSI Market by Region, 2023 - 2030, USD Million
- TABLE 26 Global Automotive & Transportation Market by Region, 2019 - 2022, USD Million
- TABLE 27 Global Automotive & Transportation Market by Region, 2023 - 2030, USD Million
- TABLE 28 Global Manufacturing Market by Region, 2019 - 2022, USD Million
- TABLE 29 Global Manufacturing Market by Region, 2023 - 2030, USD Million
- TABLE 30 Global Agriculture Market by Region, 2019 - 2022, USD Million
- TABLE 31 Global Agriculture Market by Region, 2023 - 2030, USD Million
- TABLE 32 Global Retail Market by Region, 2019 - 2022, USD Million
- TABLE 33 Global Retail Market by Region, 2023 - 2030, USD Million
- TABLE 34 Global Healthcare Market by Region, 2019 - 2022, USD Million
- TABLE 35 Global Healthcare Market by Region, 2023 - 2030, USD Million
- TABLE 36 Global Others Market by Region, 2019 - 2022, USD Million
- TABLE 37 Global Others Market by Region, 2023 - 2030, USD Million
- TABLE 38 Global Machine Learning Market by Region, 2019 - 2022, USD Million
- TABLE 39 Global Machine Learning Market by Region, 2023 - 2030, USD Million
- TABLE 40 North America Machine Learning Market, 2019 - 2022, USD Million
- TABLE 41 North America Machine Learning Market, 2023 - 2030, USD Million
- TABLE 42 North America Machine Learning Market by Enterprise Size, 2019 - 2022, USD Million
- TABLE 43 North America Machine Learning Market by Enterprise Size, 2023 - 2030, USD Million
- TABLE 44 North America Large Enterprises Market by Country, 2019 - 2022, USD Million
- TABLE 45 North America Large Enterprises Market by Country, 2023 - 2030, USD Million
- TABLE 46 North America SMEs Market by Country, 2019 - 2022, USD Million
- TABLE 47 North America SMEs Market by Country, 2023 - 2030, USD Million
- TABLE 48 North America Machine Learning Market by Component, 2019 - 2022, USD Million
- TABLE 49 North America Machine Learning Market by Component, 2023 - 2030, USD Million
- TABLE 50 North America Services Market by Country, 2019 - 2022, USD Million
- TABLE 51 North America Services Market by Country, 2023 - 2030, USD Million
- TABLE 52 North America Software Market by Country, 2019 - 2022, USD Million
- TABLE 53 North America Software Market by Country, 2023 - 2030, USD Million
- TABLE 54 North America Hardware Market by Country, 2019 - 2022, USD Million
- TABLE 55 North America Hardware Market by Country, 2023 - 2030, USD Million
- TABLE 56 North America Machine Learning Market by End-use, 2019 - 2022, USD Million
- TABLE 57 North America Machine Learning Market by End-use, 2023 - 2030, USD Million
- TABLE 58 North America Advertising & Media Market by Country, 2019 - 2022, USD Million
- TABLE 59 North America Advertising & Media Market by Country, 2023 - 2030, USD Million
- TABLE 60 North America BFSI Market by Country, 2019 - 2022, USD Million
- TABLE 61 North America BFSI Market by Country, 2023 - 2030, USD Million
- TABLE 62 North America Automotive & Transportation Market by Country, 2019 - 2022, USD Million
- TABLE 63 North America Automotive & Transportation Market by Country, 2023 - 2030, USD Million
- TABLE 64 North America Manufacturing Market by Country, 2019 - 2022, USD Million
- TABLE 65 North America Manufacturing Market by Country, 2023 - 2030, USD Million
- TABLE 66 North America Agriculture Market by Country, 2019 - 2022, USD Million
- TABLE 67 North America Agriculture Market by Country, 2023 - 2030, USD Million
- TABLE 68 North America Retail Market by Country, 2019 - 2022, USD Million
- TABLE 69 North America Retail Market by Country, 2023 - 2030, USD Million
- TABLE 70 North America Healthcare Market by Country, 2019 - 2022, USD Million
- TABLE 71 North America Healthcare Market by Country, 2023 - 2030, USD Million
- TABLE 72 North America Others Market by Country, 2019 - 2022, USD Million
- TABLE 73 North America Others Market by Country, 2023 - 2030, USD Million
- TABLE 74 North America Machine Learning Market by Country, 2019 - 2022, USD Million
- TABLE 75 North America Machine Learning Market by Country, 2023 - 2030, USD Million
- TABLE 76 US Machine Learning Market, 2019 - 2022, USD Million
- TABLE 77 US Machine Learning Market, 2023 - 2030, USD Million
- TABLE 78 US Machine Learning Market by Enterprise Size, 2019 - 2022, USD Million
- TABLE 79 US Machine Learning Market by Enterprise Size, 2023 - 2030, USD Million
- TABLE 80 US Machine Learning Market by Component, 2019 - 2022, USD Million
- TABLE 81 US Machine Learning Market by Component, 2023 - 2030, USD Million
- TABLE 82 US Machine Learning Market by End-use, 2019 - 2022, USD Million
- TABLE 83 US Machine Learning Market by End-use, 2023 - 2030, USD Million
- TABLE 84 Canada Machine Learning Market, 2019 - 2022, USD Million
- TABLE 85 Canada Machine Learning Market, 2023 - 2030, USD Million
- TABLE 86 Canada Machine Learning Market by Enterprise Size, 2019 - 2022, USD Million
- TABLE 87 Canada Machine Learning Market by Enterprise Size, 2023 - 2030, USD Million
- TABLE 88 Canada Machine Learning Market by Component, 2019 - 2022, USD Million
- TABLE 89 Canada Machine Learning Market by Component, 2023 - 2030, USD Million
- TABLE 90 Canada Machine Learning Market by End-use, 2019 - 2022, USD Million
- TABLE 91 Canada Machine Learning Market by End-use, 2023 - 2030, USD Million
- TABLE 92 Mexico Machine Learning Market, 2019 - 2022, USD Million
- TABLE 93 Mexico Machine Learning Market, 2023 - 2030, USD Million
- TABLE 94 Mexico Machine Learning Market by Enterprise Size, 2019 - 2022, USD Million
- TABLE 95 Mexico Machine Learning Market by Enterprise Size, 2023 - 2030, USD Million
- TABLE 96 Mexico Machine Learning Market by Component, 2019 - 2022, USD Million
- TABLE 97 Mexico Machine Learning Market by Component, 2023 - 2030, USD Million
- TABLE 98 Mexico Machine Learning Market by End-use, 2019 - 2022, USD Million
- TABLE 99 Mexico Machine Learning Market by End-use, 2023 - 2030, USD Million
- TABLE 100 Rest of North America Machine Learning Market, 2019 - 2022, USD Million
- TABLE 101 Rest of North America Machine Learning Market, 2023 - 2030, USD Million
- TABLE 102 Rest of North America Machine Learning Market by Enterprise Size, 2019 - 2022, USD Million
- TABLE 103 Rest of North America Machine Learning Market by Enterprise Size, 2023 - 2030, USD Million
- TABLE 104 Rest of North America Machine Learning Market by Component, 2019 - 2022, USD Million
- TABLE 105 Rest of North America Machine Learning Market by Component, 2023 - 2030, USD Million
- TABLE 106 Rest of North America Machine Learning Market by End-use, 2019 - 2022, USD Million
- TABLE 107 Rest of North America Machine Learning Market by End-use, 2023 - 2030, USD Million
- TABLE 108 Europe Machine Learning Market, 2019 - 2022, USD Million
- TABLE 109 Europe Machine Learning Market, 2023 - 2030, USD Million
- TABLE 110 Europe Machine Learning Market by Enterprise Size, 2019 - 2022, USD Million
- TABLE 111 Europe Machine Learning Market by Enterprise Size, 2023 - 2030, USD Million
- TABLE 112 Europe Large Enterprises Market by Country, 2019 - 2022, USD Million
- TABLE 113 Europe Large Enterprises Market by Country, 2023 - 2030, USD Million
- TABLE 114 Europe SMEs Market by Country, 2019 - 2022, USD Million
- TABLE 115 Europe SMEs Market by Country, 2023 - 2030, USD Million
- TABLE 116 Europe Machine Learning Market by Component, 2019 - 2022, USD Million
- TABLE 117 Europe Machine Learning Market by Component, 2023 - 2030, USD Million
- TABLE 118 Europe Services Market by Country, 2019 - 2022, USD Million
- TABLE 119 Europe Services Market by Country, 2023 - 2030, USD Million
- TABLE 120 Europe Software Market by Country, 2019 - 2022, USD Million
- TABLE 121 Europe Software Market by Country, 2023 - 2030, USD Million
- TABLE 122 Europe Hardware Market by Country, 2019 - 2022, USD Million
- TABLE 123 Europe Hardware Market by Country, 2023 - 2030, USD Million
- TABLE 124 Europe Machine Learning Market by End-use, 2019 - 2022, USD Million
- TABLE 125 Europe Machine Learning Market by End-use, 2023 - 2030, USD Million
- TABLE 126 Europe Advertising & Media Market by Country, 2019 - 2022, USD Million
- TABLE 127 Europe Advertising & Media Market by Country, 2023 - 2030, USD Million
- TABLE 128 Europe BFSI Market by Country, 2019 - 2022, USD Million
- TABLE 129 Europe BFSI Market by Country, 2023 - 2030, USD Million
- TABLE 130 Europe Automotive & Transportation Market by Country, 2019 - 2022, USD Million
- TABLE 131 Europe Automotive & Transportation Market by Country, 2023 - 2030, USD Million
- TABLE 132 Europe Manufacturing Market by Country, 2019 - 2022, USD Million
- TABLE 133 Europe Manufacturing Market by Country, 2023 - 2030, USD Million
- TABLE 134 Europe Agriculture Market by Country, 2019 - 2022, USD Million
- TABLE 135 Europe Agriculture Market by Country, 2023 - 2030, USD Million
- TABLE 136 Europe Retail Market by Country, 2019 - 2022, USD Million
- TABLE 137 Europe Retail Market by Country, 2023 - 2030, USD Million
- TABLE 138 Europe Healthcare Market by Country, 2019 - 2022, USD Million
- TABLE 139 Europe Healthcare Market by Country, 2023 - 2030, USD Million
- TABLE 140 Europe Others Market by Country, 2019 - 2022, USD Million
- TABLE 141 Europe Others Market by Country, 2023 - 2030, USD Million
- TABLE 142 Europe Machine Learning Market by Country, 2019 - 2022, USD Million
- TABLE 143 Europe Machine Learning Market by Country, 2023 - 2030, USD Million
- TABLE 144 Germany Machine Learning Market, 2019 - 2022, USD Million
- TABLE 145 Germany Machine Learning Market, 2023 - 2030, USD Million
- TABLE 146 Germany Machine Learning Market by Enterprise Size, 2019 - 2022, USD Million
- TABLE 147 Germany Machine Learning Market by Enterprise Size, 2023 - 2030, USD Million
- TABLE 148 Germany Machine Learning Market by Component, 2019 - 2022, USD Million
- TABLE 149 Germany Machine Learning Market by Component, 2023 - 2030, USD Million
- TABLE 150 Germany Machine Learning Market by End-use, 2019 - 2022, USD Million
- TABLE 151 Germany Machine Learning Market by End-use, 2023 - 2030, USD Million
- TABLE 152 UK Machine Learning Market, 2019 - 2022, USD Million
- TABLE 153 UK Machine Learning Market, 2023 - 2030, USD Million
- TABLE 154 UK Machine Learning Market by Enterprise Size, 2019 - 2022, USD Million
- TABLE 155 UK Machine Learning Market by Enterprise Size, 2023 - 2030, USD Million
- TABLE 156 UK Machine Learning Market by Component, 2019 - 2022, USD Million
- TABLE 157 UK Machine Learning Market by Component, 2023 - 2030, USD Million
- TABLE 158 UK Machine Learning Market by End-use, 2019 - 2022, USD Million
- TABLE 159 UK Machine Learning Market by End-use, 2023 - 2030, USD Million
- TABLE 160 France Machine Learning Market, 2019 - 2022, USD Million
- TABLE 161 France Machine Learning Market, 2023 - 2030, USD Million
- TABLE 162 France Machine Learning Market by Enterprise Size, 2019 - 2022, USD Million
- TABLE 163 France Machine Learning Market by Enterprise Size, 2023 - 2030, USD Million
- TABLE 164 France Machine Learning Market by Component, 2019 - 2022, USD Million
- TABLE 165 France Machine Learning Market by Component, 2023 - 2030, USD Million
- TABLE 166 France Machine Learning Market by End-use, 2019 - 2022, USD Million
- TABLE 167 France Machine Learning Market by End-use, 2023 - 2030, USD Million
- TABLE 168 Russia Machine Learning Market, 2019 - 2022, USD Million
- TABLE 169 Russia Machine Learning Market, 2023 - 2030, USD Million
- TABLE 170 Russia Machine Learning Market by Enterprise Size, 2019 - 2022, USD Million
- TABLE 171 Russia Machine Learning Market by Enterprise Size, 2023 - 2030, USD Million
- TABLE 172 Russia Machine Learning Market by Component, 2019 - 2022, USD Million
- TABLE 173 Russia Machine Learning Market by Component, 2023 - 2030, USD Million
- TABLE 174 Russia Machine Learning Market by End-use, 2019 - 2022, USD Million
- TABLE 175 Russia Machine Learning Market by End-use, 2023 - 2030, USD Million
- TABLE 176 Spain Machine Learning Market, 2019 - 2022, USD Million
- TABLE 177 Spain Machine Learning Market, 2023 - 2030, USD Million
- TABLE 178 Spain Machine Learning Market by Enterprise Size, 2019 - 2022, USD Million
- TABLE 179 Spain Machine Learning Market by Enterprise Size, 2023 - 2030, USD Million
- TABLE 180 Spain Machine Learning Market by Component, 2019 - 2022, USD Million
- TABLE 181 Spain Machine Learning Market by Component, 2023 - 2030, USD Million
- TABLE 182 Spain Machine Learning Market by End-use, 2019 - 2022, USD Million
- TABLE 183 Spain Machine Learning Market by End-use, 2023 - 2030, USD Million
- TABLE 184 Italy Machine Learning Market, 2019 - 2022, USD Million
- TABLE 185 Italy Machine Learning Market, 2023 - 2030, USD Million
- TABLE 186 Italy Machine Learning Market by Enterprise Size, 2019 - 2022, USD Million
- TABLE 187 Italy Machine Learning Market by Enterprise Size, 2023 - 2030, USD Million
- TABLE 188 Italy Machine Learning Market by Component, 2019 - 2022, USD Million
- TABLE 189 Italy Machine Learning Market by Component, 2023 - 2030, USD Million
- TABLE 190 Italy Machine Learning Market by End-use, 2019 - 2022, USD Million
- TABLE 191 Italy Machine Learning Market by End-use, 2023 - 2030, USD Million
- TABLE 192 Rest of Europe Machine Learning Market, 2019 - 2022, USD Million
- TABLE 193 Rest of Europe Machine Learning Market, 2023 - 2030, USD Million
- TABLE 194 Rest of Europe Machine Learning Market by Enterprise Size, 2019 - 2022, USD Million
- TABLE 195 Rest of Europe Machine Learning Market by Enterprise Size, 2023 - 2030, USD Million
- TABLE 196 Rest of Europe Machine Learning Market by Component, 2019 - 2022, USD Million
- TABLE 197 Rest of Europe Machine Learning Market by Component, 2023 - 2030, USD Million
- TABLE 198 Rest of Europe Machine Learning Market by End-use, 2019 - 2022, USD Million
- TABLE 199 Rest of Europe Machine Learning Market by End-use, 2023 - 2030, USD Million
- TABLE 200 Asia Pacific Machine Learning Market, 2019 - 2022, USD Million
- TABLE 201 Asia Pacific Machine Learning Market, 2023 - 2030, USD Million
- TABLE 202 Asia Pacific Machine Learning Market by Enterprise Size, 2019 - 2022, USD Million
- TABLE 203 Asia Pacific Machine Learning Market by Enterprise Size, 2023 - 2030, USD Million
- TABLE 204 Asia Pacific Large Enterprises Market by Country, 2019 - 2022, USD Million
- TABLE 205 Asia Pacific Large Enterprises Market by Country, 2023 - 2030, USD Million
- TABLE 206 Asia Pacific SMEs Market by Country, 2019 - 2022, USD Million
- TABLE 207 Asia Pacific SMEs Market by Country, 2023 - 2030, USD Million
- TABLE 208 Asia Pacific Machine Learning Market by Component, 2019 - 2022, USD Million
- TABLE 209 Asia Pacific Machine Learning Market by Component, 2023 - 2030, USD Million
- TABLE 210 Asia Pacific Services Market by Country, 2019 - 2022, USD Million
- TABLE 211 Asia Pacific Services Market by Country, 2023 - 2030, USD Million
- TABLE 212 Asia Pacific Software Market by Country, 2019 - 2022, USD Million
- TABLE 213 Asia Pacific Software Market by Country, 2023 - 2030, USD Million
- TABLE 214 Asia Pacific Hardware Market by Country, 2019 - 2022, USD Million
- TABLE 215 Asia Pacific Hardware Market by Country, 2023 - 2030, USD Million
- TABLE 216 Asia Pacific Machine Learning Market by End-use, 2019 - 2022, USD Million
- TABLE 217 Asia Pacific Machine Learning Market by End-use, 2023 - 2030, USD Million
- TABLE 218 Asia Pacific Advertising & Media Market by Country, 2019 - 2022, USD Million
- TABLE 219 Asia Pacific Advertising & Media Market by Country, 2023 - 2030, USD Million
- TABLE 220 Asia Pacific BFSI Market by Country, 2019 - 2022, USD Million
- TABLE 221 Asia Pacific BFSI Market by Country, 2023 - 2030, USD Million
- TABLE 222 Asia Pacific Automotive & Transportation Market by Country, 2019 - 2022, USD Million
- TABLE 223 Asia Pacific Automotive & Transportation Market by Country, 2023 - 2030, USD Million
- TABLE 224 Asia Pacific Manufacturing Market by Country, 2019 - 2022, USD Million
- TABLE 225 Asia Pacific Manufacturing Market by Country, 2023 - 2030, USD Million
- TABLE 226 Asia Pacific Agriculture Market by Country, 2019 - 2022, USD Million
- TABLE 227 Asia Pacific Agriculture Market by Country, 2023 - 2030, USD Million
- TABLE 228 Asia Pacific Retail Market by Country, 2019 - 2022, USD Million
- TABLE 229 Asia Pacific Retail Market by Country, 2023 - 2030, USD Million
- TABLE 230 Asia Pacific Healthcare Market by Country, 2019 - 2022, USD Million
- TABLE 231 Asia Pacific Healthcare Market by Country, 2023 - 2030, USD Million
- TABLE 232 Asia Pacific Others Market by Country, 2019 - 2022, USD Million
- TABLE 233 Asia Pacific Others Market by Country, 2023 - 2030, USD Million
- TABLE 234 Asia Pacific Machine Learning Market by Country, 2019 - 2022, USD Million
- TABLE 235 Asia Pacific Machine Learning Market by Country, 2023 - 2030, USD Million
- TABLE 236 China Machine Learning Market, 2019 - 2022, USD Million
- TABLE 237 China Machine Learning Market, 2023 - 2030, USD Million
- TABLE 238 China Machine Learning Market by Enterprise Size, 2019 - 2022, USD Million
- TABLE 239 China Machine Learning Market by Enterprise Size, 2023 - 2030, USD Million
- TABLE 240 China Machine Learning Market by Component, 2019 - 2022, USD Million
- TABLE 241 China Machine Learning Market by Component, 2023 - 2030, USD Million
- TABLE 242 China Machine Learning Market by End-use, 2019 - 2022, USD Million
- TABLE 243 China Machine Learning Market by End-use, 2023 - 2030, USD Million
- TABLE 244 Japan Machine Learning Market, 2019 - 2022, USD Million
- TABLE 245 Japan Machine Learning Market, 2023 - 2030, USD Million
- TABLE 246 Japan Machine Learning Market by Enterprise Size, 2019 - 2022, USD Million
- TABLE 247 Japan Machine Learning Market by Enterprise Size, 2023 - 2030, USD Million
- TABLE 248 Japan Machine Learning Market by Component, 2019 - 2022, USD Million
- TABLE 249 Japan Machine Learning Market by Component, 2023 - 2030, USD Million
- TABLE 250 Japan Machine Learning Market by End-use, 2019 - 2022, USD Million
- TABLE 251 Japan Machine Learning Market by End-use, 2023 - 2030, USD Million
- TABLE 252 India Machine Learning Market, 2019 - 2022, USD Million
- TABLE 253 India Machine Learning Market, 2023 - 2030, USD Million
- TABLE 254 India Machine Learning Market by Enterprise Size, 2019 - 2022, USD Million
- TABLE 255 India Machine Learning Market by Enterprise Size, 2023 - 2030, USD Million
- TABLE 256 India Machine Learning Market by Component, 2019 - 2022, USD Million
- TABLE 257 India Machine Learning Market by Component, 2023 - 2030, USD Million
- TABLE 258 India Machine Learning Market by End-use, 2019 - 2022, USD Million
- TABLE 259 India Machine Learning Market by End-use, 2023 - 2030, USD Million
- TABLE 260 South Korea Machine Learning Market, 2019 - 2022, USD Million
- TABLE 261 South Korea Machine Learning Market, 2023 - 2030, USD Million
- TABLE 262 South Korea Machine Learning Market by Enterprise Size, 2019 - 2022, USD Million
- TABLE 263 South Korea Machine Learning Market by Enterprise Size, 2023 - 2030, USD Million
- TABLE 264 South Korea Machine Learning Market by Component, 2019 - 2022, USD Million
- TABLE 265 South Korea Machine Learning Market by Component, 2023 - 2030, USD Million
- TABLE 266 South Korea Machine Learning Market by End-use, 2019 - 2022, USD Million
- TABLE 267 South Korea Machine Learning Market by End-use, 2023 - 2030, USD Million
- TABLE 268 Singapore Machine Learning Market, 2019 - 2022, USD Million
- TABLE 269 Singapore Machine Learning Market, 2023 - 2030, USD Million
- TABLE 270 Singapore Machine Learning Market by Enterprise Size, 2019 - 2022, USD Million
- TABLE 271 Singapore Machine Learning Market by Enterprise Size, 2023 - 2030, USD Million
- TABLE 272 Singapore Machine Learning Market by Component, 2019 - 2022, USD Million
- TABLE 273 Singapore Machine Learning Market by Component, 2023 - 2030, USD Million
- TABLE 274 Singapore Machine Learning Market by End-use, 2019 - 2022, USD Million
- TABLE 275 Singapore Machine Learning Market by End-use, 2023 - 2030, USD Million
- TABLE 276 Malaysia Machine Learning Market, 2019 - 2022, USD Million
- TABLE 277 Malaysia Machine Learning Market, 2023 - 2030, USD Million
- TABLE 278 Malaysia Machine Learning Market by Enterprise Size, 2019 - 2022, USD Million
- TABLE 279 Malaysia Machine Learning Market by Enterprise Size, 2023 - 2030, USD Million
- TABLE 280 Malaysia Machine Learning Market by Component, 2019 - 2022, USD Million
- TABLE 281 Malaysia Machine Learning Market by Component, 2023 - 2030, USD Million
- TABLE 282 Malaysia Machine Learning Market by End-use, 2019 - 2022, USD Million
- TABLE 283 Malaysia Machine Learning Market by End-use, 2023 - 2030, USD Million
- TABLE 284 Rest of Asia Pacific Machine Learning Market, 2019 - 2022, USD Million
- TABLE 285 Rest of Asia Pacific Machine Learning Market, 2023 - 2030, USD Million
- TABLE 286 Rest of Asia Pacific Machine Learning Market by Enterprise Size, 2019 - 2022, USD Million
- TABLE 287 Rest of Asia Pacific Machine Learning Market by Enterprise Size, 2023 - 2030, USD Million
- TABLE 288 Rest of Asia Pacific Machine Learning Market by Component, 2019 - 2022, USD Million
- TABLE 289 Rest of Asia Pacific Machine Learning Market by Component, 2023 - 2030, USD Million
- TABLE 290 Rest of Asia Pacific Machine Learning Market by End-use, 2019 - 2022, USD Million
- TABLE 291 Rest of Asia Pacific Machine Learning Market by End-use, 2023 - 2030, USD Million
- TABLE 292 LAMEA Machine Learning Market, 2019 - 2022, USD Million
- TABLE 293 LAMEA Machine Learning Market, 2023 - 2030, USD Million
- TABLE 294 LAMEA Machine Learning Market by Enterprise Size, 2019 - 2022, USD Million
- TABLE 295 LAMEA Machine Learning Market by Enterprise Size, 2023 - 2030, USD Million
- TABLE 296 LAMEA Large Enterprises Market by Country, 2019 - 2022, USD Million
- TABLE 297 LAMEA Large Enterprises Market by Country, 2023 - 2030, USD Million
- TABLE 298 LAMEA SMEs Market by Country, 2019 - 2022, USD Million
- TABLE 299 LAMEA SMEs Market by Country, 2023 - 2030, USD Million
- TABLE 300 LAMEA Machine Learning Market by Component, 2019 - 2022, USD Million
- TABLE 301 LAMEA Machine Learning Market by Component, 2023 - 2030, USD Million
- TABLE 302 LAMEA Services Market by Country, 2019 - 2022, USD Million
- TABLE 303 LAMEA Services Market by Country, 2023 - 2030, USD Million
- TABLE 304 LAMEA Software Market by Country, 2019 - 2022, USD Million
- TABLE 305 LAMEA Software Market by Country, 2023 - 2030, USD Million
- TABLE 306 LAMEA Hardware Market by Country, 2019 - 2022, USD Million
- TABLE 307 LAMEA Hardware Market by Country, 2023 - 2030, USD Million
- TABLE 308 LAMEA Machine Learning Market by End-use, 2019 - 2022, USD Million
- TABLE 309 LAMEA Machine Learning Market by End-use, 2023 - 2030, USD Million
- TABLE 310 LAMEA Advertising & Media Market by Country, 2019 - 2022, USD Million
- TABLE 311 LAMEA Advertising & Media Market by Country, 2023 - 2030, USD Million
- TABLE 312 LAMEA BFSI Market by Country, 2019 - 2022, USD Million
- TABLE 313 LAMEA BFSI Market by Country, 2023 - 2030, USD Million
- TABLE 314 LAMEA Automotive & Transportation Market by Country, 2019 - 2022, USD Million
- TABLE 315 LAMEA Automotive & Transportation Market by Country, 2023 - 2030, USD Million
- TABLE 316 LAMEA Manufacturing Market by Country, 2019 - 2022, USD Million
- TABLE 317 LAMEA Manufacturing Market by Country, 2023 - 2030, USD Million
- TABLE 318 LAMEA Agriculture Market by Country, 2019 - 2022, USD Million
- TABLE 319 LAMEA Agriculture Market by Country, 2023 - 2030, USD Million
- TABLE 320 LAMEA Retail Market by Country, 2019 - 2022, USD Million
- TABLE 321 LAMEA Retail Market by Country, 2023 - 2030, USD Million
- TABLE 322 LAMEA Healthcare Market by Country, 2019 - 2022, USD Million
- TABLE 323 LAMEA Healthcare Market by Country, 2023 - 2030, USD Million
- TABLE 324 LAMEA Others Market by Country, 2019 - 2022, USD Million
- TABLE 325 LAMEA Others Market by Country, 2023 - 2030, USD Million
- TABLE 326 LAMEA Machine Learning Market by Country, 2019 - 2022, USD Million
- TABLE 327 LAMEA Machine Learning Market by Country, 2023 - 2030, USD Million
- TABLE 328 Brazil Machine Learning Market, 2019 - 2022, USD Million
- TABLE 329 Brazil Machine Learning Market, 2023 - 2030, USD Million
- TABLE 330 Brazil Machine Learning Market by Enterprise Size, 2019 - 2022, USD Million
- TABLE 331 Brazil Machine Learning Market by Enterprise Size, 2023 - 2030, USD Million
- TABLE 332 Brazil Machine Learning Market by Component, 2019 - 2022, USD Million
- TABLE 333 Brazil Machine Learning Market by Component, 2023 - 2030, USD Million
- TABLE 334 Brazil Machine Learning Market by End-use, 2019 - 2022, USD Million
- TABLE 335 Brazil Machine Learning Market by End-use, 2023 - 2030, USD Million
- TABLE 336 Argentina Machine Learning Market, 2019 - 2022, USD Million
- TABLE 337 Argentina Machine Learning Market, 2023 - 2030, USD Million
- TABLE 338 Argentina Machine Learning Market by Enterprise Size, 2019 - 2022, USD Million
- TABLE 339 Argentina Machine Learning Market by Enterprise Size, 2023 - 2030, USD Million
- TABLE 340 Argentina Machine Learning Market by Component, 2019 - 2022, USD Million
- TABLE 341 Argentina Machine Learning Market by Component, 2023 - 2030, USD Million
- TABLE 342 Argentina Machine Learning Market by End-use, 2019 - 2022, USD Million
- TABLE 343 Argentina Machine Learning Market by End-use, 2023 - 2030, USD Million
- TABLE 344 UAE Machine Learning Market, 2019 - 2022, USD Million
- TABLE 345 UAE Machine Learning Market, 2023 - 2030, USD Million
- TABLE 346 UAE Machine Learning Market by Enterprise Size, 2019 - 2022, USD Million
- TABLE 347 UAE Machine Learning Market by Enterprise Size, 2023 - 2030, USD Million
- TABLE 348 UAE Machine Learning Market by Component, 2019 - 2022, USD Million
- TABLE 349 UAE Machine Learning Market by Component, 2023 - 2030, USD Million
- TABLE 350 UAE Machine Learning Market by End-use, 2019 - 2022, USD Million
- TABLE 351 UAE Machine Learning Market by End-use, 2023 - 2030, USD Million
- TABLE 352 Saudi Arabia Machine Learning Market, 2019 - 2022, USD Million
- TABLE 353 Saudi Arabia Machine Learning Market, 2023 - 2030, USD Million
- TABLE 354 Saudi Arabia Machine Learning Market by Enterprise Size, 2019 - 2022, USD Million
- TABLE 355 Saudi Arabia Machine Learning Market by Enterprise Size, 2023 - 2030, USD Million
- TABLE 356 Saudi Arabia Machine Learning Market by Component, 2019 - 2022, USD Million
- TABLE 357 Saudi Arabia Machine Learning Market by Component, 2023 - 2030, USD Million
- TABLE 358 Saudi Arabia Machine Learning Market by End-use, 2019 - 2022, USD Million
- TABLE 359 Saudi Arabia Machine Learning Market by End-use, 2023 - 2030, USD Million
- TABLE 360 South Africa Machine Learning Market, 2019 - 2022, USD Million
- TABLE 361 South Africa Machine Learning Market, 2023 - 2030, USD Million
- TABLE 362 South Africa Machine Learning Market by Enterprise Size, 2019 - 2022, USD Million
- TABLE 363 South Africa Machine Learning Market by Enterprise Size, 2023 - 2030, USD Million
- TABLE 364 South Africa Machine Learning Market by Component, 2019 - 2022, USD Million
- TABLE 365 South Africa Machine Learning Market by Component, 2023 - 2030, USD Million
- TABLE 366 South Africa Machine Learning Market by End-use, 2019 - 2022, USD Million
- TABLE 367 South Africa Machine Learning Market by End-use, 2023 - 2030, USD Million
- TABLE 368 Nigeria Machine Learning Market, 2019 - 2022, USD Million
- TABLE 369 Nigeria Machine Learning Market, 2023 - 2030, USD Million
- TABLE 370 Nigeria Machine Learning Market by Enterprise Size, 2019 - 2022, USD Million
- TABLE 371 Nigeria Machine Learning Market by Enterprise Size, 2023 - 2030, USD Million
- TABLE 372 Nigeria Machine Learning Market by Component, 2019 - 2022, USD Million
- TABLE 373 Nigeria Machine Learning Market by Component, 2023 - 2030, USD Million
- TABLE 374 Nigeria Machine Learning Market by End-use, 2019 - 2022, USD Million
- TABLE 375 Nigeria Machine Learning Market by End-use, 2023 - 2030, USD Million
- TABLE 376 Rest of LAMEA Machine Learning Market, 2019 - 2022, USD Million
- TABLE 377 Rest of LAMEA Machine Learning Market, 2023 - 2030, USD Million
- TABLE 378 Rest of LAMEA Machine Learning Market by Enterprise Size, 2019 - 2022, USD Million
- TABLE 379 Rest of LAMEA Machine Learning Market by Enterprise Size, 2023 - 2030, USD Million
- TABLE 380 Rest of LAMEA Machine Learning Market by Component, 2019 - 2022, USD Million
- TABLE 381 Rest of LAMEA Machine Learning Market by Component, 2023 - 2030, USD Million
- TABLE 382 Rest of LAMEA Machine Learning Market by End-use, 2019 - 2022, USD Million
- TABLE 383 Rest of LAMEA Machine Learning Market by End-use, 2023 - 2030, USD Million
- TABLE 384 Key Information - Amazon Web Services, Inc.
- TABLE 385 Key Information - Baidu, Inc.
- TABLE 386 Key Information - Google LLC
- TABLE 387 Key Information - H2O.ai, Inc.
- TABLE 388 key information - Hewlett Packard Enterprise Company
- TABLE 389 Key Information - Intel Corporation
- TABLE 390 Key information - IBM Corporation
- TABLE 391 key information - Microsoft Corporation
- TABLE 392 Key information - SAS Institute, Inc.
- TABLE 393 Key Information - SAP SE
List of Figures
- FIG 1 Methodology for the research
- FIG 2 Global Machine Learning Market, 2019 - 2030, USD Million
- FIG 3 Key Impacting Factors Machine Learning Market
- FIG 4 KBV Cardinal Matrix
- FIG 5 Market Share Analysis, 2021
- FIG 6 Key Leading Strategies: Percentage Distribution (2019-2023)
- FIG 7 Key Strategic Move: (Partnerships, Collaborations & Agreements: 2019, Feb - 2023, Jun) Leading Players
- FIG 8 Porter's Five Forces Analysis - Machine Learning Market
- FIG 9 Global Machine Learning Market share by Enterprise Size, 2022
- FIG 10 Global Machine Learning Market share by Enterprise Size, 2030
- FIG 11 Global Machine Learning Market by Enterprise Size, 2019 - 2030, USD Million
- FIG 12 Global Machine Learning Market share by Component, 2022
- FIG 13 Global Machine Learning Market share by Component, 2030
- FIG 14 Global Machine Learning Market by Component, 2019 - 2030, USD Million
- FIG 15 Global Machine Learning Market share by End-use, 2022
- FIG 16 Global Machine Learning Market share by End-use, 2030
- FIG 17 Global Machine Learning Market by End-use, 2019 - 2030, USD Million
- FIG 18 Global Machine Learning Market share by Region, 2022
- FIG 19 Global Machine Learning Market share by Region, 2030
- FIG 20 Global Machine Learning Market by Region, 2019 - 2030, USD Million
- FIG 21 SWOT analysis: Amazon.com, Inc.
- FIG 22 Swot analysis: Baidu, inc.
- FIG 23 Recent strategies and developments: Google LLC
- FIG 24 SWOT Analysis: Google LLC. (Alphabet Inc)
- FIG 25 Recent strategies and developments: H2O.ai, Inc.
- FIG 26 SWOT Analysis: H2O.ai, Inc.
- FIG 27 Recent strategies and developments: Hewlett-Packard enterprise Company
- FIG 28 SWOT Analysis: Hewlett Packard Enterprise Company
- FIG 29 Recent strategies and developments: Intel Corporation
- FIG 30 SWOT Analysis: Intel corporation
- FIG 31 Recent strategies and developments: IBM Corporation
- FIG 32 Swot Analysis: IBM Corporation
- FIG 33 Recent strategies and developments: Microsoft Corporation
- FIG 34 SWOT Analysis: Microsoft Corporation
- FIG 35 SWOT Analysis: SAS INSTITUTE, INC.
- FIG 36 SWOT Analysis: SAP SE
The Global Machine Learning Market size is expected to reach $408.4 billion by 2030, rising at a market growth of 36.7% CAGR during the forecast period.
The usage of machine learning has grown widely by retailers to improve customer experiences. Consequently, Retail segment acquired $3,839.1 million revenue in the market in 2022. In order to process large datasets, identify pertinent metrics, recurrent patterns, anomalies, or cause-and-effect relationships among variables, and thus gain a deeper understanding of the dynamics guiding this industry and the contexts where retailers operate, machine learning is used in the retail industry. Machine learning's expansion in the retail sector is fueled by its capacity to improve consumer experiences, streamline processes, and boost revenue.
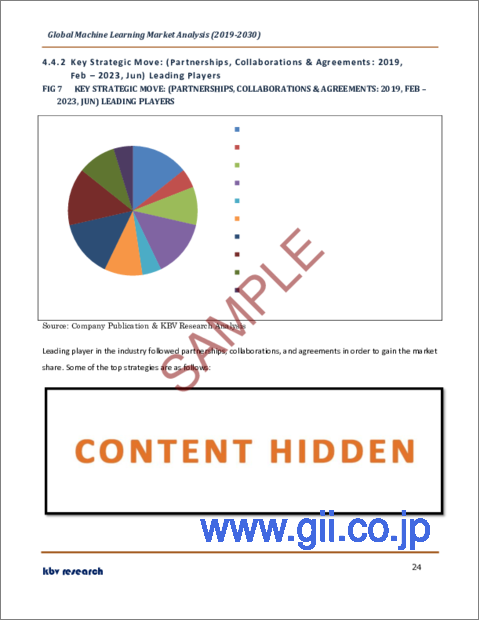
The major strategies followed by the market participants are Partnerships as the key developmental strategy to keep pace with the changing demands of end users. For instance, In March, 2023, AWS came into collaboration with NVIDIA to jointly build on-demand AI infrastructure intended for training sophisticated large language models (LLMs) and developing generative AI applications. In June, 2023, Microsoft partnered with HCLTech to help businesses leverage generative artificial intelligence and develop joint solutions to allow businesses to achieve better outcomes and improve business transformation.
Based on the Analysis presented in the KBV Cardinal matrix; Google LLC (Alphabet Inc.) and Microsoft Corporation are the forerunners in the Market. In March, 2022, Google entered into a partnership with BT to offer excellent customer experiences, decrease costs, and risks, and create more revenue streams and to enable BT to get access to hundreds of new business use cases to solidify its goals around digital offerings and developing hyper-personalized customer engagement. Companies such as IBM Corporation, Hewlett-Packard enterprise Company and Intel Corporation are some of the key innovators in the Market.
Market Growth Factors
Growing Demand for Transforming Businesses with Intelligent Automation
There is a rising need for intelligent business processes as organizations depend increasingly on data to inform decisions and boost operational effectiveness. These procedures use machine learning algorithms to automate decision-making and streamline corporate operations, which boosts productivity and profits. By utilizing AutoML, companies can increase performance, lower costs, and streamline processes, giving them a competitive advantage. In addition, AI-powered automation has been demonstrated to increase productivity significantly. By automating the creation and deployment of machine learning models, the automated market can assist firms in achieving these outcomes.
Enabling Fast Decision-Making and Saving Costs
Businesses may save the expenses of investing in costly infrastructure and employing specialist people by adopting AutoML solutions. Additionally, by boosting operational effectiveness and enhancing decision-making, AI solutions' quicker development and implementation may lead to cost savings. There will probably be a proliferation of new use cases and applications as more organizations employ AutoML technologies, boosting innovation and market growth. Additionally, the democratization of machine learning may help companies extend their offers and tap into new markets, increasing sales and market share.
Market Restraining Factors
Legal and Ethical Issues
Large volumes of data, sometimes including sensitive and private data, are necessary for machine learning. Individuals and organizations may hesitate to provide their data for ML purposes because of privacy and security concerns. Various legal and regulatory frameworks, including industry-specific rules, consumer protection laws, and anti-discrimination laws, must be complied with while using machine learning (ML). Failure to comply with these criteria may result in legal responsibilities, financial fines, harm to one's image, and a decline in public confidence. Organizations may be unsure and wary because of the possible legal issues of ML deployment. These factors are anticipated to impede market expansion in the ensuing years.
Enterprise Size Outlook
On the basis of enterprise size, the market is segmented into SMEs and large enterprises. In 2022, the large enterprises segment witnessed the largest revenue share in the market. Large enterprises are increasingly using cloud-based machine learning platforms and services. Machine learning model training and deployment are made feasible by cloud platforms' scalable and affordable architecture. Due to the services like Google Cloud AI Platform, Amazon Web Services (AWS), and Microsoft Azure Machine Learning, which provide pre-built models, distributed training capabilities, and infrastructure management, Machine learning does not need big infrastructure expenditures for large businesses.
Component Outlook
Based on components, the market is divided into services, software, and hardware. The hardware segment acquired a substantial revenue share in the market in 2022. It could be connected to the growing popularity of gear designed for machine learning. The development of specialized silicon processors with AI and ML capabilities is fueling hardware adoption. As more powerful processing devices are created by companies like SambaNova Systems, the market is predicted to keep expanding.
End-Use Outlook
By end-user, the market is categorized into healthcare, BFSI, retail, advertising & media, automotive & transportation, agricultural, manufacturing, and others. In 2022, the advertising & media segment dominated the market with the maximum revenue share. One of the major trends is hyper-personalization, in which machine learning algorithms examine vast amounts of user data to create highly relevant and individualized advertisements that increase engagement and conversion rates. A considerable focus is now being placed on employing machine learning to identify ad fraud.
Regional Outlook
Region wise, the market is analyzed across North America, Europe, Asia Pacific, and LAMEA. In 2022, the North America region led the market with the maximum revenue share. In North America, there is a rising focus on moral AI and responsible AI practices due to machine learning's expanding social influence. Fairness, accountability, and openness are prioritized by organizations while developing machine learning models and algorithms. Biases are being lessened, privacy is protected, and ethical issues about AI applications are being addressed. Legislative frameworks, rules, and standards are being created to oversee the proper use of machine learning in the area.
The market research report covers the analysis of key stake holders of the market. Key companies profiled in the report include Amazon Web Services, Inc. (Amazon.com, Inc.), Baidu, Inc., Google LLC (Alphabet Inc.), H2O.ai, Inc., Hewlett-Packard enterprise Company (HP Development Company L.P.), Intel Corporation, IBM Corporation, Microsoft Corporation, SAS Institute, Inc., SAP SE
Recent Strategies Deployed in Machine Learning Market
Partnerships, Collaborations and Agreements:
Jun-2023: Google came into collaboration with Teachmint, a company engaged in offering education-infrastructure solutions. This collaboration aims to improve cloud technologies to enhance the experience for students and teachers. Additionally, through Google Cloud infrastructure, Techmnt aims to promote advanced technologies consisting of data analytics, Artificial Intelligence, and Machine Learning.
Jun-2023: Hewlett Packard Enterprise collaborated with Applied Digital Corporation, a designer, builder, and operator of next-generation digital infrastructure which is developed for High-Performance Computing applications. Through this collaboration, HPE would provide its powerful, energy-efficient supercomputers which are proven to support large-scale AI through Applied Digital's AI cloud service.
Jun-2023: Microsoft signed a partnership with Snowflake, a cloud computing-based data cloud company. Under this partnership, Snowflake would allow joint customers to leverage the new AI models and frameworks increasing the productivity of developers.
Jun-2023: Microsoft partnered with HCLTech, a global technology company. The partnership broadens the adoption of generative AI. This partnership aims to help businesses leverage generative artificial intelligence and develop joint solutions to allow businesses to achieve better outcomes and improve business transformation.
May-2023: Microsoft collaborated with NVIDIA, a US-based global technology company. Following this collaboration, NVIDIA AI Enterprise would be combined with Azure Machine Learning offering a complete Cloud Platform for developers to create, Deploy and Manage AI Applications for large language models.
May-2023: IBM teamed up with SAP SE, a global IT company. Under this collaboration, IBM Watson technology would be combined with SAP solutions to deliver the latest AI-driven automation and insights to help boost innovation and build a more effective and efficient user experience in the SAP solution offering.
May-2023: SAP SE partnered with Google Cloud, a portfolio of cloud computing services delivered by Google. This partnership releases a completely open data offering developed to simplify data landscapes and unlock the power of business data.
Apr-2023: Baidu signed a partnership with Quhuo Limited, a gig economy platform engaged in local life services in China. This partnership marks Quhuo's focus to develop cutting-edge AI technology that would strengthen various business scenarios consisting of front, middle, and back-office functions.
Apr-2023: H2O.ai partnered with Mutt Data, a technology company that helps you develop custom data products using Machine Learning, Data Science, and Big Data to accelerate its business. This partnership would allow companies to strengthen enterprises to accelerate their businesses with data.
Apr-2023: Intel Corporation collaborated with HiddenLayer, an AI application security company. This collaboration aims to provide a complete hardware and software-based ML security solution for enterprises in compliance-focused and regulated industries.
Apr-2023: IBM came into partnership with Moderna, a pharmaceutical and biotechnology company. The partnership aims to support novel technologies, including artificial intelligence and quantum computing to boost messenger RNA research.
Apr-2023: SAS joined hands with Duke Health, a leading academic and health care system. The collaboration aims to design new cloud-based artificial intelligence for healthcare that would focus on enhanced care and provide outcomes, business operations, and health services research.
Mar-2023: AWS came into collaboration with NVIDIA, a US-based software company. The collaboration includes jointly building on-demand AI infrastructure intended for training sophisticated large language models (LLMs) and developing generative AI applications.
Mar-2023: H2O.ai came into partnership with Billigence, a global intelligence consultancy. This partnership aims to boost internal advancement by making it simple to build, deploy and obtain insights from AI-powered predictive models.
Feb-2023: AWS extended its partnership with Hugging Face, a US-based developer of chatbot applications. The partnership focuses on making AI more accessible and includes making AWS Hugging Face's preferred cloud provider, allowing developers to access tools from AWS Trainium, and AWS INferentia, among others.
Sep-2022: Intel came into partnership with Mila, a Montreal-based AI research institute. Under this partnership, More than 20 researchers across Mila and Intel would focus on developing advanced AI techniques to fight global challenges including digital biology, climate change, and new materials discovery.
Aug-2022: SAS came into collaboration with SingleStore, a company engaged in offering databases for operational analytics and cloud-native applications. This collaboration aims to help businesses remove barriers to data access, enhance performance and scalability and uncover critical data-driven insights.
Mar-2022: Google entered into a partnership with BT, a British telecommunications company. Under the partnership, BT utilized a suite of Google Cloud products and services-including cloud infrastructure, machine learning (ML) and artificial intelligence (AI), data analytics, security, and API management-to offer excellent customer experiences, decrease costs, and risks, and create more revenue streams. Google aimed to enable BT to get access to hundreds of new business use cases to solidify its goals around digital offerings and developing hyper-personalized customer engagement.
Product Launches and Product Expansions:
Jul-2023: H2O.ai launched h2oGPT, a portfolio of open-source code repositories for building and utilizing LLMs based on Generative Pretrained Transformers. This launch aims to open an accessible AI ecosystem. The project's primary aim is to build the best truly open-source substitute for closed-source methods.
May-2023: Google released PaLM 2, the next-generation language model. The launched product comes with reasoning, coding, and multilingual capabilities that would enable Google to broaden Bard to the latest languages.
May-2023: Microsoft announced the launch of Microsoft Fabric, the latest analytics and data platform. This launch centers around Microsoft's OneLake data from Google Cloud Platform and Amazon S3. Additionally, the platform combines technologies like Azure Synapse Analytics, Azure Data Factory, and Power BI.
May-2022: Intel launched Habana Gaudi2 AI deep learning processor, a second-generation Habana Gaudi2 AI deep learning processor. The product launched showed around twice the performance on the natural processor and computer vision across Nvidia's A100 80 GB processor.
Acquisitions and Mergers:
Jan-2023: Hewlett Packard took over Pachyderm, a US-based operator of data engineering platform. The blend of HPE and Pachyderm would deliver a combined ML pipeline and platform to advance a customer's journey.
Scope of the Study
Market Segments covered in the Report:
By Enterprise Size
- Large Enterprises
- SMEs
By Component
- Services
- Software
- Hardware
By End-use
- Advertising & Media
- BFSI
- Automotive & Transportation
- Manufacturing
- Agriculture
- Retail
- Healthcare
- Others
By Geography
- North America
- US
- Canada
- Mexico
- Rest of North America
- Europe
- Germany
- UK
- France
- Russia
- Spain
- Italy
- Rest of Europe
- Asia Pacific
- China
- Japan
- India
- South Korea
- Singapore
- Malaysia
- Rest of Asia Pacific
- LAMEA
- Brazil
- Argentina
- UAE
- Saudi Arabia
- South Africa
- Nigeria
- Rest of LAMEA
Companies Profiled
- Amazon Web Services, Inc. (Amazon.com, Inc.)
- Baidu, Inc.
- Google LLC (Alphabet Inc.)
- H2O.ai, Inc.
- Hewlett-Packard enterprise Company (HP Development Company L.P.)
- Intel Corporation
- IBM Corporation
- Microsoft Corporation
- SAS Institute, Inc.
- SAP SE
Unique Offerings from KBV Research
- Exhaustive coverage
- Highest number of market tables and figures
- Subscription based model available
- Guaranteed best price
- Assured post sales research support with 10% customization free
Table of Contents
Chapter 1. Market Scope & Methodology
- 1.1 Market Definition
- 1.2 Objectives
- 1.3 Market Scope
- 1.4 Segmentation
- 1.4.1 Global Machine Learning Market, by Enterprise Size
- 1.4.2 Global Machine Learning Market, by Component
- 1.4.3 Global Machine Learning Market, by End-use
- 1.4.4 Global Machine Learning Market, by Geography
- 1.5 Methodology for the research
Chapter 2. Market at a Glance
- 2.1 Key Highlights
Chapter 3. Market Overview
- 3.1 Introduction
- 3.1.1 Overview
- 3.1.1.1 Market Composition and Scenario
- 3.1.1 Overview
- 3.2 Key Factors Impacting the Market
- 3.2.1 Market Drivers
- 3.2.2 Market Restraints
Chapter 4. Competition Analysis - Global
- 4.1 KBV Cardinal Matrix
- 4.2 Recent Industry Wide Strategic Developments
- 4.2.1 Partnerships, Collaborations and Agreements
- 4.2.2 Product Launches and Product Expansions
- 4.2.3 Acquisition and Mergers
- 4.3 Market Share Analysis, 2021
- 4.4 Top Winning Strategies
- 4.4.1 Key Leading Strategies: Percentage Distribution (2019-2023)
- 4.4.2 Key Strategic Move: (Partnerships, Collaborations & Agreements: 2019, Feb - 2023, Jun) Leading Players
- 4.5 Porter's Five Forces Analysis
Chapter 5. Global Machine Learning Market by Enterprise Size
- 5.1 Global Large Enterprises Market by Region
- 5.2 Global SMEs Market by Region
Chapter 6. Global Machine Learning Market by Component
- 6.1 Global Services Market by Region
- 6.2 Global Software Market by Region
- 6.3 Global Hardware Market by Region
Chapter 7. Global Machine Learning Market by End-use
- 7.1 Global Advertising & Media Market by Region
- 7.2 Global BFSI Market by Region
- 7.3 Global Automotive & Transportation Market by Region
- 7.4 Global Manufacturing Market by Region
- 7.5 Global Agriculture Market by Region
- 7.6 Global Retail Market by Region
- 7.7 Global Healthcare Market by Region
- 7.8 Global Others Market by Region
Chapter 8. Global Machine Learning Market by Region
- 8.1 North America Machine Learning Market
- 8.1.1 North America Machine Learning Market by Enterprise Size
- 8.1.1.1 North America Large Enterprises Market by Country
- 8.1.1.2 North America SMEs Market by Country
- 8.1.2 North America Machine Learning Market by Component
- 8.1.2.1 North America Services Market by Country
- 8.1.2.2 North America Software Market by Country
- 8.1.2.3 North America Hardware Market by Country
- 8.1.3 North America Machine Learning Market by End-use
- 8.1.3.1 North America Advertising & Media Market by Country
- 8.1.3.2 North America BFSI Market by Country
- 8.1.3.3 North America Automotive & Transportation Market by Country
- 8.1.3.4 North America Manufacturing Market by Country
- 8.1.3.5 North America Agriculture Market by Country
- 8.1.3.6 North America Retail Market by Country
- 8.1.3.7 North America Healthcare Market by Country
- 8.1.3.8 North America Others Market by Country
- 8.1.4 North America Machine Learning Market by Country
- 8.1.4.1 US Machine Learning Market
- 8.1.4.1.1 US Machine Learning Market by Enterprise Size
- 8.1.4.1.2 US Machine Learning Market by Component
- 8.1.4.1.3 US Machine Learning Market by End-use
- 8.1.4.2 Canada Machine Learning Market
- 8.1.4.2.1 Canada Machine Learning Market by Enterprise Size
- 8.1.4.2.2 Canada Machine Learning Market by Component
- 8.1.4.2.3 Canada Machine Learning Market by End-use
- 8.1.4.3 Mexico Machine Learning Market
- 8.1.4.3.1 Mexico Machine Learning Market by Enterprise Size
- 8.1.4.3.2 Mexico Machine Learning Market by Component
- 8.1.4.3.3 Mexico Machine Learning Market by End-use
- 8.1.4.4 Rest of North America Machine Learning Market
- 8.1.4.4.1 Rest of North America Machine Learning Market by Enterprise Size
- 8.1.4.4.2 Rest of North America Machine Learning Market by Component
- 8.1.4.4.3 Rest of North America Machine Learning Market by End-use
- 8.1.4.1 US Machine Learning Market
- 8.1.1 North America Machine Learning Market by Enterprise Size
- 8.2 Europe Machine Learning Market
- 8.2.1 Europe Machine Learning Market by Enterprise Size
- 8.2.1.1 Europe Large Enterprises Market by Country
- 8.2.1.2 Europe SMEs Market by Country
- 8.2.2 Europe Machine Learning Market by Component
- 8.2.2.1 Europe Services Market by Country
- 8.2.2.2 Europe Software Market by Country
- 8.2.2.3 Europe Hardware Market by Country
- 8.2.3 Europe Machine Learning Market by End-use
- 8.2.3.1 Europe Advertising & Media Market by Country
- 8.2.3.2 Europe BFSI Market by Country
- 8.2.3.3 Europe Automotive & Transportation Market by Country
- 8.2.3.4 Europe Manufacturing Market by Country
- 8.2.3.5 Europe Agriculture Market by Country
- 8.2.3.6 Europe Retail Market by Country
- 8.2.3.7 Europe Healthcare Market by Country
- 8.2.3.8 Europe Others Market by Country
- 8.2.4 Europe Machine Learning Market by Country
- 8.2.4.1 Germany Machine Learning Market
- 8.2.4.1.1 Germany Machine Learning Market by Enterprise Size
- 8.2.4.1.2 Germany Machine Learning Market by Component
- 8.2.4.1.3 Germany Machine Learning Market by End-use
- 8.2.4.2 UK Machine Learning Market
- 8.2.4.2.1 UK Machine Learning Market by Enterprise Size
- 8.2.4.2.2 UK Machine Learning Market by Component
- 8.2.4.2.3 UK Machine Learning Market by End-use
- 8.2.4.3 France Machine Learning Market
- 8.2.4.3.1 France Machine Learning Market by Enterprise Size
- 8.2.4.3.2 France Machine Learning Market by Component
- 8.2.4.3.3 France Machine Learning Market by End-use
- 8.2.4.4 Russia Machine Learning Market
- 8.2.4.4.1 Russia Machine Learning Market by Enterprise Size
- 8.2.4.4.2 Russia Machine Learning Market by Component
- 8.2.4.4.3 Russia Machine Learning Market by End-use
- 8.2.4.5 Spain Machine Learning Market
- 8.2.4.5.1 Spain Machine Learning Market by Enterprise Size
- 8.2.4.5.2 Spain Machine Learning Market by Component
- 8.2.4.5.3 Spain Machine Learning Market by End-use
- 8.2.4.6 Italy Machine Learning Market
- 8.2.4.6.1 Italy Machine Learning Market by Enterprise Size
- 8.2.4.6.2 Italy Machine Learning Market by Component
- 8.2.4.6.3 Italy Machine Learning Market by End-use
- 8.2.4.7 Rest of Europe Machine Learning Market
- 8.2.4.7.1 Rest of Europe Machine Learning Market by Enterprise Size
- 8.2.4.7.2 Rest of Europe Machine Learning Market by Component
- 8.2.4.7.3 Rest of Europe Machine Learning Market by End-use
- 8.2.4.1 Germany Machine Learning Market
- 8.2.1 Europe Machine Learning Market by Enterprise Size
- 8.3 Asia Pacific Machine Learning Market
- 8.3.1 Asia Pacific Machine Learning Market by Enterprise Size
- 8.3.1.1 Asia Pacific Large Enterprises Market by Country
- 8.3.1.2 Asia Pacific SMEs Market by Country
- 8.3.2 Asia Pacific Machine Learning Market by Component
- 8.3.2.1 Asia Pacific Services Market by Country
- 8.3.2.2 Asia Pacific Software Market by Country
- 8.3.2.3 Asia Pacific Hardware Market by Country
- 8.3.3 Asia Pacific Machine Learning Market by End-use
- 8.3.3.1 Asia Pacific Advertising & Media Market by Country
- 8.3.3.2 Asia Pacific BFSI Market by Country
- 8.3.3.3 Asia Pacific Automotive & Transportation Market by Country
- 8.3.3.4 Asia Pacific Manufacturing Market by Country
- 8.3.3.5 Asia Pacific Agriculture Market by Country
- 8.3.3.6 Asia Pacific Retail Market by Country
- 8.3.3.7 Asia Pacific Healthcare Market by Country
- 8.3.3.8 Asia Pacific Others Market by Country
- 8.3.4 Asia Pacific Machine Learning Market by Country
- 8.3.4.1 China Machine Learning Market
- 8.3.4.1.1 China Machine Learning Market by Enterprise Size
- 8.3.4.1.2 China Machine Learning Market by Component
- 8.3.4.1.3 China Machine Learning Market by End-use
- 8.3.4.2 Japan Machine Learning Market
- 8.3.4.2.1 Japan Machine Learning Market by Enterprise Size
- 8.3.4.2.2 Japan Machine Learning Market by Component
- 8.3.4.2.3 Japan Machine Learning Market by End-use
- 8.3.4.3 India Machine Learning Market
- 8.3.4.3.1 India Machine Learning Market by Enterprise Size
- 8.3.4.3.2 India Machine Learning Market by Component
- 8.3.4.3.3 India Machine Learning Market by End-use
- 8.3.4.4 South Korea Machine Learning Market
- 8.3.4.4.1 South Korea Machine Learning Market by Enterprise Size
- 8.3.4.4.2 South Korea Machine Learning Market by Component
- 8.3.4.4.3 South Korea Machine Learning Market by End-use
- 8.3.4.5 Singapore Machine Learning Market
- 8.3.4.5.1 Singapore Machine Learning Market by Enterprise Size
- 8.3.4.5.2 Singapore Machine Learning Market by Component
- 8.3.4.5.3 Singapore Machine Learning Market by End-use
- 8.3.4.6 Malaysia Machine Learning Market
- 8.3.4.6.1 Malaysia Machine Learning Market by Enterprise Size
- 8.3.4.6.2 Malaysia Machine Learning Market by Component
- 8.3.4.6.3 Malaysia Machine Learning Market by End-use
- 8.3.4.7 Rest of Asia Pacific Machine Learning Market
- 8.3.4.7.1 Rest of Asia Pacific Machine Learning Market by Enterprise Size
- 8.3.4.7.2 Rest of Asia Pacific Machine Learning Market by Component
- 8.3.4.7.3 Rest of Asia Pacific Machine Learning Market by End-use
- 8.3.4.1 China Machine Learning Market
- 8.3.1 Asia Pacific Machine Learning Market by Enterprise Size
- 8.4 LAMEA Machine Learning Market
- 8.4.1 LAMEA Machine Learning Market by Enterprise Size
- 8.4.1.1 LAMEA Large Enterprises Market by Country
- 8.4.1.2 LAMEA SMEs Market by Country
- 8.4.2 LAMEA Machine Learning Market by Component
- 8.4.2.1 LAMEA Services Market by Country
- 8.4.2.2 LAMEA Software Market by Country
- 8.4.2.3 LAMEA Hardware Market by Country
- 8.4.3 LAMEA Machine Learning Market by End-use
- 8.4.3.1 LAMEA Advertising & Media Market by Country
- 8.4.3.2 LAMEA BFSI Market by Country
- 8.4.3.3 LAMEA Automotive & Transportation Market by Country
- 8.4.3.4 LAMEA Manufacturing Market by Country
- 8.4.3.5 LAMEA Agriculture Market by Country
- 8.4.3.6 LAMEA Retail Market by Country
- 8.4.3.7 LAMEA Healthcare Market by Country
- 8.4.3.8 LAMEA Others Market by Country
- 8.4.4 LAMEA Machine Learning Market by Country
- 8.4.4.1 Brazil Machine Learning Market
- 8.4.4.1.1 Brazil Machine Learning Market by Enterprise Size
- 8.4.4.1.2 Brazil Machine Learning Market by Component
- 8.4.4.1.3 Brazil Machine Learning Market by End-use
- 8.4.4.2 Argentina Machine Learning Market
- 8.4.4.2.1 Argentina Machine Learning Market by Enterprise Size
- 8.4.4.2.2 Argentina Machine Learning Market by Component
- 8.4.4.2.3 Argentina Machine Learning Market by End-use
- 8.4.4.3 UAE Machine Learning Market
- 8.4.4.3.1 UAE Machine Learning Market by Enterprise Size
- 8.4.4.3.2 UAE Machine Learning Market by Component
- 8.4.4.3.3 UAE Machine Learning Market by End-use
- 8.4.4.4 Saudi Arabia Machine Learning Market
- 8.4.4.4.1 Saudi Arabia Machine Learning Market by Enterprise Size
- 8.4.4.4.2 Saudi Arabia Machine Learning Market by Component
- 8.4.4.4.3 Saudi Arabia Machine Learning Market by End-use
- 8.4.4.5 South Africa Machine Learning Market
- 8.4.4.5.1 South Africa Machine Learning Market by Enterprise Size
- 8.4.4.5.2 South Africa Machine Learning Market by Component
- 8.4.4.5.3 South Africa Machine Learning Market by End-use
- 8.4.4.6 Nigeria Machine Learning Market
- 8.4.4.6.1 Nigeria Machine Learning Market by Enterprise Size
- 8.4.4.6.2 Nigeria Machine Learning Market by Component
- 8.4.4.6.3 Nigeria Machine Learning Market by End-use
- 8.4.4.7 Rest of LAMEA Machine Learning Market
- 8.4.4.7.1 Rest of LAMEA Machine Learning Market by Enterprise Size
- 8.4.4.7.2 Rest of LAMEA Machine Learning Market by Component
- 8.4.4.7.3 Rest of LAMEA Machine Learning Market by End-use
- 8.4.4.1 Brazil Machine Learning Market
- 8.4.1 LAMEA Machine Learning Market by Enterprise Size
Chapter 9. Company Profiles
- 9.1 Amazon Web Services, Inc. (Amazon.com, Inc.)
- 9.1.1 Company Overview
- 9.1.2 Financial Analysis
- 9.1.3 Segmental Analysis
- 9.1.4 Recent strategies and developments:
- 9.1.4.1 Partnerships, Collaborations, and Agreements:
- 9.1.5 SWOT Analysis
- 9.2 Baidu, Inc.
- 9.2.1 Company Overview
- 9.2.2 Financial Analysis
- 9.2.3 Segmental Analysis
- 9.2.4 Research & Development Expenses
- 9.2.5 Recent Strategies and Developments:
- 9.2.5.1 Partnerships, Collaborations and Agreements:
- 9.2.6 SWOT Analysis
- 9.3 Google LLC (Alphabet Inc.)
- 9.3.1 Company Overview
- 9.3.2 Financial Analysis
- 9.3.3 Segmental and Regional Analysis
- 9.3.4 Research & Development Expense
- 9.3.5 Recent strategies and developments:
- 9.3.5.1 Partnerships, Collaborations, and Agreements:
- 9.3.5.2 Product Launches and Product Expansions:
- 9.3.6 SWOT Analysis
- 9.4 H2O.ai, Inc.
- 9.4.1 Company Overview
- 9.4.2 Recent strategies and developments:
- 9.4.2.1 Partnerships, Collaborations, and Agreements:
- 9.4.2.2 Product Launches and Product Expansions:
- 9.4.3 SWOT Analysis
- 9.5 Hewlett Packard Enterprise Company (HP Development Company L.P.)
- 9.5.1 Company Overview
- 9.5.2 Financial Analysis
- 9.5.3 Segmental and Regional Analysis
- 9.5.4 Research & Development Expense
- 9.5.5 Recent strategies and developments:
- 9.5.5.1 Partnerships, Collaborations, and Agreements:
- 9.5.5.2 Acquisition and Mergers:
- 9.5.6 SWOT Analysis
- 9.6 Intel Corporation
- 9.6.1 Company Overview
- 9.6.2 Financial Analysis
- 9.6.3 Segmental and Regional Analysis
- 9.6.4 Research & Development Expenses
- 9.6.5 Recent strategies and developments:
- 9.6.5.1 Partnerships, Collaborations, and Agreements:
- 9.6.5.2 Product Launches and Product Expansions:
- 9.6.6 SWOT Analysis
- 9.7 IBM Corporation
- 9.7.1 Company Overview
- 9.7.2 Financial Analysis
- 9.7.3 Regional & Segmental Analysis
- 9.7.4 Research & Development Expenses
- 9.7.5 Recent strategies and developments:
- 9.7.5.1 Partnerships, Collaborations, and Agreements:
- 9.7.5.2 Product Launches and Product Expansions:
- 9.7.6 SWOT Analysis
- 9.8 Microsoft Corporation
- 9.8.1 Company Overview
- 9.8.2 Financial Analysis
- 9.8.3 Segmental and Regional Analysis
- 9.8.4 Research & Development Expenses
- 9.8.5 Recent strategies and developments:
- 9.8.5.1 Partnerships, Collaborations, and Agreements:
- 9.8.5.2 Product Launches and Product Expansions:
- 9.8.6 SWOT Analysis
- 9.9 SAS Institute, Inc.
- 9.9.1 Company Overview
- 9.9.2 Recent strategies and developments:
- 9.9.2.1 Partnerships, Collaborations, and Agreements:
- 9.9.3 SWOT Analysis
- 9.10. SAP SE
- 9.10.1 Company Overview
- 9.10.2 Financial Analysis
- 9.10.3 Segmental and Regional Analysis
- 9.10.4 Research & Development Expense
- 9.10.5 Recent strategies and developments:
- 9.10.5.1 Partnerships, Collaborations, and Agreements:
- 9.10.6 SWOT Analysis
