|
|
市場調査レポート
商品コード
1335857
異常検知の世界市場規模、シェア、産業動向分析レポート:展開別、技術別、コンポーネント別(ソリューション(ネットワーク行動、ユーザー行動)、サービス)、エンドユーザー別、地域別展望、予測:2023年~2030年Global Anomaly Detection Market Size, Share & Industry Trends Analysis Report By Deployment, By Technology, By Component (Solution (Network Behavior, and User Behavior), and Services), By End-Use, By Regional Outlook and Forecast, 2023 - 2030 |
||||||
|
|
|||||||
|
|||||||


| 異常検知の世界市場規模、シェア、産業動向分析レポート:展開別、技術別、コンポーネント別(ソリューション(ネットワーク行動、ユーザー行動)、サービス)、エンドユーザー別、地域別展望、予測:2023年~2030年 |
|
出版日: 2023年07月31日
発行: KBV Research
ページ情報: 英文 332 Pages
納期: 即納可能
|

- 全表示
- 概要
- 図表
- 目次
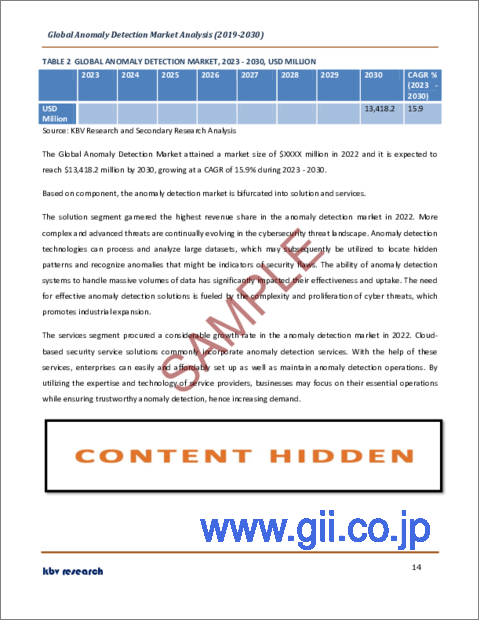
異常検知市場規模は2030年までに134億米ドルに達すると予測され、予測期間中のCAGRは15.9%の市場成長率で上昇する見込みです。
KBV Cardinalのマトリックスに示された分析によると、Microsoft Corporationが同市場におけるトップランナーです。Cisco Systems, Inc.、Broadcom, Inc.、Dell Technologies, Inc.などの企業は、この市場における主要なイノベーターです。2022年3月、シスコシステムズはネットアップと提携し、両社の顧客に自動化、ハイブリッドクラウド運用、可視化ソリューションを提供します。
市場成長要因
データ量と接続デバイスの増加
銀行、IT、ヘルスケア、金融、製造、政府・防衛などにおいて、接続デバイスの増加に伴い、異常検知の必要性が高まっています。様々な技術進歩に積極的に参加するIoTソリューションの普及は、IoT産業に大きな影響を与えています。クラウドベースのIoTデバイスの利用が増加し、さまざまな最終用途産業に最適なソリューションを提供するための競争が激化しているため、市場は急成長しています。さらに、IoT産業が巨大な発展を遂げた主な原因の1つは、ビジネスやセクターのデジタル化を政府がかなり試みていることです。
人工知能(AI)と機械学習(ML)の進歩
AIと機械学習技術の発展により、異常を検知する能力が大幅に向上しました。人工知能(AI)は、クラウドインフラストラクチャ、マイクロサービス、コンテナなどの適応可能なフレームワークを扱うのに人的リソースが不十分な場合に、自動化、リアルタイム分析、慎重さ、正確さ、自己学習など、多くの点で役立つ可能性があります。AIシステムとMLベースのソリューションの最大の利点の1つは、学習しながら学習し、反復するたびに、より良い、より正確な結果を提供する能力です。したがって、AIを搭載した異常検知ツールは、複雑なパターンを評価し、変化する環境に適応し、正確に異常を突き止めることができるため、市場の拡大に拍車がかかります。
市場抑制要因
誤報とシステム実装の問題
異常検知システムは、誤検知(または誤警報)を回避しながら真の異常を特定するための構築と調整が難しい場合があります。誤検知率が高ければ、システムの精度に対するユーザーの信頼が低下し、警告疲れにつながり、製品の普及を妨げる可能性があります。高すぎる偽陽性率は、警告疲れとシステムに対する信頼感の欠如を引き起こす可能性があり、低すぎる偽陰性率は、重大な異常に気づかずに放置する可能性があります。市場が拡大するためには、異常検知アルゴリズムの精度を向上させる必要があります。異常検知ツールを現在のワークフローやシステムに統合するのは困難で時間がかかります。レガシーシステムとの互換性の問題に直面している組織では、異常検知技術の導入が遅れる可能性があります。そのため、これらの要因が今後数年間の市場の成長を妨げる可能性があります。
展開の展望
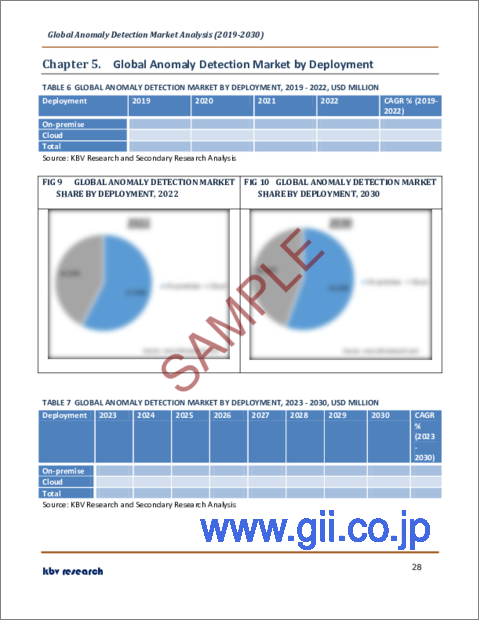
導入形態によって、市場はクラウド型とオンプレミス型に区分されます。クラウドセグメントは、2022年の市場でかなりの収益シェアを獲得しました。クラウドベースの異常検知システムは、その適応性と拡張性において卓越しています。クラウドインフラストラクチャを利用することで、企業はニーズに応じて異常検知機能を容易に拡張したり縮小したりすることができます。データ処理とデータ量の要件は時間とともに変動するため、企業はクラウド・インフラストラクチャを利用することで、インフラに多額の費用をかけたり、キャパシティを計画したりする必要がないです。
テクノロジーの展望
テクノロジー別に見ると、市場は機械学習&人工知能、ビッグデータ分析、ビジネスインテリジェンス&データマイニングに分類されます。ビッグデータ分析分野は、2022年の市場で最大の売上シェアを記録しました。コネクテッドデバイスやデジタル技術の進歩に伴い、企業は複数のソースから大量のデータを生成・収集しています。こうしたデータは、非構造化、構造化、半構造化のいずれの形式でも入手可能であるため、手作業で不正を発見することは困難です。
コンポーネントの展望
コンポーネントに基づき、市場はソリューションとサービスに二分されます。2022年の市場成長率は、サービス・セグメントに大きく依存しています。クラウドベースのセキュリティ・サービス・ソリューションには、一般的に異常検知サービスが組み込まれています。これらのサービスを利用することで、企業は異常検知業務のセットアップと保守を簡単かつ低コストで行うことができます。
ソリューションの展望
ソリューションは、ネットワーク動作とユーザー動作に分類されます。2022年の同市場では、ネットワーク振る舞い分野が最大の収益シェアを獲得しています。ネットワーク挙動異常検知の運用には、ネットワーク挙動分析が必要です。機械学習(ML)と人工知能(AI)は、他のセキュリティ技術ではアクセスできないネットワークインフラの領域に隠れた危険を特定し、ネットワーク担当者に警告を発するために、ネットワーク行動異常検知で使用されます。
最終用途の展望
エンドユーザー別に見ると、BFSI、小売、IT・通信、ヘルスケア、製造、政府・防衛、その他に分類されます。BFSIセグメントは、2022年の市場で最大の収益シェアを獲得しました。リスク管理はBFSI業界にとって極めて重要です。異常検知によって、市場リスク、オペレーショナルリスク、信用リスク、詐欺リスクなどの潜在的リスクを特定することが可能になります。金融取引、顧客行動、市場パターンの異常を特定することで、組織はリスクを評価・最小化し、インテリジェントな意思決定を行い、財務上の損失を防ぐことができます。
地域別展望
地域別に見ると、市場は北米、欧州、アジア太平洋、LAMEAで分析されます。北米セグメントは、2022年の市場で最も高い収益シェアを記録しました。北米大陸は、特にサイバーセキュリティに関して、急速に変化する不安定な環境にさらされています。デジタル技術の普及は、ビッグデータの発展とともに、企業による膨大なデータの生産と収集にもつながっています。異常検知は、保険、eコマース、金融、ヘルスケア分野での不正行為を発見するために不可欠です。取引データやユーザー行動のパターンや異常を監視することで、企業は積極的に不正行為を特定し、リスクを低減することができます。
目次
第1章 市場範囲と調査手法
- 市場の定義
- 目的
- 市場範囲
- セグメンテーション
- 調査手法
第2章 市場の概要
- 主要なハイライト
第3章 市場概要
- イントロダクション
- 概要
- 市場構成とシナリオ
- 概要
- 市場に影響を与える主な要因
- 市場促進要因
- 市場抑制要因
第4章 競合分析- 世界
- KBVカーディナルマトリックス
- 最近の業界全体の戦略的展開
- パートナーシップ、コラボレーション、および契約
- 製品の発売と製品の拡大
- 買収と合併
- 市場シェア分析2021
- 主要成功戦略
- 主な戦略
- 主要な戦略的動き
- ポーターファイブフォース分析
第5章 世界の異常検出市場:展開別
- 世界のオンプレミス市場:地域別
- 世界のクラウド市場:地域別
第6章 世界の異常検出市場:技術別
- 世界のビッグデータ分析市場:地域別
- 世界のビジネスインテリジェンスおよびデータマイニング市場:地域別
- 世界の機械学習および人工知能市場:地域別
第7章 世界の異常検出市場:コンポーネント別
- 世界のソリューション市場:地域別
- 世界の異常検出市場:ソリューションタイプ別
- 世界のネットワーク動作市場:地域別
- 世界のユーザー行動市場:地域別
- 世界サービス市場:地域別
第8章 世界の異常検出市場:最終用途別
- 世界のBFSI市場:地域別
- 世界の政府および防衛市場:地域別
- 世界のITおよびテレコム市場:地域別
- 世界のヘルスケア市場:地域別
- 世界の製造業市場:地域別
- 世界の小売市場:地域別
- 世界のその他の市場:地域別
第9章 世界の異常検出市場:地域別
- 北米
- 北米の市場:国別
- 米国
- カナダ
- メキシコ
- その他北米地域
- 北米の市場:国別
- 欧州
- 欧州の市場:国別
- ドイツ
- 英国
- フランス
- ロシア
- スペイン
- イタリア
- その他欧州地域
- 欧州の市場:国別
- アジア太平洋
- アジア太平洋の市場:国別
- 中国
- 日本
- インド
- 韓国
- シンガポール
- マレーシア
- その他アジア太平洋地域
- アジア太平洋の市場:国別
- ラテンアメリカ・中東・アフリカ
- ラテンアメリカ・中東・アフリカの市場:国別
- ブラジル
- アルゼンチン
- アラブ首長国連邦
- サウジアラビア
- 南アフリカ
- ナイジェリア
- その他ラテンアメリカ・中東・アフリカ地域
- ラテンアメリカ・中東・アフリカの市場:国別
第10章 企業プロファイル
- Amazon Web Services, Inc(Amazon.com, Inc.)
- Broadcom, Inc
- Cisco Systems, Inc
- Dell Technologies, Inc
- Dynatrace, Inc
- Happiest Minds Technologies Limited
- Hewlett Packard Enterprise Company
- IBM Corporation
- Microsoft Corporation
- SAS Institute, Inc
第11章 異常検出市場の勝利は必須
LIST OF TABLES
- TABLE 1 Global Anomaly Detection Market, 2019 - 2022, USD Million
- TABLE 2 Global Anomaly Detection Market, 2023 - 2030, USD Million
- TABLE 3 Partnerships, Collaborations and Agreements- Anomaly Detection Market
- TABLE 4 Product Launches And Product Expansions- Anomaly Detection Market
- TABLE 5 Acquisition and Mergers- Anomaly Detection Market
- TABLE 6 Global Anomaly Detection Market by Deployment, 2019 - 2022, USD Million
- TABLE 7 Global Anomaly Detection Market by Deployment, 2023 - 2030, USD Million
- TABLE 8 Global On-premise Market by Region, 2019 - 2022, USD Million
- TABLE 9 Global On-premise Market by Region, 2023 - 2030, USD Million
- TABLE 10 Global Cloud Market by Region, 2019 - 2022, USD Million
- TABLE 11 Global Cloud Market by Region, 2023 - 2030, USD Million
- TABLE 12 Global Anomaly Detection Market by Technology, 2019 - 2022, USD Million
- TABLE 13 Global Anomaly Detection Market by Technology, 2023 - 2030, USD Million
- TABLE 14 Global Big Data Analytics Market by Region, 2019 - 2022, USD Million
- TABLE 15 Global Big Data Analytics Market by Region, 2023 - 2030, USD Million
- TABLE 16 Global Business Intelligence & Data Mining Market by Region, 2019 - 2022, USD Million
- TABLE 17 Global Business Intelligence & Data Mining Market by Region, 2023 - 2030, USD Million
- TABLE 18 Global Machine Learning & Artificial Intelligence Market by Region, 2019 - 2022, USD Million
- TABLE 19 Global Machine Learning & Artificial Intelligence Market by Region, 2023 - 2030, USD Million
- TABLE 20 Global Anomaly Detection Market by Component, 2019 - 2022, USD Million
- TABLE 21 Global Anomaly Detection Market by Component, 2023 - 2030, USD Million
- TABLE 22 Global Solution Market by Region, 2019 - 2022, USD Million
- TABLE 23 Global Solution Market by Region, 2023 - 2030, USD Million
- TABLE 24 Global Anomaly Detection Market by Solution Type, 2019 - 2022, USD Million
- TABLE 25 Global Anomaly Detection Market by Solution Type, 2023 - 2030, USD Million
- TABLE 26 Global Network Behavior Market by Region, 2019 - 2022, USD Million
- TABLE 27 Global Network Behavior Market by Region, 2023 - 2030, USD Million
- TABLE 28 Global User Behavior Market by Region, 2019 - 2022, USD Million
- TABLE 29 Global User Behavior Market by Region, 2023 - 2030, USD Million
- TABLE 30 Global Services Market by Region, 2019 - 2022, USD Million
- TABLE 31 Global Services Market by Region, 2023 - 2030, USD Million
- TABLE 32 Global Anomaly Detection Market by End-use, 2019 - 2022, USD Million
- TABLE 33 Global Anomaly Detection Market by End-use, 2023 - 2030, USD Million
- TABLE 34 Global BFSI Market by Region, 2019 - 2022, USD Million
- TABLE 35 Global BFSI Market by Region, 2023 - 2030, USD Million
- TABLE 36 Global Government & Defense Market by Region, 2019 - 2022, USD Million
- TABLE 37 Global Government & Defense Market by Region, 2023 - 2030, USD Million
- TABLE 38 Global IT & Telecom Market by Region, 2019 - 2022, USD Million
- TABLE 39 Global IT & Telecom Market by Region, 2023 - 2030, USD Million
- TABLE 40 Global Healthcare Market by Region, 2019 - 2022, USD Million
- TABLE 41 Global Healthcare Market by Region, 2023 - 2030, USD Million
- TABLE 42 Global Manufacturing Market by Region, 2019 - 2022, USD Million
- TABLE 43 Global Manufacturing Market by Region, 2023 - 2030, USD Million
- TABLE 44 Global Retail Market by Region, 2019 - 2022, USD Million
- TABLE 45 Global Retail Market by Region, 2023 - 2030, USD Million
- TABLE 46 Global Others Market by Region, 2019 - 2022, USD Million
- TABLE 47 Global Others Market by Region, 2023 - 2030, USD Million
- TABLE 48 Global Anomaly Detection Market by Region, 2019 - 2022, USD Million
- TABLE 49 Global Anomaly Detection Market by Region, 2023 - 2030, USD Million
- TABLE 50 North America Anomaly Detection Market, 2019 - 2022, USD Million
- TABLE 51 North America Anomaly Detection Market, 2023 - 2030, USD Million
- TABLE 52 North America Anomaly Detection Market by Deployment, 2019 - 2022, USD Million
- TABLE 53 North America Anomaly Detection Market by Deployment, 2023 - 2030, USD Million
- TABLE 54 North America On-premise Market by Country, 2019 - 2022, USD Million
- TABLE 55 North America On-premise Market by Country, 2023 - 2030, USD Million
- TABLE 56 North America Cloud Market by Country, 2019 - 2022, USD Million
- TABLE 57 North America Cloud Market by Country, 2023 - 2030, USD Million
- TABLE 58 North America Anomaly Detection Market by Technology, 2019 - 2022, USD Million
- TABLE 59 North America Anomaly Detection Market by Technology, 2023 - 2030, USD Million
- TABLE 60 North America Big Data Analytics Market by Country, 2019 - 2022, USD Million
- TABLE 61 North America Big Data Analytics Market by Country, 2023 - 2030, USD Million
- TABLE 62 North America Business Intelligence & Data Mining Market by Country, 2019 - 2022, USD Million
- TABLE 63 North America Business Intelligence & Data Mining Market by Country, 2023 - 2030, USD Million
- TABLE 64 North America Machine Learning & Artificial Intelligence Market by Country, 2019 - 2022, USD Million
- TABLE 65 North America Machine Learning & Artificial Intelligence Market by Country, 2023 - 2030, USD Million
- TABLE 66 North America Anomaly Detection Market by Component, 2019 - 2022, USD Million
- TABLE 67 North America Anomaly Detection Market by Component, 2023 - 2030, USD Million
- TABLE 68 North America Solution Market by Country, 2019 - 2022, USD Million
- TABLE 69 North America Solution Market by Country, 2023 - 2030, USD Million
- TABLE 70 North America Anomaly Detection Market by Solution Type, 2019 - 2022, USD Million
- TABLE 71 North America Anomaly Detection Market by Solution Type, 2023 - 2030, USD Million
- TABLE 72 North America Network Behavior Market by Country, 2019 - 2022, USD Million
- TABLE 73 North America Network Behavior Market by Country, 2023 - 2030, USD Million
- TABLE 74 North America User Behavior Market by Country, 2019 - 2022, USD Million
- TABLE 75 North America User Behavior Market by Country, 2023 - 2030, USD Million
- TABLE 76 North America Services Market by Country, 2019 - 2022, USD Million
- TABLE 77 North America Services Market by Country, 2023 - 2030, USD Million
- TABLE 78 North America Anomaly Detection Market by End-use, 2019 - 2022, USD Million
- TABLE 79 North America Anomaly Detection Market by End-use, 2023 - 2030, USD Million
- TABLE 80 North America BFSI Market by Country, 2019 - 2022, USD Million
- TABLE 81 North America BFSI Market by Country, 2023 - 2030, USD Million
- TABLE 82 North America Government & Defense Market by Country, 2019 - 2022, USD Million
- TABLE 83 North America Government & Defense Market by Country, 2023 - 2030, USD Million
- TABLE 84 North America IT & Telecom Market by Country, 2019 - 2022, USD Million
- TABLE 85 North America IT & Telecom Market by Country, 2023 - 2030, USD Million
- TABLE 86 North America Healthcare Market by Country, 2019 - 2022, USD Million
- TABLE 87 North America Healthcare Market by Country, 2023 - 2030, USD Million
- TABLE 88 North America Manufacturing Market by Country, 2019 - 2022, USD Million
- TABLE 89 North America Manufacturing Market by Country, 2023 - 2030, USD Million
- TABLE 90 North America Retail Market by Country, 2019 - 2022, USD Million
- TABLE 91 North America Retail Market by Country, 2023 - 2030, USD Million
- TABLE 92 North America Others Market by Country, 2019 - 2022, USD Million
- TABLE 93 North America Others Market by Country, 2023 - 2030, USD Million
- TABLE 94 North America Anomaly Detection Market by Country, 2019 - 2022, USD Million
- TABLE 95 North America Anomaly Detection Market by Country, 2023 - 2030, USD Million
- TABLE 96 US Anomaly Detection Market, 2019 - 2022, USD Million
- TABLE 97 US Anomaly Detection Market, 2023 - 2030, USD Million
- TABLE 98 US Anomaly Detection Market by Deployment, 2019 - 2022, USD Million
- TABLE 99 US Anomaly Detection Market by Deployment, 2023 - 2030, USD Million
- TABLE 100 US Anomaly Detection Market by Technology, 2019 - 2022, USD Million
- TABLE 101 US Anomaly Detection Market by Technology, 2023 - 2030, USD Million
- TABLE 102 US Anomaly Detection Market by Component, 2019 - 2022, USD Million
- TABLE 103 US Anomaly Detection Market by Component, 2023 - 2030, USD Million
- TABLE 104 US Anomaly Detection Market by Solution Type, 2019 - 2022, USD Million
- TABLE 105 US Anomaly Detection Market by Solution Type, 2023 - 2030, USD Million
- TABLE 106 US Anomaly Detection Market by End-use, 2019 - 2022, USD Million
- TABLE 107 US Anomaly Detection Market by End-use, 2023 - 2030, USD Million
- TABLE 108 Canada Anomaly Detection Market, 2019 - 2022, USD Million
- TABLE 109 Canada Anomaly Detection Market, 2023 - 2030, USD Million
- TABLE 110 Canada Anomaly Detection Market by Deployment, 2019 - 2022, USD Million
- TABLE 111 Canada Anomaly Detection Market by Deployment, 2023 - 2030, USD Million
- TABLE 112 Canada Anomaly Detection Market by Technology, 2019 - 2022, USD Million
- TABLE 113 Canada Anomaly Detection Market by Technology, 2023 - 2030, USD Million
- TABLE 114 Canada Anomaly Detection Market by Component, 2019 - 2022, USD Million
- TABLE 115 Canada Anomaly Detection Market by Component, 2023 - 2030, USD Million
- TABLE 116 Canada Anomaly Detection Market by Solution Type, 2019 - 2022, USD Million
- TABLE 117 Canada Anomaly Detection Market by Solution Type, 2023 - 2030, USD Million
- TABLE 118 Canada Anomaly Detection Market by End-use, 2019 - 2022, USD Million
- TABLE 119 Canada Anomaly Detection Market by End-use, 2023 - 2030, USD Million
- TABLE 120 Mexico Anomaly Detection Market, 2019 - 2022, USD Million
- TABLE 121 Mexico Anomaly Detection Market, 2023 - 2030, USD Million
- TABLE 122 Mexico Anomaly Detection Market by Deployment, 2019 - 2022, USD Million
- TABLE 123 Mexico Anomaly Detection Market by Deployment, 2023 - 2030, USD Million
- TABLE 124 Mexico Anomaly Detection Market by Technology, 2019 - 2022, USD Million
- TABLE 125 Mexico Anomaly Detection Market by Technology, 2023 - 2030, USD Million
- TABLE 126 Mexico Anomaly Detection Market by Component, 2019 - 2022, USD Million
- TABLE 127 Mexico Anomaly Detection Market by Component, 2023 - 2030, USD Million
- TABLE 128 Mexico Anomaly Detection Market by Solution Type, 2019 - 2022, USD Million
- TABLE 129 Mexico Anomaly Detection Market by Solution Type, 2023 - 2030, USD Million
- TABLE 130 Mexico Anomaly Detection Market by End-use, 2019 - 2022, USD Million
- TABLE 131 Mexico Anomaly Detection Market by End-use, 2023 - 2030, USD Million
- TABLE 132 Rest of North America Anomaly Detection Market, 2019 - 2022, USD Million
- TABLE 133 Rest of North America Anomaly Detection Market, 2023 - 2030, USD Million
- TABLE 134 Rest of North America Anomaly Detection Market by Deployment, 2019 - 2022, USD Million
- TABLE 135 Rest of North America Anomaly Detection Market by Deployment, 2023 - 2030, USD Million
- TABLE 136 Rest of North America Anomaly Detection Market by Technology, 2019 - 2022, USD Million
- TABLE 137 Rest of North America Anomaly Detection Market by Technology, 2023 - 2030, USD Million
- TABLE 138 Rest of North America Anomaly Detection Market by Component, 2019 - 2022, USD Million
- TABLE 139 Rest of North America Anomaly Detection Market by Component, 2023 - 2030, USD Million
- TABLE 140 Rest of North America Anomaly Detection Market by Solution Type, 2019 - 2022, USD Million
- TABLE 141 Rest of North America Anomaly Detection Market by Solution Type, 2023 - 2030, USD Million
- TABLE 142 Rest of North America Anomaly Detection Market by End-use, 2019 - 2022, USD Million
- TABLE 143 Rest of North America Anomaly Detection Market by End-use, 2023 - 2030, USD Million
- TABLE 144 Europe Anomaly Detection Market, 2019 - 2022, USD Million
- TABLE 145 Europe Anomaly Detection Market, 2023 - 2030, USD Million
- TABLE 146 Europe Anomaly Detection Market by Deployment, 2019 - 2022, USD Million
- TABLE 147 Europe Anomaly Detection Market by Deployment, 2023 - 2030, USD Million
- TABLE 148 Europe On-premise Market by Country, 2019 - 2022, USD Million
- TABLE 149 Europe On-premise Market by Country, 2023 - 2030, USD Million
- TABLE 150 Europe Cloud Market by Country, 2019 - 2022, USD Million
- TABLE 151 Europe Cloud Market by Country, 2023 - 2030, USD Million
- TABLE 152 Europe Anomaly Detection Market by Technology, 2019 - 2022, USD Million
- TABLE 153 Europe Anomaly Detection Market by Technology, 2023 - 2030, USD Million
- TABLE 154 Europe Big Data Analytics Market by Country, 2019 - 2022, USD Million
- TABLE 155 Europe Big Data Analytics Market by Country, 2023 - 2030, USD Million
- TABLE 156 Europe Business Intelligence & Data Mining Market by Country, 2019 - 2022, USD Million
- TABLE 157 Europe Business Intelligence & Data Mining Market by Country, 2023 - 2030, USD Million
- TABLE 158 Europe Machine Learning & Artificial Intelligence Market by Country, 2019 - 2022, USD Million
- TABLE 159 Europe Machine Learning & Artificial Intelligence Market by Country, 2023 - 2030, USD Million
- TABLE 160 Europe Anomaly Detection Market by Component, 2019 - 2022, USD Million
- TABLE 161 Europe Anomaly Detection Market by Component, 2023 - 2030, USD Million
- TABLE 162 Europe Solution Market by Country, 2019 - 2022, USD Million
- TABLE 163 Europe Solution Market by Country, 2023 - 2030, USD Million
- TABLE 164 Europe Anomaly Detection Market by Solution Type, 2019 - 2022, USD Million
- TABLE 165 Europe Anomaly Detection Market by Solution Type, 2023 - 2030, USD Million
- TABLE 166 Europe Network Behavior Market by Country, 2019 - 2022, USD Million
- TABLE 167 Europe Network Behavior Market by Country, 2023 - 2030, USD Million
- TABLE 168 Europe User Behavior Market by Country, 2019 - 2022, USD Million
- TABLE 169 Europe User Behavior Market by Country, 2023 - 2030, USD Million
- TABLE 170 Europe Services Market by Country, 2019 - 2022, USD Million
- TABLE 171 Europe Services Market by Country, 2023 - 2030, USD Million
- TABLE 172 Europe Anomaly Detection Market by End-use, 2019 - 2022, USD Million
- TABLE 173 Europe Anomaly Detection Market by End-use, 2023 - 2030, USD Million
- TABLE 174 Europe BFSI Market by Country, 2019 - 2022, USD Million
- TABLE 175 Europe BFSI Market by Country, 2023 - 2030, USD Million
- TABLE 176 Europe Government & Defense Market by Country, 2019 - 2022, USD Million
- TABLE 177 Europe Government & Defense Market by Country, 2023 - 2030, USD Million
- TABLE 178 Europe IT & Telecom Market by Country, 2019 - 2022, USD Million
- TABLE 179 Europe IT & Telecom Market by Country, 2023 - 2030, USD Million
- TABLE 180 Europe Healthcare Market by Country, 2019 - 2022, USD Million
- TABLE 181 Europe Healthcare Market by Country, 2023 - 2030, USD Million
- TABLE 182 Europe Manufacturing Market by Country, 2019 - 2022, USD Million
- TABLE 183 Europe Manufacturing Market by Country, 2023 - 2030, USD Million
- TABLE 184 Europe Retail Market by Country, 2019 - 2022, USD Million
- TABLE 185 Europe Retail Market by Country, 2023 - 2030, USD Million
- TABLE 186 Europe Others Market by Country, 2019 - 2022, USD Million
- TABLE 187 Europe Others Market by Country, 2023 - 2030, USD Million
- TABLE 188 Europe Anomaly Detection Market by Country, 2019 - 2022, USD Million
- TABLE 189 Europe Anomaly Detection Market by Country, 2023 - 2030, USD Million
- TABLE 190 Germany Anomaly Detection Market, 2019 - 2022, USD Million
- TABLE 191 Germany Anomaly Detection Market, 2023 - 2030, USD Million
- TABLE 192 Germany Anomaly Detection Market by Deployment, 2019 - 2022, USD Million
- TABLE 193 Germany Anomaly Detection Market by Deployment, 2023 - 2030, USD Million
- TABLE 194 Germany Anomaly Detection Market by Technology, 2019 - 2022, USD Million
- TABLE 195 Germany Anomaly Detection Market by Technology, 2023 - 2030, USD Million
- TABLE 196 Germany Anomaly Detection Market by Component, 2019 - 2022, USD Million
- TABLE 197 Germany Anomaly Detection Market by Component, 2023 - 2030, USD Million
- TABLE 198 Germany Anomaly Detection Market by Solution Type, 2019 - 2022, USD Million
- TABLE 199 Germany Anomaly Detection Market by Solution Type, 2023 - 2030, USD Million
- TABLE 200 Germany Anomaly Detection Market by End-use, 2019 - 2022, USD Million
- TABLE 201 Germany Anomaly Detection Market by End-use, 2023 - 2030, USD Million
- TABLE 202 UK Anomaly Detection Market, 2019 - 2022, USD Million
- TABLE 203 UK Anomaly Detection Market, 2023 - 2030, USD Million
- TABLE 204 UK Anomaly Detection Market by Deployment, 2019 - 2022, USD Million
- TABLE 205 UK Anomaly Detection Market by Deployment, 2023 - 2030, USD Million
- TABLE 206 UK Anomaly Detection Market by Technology, 2019 - 2022, USD Million
- TABLE 207 UK Anomaly Detection Market by Technology, 2023 - 2030, USD Million
- TABLE 208 UK Anomaly Detection Market by Component, 2019 - 2022, USD Million
- TABLE 209 UK Anomaly Detection Market by Component, 2023 - 2030, USD Million
- TABLE 210 UK Anomaly Detection Market by Solution Type, 2019 - 2022, USD Million
- TABLE 211 UK Anomaly Detection Market by Solution Type, 2023 - 2030, USD Million
- TABLE 212 UK Anomaly Detection Market by End-use, 2019 - 2022, USD Million
- TABLE 213 UK Anomaly Detection Market by End-use, 2023 - 2030, USD Million
- TABLE 214 France Anomaly Detection Market, 2019 - 2022, USD Million
- TABLE 215 France Anomaly Detection Market, 2023 - 2030, USD Million
- TABLE 216 France Anomaly Detection Market by Deployment, 2019 - 2022, USD Million
- TABLE 217 France Anomaly Detection Market by Deployment, 2023 - 2030, USD Million
- TABLE 218 France Anomaly Detection Market by Technology, 2019 - 2022, USD Million
- TABLE 219 France Anomaly Detection Market by Technology, 2023 - 2030, USD Million
- TABLE 220 France Anomaly Detection Market by Component, 2019 - 2022, USD Million
- TABLE 221 France Anomaly Detection Market by Component, 2023 - 2030, USD Million
- TABLE 222 France Anomaly Detection Market by Solution Type, 2019 - 2022, USD Million
- TABLE 223 France Anomaly Detection Market by Solution Type, 2023 - 2030, USD Million
- TABLE 224 France Anomaly Detection Market by End-use, 2019 - 2022, USD Million
- TABLE 225 France Anomaly Detection Market by End-use, 2023 - 2030, USD Million
- TABLE 226 Russia Anomaly Detection Market, 2019 - 2022, USD Million
- TABLE 227 Russia Anomaly Detection Market, 2023 - 2030, USD Million
- TABLE 228 Russia Anomaly Detection Market by Deployment, 2019 - 2022, USD Million
- TABLE 229 Russia Anomaly Detection Market by Deployment, 2023 - 2030, USD Million
- TABLE 230 Russia Anomaly Detection Market by Technology, 2019 - 2022, USD Million
- TABLE 231 Russia Anomaly Detection Market by Technology, 2023 - 2030, USD Million
- TABLE 232 Russia Anomaly Detection Market by Component, 2019 - 2022, USD Million
- TABLE 233 Russia Anomaly Detection Market by Component, 2023 - 2030, USD Million
- TABLE 234 Russia Anomaly Detection Market by Solution Type, 2019 - 2022, USD Million
- TABLE 235 Russia Anomaly Detection Market by Solution Type, 2023 - 2030, USD Million
- TABLE 236 Russia Anomaly Detection Market by End-use, 2019 - 2022, USD Million
- TABLE 237 Russia Anomaly Detection Market by End-use, 2023 - 2030, USD Million
- TABLE 238 Spain Anomaly Detection Market, 2019 - 2022, USD Million
- TABLE 239 Spain Anomaly Detection Market, 2023 - 2030, USD Million
- TABLE 240 Spain Anomaly Detection Market by Deployment, 2019 - 2022, USD Million
- TABLE 241 Spain Anomaly Detection Market by Deployment, 2023 - 2030, USD Million
- TABLE 242 Spain Anomaly Detection Market by Technology, 2019 - 2022, USD Million
- TABLE 243 Spain Anomaly Detection Market by Technology, 2023 - 2030, USD Million
- TABLE 244 Spain Anomaly Detection Market by Component, 2019 - 2022, USD Million
- TABLE 245 Spain Anomaly Detection Market by Component, 2023 - 2030, USD Million
- TABLE 246 Spain Anomaly Detection Market by Solution Type, 2019 - 2022, USD Million
- TABLE 247 Spain Anomaly Detection Market by Solution Type, 2023 - 2030, USD Million
- TABLE 248 Spain Anomaly Detection Market by End-use, 2019 - 2022, USD Million
- TABLE 249 Spain Anomaly Detection Market by End-use, 2023 - 2030, USD Million
- TABLE 250 Italy Anomaly Detection Market, 2019 - 2022, USD Million
- TABLE 251 Italy Anomaly Detection Market, 2023 - 2030, USD Million
- TABLE 252 Italy Anomaly Detection Market by Deployment, 2019 - 2022, USD Million
- TABLE 253 Italy Anomaly Detection Market by Deployment, 2023 - 2030, USD Million
- TABLE 254 Italy Anomaly Detection Market by Technology, 2019 - 2022, USD Million
- TABLE 255 Italy Anomaly Detection Market by Technology, 2023 - 2030, USD Million
- TABLE 256 Italy Anomaly Detection Market by Component, 2019 - 2022, USD Million
- TABLE 257 Italy Anomaly Detection Market by Component, 2023 - 2030, USD Million
- TABLE 258 Italy Anomaly Detection Market by Solution Type, 2019 - 2022, USD Million
- TABLE 259 Italy Anomaly Detection Market by Solution Type, 2023 - 2030, USD Million
- TABLE 260 Italy Anomaly Detection Market by End-use, 2019 - 2022, USD Million
- TABLE 261 Italy Anomaly Detection Market by End-use, 2023 - 2030, USD Million
- TABLE 262 Rest of Europe Anomaly Detection Market, 2019 - 2022, USD Million
- TABLE 263 Rest of Europe Anomaly Detection Market, 2023 - 2030, USD Million
- TABLE 264 Rest of Europe Anomaly Detection Market by Deployment, 2019 - 2022, USD Million
- TABLE 265 Rest of Europe Anomaly Detection Market by Deployment, 2023 - 2030, USD Million
- TABLE 266 Rest of Europe Anomaly Detection Market by Technology, 2019 - 2022, USD Million
- TABLE 267 Rest of Europe Anomaly Detection Market by Technology, 2023 - 2030, USD Million
- TABLE 268 Rest of Europe Anomaly Detection Market by Component, 2019 - 2022, USD Million
- TABLE 269 Rest of Europe Anomaly Detection Market by Component, 2023 - 2030, USD Million
- TABLE 270 Rest of Europe Anomaly Detection Market by Solution Type, 2019 - 2022, USD Million
- TABLE 271 Rest of Europe Anomaly Detection Market by Solution Type, 2023 - 2030, USD Million
- TABLE 272 Rest of Europe Anomaly Detection Market by End-use, 2019 - 2022, USD Million
- TABLE 273 Rest of Europe Anomaly Detection Market by End-use, 2023 - 2030, USD Million
- TABLE 274 Asia Pacific Anomaly Detection Market, 2019 - 2022, USD Million
- TABLE 275 Asia Pacific Anomaly Detection Market, 2023 - 2030, USD Million
- TABLE 276 Asia Pacific Anomaly Detection Market by Deployment, 2019 - 2022, USD Million
- TABLE 277 Asia Pacific Anomaly Detection Market by Deployment, 2023 - 2030, USD Million
- TABLE 278 Asia Pacific On-premise Market by Country, 2019 - 2022, USD Million
- TABLE 279 Asia Pacific On-premise Market by Country, 2023 - 2030, USD Million
- TABLE 280 Asia Pacific Cloud Market by Country, 2019 - 2022, USD Million
- TABLE 281 Asia Pacific Cloud Market by Country, 2023 - 2030, USD Million
- TABLE 282 Asia Pacific Anomaly Detection Market by Technology, 2019 - 2022, USD Million
- TABLE 283 Asia Pacific Anomaly Detection Market by Technology, 2023 - 2030, USD Million
- TABLE 284 Asia Pacific Big Data Analytics Market by Country, 2019 - 2022, USD Million
- TABLE 285 Asia Pacific Big Data Analytics Market by Country, 2023 - 2030, USD Million
- TABLE 286 Asia Pacific Business Intelligence & Data Mining Market by Country, 2019 - 2022, USD Million
- TABLE 287 Asia Pacific Business Intelligence & Data Mining Market by Country, 2023 - 2030, USD Million
- TABLE 288 Asia Pacific Machine Learning & Artificial Intelligence Market by Country, 2019 - 2022, USD Million
- TABLE 289 Asia Pacific Machine Learning & Artificial Intelligence Market by Country, 2023 - 2030, USD Million
- TABLE 290 Asia Pacific Anomaly Detection Market by Component, 2019 - 2022, USD Million
- TABLE 291 Asia Pacific Anomaly Detection Market by Component, 2023 - 2030, USD Million
- TABLE 292 Asia Pacific Solution Market by Country, 2019 - 2022, USD Million
- TABLE 293 Asia Pacific Solution Market by Country, 2023 - 2030, USD Million
- TABLE 294 Asia Pacific Anomaly Detection Market by Solution Type, 2019 - 2022, USD Million
- TABLE 295 Asia Pacific Anomaly Detection Market by Solution Type, 2023 - 2030, USD Million
- TABLE 296 Asia Pacific Network Behavior Market by Country, 2019 - 2022, USD Million
- TABLE 297 Asia Pacific Network Behavior Market by Country, 2023 - 2030, USD Million
- TABLE 298 Asia Pacific User Behavior Market by Country, 2019 - 2022, USD Million
- TABLE 299 Asia Pacific User Behavior Market by Country, 2023 - 2030, USD Million
- TABLE 300 Asia Pacific Services Market by Country, 2019 - 2022, USD Million
- TABLE 301 Asia Pacific Services Market by Country, 2023 - 2030, USD Million
- TABLE 302 Asia Pacific Anomaly Detection Market by End-use, 2019 - 2022, USD Million
- TABLE 303 Asia Pacific Anomaly Detection Market by End-use, 2023 - 2030, USD Million
- TABLE 304 Asia Pacific BFSI Market by Country, 2019 - 2022, USD Million
- TABLE 305 Asia Pacific BFSI Market by Country, 2023 - 2030, USD Million
- TABLE 306 Asia Pacific Government & Defense Market by Country, 2019 - 2022, USD Million
- TABLE 307 Asia Pacific Government & Defense Market by Country, 2023 - 2030, USD Million
- TABLE 308 Asia Pacific IT & Telecom Market by Country, 2019 - 2022, USD Million
- TABLE 309 Asia Pacific IT & Telecom Market by Country, 2023 - 2030, USD Million
- TABLE 310 Asia Pacific Healthcare Market by Country, 2019 - 2022, USD Million
- TABLE 311 Asia Pacific Healthcare Market by Country, 2023 - 2030, USD Million
- TABLE 312 Asia Pacific Manufacturing Market by Country, 2019 - 2022, USD Million
- TABLE 313 Asia Pacific Manufacturing Market by Country, 2023 - 2030, USD Million
- TABLE 314 Asia Pacific Retail Market by Country, 2019 - 2022, USD Million
- TABLE 315 Asia Pacific Retail Market by Country, 2023 - 2030, USD Million
- TABLE 316 Asia Pacific Others Market by Country, 2019 - 2022, USD Million
- TABLE 317 Asia Pacific Others Market by Country, 2023 - 2030, USD Million
- TABLE 318 Asia Pacific Anomaly Detection Market by Country, 2019 - 2022, USD Million
- TABLE 319 Asia Pacific Anomaly Detection Market by Country, 2023 - 2030, USD Million
- TABLE 320 China Anomaly Detection Market, 2019 - 2022, USD Million
- TABLE 321 China Anomaly Detection Market, 2023 - 2030, USD Million
- TABLE 322 China Anomaly Detection Market by Deployment, 2019 - 2022, USD Million
- TABLE 323 China Anomaly Detection Market by Deployment, 2023 - 2030, USD Million
- TABLE 324 China Anomaly Detection Market by Technology, 2019 - 2022, USD Million
- TABLE 325 China Anomaly Detection Market by Technology, 2023 - 2030, USD Million
- TABLE 326 China Anomaly Detection Market by Component, 2019 - 2022, USD Million
- TABLE 327 China Anomaly Detection Market by Component, 2023 - 2030, USD Million
- TABLE 328 China Anomaly Detection Market by Solution Type, 2019 - 2022, USD Million
- TABLE 329 China Anomaly Detection Market by Solution Type, 2023 - 2030, USD Million
- TABLE 330 China Anomaly Detection Market by End-use, 2019 - 2022, USD Million
- TABLE 331 China Anomaly Detection Market by End-use, 2023 - 2030, USD Million
- TABLE 332 Japan Anomaly Detection Market, 2019 - 2022, USD Million
- TABLE 333 Japan Anomaly Detection Market, 2023 - 2030, USD Million
- TABLE 334 Japan Anomaly Detection Market by Deployment, 2019 - 2022, USD Million
- TABLE 335 Japan Anomaly Detection Market by Deployment, 2023 - 2030, USD Million
- TABLE 336 Japan Anomaly Detection Market by Technology, 2019 - 2022, USD Million
- TABLE 337 Japan Anomaly Detection Market by Technology, 2023 - 2030, USD Million
- TABLE 338 Japan Anomaly Detection Market by Component, 2019 - 2022, USD Million
- TABLE 339 Japan Anomaly Detection Market by Component, 2023 - 2030, USD Million
- TABLE 340 Japan Anomaly Detection Market by Solution Type, 2019 - 2022, USD Million
- TABLE 341 Japan Anomaly Detection Market by Solution Type, 2023 - 2030, USD Million
- TABLE 342 Japan Anomaly Detection Market by End-use, 2019 - 2022, USD Million
- TABLE 343 Japan Anomaly Detection Market by End-use, 2023 - 2030, USD Million
- TABLE 344 India Anomaly Detection Market, 2019 - 2022, USD Million
- TABLE 345 India Anomaly Detection Market, 2023 - 2030, USD Million
- TABLE 346 India Anomaly Detection Market by Deployment, 2019 - 2022, USD Million
- TABLE 347 India Anomaly Detection Market by Deployment, 2023 - 2030, USD Million
- TABLE 348 India Anomaly Detection Market by Technology, 2019 - 2022, USD Million
- TABLE 349 India Anomaly Detection Market by Technology, 2023 - 2030, USD Million
- TABLE 350 India Anomaly Detection Market by Component, 2019 - 2022, USD Million
- TABLE 351 India Anomaly Detection Market by Component, 2023 - 2030, USD Million
- TABLE 352 India Anomaly Detection Market by Solution Type, 2019 - 2022, USD Million
- TABLE 353 India Anomaly Detection Market by Solution Type, 2023 - 2030, USD Million
- TABLE 354 India Anomaly Detection Market by End-use, 2019 - 2022, USD Million
- TABLE 355 India Anomaly Detection Market by End-use, 2023 - 2030, USD Million
- TABLE 356 South Korea Anomaly Detection Market, 2019 - 2022, USD Million
- TABLE 357 South Korea Anomaly Detection Market, 2023 - 2030, USD Million
- TABLE 358 South Korea Anomaly Detection Market by Deployment, 2019 - 2022, USD Million
- TABLE 359 South Korea Anomaly Detection Market by Deployment, 2023 - 2030, USD Million
- TABLE 360 South Korea Anomaly Detection Market by Technology, 2019 - 2022, USD Million
- TABLE 361 South Korea Anomaly Detection Market by Technology, 2023 - 2030, USD Million
- TABLE 362 South Korea Anomaly Detection Market by Component, 2019 - 2022, USD Million
- TABLE 363 South Korea Anomaly Detection Market by Component, 2023 - 2030, USD Million
- TABLE 364 South Korea Anomaly Detection Market by Solution Type, 2019 - 2022, USD Million
- TABLE 365 South Korea Anomaly Detection Market by Solution Type, 2023 - 2030, USD Million
- TABLE 366 South Korea Anomaly Detection Market by End-use, 2019 - 2022, USD Million
- TABLE 367 South Korea Anomaly Detection Market by End-use, 2023 - 2030, USD Million
- TABLE 368 Singapore Anomaly Detection Market, 2019 - 2022, USD Million
- TABLE 369 Singapore Anomaly Detection Market, 2023 - 2030, USD Million
- TABLE 370 Singapore Anomaly Detection Market by Deployment, 2019 - 2022, USD Million
- TABLE 371 Singapore Anomaly Detection Market by Deployment, 2023 - 2030, USD Million
- TABLE 372 Singapore Anomaly Detection Market by Technology, 2019 - 2022, USD Million
- TABLE 373 Singapore Anomaly Detection Market by Technology, 2023 - 2030, USD Million
- TABLE 374 Singapore Anomaly Detection Market by Component, 2019 - 2022, USD Million
- TABLE 375 Singapore Anomaly Detection Market by Component, 2023 - 2030, USD Million
- TABLE 376 Singapore Anomaly Detection Market by Solution Type, 2019 - 2022, USD Million
- TABLE 377 Singapore Anomaly Detection Market by Solution Type, 2023 - 2030, USD Million
- TABLE 378 Singapore Anomaly Detection Market by End-use, 2019 - 2022, USD Million
- TABLE 379 Singapore Anomaly Detection Market by End-use, 2023 - 2030, USD Million
- TABLE 380 Malaysia Anomaly Detection Market, 2019 - 2022, USD Million
- TABLE 381 Malaysia Anomaly Detection Market, 2023 - 2030, USD Million
- TABLE 382 Malaysia Anomaly Detection Market by Deployment, 2019 - 2022, USD Million
- TABLE 383 Malaysia Anomaly Detection Market by Deployment, 2023 - 2030, USD Million
- TABLE 384 Malaysia Anomaly Detection Market by Technology, 2019 - 2022, USD Million
- TABLE 385 Malaysia Anomaly Detection Market by Technology, 2023 - 2030, USD Million
- TABLE 386 Malaysia Anomaly Detection Market by Component, 2019 - 2022, USD Million
- TABLE 387 Malaysia Anomaly Detection Market by Component, 2023 - 2030, USD Million
- TABLE 388 Malaysia Anomaly Detection Market by Solution Type, 2019 - 2022, USD Million
- TABLE 389 Malaysia Anomaly Detection Market by Solution Type, 2023 - 2030, USD Million
- TABLE 390 Malaysia Anomaly Detection Market by End-use, 2019 - 2022, USD Million
- TABLE 391 Malaysia Anomaly Detection Market by End-use, 2023 - 2030, USD Million
- TABLE 392 Rest of Asia Pacific Anomaly Detection Market, 2019 - 2022, USD Million
- TABLE 393 Rest of Asia Pacific Anomaly Detection Market, 2023 - 2030, USD Million
- TABLE 394 Rest of Asia Pacific Anomaly Detection Market by Deployment, 2019 - 2022, USD Million
- TABLE 395 Rest of Asia Pacific Anomaly Detection Market by Deployment, 2023 - 2030, USD Million
- TABLE 396 Rest of Asia Pacific Anomaly Detection Market by Technology, 2019 - 2022, USD Million
- TABLE 397 Rest of Asia Pacific Anomaly Detection Market by Technology, 2023 - 2030, USD Million
- TABLE 398 Rest of Asia Pacific Anomaly Detection Market by Component, 2019 - 2022, USD Million
- TABLE 399 Rest of Asia Pacific Anomaly Detection Market by Component, 2023 - 2030, USD Million
- TABLE 400 Rest of Asia Pacific Anomaly Detection Market by Solution Type, 2019 - 2022, USD Million
- TABLE 401 Rest of Asia Pacific Anomaly Detection Market by Solution Type, 2023 - 2030, USD Million
- TABLE 402 Rest of Asia Pacific Anomaly Detection Market by End-use, 2019 - 2022, USD Million
- TABLE 403 Rest of Asia Pacific Anomaly Detection Market by End-use, 2023 - 2030, USD Million
- TABLE 404 LAMEA Anomaly Detection Market, 2019 - 2022, USD Million
- TABLE 405 LAMEA Anomaly Detection Market, 2023 - 2030, USD Million
- TABLE 406 LAMEA Anomaly Detection Market by Deployment, 2019 - 2022, USD Million
- TABLE 407 LAMEA Anomaly Detection Market by Deployment, 2023 - 2030, USD Million
- TABLE 408 LAMEA On-premise Market by Country, 2019 - 2022, USD Million
- TABLE 409 LAMEA On-premise Market by Country, 2023 - 2030, USD Million
- TABLE 410 LAMEA Cloud Market by Country, 2019 - 2022, USD Million
- TABLE 411 LAMEA Cloud Market by Country, 2023 - 2030, USD Million
- TABLE 412 LAMEA Anomaly Detection Market by Technology, 2019 - 2022, USD Million
- TABLE 413 LAMEA Anomaly Detection Market by Technology, 2023 - 2030, USD Million
- TABLE 414 LAMEA Big Data Analytics Market by Country, 2019 - 2022, USD Million
- TABLE 415 LAMEA Big Data Analytics Market by Country, 2023 - 2030, USD Million
- TABLE 416 LAMEA Business Intelligence & Data Mining Market by Country, 2019 - 2022, USD Million
- TABLE 417 LAMEA Business Intelligence & Data Mining Market by Country, 2023 - 2030, USD Million
- TABLE 418 LAMEA Machine Learning & Artificial Intelligence Market by Country, 2019 - 2022, USD Million
- TABLE 419 LAMEA Machine Learning & Artificial Intelligence Market by Country, 2023 - 2030, USD Million
- TABLE 420 LAMEA Anomaly Detection Market by Component, 2019 - 2022, USD Million
- TABLE 421 LAMEA Anomaly Detection Market by Component, 2023 - 2030, USD Million
- TABLE 422 LAMEA Solution Market by Country, 2019 - 2022, USD Million
- TABLE 423 LAMEA Solution Market by Country, 2023 - 2030, USD Million
- TABLE 424 LAMEA Anomaly Detection Market by Solution Type, 2019 - 2022, USD Million
- TABLE 425 LAMEA Anomaly Detection Market by Solution Type, 2023 - 2030, USD Million
- TABLE 426 LAMEA Network Behavior Market by Country, 2019 - 2022, USD Million
- TABLE 427 LAMEA Network Behavior Market by Country, 2023 - 2030, USD Million
- TABLE 428 LAMEA User Behavior Market by Country, 2019 - 2022, USD Million
- TABLE 429 LAMEA User Behavior Market by Country, 2023 - 2030, USD Million
- TABLE 430 LAMEA Services Market by Country, 2019 - 2022, USD Million
- TABLE 431 LAMEA Services Market by Country, 2023 - 2030, USD Million
- TABLE 432 LAMEA Anomaly Detection Market by End-use, 2019 - 2022, USD Million
- TABLE 433 LAMEA Anomaly Detection Market by End-use, 2023 - 2030, USD Million
- TABLE 434 LAMEA BFSI Market by Country, 2019 - 2022, USD Million
- TABLE 435 LAMEA BFSI Market by Country, 2023 - 2030, USD Million
- TABLE 436 LAMEA Government & Defense Market by Country, 2019 - 2022, USD Million
- TABLE 437 LAMEA Government & Defense Market by Country, 2023 - 2030, USD Million
- TABLE 438 LAMEA IT & Telecom Market by Country, 2019 - 2022, USD Million
- TABLE 439 LAMEA IT & Telecom Market by Country, 2023 - 2030, USD Million
- TABLE 440 LAMEA Healthcare Market by Country, 2019 - 2022, USD Million
- TABLE 441 LAMEA Healthcare Market by Country, 2023 - 2030, USD Million
- TABLE 442 LAMEA Manufacturing Market by Country, 2019 - 2022, USD Million
- TABLE 443 LAMEA Manufacturing Market by Country, 2023 - 2030, USD Million
- TABLE 444 LAMEA Retail Market by Country, 2019 - 2022, USD Million
- TABLE 445 LAMEA Retail Market by Country, 2023 - 2030, USD Million
- TABLE 446 LAMEA Others Market by Country, 2019 - 2022, USD Million
- TABLE 447 LAMEA Others Market by Country, 2023 - 2030, USD Million
- TABLE 448 LAMEA Anomaly Detection Market by Country, 2019 - 2022, USD Million
- TABLE 449 LAMEA Anomaly Detection Market by Country, 2023 - 2030, USD Million
- TABLE 450 Brazil Anomaly Detection Market, 2019 - 2022, USD Million
- TABLE 451 Brazil Anomaly Detection Market, 2023 - 2030, USD Million
- TABLE 452 Brazil Anomaly Detection Market by Deployment, 2019 - 2022, USD Million
- TABLE 453 Brazil Anomaly Detection Market by Deployment, 2023 - 2030, USD Million
- TABLE 454 Brazil Anomaly Detection Market by Technology, 2019 - 2022, USD Million
- TABLE 455 Brazil Anomaly Detection Market by Technology, 2023 - 2030, USD Million
- TABLE 456 Brazil Anomaly Detection Market by Component, 2019 - 2022, USD Million
- TABLE 457 Brazil Anomaly Detection Market by Component, 2023 - 2030, USD Million
- TABLE 458 Brazil Anomaly Detection Market by Solution Type, 2019 - 2022, USD Million
- TABLE 459 Brazil Anomaly Detection Market by Solution Type, 2023 - 2030, USD Million
- TABLE 460 Brazil Anomaly Detection Market by End-use, 2019 - 2022, USD Million
- TABLE 461 Brazil Anomaly Detection Market by End-use, 2023 - 2030, USD Million
- TABLE 462 Argentina Anomaly Detection Market, 2019 - 2022, USD Million
- TABLE 463 Argentina Anomaly Detection Market, 2023 - 2030, USD Million
- TABLE 464 Argentina Anomaly Detection Market by Deployment, 2019 - 2022, USD Million
- TABLE 465 Argentina Anomaly Detection Market by Deployment, 2023 - 2030, USD Million
- TABLE 466 Argentina Anomaly Detection Market by Technology, 2019 - 2022, USD Million
- TABLE 467 Argentina Anomaly Detection Market by Technology, 2023 - 2030, USD Million
- TABLE 468 Argentina Anomaly Detection Market by Component, 2019 - 2022, USD Million
- TABLE 469 Argentina Anomaly Detection Market by Component, 2023 - 2030, USD Million
- TABLE 470 Argentina Anomaly Detection Market by Solution Type, 2019 - 2022, USD Million
- TABLE 471 Argentina Anomaly Detection Market by Solution Type, 2023 - 2030, USD Million
- TABLE 472 Argentina Anomaly Detection Market by End-use, 2019 - 2022, USD Million
- TABLE 473 Argentina Anomaly Detection Market by End-use, 2023 - 2030, USD Million
- TABLE 474 UAE Anomaly Detection Market, 2019 - 2022, USD Million
- TABLE 475 UAE Anomaly Detection Market, 2023 - 2030, USD Million
- TABLE 476 UAE Anomaly Detection Market by Deployment, 2019 - 2022, USD Million
- TABLE 477 UAE Anomaly Detection Market by Deployment, 2023 - 2030, USD Million
- TABLE 478 UAE Anomaly Detection Market by Technology, 2019 - 2022, USD Million
- TABLE 479 UAE Anomaly Detection Market by Technology, 2023 - 2030, USD Million
- TABLE 480 UAE Anomaly Detection Market by Component, 2019 - 2022, USD Million
- TABLE 481 UAE Anomaly Detection Market by Component, 2023 - 2030, USD Million
- TABLE 482 UAE Anomaly Detection Market by Solution Type, 2019 - 2022, USD Million
- TABLE 483 UAE Anomaly Detection Market by Solution Type, 2023 - 2030, USD Million
- TABLE 484 UAE Anomaly Detection Market by End-use, 2019 - 2022, USD Million
- TABLE 485 UAE Anomaly Detection Market by End-use, 2023 - 2030, USD Million
- TABLE 486 Saudi Arabia Anomaly Detection Market, 2019 - 2022, USD Million
- TABLE 487 Saudi Arabia Anomaly Detection Market, 2023 - 2030, USD Million
- TABLE 488 Saudi Arabia Anomaly Detection Market by Deployment, 2019 - 2022, USD Million
- TABLE 489 Saudi Arabia Anomaly Detection Market by Deployment, 2023 - 2030, USD Million
- TABLE 490 Saudi Arabia Anomaly Detection Market by Technology, 2019 - 2022, USD Million
- TABLE 491 Saudi Arabia Anomaly Detection Market by Technology, 2023 - 2030, USD Million
- TABLE 492 Saudi Arabia Anomaly Detection Market by Component, 2019 - 2022, USD Million
- TABLE 493 Saudi Arabia Anomaly Detection Market by Component, 2023 - 2030, USD Million
- TABLE 494 Saudi Arabia Anomaly Detection Market by Solution Type, 2019 - 2022, USD Million
- TABLE 495 Saudi Arabia Anomaly Detection Market by Solution Type, 2023 - 2030, USD Million
- TABLE 496 Saudi Arabia Anomaly Detection Market by End-use, 2019 - 2022, USD Million
- TABLE 497 Saudi Arabia Anomaly Detection Market by End-use, 2023 - 2030, USD Million
- TABLE 498 South Africa Anomaly Detection Market, 2019 - 2022, USD Million
- TABLE 499 South Africa Anomaly Detection Market, 2023 - 2030, USD Million
- TABLE 500 South Africa Anomaly Detection Market by Deployment, 2019 - 2022, USD Million
- TABLE 501 South Africa Anomaly Detection Market by Deployment, 2023 - 2030, USD Million
- TABLE 502 South Africa Anomaly Detection Market by Technology, 2019 - 2022, USD Million
- TABLE 503 South Africa Anomaly Detection Market by Technology, 2023 - 2030, USD Million
- TABLE 504 South Africa Anomaly Detection Market by Component, 2019 - 2022, USD Million
- TABLE 505 South Africa Anomaly Detection Market by Component, 2023 - 2030, USD Million
- TABLE 506 South Africa Anomaly Detection Market by Solution Type, 2019 - 2022, USD Million
- TABLE 507 South Africa Anomaly Detection Market by Solution Type, 2023 - 2030, USD Million
- TABLE 508 South Africa Anomaly Detection Market by End-use, 2019 - 2022, USD Million
- TABLE 509 South Africa Anomaly Detection Market by End-use, 2023 - 2030, USD Million
- TABLE 510 Nigeria Anomaly Detection Market, 2019 - 2022, USD Million
- TABLE 511 Nigeria Anomaly Detection Market, 2023 - 2030, USD Million
- TABLE 512 Nigeria Anomaly Detection Market by Deployment, 2019 - 2022, USD Million
- TABLE 513 Nigeria Anomaly Detection Market by Deployment, 2023 - 2030, USD Million
- TABLE 514 Nigeria Anomaly Detection Market by Technology, 2019 - 2022, USD Million
- TABLE 515 Nigeria Anomaly Detection Market by Technology, 2023 - 2030, USD Million
- TABLE 516 Nigeria Anomaly Detection Market by Component, 2019 - 2022, USD Million
- TABLE 517 Nigeria Anomaly Detection Market by Component, 2023 - 2030, USD Million
- TABLE 518 Nigeria Anomaly Detection Market by Solution Type, 2019 - 2022, USD Million
- TABLE 519 Nigeria Anomaly Detection Market by Solution Type, 2023 - 2030, USD Million
- TABLE 520 Nigeria Anomaly Detection Market by End-use, 2019 - 2022, USD Million
- TABLE 521 Nigeria Anomaly Detection Market by End-use, 2023 - 2030, USD Million
- TABLE 522 Rest of LAMEA Anomaly Detection Market, 2019 - 2022, USD Million
- TABLE 523 Rest of LAMEA Anomaly Detection Market, 2023 - 2030, USD Million
- TABLE 524 Rest of LAMEA Anomaly Detection Market by Deployment, 2019 - 2022, USD Million
- TABLE 525 Rest of LAMEA Anomaly Detection Market by Deployment, 2023 - 2030, USD Million
- TABLE 526 Rest of LAMEA Anomaly Detection Market by Technology, 2019 - 2022, USD Million
- TABLE 527 Rest of LAMEA Anomaly Detection Market by Technology, 2023 - 2030, USD Million
- TABLE 528 Rest of LAMEA Anomaly Detection Market by Component, 2019 - 2022, USD Million
- TABLE 529 Rest of LAMEA Anomaly Detection Market by Component, 2023 - 2030, USD Million
- TABLE 530 Rest of LAMEA Anomaly Detection Market by Solution Type, 2019 - 2022, USD Million
- TABLE 531 Rest of LAMEA Anomaly Detection Market by Solution Type, 2023 - 2030, USD Million
- TABLE 532 Rest of LAMEA Anomaly Detection Market by End-use, 2019 - 2022, USD Million
- TABLE 533 Rest of LAMEA Anomaly Detection Market by End-use, 2023 - 2030, USD Million
- TABLE 534 Key Information - Amazon Web Services, Inc.
- TABLE 535 Key Information - Broadcom, Inc.
- TABLE 536 Key Information - Cisco Systems, Inc.
- TABLE 537 Key Information - Dell Technologies, Inc.
- TABLE 538 Key Information - Dynatrace, Inc.
- TABLE 539 Key Information - Happiest Minds Technologies Limited
- TABLE 540 Key Information - Hewlett Packard Enterprise Company
- TABLE 541 Key information - IBM Corporation
- TABLE 542 key information - Microsoft Corporation
- TABLE 543 Key information - SAS Institute, Inc.
List of Figures
- FIG 1 Methodology for the research
- FIG 2 Global Anomaly Detection Market, 2019 - 2030, USD Million
- FIG 3 Key Factors Impacting the Market
- FIG 4 KBV Cardinal Matrix
- FIG 5 Market Share Analysis, 2021
- FIG 6 Key Leading Strategies: Percentage Distribution (2019-2023)
- FIG 7 Key Strategic Move: (Partnerships, Collaborations and Agreements: 2021, Aug - 2023, Jun) Leading Players
- FIG 8 Porter's Five Forces Analysis - Anomaly Detection Market
- FIG 9 Global Anomaly Detection Market share by Deployment, 2022
- FIG 10 Global Anomaly Detection Market share by Deployment, 2030
- FIG 11 Global Anomaly Detection Market by Deployment, 2019 - 2030, USD Million
- FIG 12 Global Anomaly Detection Market share by Technology, 2022
- FIG 13 Global Anomaly Detection Market share by Technology, 2030
- FIG 14 Global Anomaly Detection Market by Technology, 2019 - 2030, USD Million
- FIG 15 Global Anomaly Detection Market share by Component, 2022
- FIG 16 Global Anomaly Detection Market share by Component, 2030
- FIG 17 Global Anomaly Detection Market by Component, 2019 - 2030, USD Million
- FIG 18 Global Anomaly Detection Market share by End-use, 2022
- FIG 19 Global Anomaly Detection Market share by End-use, 2030
- FIG 20 Global Anomaly Detection Market by End-use, 2019 - 2030, USD Million
- FIG 21 Global Anomaly Detection Market share by Region, 2022
- FIG 22 Global Anomaly Detection Market share by Region, 2030
- FIG 23 Global Anomaly Detection Market by Region, 2019 - 2030, USD Million
- FIG 24 Recent strategies and developments: Amazon Web Services, Inc.
- FIG 25 SWOT analysis: Amazon.com, Inc.
- FIG 26 SWOT Analysis: Broadcom, Inc.
- FIG 27 SWOT Analysis: Cisco Systems, Inc.
- FIG 28 SWOT Analysis: Dell Technologies, Inc.
- FIG 29 SWOT Analysis: Dynatrace, Inc.
- FIG 30 SWOT Analysis: Happiest Minds Technologies Limited
- FIG 31 SWOT Analysis: Hewlett Packard Enterprise Company
- FIG 32 Recent strategies and developments: IBM Corporation
- FIG 33 Swot Analysis: IBM Corporation
- FIG 34 SWOT Analysis: Microsoft Corporation
- FIG 35 SWOT Analysis: SAS INSTITUTE, INC.
The Global Anomaly Detection Market size is expected to reach $13.4 billion by 2030, rising at a market growth of 15.9% CAGR during the forecast period.
The digital economy has swiftly grown throughout the region of Asia Pacific as a result of a strong increase in e-commerce activity, online transactions, and digital services. Consequently, the Asia Pacific region will acquire approximately 1/4th share in the market by 2030. The need for anomaly detection has grown due to this expansion to identify and handle potential fraud, security flaws, and other anomalies in these digital transactions. The regional financial services sector is expanding rapidly because of growing banking services, fintech advancements, and a rise in digital payments. Anomaly detection is crucial for Anti-Money Laundering (AML) initiatives, fraud prevention, and legal compliance in this sector.
The major strategies followed by the market participants are Partnerships as the key developmental strategy to keep pace with the changing demands of end users. For instance, In June, 20223, Amazon Web Services Inc. expanded its partnership with Lacework Inc. to enhance security alerts and provide its clients an improved anomaly detection linked with Amazon Guard Duty findings. Additionally, In December, 2021, Amazon Web Services, Inc. (AWS), an Amazon.com, Inc. company formed a collaboration with Pfizer, to develop a prototype solution for detecting abnormal data points in its drug product continuous clinical manufacturing platform for solid oral-dose medicines.
Based on the Analysis presented in the KBV Cardinal matrix; Microsoft Corporation is the forerunner in the Market. Companies such as Cisco Systems, Inc., Broadcom, Inc., Dell Technologies, Inc. are some of the key innovators in the Market. In March, 2022, Cisco Systems, Inc teamed up with NetApp to provide the joint customers of the two companies with automation, hybrid cloud operations, and visibility solutions.
Market Growth Factors
Increasing volume of data and connected devices
Anomaly detection is becoming increasingly necessary as the number of linked devices is increasing in banking, IT, healthcare, finance, manufacturing, and government & defense. The widespread use of IoT solutions that actively participate in various technological advancements significantly impacts the IoT industry. The market has seen an upsurge due to the increasing use of cloud-based IoT devices, which has increased competition to provide the best solutions to various end-use industries. Moreover, one of the main causes of the IoT industry's enormous development is considerable government attempts to digitalize businesses and sectors.
Artificial intelligence (AI) and machine learning (ML) advancements
The ability to detect anomalies has substantially increased because of developments in AI and machine learning techniques. Artificial intelligence (AI) may aid in many ways, including automation, real-time analysis, scrupulosity, accuracy, and self-learning, when human resources are insufficient to handle the adaptable framework of cloud infrastructure, microservices, and containers. One of the greatest benefits of AI systems as well as ML-based solutions, is their ability to learn as they go along and provide better and more accurate results with each iteration. Hence, AI-powered anomaly detection tools can evaluate complicated patterns, adapt to shifting surroundings, and accurately pinpoint anomalies, spurring market expansion.
Market Restraining Factors
Issues with false alarms and system implementation
Anomaly detection systems can be challenging to build and tune to identify true anomalies while avoiding false positives (or false alarms). High rates of false positives could reduce user confidence in the system's accuracy and lead to warning fatigue, which could prevent product uptake. False positive rates that are too high can cause alert fatigue and a lack of faith in the system, whereas false negative rates that are too low can leave serious anomalies unnoticed. For the market to expand, anomaly detection algorithms' accuracy must be improved. Integrating anomaly detection tools with current workflows and systems can be difficult and time-consuming. Implementing anomaly detection technology may be slowed down by organizations facing compatibility problems with legacy systems. Thus, these factors may hamper the market's growth in the coming years.
Deployment Outlook
Based on deployment, the market is segmented into cloud and on-premise. The cloud segment acquired a substantial revenue share in the market in 2022. Cloud-based anomaly detection systems are unsurpassed in their adaptability and scalability. Organizations may easily scale up or down anomaly detection capabilities in accordance with their needs because of cloud infrastructure. Because data processing and volume requirements fluctuate over time, organizations don't need to spend much money on infrastructure or plan for capacity with cloud infrastructure.
Technology Outlook
On the basis of technology, the market is classified into machine learning & artificial intelligence, big data analytics, and business intelligence & data mining. The big data analytics segment recorded the largest revenue share in the market in 2022. As connected devices and digital technology advance, businesses produce and collect large amounts of data from multiple sources. Manually finding irregularities can be challenging because this data is available in both unstructured, structured, and semi-structured, formats.
Component Outlook
Based on component, the market is bifurcated into solution and services. The services segment procured a considerable growth rate in the market in 2022. Cloud-based security service solutions commonly incorporate anomaly detection services. With the help of these services, enterprises can easily and affordably set up as well as maintain anomaly detection operations.
Solution Outlook
On the basis of the solution, the market is classified into network behavior and user behavior. The network behavior segment acquired the largest revenue share in the market in 2022. Network behavior analysis is required for the operation of network behavior anomaly detection. Machine learning (ML) and artificial intelligence (AI) are used in network behavior anomaly detection to identify hidden hazards in areas of network infrastructure where other security technologies cannot access them and to alert network personnel.
End-Use Outlook
By end-use, the market is characterized into BFSI, retail, IT & telecom, healthcare, manufacturing, government & defense, and others. The BFSI segment garnered the maximum revenue share in the market in 2022. Risk management is crucial to the BFSI industry. Anomaly detection makes it possible to identify potential risks, including market risk, operational risk, credit risk, and fraud risk. By identifying anomalies in financial transactions, customer behavior, or market patterns, organizations can assess and minimize risks, make intelligent decisions, and prevent financial losses.
Regional Outlook
Region wise, the market is analyzed across North America, Europe, Asia Pacific, and LAMEA. The North America segment recorded the highest revenue share in the market in 2022. The continent of North America is subject to an unstable environment that is changing quickly, especially regarding cybersecurity. The proliferation of digital technology, along with the development of big data, has also led to huge data production and collection by companies. Anomaly detection is essential for spotting fraudulent activities in the insurance, e-commerce, financial, and healthcare sectors. By monitoring patterns and anomalies in transactional data or user behavior, businesses can proactively identify and lower the risk of fraud.
The market research report covers the analysis of key stake holders of the market. Key companies profiled in the report include Amazon Web Services, Inc., Broadcom, Inc., Cisco Systems, Inc., Dell Technologies, Inc., Dynatrace, Inc., Happiest Minds Technologies Limited, Hewlett Packard Enterprise Company, IBM Corporation, Microsoft Corporation and SAS Institute, Inc.
Recent Strategies Deployed in Anomaly Detection Market
Partnerships, Collaboration and Agreements:
Jun-2023: Amazon Web Services Inc. expanded its partnership with Lacework Inc., a cloud security company. Lacework would integrate its services with AWS Security Hub to enhance security alerts and provide its clients an improved anomaly detection linked with Amazon GuardDuty findings.
May-2023: Amazon Web Services joined hands with Elastic, distributed, free, and open search and analytics engine for all types of data. The collaboration aims at offering a seamless user experience for Elastic Cloud on AWS. Moreover, it would support its client's global cloud adoption journey and help boost their digital transformation.
Nov-2022: Happiest Minds Technologies Limited formed a collaboration with ServiceNow, a software company that provides a cloud-based platform for automating IT management workflows. With this collaboration, the company aims to enhance its IT service offerings globally.
May-2022: IBM Corporation signed an agreement with Amazon Web Services (AWS), a subsidiary of Amazon that provides on-demand cloud computing platforms and APIs to individuals, companies, and governments. This agreement would deliver IBM's clients easy and rapid access to IBM Software that covers Data and AI, Security, Sustainability, and Automation abilities.
Mar-2022: Cisco Systems, Inc teamed up with NetApp, a data management solutions provider. The partnership would provide the joint customers of the two companies with automation, hybrid cloud operations, and visibility solutions.
Dec-2021: Amazon Web Services, Inc. (AWS), an Amazon.com, Inc. company formed a collaboration with Pfizer, an American multinational pharmaceutical and biotechnology corporation. The company would apply its analytics, machine learning, computing, storage, security, and cloud data warehousing capabilities to Pfizer laboratory, clinical manufacturing, and clinical supply chain efforts. Furthermore, the company aimed to develop a prototype solution for detecting abnormal data points in its drug product continuous clinical manufacturing platform for solid oral-dose medicines.
Aug-2021: IBM teamed up with Black & Veatch, an engineering, procurement, consulting, and construction company. The collaboration integrates Black & Veatch Asset Management Services (AMS) and digital analytics with IBM Maximo Application Suite to enhance the performance of assets and extend their lifespans.
Product Launch and Product Expansions:
Mar-2021: Amazon Web Services revealed Amazon Lookout for Metrics, an anomaly detection service, to monitor the health of its client's businesses. The new service aims at opening machine learning technology to more manufacturing plants by removing barriers involved in developing, training, deploying, monitoring, and fine-tuning computer vision models.
Acquisitions and Merger:
Mar-2023: Cisco Systems, Inc completed the acquisition of Lightspin Technologies Ltd., a security software provider based in Israel. The acquisition would enhance Cisco's ability to deliver secure solutions for cloud environments to their customers.
Jul-2022: IBM took over Databand.ai, a leading provider of data observability software. This acquisition aimed to provide IBM with the most comprehensive set of observability offerings for IT across applications, data, and machine learning and would continue to provide IBM's customers and partners with the technology they require to provide trustworthy data and AI at scale.
Mar-2022: Microsoft took over Nuance Communications, a leader in conversational AI and ambient intelligence industries. This acquisition aimed to bring together Nuance's best-in-class conversational AI and ambient intelligence with Microsoft's secure as well as trusted industry cloud offerings. Also, this acquisition would help providers offer more affordable, effective, and accessible healthcare, and help businesses in every industry create more personalized and meaningful customer experiences.
Scope of the Study
Market Segments covered in the Report:
By Deployment
- On-premise
- Cloud
By Technology
- Big Data Analytics
- Business Intelligence & Data Mining
- Machine Learning & Artificial Intelligence
By Component
- Solution
- Network Behavior
- User Behavior
- Services
By End-Use
- BFSI
- Government & Defense
- IT & Telecom
- Healthcare
- Manufacturing
- Retail
- Others
By Geography
- North America
- US
- Canada
- Mexico
- Rest of North America
- Europe
- Germany
- UK
- France
- Russia
- Spain
- Italy
- Rest of Europe
- Asia Pacific
- China
- Japan
- India
- South Korea
- Singapore
- Malaysia
- Rest of Asia Pacific
- LAMEA
- Brazil
- Argentina
- UAE
- Saudi Arabia
- South Africa
- Nigeria
- Rest of LAMEA
Companies Profiled
- Amazon Web Services, Inc.
- Broadcom, Inc.
- Cisco Systems, Inc.
- Dell Technologies, Inc.
- Dynatrace, Inc.
- Happiest Minds Technologies Limited
- Hewlett Packard Enterprise Company
- IBM Corporation
- Microsoft Corporation
- SAS Institute, Inc.
Unique Offerings from KBV Research
- Exhaustive coverage
- Highest number of market tables and figures
- Subscription based model available
- Guaranteed best price
- Assured post sales research support with 10% customization free
Table of Contents
Chapter 1. Market Scope & Methodology
- 1.1 Market Definition
- 1.2 Objectives
- 1.3 Market Scope
- 1.4 Segmentation
- 1.4.1 Global Anomaly Detection Market, by Deployment
- 1.4.2 Global Anomaly Detection Market, by Technology
- 1.4.3 Global Anomaly Detection Market, by Component
- 1.4.4 Global Anomaly Detection Market, by End-Use
- 1.4.5 Global Anomaly Detection Market, by Geography
- 1.5 Methodology for the research
Chapter 2. Market At a Glance
- 2.1 Key Highlight
Chapter 3. Market Overview
- 3.1 Introduction
- 3.1.1 Overview
- 3.1.1.1 Market Composition and Scenario
- 3.1.1 Overview
- 3.2 Key Factors Impacting the Market
- 3.2.1 Market Drivers
- 3.2.2 Market Restraints
Chapter 4. Competition Analysis - Global
- 4.1 KBV Cardinal Matrix
- 4.2 Recent Industry Wide Strategic Developments
- 4.2.1 Partnerships, Collaborations and Agreements
- 4.2.2 Product Launches and Product Expansions
- 4.2.3 Acquisition and Mergers
- 4.3 Market Share Analysis, 2021
- 4.4 Top Winning Strategies
- 4.4.1 Key Leading Strategies: Percentage Distribution (2019-2023)
- 4.4.2 Key Strategic Move: (Partnerships, Collaborations and Agreements: 2021, Aug - 2023, Jun) Leading Players
- 4.5 Porter Five Forces Analysis
Chapter 5. Global Anomaly Detection Market by Deployment
- 5.1 Global On-premise Market by Region
- 5.2 Global Cloud Market by Region
Chapter 6. Global Anomaly Detection Market by Technology
- 6.1 Global Big Data Analytics Market by Region
- 6.2 Global Business Intelligence & Data Mining Market by Region
- 6.3 Global Machine Learning & Artificial Intelligence Market by Region
Chapter 7. Global Anomaly Detection Market by Component
- 7.1 Global Solution Market by Region
- 7.2 Global Anomaly Detection Market by Solution Type
- 7.2.1 Global Network Behavior Market by Region
- 7.2.2 Global User Behavior Market by Region
- 7.3 Global Services Market by Region
Chapter 8. Global Anomaly Detection Market by End-use
- 8.1 Global BFSI Market by Region
- 8.2 Global Government & Defense Market by Region
- 8.3 Global IT & Telecom Market by Region
- 8.4 Global Healthcare Market by Region
- 8.5 Global Manufacturing Market by Region
- 8.6 Global Retail Market by Region
- 8.7 Global Others Market by Region
Chapter 9. Global Anomaly Detection Market by Region
- 9.1 North America Anomaly Detection Market
- 9.1.1 North America Anomaly Detection Market by Deployment
- 9.1.1.1 North America On-premise Market by Country
- 9.1.1.2 North America Cloud Market by Country
- 9.1.2 North America Anomaly Detection Market by Technology
- 9.1.2.1 North America Big Data Analytics Market by Country
- 9.1.2.2 North America Business Intelligence & Data Mining Market by Country
- 9.1.2.3 North America Machine Learning & Artificial Intelligence Market by Country
- 9.1.3 North America Anomaly Detection Market by Component
- 9.1.3.1 North America Solution Market by Country
- 9.1.3.2 North America Anomaly Detection Market by Solution Type
- 9.1.3.2.1 North America Network Behavior Market by Country
- 9.1.3.2.2 North America User Behavior Market by Country
- 9.1.3.3 North America Services Market by Country
- 9.1.4 North America Anomaly Detection Market by End-use
- 9.1.4.1 North America BFSI Market by Country
- 9.1.4.2 North America Government & Defense Market by Country
- 9.1.4.3 North America IT & Telecom Market by Country
- 9.1.4.4 North America Healthcare Market by Country
- 9.1.4.5 North America Manufacturing Market by Country
- 9.1.4.6 North America Retail Market by Country
- 9.1.4.7 North America Others Market by Country
- 9.1.5 North America Anomaly Detection Market by Country
- 9.1.5.1 US Anomaly Detection Market
- 9.1.5.1.1 US Anomaly Detection Market by Deployment
- 9.1.5.1.2 US Anomaly Detection Market by Technology
- 9.1.5.1.3 US Anomaly Detection Market by Component
- 9.1.5.1.4 US Anomaly Detection Market by End-use
- 9.1.5.2 Canada Anomaly Detection Market
- 9.1.5.2.1 Canada Anomaly Detection Market by Deployment
- 9.1.5.2.2 Canada Anomaly Detection Market by Technology
- 9.1.5.2.3 Canada Anomaly Detection Market by Component
- 9.1.5.2.4 Canada Anomaly Detection Market by End-use
- 9.1.5.3 Mexico Anomaly Detection Market
- 9.1.5.3.1 Mexico Anomaly Detection Market by Deployment
- 9.1.5.3.2 Mexico Anomaly Detection Market by Technology
- 9.1.5.3.3 Mexico Anomaly Detection Market by Component
- 9.1.5.3.4 Mexico Anomaly Detection Market by End-use
- 9.1.5.4 Rest of North America Anomaly Detection Market
- 9.1.5.4.1 Rest of North America Anomaly Detection Market by Deployment
- 9.1.5.4.2 Rest of North America Anomaly Detection Market by Technology
- 9.1.5.4.3 Rest of North America Anomaly Detection Market by Component
- 9.1.5.4.4 Rest of North America Anomaly Detection Market by End-use
- 9.1.5.1 US Anomaly Detection Market
- 9.1.1 North America Anomaly Detection Market by Deployment
- 9.2 Europe Anomaly Detection Market
- 9.2.1 Europe Anomaly Detection Market by Deployment
- 9.2.1.1 Europe On-premise Market by Country
- 9.2.1.2 Europe Cloud Market by Country
- 9.2.2 Europe Anomaly Detection Market by Technology
- 9.2.2.1 Europe Big Data Analytics Market by Country
- 9.2.2.2 Europe Business Intelligence & Data Mining Market by Country
- 9.2.2.3 Europe Machine Learning & Artificial Intelligence Market by Country
- 9.2.3 Europe Anomaly Detection Market by Component
- 9.2.3.1 Europe Solution Market by Country
- 9.2.3.2 Europe Anomaly Detection Market by Solution Type
- 9.2.3.2.1 Europe Network Behavior Market by Country
- 9.2.3.2.2 Europe User Behavior Market by Country
- 9.2.3.3 Europe Services Market by Country
- 9.2.4 Europe Anomaly Detection Market by End-use
- 9.2.4.1 Europe BFSI Market by Country
- 9.2.4.2 Europe Government & Defense Market by Country
- 9.2.4.3 Europe IT & Telecom Market by Country
- 9.2.4.4 Europe Healthcare Market by Country
- 9.2.4.5 Europe Manufacturing Market by Country
- 9.2.4.6 Europe Retail Market by Country
- 9.2.4.7 Europe Others Market by Country
- 9.2.5 Europe Anomaly Detection Market by Country
- 9.2.5.1 Germany Anomaly Detection Market
- 9.2.5.1.1 Germany Anomaly Detection Market by Deployment
- 9.2.5.1.2 Germany Anomaly Detection Market by Technology
- 9.2.5.1.3 Germany Anomaly Detection Market by Component
- 9.2.5.1.4 Germany Anomaly Detection Market by End-use
- 9.2.5.2 UK Anomaly Detection Market
- 9.2.5.2.1 UK Anomaly Detection Market by Deployment
- 9.2.5.2.2 UK Anomaly Detection Market by Technology
- 9.2.5.2.3 UK Anomaly Detection Market by Component
- 9.2.5.2.4 UK Anomaly Detection Market by End-use
- 9.2.5.3 France Anomaly Detection Market
- 9.2.5.3.1 France Anomaly Detection Market by Deployment
- 9.2.5.3.2 France Anomaly Detection Market by Technology
- 9.2.5.3.3 France Anomaly Detection Market by Component
- 9.2.5.3.4 France Anomaly Detection Market by End-use
- 9.2.5.4 Russia Anomaly Detection Market
- 9.2.5.4.1 Russia Anomaly Detection Market by Deployment
- 9.2.5.4.2 Russia Anomaly Detection Market by Technology
- 9.2.5.4.3 Russia Anomaly Detection Market by Component
- 9.2.5.4.4 Russia Anomaly Detection Market by End-use
- 9.2.5.5 Spain Anomaly Detection Market
- 9.2.5.5.1 Spain Anomaly Detection Market by Deployment
- 9.2.5.5.2 Spain Anomaly Detection Market by Technology
- 9.2.5.5.3 Spain Anomaly Detection Market by Component
- 9.2.5.5.4 Spain Anomaly Detection Market by End-use
- 9.2.5.6 Italy Anomaly Detection Market
- 9.2.5.6.1 Italy Anomaly Detection Market by Deployment
- 9.2.5.6.2 Italy Anomaly Detection Market by Technology
- 9.2.5.6.3 Italy Anomaly Detection Market by Component
- 9.2.5.6.4 Italy Anomaly Detection Market by End-use
- 9.2.5.7 Rest of Europe Anomaly Detection Market
- 9.2.5.7.1 Rest of Europe Anomaly Detection Market by Deployment
- 9.2.5.7.2 Rest of Europe Anomaly Detection Market by Technology
- 9.2.5.7.3 Rest of Europe Anomaly Detection Market by Component
- 9.2.5.7.4 Rest of Europe Anomaly Detection Market by End-use
- 9.2.5.1 Germany Anomaly Detection Market
- 9.2.1 Europe Anomaly Detection Market by Deployment
- 9.3 Asia Pacific Anomaly Detection Market
- 9.3.1 Asia Pacific Anomaly Detection Market by Deployment
- 9.3.1.1 Asia Pacific On-premise Market by Country
- 9.3.1.2 Asia Pacific Cloud Market by Country
- 9.3.2 Asia Pacific Anomaly Detection Market by Technology
- 9.3.2.1 Asia Pacific Big Data Analytics Market by Country
- 9.3.2.2 Asia Pacific Business Intelligence & Data Mining Market by Country
- 9.3.2.3 Asia Pacific Machine Learning & Artificial Intelligence Market by Country
- 9.3.3 Asia Pacific Anomaly Detection Market by Component
- 9.3.3.1 Asia Pacific Solution Market by Country
- 9.3.3.2 Asia Pacific Anomaly Detection Market by Solution Type
- 9.3.3.2.1 Asia Pacific Network Behavior Market by Country
- 9.3.3.2.2 Asia Pacific User Behavior Market by Country
- 9.3.3.3 Asia Pacific Services Market by Country
- 9.3.4 Asia Pacific Anomaly Detection Market by End-use
- 9.3.4.1 Asia Pacific BFSI Market by Country
- 9.3.4.2 Asia Pacific Government & Defense Market by Country
- 9.3.4.3 Asia Pacific IT & Telecom Market by Country
- 9.3.4.4 Asia Pacific Healthcare Market by Country
- 9.3.4.5 Asia Pacific Manufacturing Market by Country
- 9.3.4.6 Asia Pacific Retail Market by Country
- 9.3.4.7 Asia Pacific Others Market by Country
- 9.3.5 Asia Pacific Anomaly Detection Market by Country
- 9.3.5.1 China Anomaly Detection Market
- 9.3.5.1.1 China Anomaly Detection Market by Deployment
- 9.3.5.1.2 China Anomaly Detection Market by Technology
- 9.3.5.1.3 China Anomaly Detection Market by Component
- 9.3.5.1.4 China Anomaly Detection Market by End-use
- 9.3.5.2 Japan Anomaly Detection Market
- 9.3.5.2.1 Japan Anomaly Detection Market by Deployment
- 9.3.5.2.2 Japan Anomaly Detection Market by Technology
- 9.3.5.2.3 Japan Anomaly Detection Market by Component
- 9.3.5.2.4 Japan Anomaly Detection Market by End-use
- 9.3.5.3 India Anomaly Detection Market
- 9.3.5.3.1 India Anomaly Detection Market by Deployment
- 9.3.5.3.2 India Anomaly Detection Market by Technology
- 9.3.5.3.3 India Anomaly Detection Market by Component
- 9.3.5.3.4 India Anomaly Detection Market by End-use
- 9.3.5.4 South Korea Anomaly Detection Market
- 9.3.5.4.1 South Korea Anomaly Detection Market by Deployment
- 9.3.5.4.2 South Korea Anomaly Detection Market by Technology
- 9.3.5.4.3 South Korea Anomaly Detection Market by Component
- 9.3.5.4.4 South Korea Anomaly Detection Market by End-use
- 9.3.5.5 Singapore Anomaly Detection Market
- 9.3.5.5.1 Singapore Anomaly Detection Market by Deployment
- 9.3.5.5.2 Singapore Anomaly Detection Market by Technology
- 9.3.5.5.3 Singapore Anomaly Detection Market by Component
- 9.3.5.5.4 Singapore Anomaly Detection Market by End-use
- 9.3.5.6 Malaysia Anomaly Detection Market
- 9.3.5.6.1 Malaysia Anomaly Detection Market by Deployment
- 9.3.5.6.2 Malaysia Anomaly Detection Market by Technology
- 9.3.5.6.3 Malaysia Anomaly Detection Market by Component
- 9.3.5.6.4 Malaysia Anomaly Detection Market by End-use
- 9.3.5.7 Rest of Asia Pacific Anomaly Detection Market
- 9.3.5.7.1 Rest of Asia Pacific Anomaly Detection Market by Deployment
- 9.3.5.7.2 Rest of Asia Pacific Anomaly Detection Market by Technology
- 9.3.5.7.3 Rest of Asia Pacific Anomaly Detection Market by Component
- 9.3.5.7.4 Rest of Asia Pacific Anomaly Detection Market by End-use
- 9.3.5.1 China Anomaly Detection Market
- 9.3.1 Asia Pacific Anomaly Detection Market by Deployment
- 9.4 LAMEA Anomaly Detection Market
- 9.4.1 LAMEA Anomaly Detection Market by Deployment
- 9.4.1.1 LAMEA On-premise Market by Country
- 9.4.1.2 LAMEA Cloud Market by Country
- 9.4.2 LAMEA Anomaly Detection Market by Technology
- 9.4.2.1 LAMEA Big Data Analytics Market by Country
- 9.4.2.2 LAMEA Business Intelligence & Data Mining Market by Country
- 9.4.2.3 LAMEA Machine Learning & Artificial Intelligence Market by Country
- 9.4.3 LAMEA Anomaly Detection Market by Component
- 9.4.3.1 LAMEA Solution Market by Country
- 9.4.3.2 LAMEA Anomaly Detection Market by Solution Type
- 9.4.3.2.1 LAMEA Network Behavior Market by Country
- 9.4.3.2.2 LAMEA User Behavior Market by Country
- 9.4.3.3 LAMEA Services Market by Country
- 9.4.4 LAMEA Anomaly Detection Market by End-use
- 9.4.4.1 LAMEA BFSI Market by Country
- 9.4.4.2 LAMEA Government & Defense Market by Country
- 9.4.4.3 LAMEA IT & Telecom Market by Country
- 9.4.4.4 LAMEA Healthcare Market by Country
- 9.4.4.5 LAMEA Manufacturing Market by Country
- 9.4.4.6 LAMEA Retail Market by Country
- 9.4.4.7 LAMEA Others Market by Country
- 9.4.5 LAMEA Anomaly Detection Market by Country
- 9.4.5.1 Brazil Anomaly Detection Market
- 9.4.5.1.1 Brazil Anomaly Detection Market by Deployment
- 9.4.5.1.2 Brazil Anomaly Detection Market by Technology
- 9.4.5.1.3 Brazil Anomaly Detection Market by Component
- 9.4.5.1.4 Brazil Anomaly Detection Market by End-use
- 9.4.5.2 Argentina Anomaly Detection Market
- 9.4.5.2.1 Argentina Anomaly Detection Market by Deployment
- 9.4.5.2.2 Argentina Anomaly Detection Market by Technology
- 9.4.5.2.3 Argentina Anomaly Detection Market by Component
- 9.4.5.2.4 Argentina Anomaly Detection Market by End-use
- 9.4.5.3 UAE Anomaly Detection Market
- 9.4.5.3.1 UAE Anomaly Detection Market by Deployment
- 9.4.5.3.2 UAE Anomaly Detection Market by Technology
- 9.4.5.3.3 UAE Anomaly Detection Market by Component
- 9.4.5.3.4 UAE Anomaly Detection Market by End-use
- 9.4.5.4 Saudi Arabia Anomaly Detection Market
- 9.4.5.4.1 Saudi Arabia Anomaly Detection Market by Deployment
- 9.4.5.4.2 Saudi Arabia Anomaly Detection Market by Technology
- 9.4.5.4.3 Saudi Arabia Anomaly Detection Market by Component
- 9.4.5.4.4 Saudi Arabia Anomaly Detection Market by End-use
- 9.4.5.5 South Africa Anomaly Detection Market
- 9.4.5.5.1 South Africa Anomaly Detection Market by Deployment
- 9.4.5.5.2 South Africa Anomaly Detection Market by Technology
- 9.4.5.5.3 South Africa Anomaly Detection Market by Component
- 9.4.5.5.4 South Africa Anomaly Detection Market by End-use
- 9.4.5.6 Nigeria Anomaly Detection Market
- 9.4.5.6.1 Nigeria Anomaly Detection Market by Deployment
- 9.4.5.6.2 Nigeria Anomaly Detection Market by Technology
- 9.4.5.6.3 Nigeria Anomaly Detection Market by Component
- 9.4.5.6.4 Nigeria Anomaly Detection Market by End-use
- 9.4.5.7 Rest of LAMEA Anomaly Detection Market
- 9.4.5.7.1 Rest of LAMEA Anomaly Detection Market by Deployment
- 9.4.5.7.2 Rest of LAMEA Anomaly Detection Market by Technology
- 9.4.5.7.3 Rest of LAMEA Anomaly Detection Market by Component
- 9.4.5.7.4 Rest of LAMEA Anomaly Detection Market by End-use
- 9.4.5.1 Brazil Anomaly Detection Market
- 9.4.1 LAMEA Anomaly Detection Market by Deployment
Chapter 10. Company Profiles
- 10.1 Amazon Web Services, Inc. (Amazon.com, Inc.)
- 10.1.1 Company Overview
- 10.1.2 Financial Analysis
- 10.1.3 Segmental Analysis
- 10.1.4 Recent strategies and developments:
- 10.1.4.1 Partnerships, Collaborations, and Agreements:
- 10.1.4.2 Product Launches and Product Expansions:
- 10.1.5 SWOT Analysis
- 10.2 Broadcom, Inc.
- 10.2.1 Company Overview
- 10.2.2 Financial Analysis
- 10.2.3 Segmental and Regional Analysis
- 10.2.4 Research & Development Expense
- 10.2.5 Recent strategies and developments:
- 10.2.5.1 Acquisition and Mergers:
- 10.2.6 SWOT Analysis
- 10.3 Cisco Systems, Inc.
- 10.3.1 Company Overview
- 10.3.2 Financial Analysis
- 10.3.3 Regional Analysis
- 10.3.4 Research & Development Expense
- 10.3.5 Recent strategies and developments:
- 10.3.5.1 Partnerships, Collaborations, and Agreements:
- 10.3.5.2 Acquisition and Mergers:
- 10.3.6 SWOT Analysis
- 10.4 Dell Technologies, Inc.
- 10.4.1 Company Overview
- 10.4.2 Financial Analysis
- 10.4.3 Segmental and Regional Analysis
- 10.4.4 Research & Development Expense
- 10.4.5 SWOT Analysis:
- 10.5 Dynatrace, Inc.
- 10.5.1 Company Overview
- 10.5.2 SWOT Analysis:
- 10.6 Happiest Minds Technologies Limited
- 10.6.1 Company Overview
- 10.6.2 Recent strategies and developments:
- 10.6.2.1 Partnerships, Collaborations, and Agreements:
- 10.6.3 SWOT Analysis:
- 10.7 Hewlett Packard Enterprise Company
- 10.7.1 Company Overview
- 10.7.2 Financial Analysis
- 10.7.3 Segmental and Regional Analysis
- 10.7.4 Research & Development Expense
- 10.7.5 SWOT Analysis
- 10.8 IBM Corporation
- 10.8.1 Company Overview
- 10.8.2 Financial Analysis
- 10.8.3 Regional & Segmental Analysis
- 10.8.4 Research & Development Expenses
- 10.8.5 Recent strategies and developments:
- 10.8.5.1 Partnerships, Collaborations, and Agreements:
- 10.8.5.2 Product Launches and Product Expansions:
- 10.8.5.3 Acquisition and Mergers:
- 10.8.6 SWOT Analysis
- 10.9 Microsoft Corporation
- 10.9.1 Company Overview
- 10.9.2 Financial Analysis
- 10.9.3 Segmental and Regional Analysis
- 10.9.4 Research & Development Expenses
- 10.9.5 Recent strategies and developments:
- 10.9.5.1 Acquisition and Mergers:
- 10.9.6 SWOT Analysis
- 10.10. SAS Institute, Inc.
- 10.10.1 Company Overview
- 10.10.2 SWOT Analysis
