|
|
市場調査レポート
商品コード
1309729
小売業におけるバーチャルリアリティの世界市場規模、シェア、産業動向分析レポート:用途別、コンポーネント別、デバイス別、業種別、地域別展望と予測、2023年~2030年Global Virtual Reality In Retail Market Size, Share & Industry Trends Analysis Report By Application, By Component, By Device, By Vertical, By Regional Outlook and Forecast, 2023 - 2030 |
||||||
|
|
|||||||
|
|||||||


| 小売業におけるバーチャルリアリティの世界市場規模、シェア、産業動向分析レポート:用途別、コンポーネント別、デバイス別、業種別、地域別展望と予測、2023年~2030年 |
|
出版日: 2023年06月30日
発行: KBV Research
ページ情報: 英文 253 Pages
納期: 即納可能
|

- 全表示
- 概要
- 図表
- 目次
小売業におけるバーチャルリアリティ市場規模は2030年までに204億米ドルに達し、予測期間中のCAGRは26.9%で上昇すると予測されています。
しかし、未来の店舗は、eコマースの利点である手軽さと、実店舗の利点である商品調査のしやすさを併せ持つ、デジタルとリアルのハイブリッドな世界となると思われます。伝統的な小売企業は、デジタル・マーチャンダイジングの価値と、オンラインでの第一印象の影響力を認識しています。こうした側面を総合的に考慮すると、市場は予測期間中、成長が鈍化する可能性があります。
コンポーネントの展望
コンポーネントに基づき、市場はハードウェア、ソフトウェア、サービスに区分されます。2022年には、ハードウェア分野が市場で最も高い収益シェアを占めました。ディスプレイ解像度、快適性、全体的な性能に顕著な重点を置いたヘッドセットの開発が進みます。さらに、視線追跡技術によって洞察力のある消費者データの収集が可能になり、ジェスチャーとモーショントラッキングによってユーザーとのインタラクションが向上します。より広範な小売店や顧客にサービスを提供するために、拡張可能で安価なVRソリューションが求められていることも、市場のハードウェア革新を後押しする要因であり、最終的にはこのセグメントの拡大を支えることになると思われます。
デバイスの展望
デバイスによって、市場はヘッドマウントデバイス、ジェスチャートラッキングデバイス、プロジェクター&ディスプレイウォールに分類されます。2022年には、ヘッドマウントデバイス部門が最大の収益シェアで市場を独占しました。Oculus Rift、HTC Vive、PlayStation VRのようなVRヘッドセットに対する消費者の需要が、このセグメントの拡大を牽引しています。バーチャル製品デモ、バーチャル試着、バーチャル店舗訪問など、さまざまな小売用途において、これらのヘッドセットは没入体験を提供し、さまざまな小売店舗で頻繁に使用されています。HMDの需要は、価格の低下と技術の向上に伴って増加すると予測され、市場の重要な収益源としての地位を高めています。
用途の展望
用途別では、情報システム、広告・マーケティング、試着ソリューション、企画・設計に分類されます。プランニング&デザイン分野は、2022年の市場でかなりの収益シェアを占めました。これは、バーチャルリアリティが、ビジュアル広告、店舗プロトタイプ、店舗デザイン&レイアウトなど、小売部門に提供するメリットがあるためです。さらに、バーチャル店舗レイアウト&デザインを実際のスペースに適用する前に、小売業者はVR技術を使ってそれらを見たり作ったりすることができます。また、バーチャル・リアリティを利用して、商品の配置、棚の構成、デザインの変更などを試すこともでき、今後数年間の市場成長をさらに促進すると予想されます。
業界別展望
業界別に見ると、市場は飲食品、家庭用品、衣料品、家電製品に細分化されます。2022年には、飲食品セグメントが市場で突出した収益シェアを予測しました。顧客はメニューを探索し、バーチャル店員と関わり、バーチャル・レストラン環境に没頭することができます。この開発は、食事体験全体を向上させ、飲食品小売分野におけるVRの開発を促進します。顧客はこの動向を利用して、予約や料理の注文をする前に食事の選択肢を下見したり体験したりすることができます。
地域別展望
地域別に見ると、市場は北米、欧州、アジア太平洋、LAMEAで分析されます。2022年には、北米地域が市場で最大の収益シェアを占めました。これは、同地域のデジタル化の進展とバーチャルリアリティ技術の進歩に起因しています。さらに、同地域の市場成長は、可処分所得の高さと、スクリーンとプロセッサを備えたヘッドセットの価格下落によって促進されると予測されています。また、同地域の店舗間競争の激化や、より良い顧客購買体験に対するニーズの高まりも、小売市場におけるバーチャルリアリティの拡大に拍車をかけると予想されます。
目次
第1章 市場範囲と調査手法
- 市場の定義
- 目的
- 市場範囲
- セグメンテーション
- 調査手法
第2章 市場概要
- イントロダクション
- 概要
- 市場構成とシナリオ
- 概要
- 市場に影響を与える主な要因
- 市場促進要因
- 市場抑制要因
第3章 小売業におけるバーチャルリアリティの世界市場:用途別
- 世界の広告およびマーケティング市場:地域別
- 世界の試着ソリューション市場:地域別
- 世界の企画・設計市場:地域別
- 世界の情報システム市場:地域別
第4章 小売業におけるバーチャルリアリティの世界市場:コンポーネント別
- 世界のハードウェア市場:地域別
- 世界のソフトウェア市場:地域別
- 世界サービス市場:地域別
第5章 小売業におけるバーチャルリアリティの世界市場:デバイス別
- 世界のヘッドマウントデバイス市場:地域別
- 世界のジェスチャ追跡デバイス市場:地域別
- 世界のプロジェクターおよびディスプレイウォール市場:地域別
第6章 小売業におけるバーチャルリアリティの世界市場:業界別
- 世界の衣料品市場:地域別
- 世界の家電市場:地域別
- 世界の食品および飲料市場:地域別
- 世界の家庭用品市場:地域別
第7章 小売業におけるバーチャルリアリティの世界市場:地域別
- 北米
- 北米の市場:国別
- 米国
- カナダ
- メキシコ
- その他北米地域
- 北米の市場:国別
- 欧州
- 欧州の市場:国別
- ドイツ
- 英国
- フランス
- ロシア
- スペイン
- イタリア
- その他欧州地域
- 欧州の市場:国別
- アジア太平洋
- アジア太平洋の市場:国別
- 中国
- 日本
- インド
- 韓国
- シンガポール
- マレーシア
- その他アジア太平洋地域
- アジア太平洋の市場:国別
- ラテンアメリカ・中東・アフリカ
- ラテンアメリカ・中東・アフリカの市場:国別
- ブラジル
- アルゼンチン
- アラブ首長国連邦
- サウジアラビア
- 南アフリカ
- ナイジェリア
- その他ラテンアメリカ・中東・アフリカ地域
- ラテンアメリカ・中東・アフリカの市場:国別
第8章 企業プロファイル
- Matterport, Inc
- Scapic Innovations Private Limited(Flipkart Pvt Ltd,)(Walmart Inc.)
- FXGear, Inc
- Visualise Creative Limited
- Panedia Pty Ltd
- FireBird VR
- KonceptVR LLC
- WeMakeVR
- Fiebak Medien
- Subvrsive, Inc
LIST OF TABLES
- TABLE 1 Global Virtual Reality In Retail Market, 2019 - 2022, USD Million
- TABLE 2 Global Virtual Reality In Retail Market, 2023 - 2030, USD Million
- TABLE 3 Global Virtual Reality In Retail Market by Application, 2019 - 2022, USD Million
- TABLE 4 Global Virtual Reality In Retail Market by Application, 2023 - 2030, USD Million
- TABLE 5 Global Advertising & Marketing Market by Region, 2019 - 2022, USD Million
- TABLE 6 Global Advertising & Marketing Market by Region, 2023 - 2030, USD Million
- TABLE 7 Global Try-on Solutions Market by Region, 2019 - 2022, USD Million
- TABLE 8 Global Try-on Solutions Market by Region, 2023 - 2030, USD Million
- TABLE 9 Global Planning & Designing Market by Region, 2019 - 2022, USD Million
- TABLE 10 Global Planning & Designing Market by Region, 2023 - 2030, USD Million
- TABLE 11 Global Information Systems Market by Region, 2019 - 2022, USD Million
- TABLE 12 Global Information Systems Market by Region, 2023 - 2030, USD Million
- TABLE 13 Global Virtual Reality In Retail Market by Component, 2019 - 2022, USD Million
- TABLE 14 Global Virtual Reality In Retail Market by Component, 2023 - 2030, USD Million
- TABLE 15 Global Hardware Market by Region, 2019 - 2022, USD Million
- TABLE 16 Global Hardware Market by Region, 2023 - 2030, USD Million
- TABLE 17 Global Software Market by Region, 2019 - 2022, USD Million
- TABLE 18 Global Software Market by Region, 2023 - 2030, USD Million
- TABLE 19 Global Services Market by Region, 2019 - 2022, USD Million
- TABLE 20 Global Services Market by Region, 2023 - 2030, USD Million
- TABLE 21 Global Virtual Reality In Retail Market by Device, 2019 - 2022, USD Million
- TABLE 22 Global Virtual Reality In Retail Market by Device, 2023 - 2030, USD Million
- TABLE 23 Global Head Mounted Devices Market by Region, 2019 - 2022, USD Million
- TABLE 24 Global Head Mounted Devices Market by Region, 2023 - 2030, USD Million
- TABLE 25 Global Gesture Tracking Device Market by Region, 2019 - 2022, USD Million
- TABLE 26 Global Gesture Tracking Device Market by Region, 2023 - 2030, USD Million
- TABLE 27 Global Projectors & Display Wall Market by Region, 2019 - 2022, USD Million
- TABLE 28 Global Projectors & Display Wall Market by Region, 2023 - 2030, USD Million
- TABLE 29 Global Virtual Reality In Retail Market by Vertical, 2019 - 2022, USD Million
- TABLE 30 Global Virtual Reality In Retail Market by Vertical, 2023 - 2030, USD Million
- TABLE 31 Global Clothing Market by Region, 2019 - 2022, USD Million
- TABLE 32 Global Clothing Market by Region, 2023 - 2030, USD Million
- TABLE 33 Global Consumer Electronics Market by Region, 2019 - 2022, USD Million
- TABLE 34 Global Consumer Electronics Market by Region, 2023 - 2030, USD Million
- TABLE 35 Global Food & Beverages Market by Region, 2019 - 2022, USD Million
- TABLE 36 Global Food & Beverages Market by Region, 2023 - 2030, USD Million
- TABLE 37 Global Home Products Market by Region, 2019 - 2022, USD Million
- TABLE 38 Global Home Products Market by Region, 2023 - 2030, USD Million
- TABLE 39 Global Virtual Reality In Retail Market by Region, 2019 - 2022, USD Million
- TABLE 40 Global Virtual Reality In Retail Market by Region, 2023 - 2030, USD Million
- TABLE 41 North America Virtual Reality In Retail Market, 2019 - 2022, USD Million
- TABLE 42 North America Virtual Reality In Retail Market, 2023 - 2030, USD Million
- TABLE 43 North America Virtual Reality In Retail Market by Application, 2019 - 2022, USD Million
- TABLE 44 North America Virtual Reality In Retail Market by Application, 2023 - 2030, USD Million
- TABLE 45 North America Advertising & Marketing Market by Country, 2019 - 2022, USD Million
- TABLE 46 North America Advertising & Marketing Market by Country, 2023 - 2030, USD Million
- TABLE 47 North America Try-on Solutions Market by Country, 2019 - 2022, USD Million
- TABLE 48 North America Try-on Solutions Market by Country, 2023 - 2030, USD Million
- TABLE 49 North America Planning & Designing Market by Country, 2019 - 2022, USD Million
- TABLE 50 North America Planning & Designing Market by Country, 2023 - 2030, USD Million
- TABLE 51 North America Information Systems Market by Country, 2019 - 2022, USD Million
- TABLE 52 North America Information Systems Market by Country, 2023 - 2030, USD Million
- TABLE 53 North America Virtual Reality In Retail Market by Component, 2019 - 2022, USD Million
- TABLE 54 North America Virtual Reality In Retail Market by Component, 2023 - 2030, USD Million
- TABLE 55 North America Hardware Market by Country, 2019 - 2022, USD Million
- TABLE 56 North America Hardware Market by Country, 2023 - 2030, USD Million
- TABLE 57 North America Software Market by Country, 2019 - 2022, USD Million
- TABLE 58 North America Software Market by Country, 2023 - 2030, USD Million
- TABLE 59 North America Services Market by Country, 2019 - 2022, USD Million
- TABLE 60 North America Services Market by Country, 2023 - 2030, USD Million
- TABLE 61 North America Virtual Reality In Retail Market by Device, 2019 - 2022, USD Million
- TABLE 62 North America Virtual Reality In Retail Market by Device, 2023 - 2030, USD Million
- TABLE 63 North America Head Mounted Devices Market by Country, 2019 - 2022, USD Million
- TABLE 64 North America Head Mounted Devices Market by Country, 2023 - 2030, USD Million
- TABLE 65 North America Gesture Tracking Device Market by Country, 2019 - 2022, USD Million
- TABLE 66 North America Gesture Tracking Device Market by Country, 2023 - 2030, USD Million
- TABLE 67 North America Projectors & Display Wall Market by Country, 2019 - 2022, USD Million
- TABLE 68 North America Projectors & Display Wall Market by Country, 2023 - 2030, USD Million
- TABLE 69 North America Virtual Reality In Retail Market by Vertical, 2019 - 2022, USD Million
- TABLE 70 North America Virtual Reality In Retail Market by Vertical, 2023 - 2030, USD Million
- TABLE 71 North America Clothing Market by Country, 2019 - 2022, USD Million
- TABLE 72 North America Clothing Market by Country, 2023 - 2030, USD Million
- TABLE 73 North America Consumer Electronics Market by Country, 2019 - 2022, USD Million
- TABLE 74 North America Consumer Electronics Market by Country, 2023 - 2030, USD Million
- TABLE 75 North America Food & Beverages Market by Country, 2019 - 2022, USD Million
- TABLE 76 North America Food & Beverages Market by Country, 2023 - 2030, USD Million
- TABLE 77 North America Home Products Market by Country, 2019 - 2022, USD Million
- TABLE 78 North America Home Products Market by Country, 2023 - 2030, USD Million
- TABLE 79 North America Virtual Reality In Retail Market by Country, 2019 - 2022, USD Million
- TABLE 80 North America Virtual Reality In Retail Market by Country, 2023 - 2030, USD Million
- TABLE 81 US Virtual Reality In Retail Market, 2019 - 2022, USD Million
- TABLE 82 US Virtual Reality In Retail Market, 2023 - 2030, USD Million
- TABLE 83 US Virtual Reality In Retail Market by Application, 2019 - 2022, USD Million
- TABLE 84 US Virtual Reality In Retail Market by Application, 2023 - 2030, USD Million
- TABLE 85 US Virtual Reality In Retail Market by Component, 2019 - 2022, USD Million
- TABLE 86 US Virtual Reality In Retail Market by Component, 2023 - 2030, USD Million
- TABLE 87 US Virtual Reality In Retail Market by Device, 2019 - 2022, USD Million
- TABLE 88 US Virtual Reality In Retail Market by Device, 2023 - 2030, USD Million
- TABLE 89 US Virtual Reality In Retail Market by Vertical, 2019 - 2022, USD Million
- TABLE 90 US Virtual Reality In Retail Market by Vertical, 2023 - 2030, USD Million
- TABLE 91 Canada Virtual Reality In Retail Market, 2019 - 2022, USD Million
- TABLE 92 Canada Virtual Reality In Retail Market, 2023 - 2030, USD Million
- TABLE 93 Canada Virtual Reality In Retail Market by Application, 2019 - 2022, USD Million
- TABLE 94 Canada Virtual Reality In Retail Market by Application, 2023 - 2030, USD Million
- TABLE 95 Canada Virtual Reality In Retail Market by Component, 2019 - 2022, USD Million
- TABLE 96 Canada Virtual Reality In Retail Market by Component, 2023 - 2030, USD Million
- TABLE 97 Canada Virtual Reality In Retail Market by Device, 2019 - 2022, USD Million
- TABLE 98 Canada Virtual Reality In Retail Market by Device, 2023 - 2030, USD Million
- TABLE 99 Canada Virtual Reality In Retail Market by Vertical, 2019 - 2022, USD Million
- TABLE 100 Canada Virtual Reality In Retail Market by Vertical, 2023 - 2030, USD Million
- TABLE 101 Mexico Virtual Reality In Retail Market, 2019 - 2022, USD Million
- TABLE 102 Mexico Virtual Reality In Retail Market, 2023 - 2030, USD Million
- TABLE 103 Mexico Virtual Reality In Retail Market by Application, 2019 - 2022, USD Million
- TABLE 104 Mexico Virtual Reality In Retail Market by Application, 2023 - 2030, USD Million
- TABLE 105 Mexico Virtual Reality In Retail Market by Component, 2019 - 2022, USD Million
- TABLE 106 Mexico Virtual Reality In Retail Market by Component, 2023 - 2030, USD Million
- TABLE 107 Mexico Virtual Reality In Retail Market by Device, 2019 - 2022, USD Million
- TABLE 108 Mexico Virtual Reality In Retail Market by Device, 2023 - 2030, USD Million
- TABLE 109 Mexico Virtual Reality In Retail Market by Vertical, 2019 - 2022, USD Million
- TABLE 110 Mexico Virtual Reality In Retail Market by Vertical, 2023 - 2030, USD Million
- TABLE 111 Rest of North America Virtual Reality In Retail Market, 2019 - 2022, USD Million
- TABLE 112 Rest of North America Virtual Reality In Retail Market, 2023 - 2030, USD Million
- TABLE 113 Rest of North America Virtual Reality In Retail Market by Application, 2019 - 2022, USD Million
- TABLE 114 Rest of North America Virtual Reality In Retail Market by Application, 2023 - 2030, USD Million
- TABLE 115 Rest of North America Virtual Reality In Retail Market by Component, 2019 - 2022, USD Million
- TABLE 116 Rest of North America Virtual Reality In Retail Market by Component, 2023 - 2030, USD Million
- TABLE 117 Rest of North America Virtual Reality In Retail Market by Device, 2019 - 2022, USD Million
- TABLE 118 Rest of North America Virtual Reality In Retail Market by Device, 2023 - 2030, USD Million
- TABLE 119 Rest of North America Virtual Reality In Retail Market by Vertical, 2019 - 2022, USD Million
- TABLE 120 Rest of North America Virtual Reality In Retail Market by Vertical, 2023 - 2030, USD Million
- TABLE 121 Europe Virtual Reality In Retail Market, 2019 - 2022, USD Million
- TABLE 122 Europe Virtual Reality In Retail Market, 2023 - 2030, USD Million
- TABLE 123 Europe Virtual Reality In Retail Market by Application, 2019 - 2022, USD Million
- TABLE 124 Europe Virtual Reality In Retail Market by Application, 2023 - 2030, USD Million
- TABLE 125 Europe Advertising & Marketing Market by Country, 2019 - 2022, USD Million
- TABLE 126 Europe Advertising & Marketing Market by Country, 2023 - 2030, USD Million
- TABLE 127 Europe Try-on Solutions Market by Country, 2019 - 2022, USD Million
- TABLE 128 Europe Try-on Solutions Market by Country, 2023 - 2030, USD Million
- TABLE 129 Europe Planning & Designing Market by Country, 2019 - 2022, USD Million
- TABLE 130 Europe Planning & Designing Market by Country, 2023 - 2030, USD Million
- TABLE 131 Europe Information Systems Market by Country, 2019 - 2022, USD Million
- TABLE 132 Europe Information Systems Market by Country, 2023 - 2030, USD Million
- TABLE 133 Europe Virtual Reality In Retail Market by Component, 2019 - 2022, USD Million
- TABLE 134 Europe Virtual Reality In Retail Market by Component, 2023 - 2030, USD Million
- TABLE 135 Europe Hardware Market by Country, 2019 - 2022, USD Million
- TABLE 136 Europe Hardware Market by Country, 2023 - 2030, USD Million
- TABLE 137 Europe Software Market by Country, 2019 - 2022, USD Million
- TABLE 138 Europe Software Market by Country, 2023 - 2030, USD Million
- TABLE 139 Europe Services Market by Country, 2019 - 2022, USD Million
- TABLE 140 Europe Services Market by Country, 2023 - 2030, USD Million
- TABLE 141 Europe Virtual Reality In Retail Market by Device, 2019 - 2022, USD Million
- TABLE 142 Europe Virtual Reality In Retail Market by Device, 2023 - 2030, USD Million
- TABLE 143 Europe Head Mounted Devices Market by Country, 2019 - 2022, USD Million
- TABLE 144 Europe Head Mounted Devices Market by Country, 2023 - 2030, USD Million
- TABLE 145 Europe Gesture Tracking Device Market by Country, 2019 - 2022, USD Million
- TABLE 146 Europe Gesture Tracking Device Market by Country, 2023 - 2030, USD Million
- TABLE 147 Europe Projectors & Display Wall Market by Country, 2019 - 2022, USD Million
- TABLE 148 Europe Projectors & Display Wall Market by Country, 2023 - 2030, USD Million
- TABLE 149 Europe Virtual Reality In Retail Market by Vertical, 2019 - 2022, USD Million
- TABLE 150 Europe Virtual Reality In Retail Market by Vertical, 2023 - 2030, USD Million
- TABLE 151 Europe Clothing Market by Country, 2019 - 2022, USD Million
- TABLE 152 Europe Clothing Market by Country, 2023 - 2030, USD Million
- TABLE 153 Europe Consumer Electronics Market by Country, 2019 - 2022, USD Million
- TABLE 154 Europe Consumer Electronics Market by Country, 2023 - 2030, USD Million
- TABLE 155 Europe Food & Beverages Market by Country, 2019 - 2022, USD Million
- TABLE 156 Europe Food & Beverages Market by Country, 2023 - 2030, USD Million
- TABLE 157 Europe Home Products Market by Country, 2019 - 2022, USD Million
- TABLE 158 Europe Home Products Market by Country, 2023 - 2030, USD Million
- TABLE 159 Europe Virtual Reality In Retail Market by Country, 2019 - 2022, USD Million
- TABLE 160 Europe Virtual Reality In Retail Market by Country, 2023 - 2030, USD Million
- TABLE 161 Germany Virtual Reality In Retail Market, 2019 - 2022, USD Million
- TABLE 162 Germany Virtual Reality In Retail Market, 2023 - 2030, USD Million
- TABLE 163 Germany Virtual Reality In Retail Market by Application, 2019 - 2022, USD Million
- TABLE 164 Germany Virtual Reality In Retail Market by Application, 2023 - 2030, USD Million
- TABLE 165 Germany Virtual Reality In Retail Market by Component, 2019 - 2022, USD Million
- TABLE 166 Germany Virtual Reality In Retail Market by Component, 2023 - 2030, USD Million
- TABLE 167 Germany Virtual Reality In Retail Market by Device, 2019 - 2022, USD Million
- TABLE 168 Germany Virtual Reality In Retail Market by Device, 2023 - 2030, USD Million
- TABLE 169 Germany Virtual Reality In Retail Market by Vertical, 2019 - 2022, USD Million
- TABLE 170 Germany Virtual Reality In Retail Market by Vertical, 2023 - 2030, USD Million
- TABLE 171 UK Virtual Reality In Retail Market, 2019 - 2022, USD Million
- TABLE 172 UK Virtual Reality In Retail Market, 2023 - 2030, USD Million
- TABLE 173 UK Virtual Reality In Retail Market by Application, 2019 - 2022, USD Million
- TABLE 174 UK Virtual Reality In Retail Market by Application, 2023 - 2030, USD Million
- TABLE 175 UK Virtual Reality In Retail Market by Component, 2019 - 2022, USD Million
- TABLE 176 UK Virtual Reality In Retail Market by Component, 2023 - 2030, USD Million
- TABLE 177 UK Virtual Reality In Retail Market by Device, 2019 - 2022, USD Million
- TABLE 178 UK Virtual Reality In Retail Market by Device, 2023 - 2030, USD Million
- TABLE 179 UK Virtual Reality In Retail Market by Vertical, 2019 - 2022, USD Million
- TABLE 180 UK Virtual Reality In Retail Market by Vertical, 2023 - 2030, USD Million
- TABLE 181 France Virtual Reality In Retail Market, 2019 - 2022, USD Million
- TABLE 182 France Virtual Reality In Retail Market, 2023 - 2030, USD Million
- TABLE 183 France Virtual Reality In Retail Market by Application, 2019 - 2022, USD Million
- TABLE 184 France Virtual Reality In Retail Market by Application, 2023 - 2030, USD Million
- TABLE 185 France Virtual Reality In Retail Market by Component, 2019 - 2022, USD Million
- TABLE 186 France Virtual Reality In Retail Market by Component, 2023 - 2030, USD Million
- TABLE 187 France Virtual Reality In Retail Market by Device, 2019 - 2022, USD Million
- TABLE 188 France Virtual Reality In Retail Market by Device, 2023 - 2030, USD Million
- TABLE 189 France Virtual Reality In Retail Market by Vertical, 2019 - 2022, USD Million
- TABLE 190 France Virtual Reality In Retail Market by Vertical, 2023 - 2030, USD Million
- TABLE 191 Russia Virtual Reality In Retail Market, 2019 - 2022, USD Million
- TABLE 192 Russia Virtual Reality In Retail Market, 2023 - 2030, USD Million
- TABLE 193 Russia Virtual Reality In Retail Market by Application, 2019 - 2022, USD Million
- TABLE 194 Russia Virtual Reality In Retail Market by Application, 2023 - 2030, USD Million
- TABLE 195 Russia Virtual Reality In Retail Market by Component, 2019 - 2022, USD Million
- TABLE 196 Russia Virtual Reality In Retail Market by Component, 2023 - 2030, USD Million
- TABLE 197 Russia Virtual Reality In Retail Market by Device, 2019 - 2022, USD Million
- TABLE 198 Russia Virtual Reality In Retail Market by Device, 2023 - 2030, USD Million
- TABLE 199 Russia Virtual Reality In Retail Market by Vertical, 2019 - 2022, USD Million
- TABLE 200 Russia Virtual Reality In Retail Market by Vertical, 2023 - 2030, USD Million
- TABLE 201 Spain Virtual Reality In Retail Market, 2019 - 2022, USD Million
- TABLE 202 Spain Virtual Reality In Retail Market, 2023 - 2030, USD Million
- TABLE 203 Spain Virtual Reality In Retail Market by Application, 2019 - 2022, USD Million
- TABLE 204 Spain Virtual Reality In Retail Market by Application, 2023 - 2030, USD Million
- TABLE 205 Spain Virtual Reality In Retail Market by Component, 2019 - 2022, USD Million
- TABLE 206 Spain Virtual Reality In Retail Market by Component, 2023 - 2030, USD Million
- TABLE 207 Spain Virtual Reality In Retail Market by Device, 2019 - 2022, USD Million
- TABLE 208 Spain Virtual Reality In Retail Market by Device, 2023 - 2030, USD Million
- TABLE 209 Spain Virtual Reality In Retail Market by Vertical, 2019 - 2022, USD Million
- TABLE 210 Spain Virtual Reality In Retail Market by Vertical, 2023 - 2030, USD Million
- TABLE 211 Italy Virtual Reality In Retail Market, 2019 - 2022, USD Million
- TABLE 212 Italy Virtual Reality In Retail Market, 2023 - 2030, USD Million
- TABLE 213 Italy Virtual Reality In Retail Market by Application, 2019 - 2022, USD Million
- TABLE 214 Italy Virtual Reality In Retail Market by Application, 2023 - 2030, USD Million
- TABLE 215 Italy Virtual Reality In Retail Market by Component, 2019 - 2022, USD Million
- TABLE 216 Italy Virtual Reality In Retail Market by Component, 2023 - 2030, USD Million
- TABLE 217 Italy Virtual Reality In Retail Market by Device, 2019 - 2022, USD Million
- TABLE 218 Italy Virtual Reality In Retail Market by Device, 2023 - 2030, USD Million
- TABLE 219 Italy Virtual Reality In Retail Market by Vertical, 2019 - 2022, USD Million
- TABLE 220 Italy Virtual Reality In Retail Market by Vertical, 2023 - 2030, USD Million
- TABLE 221 Rest of Europe Virtual Reality In Retail Market, 2019 - 2022, USD Million
- TABLE 222 Rest of Europe Virtual Reality In Retail Market, 2023 - 2030, USD Million
- TABLE 223 Rest of Europe Virtual Reality In Retail Market by Application, 2019 - 2022, USD Million
- TABLE 224 Rest of Europe Virtual Reality In Retail Market by Application, 2023 - 2030, USD Million
- TABLE 225 Rest of Europe Virtual Reality In Retail Market by Component, 2019 - 2022, USD Million
- TABLE 226 Rest of Europe Virtual Reality In Retail Market by Component, 2023 - 2030, USD Million
- TABLE 227 Rest of Europe Virtual Reality In Retail Market by Device, 2019 - 2022, USD Million
- TABLE 228 Rest of Europe Virtual Reality In Retail Market by Device, 2023 - 2030, USD Million
- TABLE 229 Rest of Europe Virtual Reality In Retail Market by Vertical, 2019 - 2022, USD Million
- TABLE 230 Rest of Europe Virtual Reality In Retail Market by Vertical, 2023 - 2030, USD Million
- TABLE 231 Asia Pacific Virtual Reality In Retail Market, 2019 - 2022, USD Million
- TABLE 232 Asia Pacific Virtual Reality In Retail Market, 2023 - 2030, USD Million
- TABLE 233 Asia Pacific Virtual Reality In Retail Market by Application, 2019 - 2022, USD Million
- TABLE 234 Asia Pacific Virtual Reality In Retail Market by Application, 2023 - 2030, USD Million
- TABLE 235 Asia Pacific Advertising & Marketing Market by Country, 2019 - 2022, USD Million
- TABLE 236 Asia Pacific Advertising & Marketing Market by Country, 2023 - 2030, USD Million
- TABLE 237 Asia Pacific Try-on Solutions Market by Country, 2019 - 2022, USD Million
- TABLE 238 Asia Pacific Try-on Solutions Market by Country, 2023 - 2030, USD Million
- TABLE 239 Asia Pacific Planning & Designing Market by Country, 2019 - 2022, USD Million
- TABLE 240 Asia Pacific Planning & Designing Market by Country, 2023 - 2030, USD Million
- TABLE 241 Asia Pacific Information Systems Market by Country, 2019 - 2022, USD Million
- TABLE 242 Asia Pacific Information Systems Market by Country, 2023 - 2030, USD Million
- TABLE 243 Asia Pacific Virtual Reality In Retail Market by Component, 2019 - 2022, USD Million
- TABLE 244 Asia Pacific Virtual Reality In Retail Market by Component, 2023 - 2030, USD Million
- TABLE 245 Asia Pacific Hardware Market by Country, 2019 - 2022, USD Million
- TABLE 246 Asia Pacific Hardware Market by Country, 2023 - 2030, USD Million
- TABLE 247 Asia Pacific Software Market by Country, 2019 - 2022, USD Million
- TABLE 248 Asia Pacific Software Market by Country, 2023 - 2030, USD Million
- TABLE 249 Asia Pacific Services Market by Country, 2019 - 2022, USD Million
- TABLE 250 Asia Pacific Services Market by Country, 2023 - 2030, USD Million
- TABLE 251 Asia Pacific Virtual Reality In Retail Market by Device, 2019 - 2022, USD Million
- TABLE 252 Asia Pacific Virtual Reality In Retail Market by Device, 2023 - 2030, USD Million
- TABLE 253 Asia Pacific Head Mounted Devices Market by Country, 2019 - 2022, USD Million
- TABLE 254 Asia Pacific Head Mounted Devices Market by Country, 2023 - 2030, USD Million
- TABLE 255 Asia Pacific Gesture Tracking Device Market by Country, 2019 - 2022, USD Million
- TABLE 256 Asia Pacific Gesture Tracking Device Market by Country, 2023 - 2030, USD Million
- TABLE 257 Asia Pacific Projectors & Display Wall Market by Country, 2019 - 2022, USD Million
- TABLE 258 Asia Pacific Projectors & Display Wall Market by Country, 2023 - 2030, USD Million
- TABLE 259 Asia Pacific Virtual Reality In Retail Market by Vertical, 2019 - 2022, USD Million
- TABLE 260 Asia Pacific Virtual Reality In Retail Market by Vertical, 2023 - 2030, USD Million
- TABLE 261 Asia Pacific Clothing Market by Country, 2019 - 2022, USD Million
- TABLE 262 Asia Pacific Clothing Market by Country, 2023 - 2030, USD Million
- TABLE 263 Asia Pacific Consumer Electronics Market by Country, 2019 - 2022, USD Million
- TABLE 264 Asia Pacific Consumer Electronics Market by Country, 2023 - 2030, USD Million
- TABLE 265 Asia Pacific Food & Beverages Market by Country, 2019 - 2022, USD Million
- TABLE 266 Asia Pacific Food & Beverages Market by Country, 2023 - 2030, USD Million
- TABLE 267 Asia Pacific Home Products Market by Country, 2019 - 2022, USD Million
- TABLE 268 Asia Pacific Home Products Market by Country, 2023 - 2030, USD Million
- TABLE 269 Asia Pacific Virtual Reality In Retail Market by Country, 2019 - 2022, USD Million
- TABLE 270 Asia Pacific Virtual Reality In Retail Market by Country, 2023 - 2030, USD Million
- TABLE 271 China Virtual Reality In Retail Market, 2019 - 2022, USD Million
- TABLE 272 China Virtual Reality In Retail Market, 2023 - 2030, USD Million
- TABLE 273 China Virtual Reality In Retail Market by Application, 2019 - 2022, USD Million
- TABLE 274 China Virtual Reality In Retail Market by Application, 2023 - 2030, USD Million
- TABLE 275 China Virtual Reality In Retail Market by Component, 2019 - 2022, USD Million
- TABLE 276 China Virtual Reality In Retail Market by Component, 2023 - 2030, USD Million
- TABLE 277 China Virtual Reality In Retail Market by Device, 2019 - 2022, USD Million
- TABLE 278 China Virtual Reality In Retail Market by Device, 2023 - 2030, USD Million
- TABLE 279 China Virtual Reality In Retail Market by Vertical, 2019 - 2022, USD Million
- TABLE 280 China Virtual Reality In Retail Market by Vertical, 2023 - 2030, USD Million
- TABLE 281 Japan Virtual Reality In Retail Market, 2019 - 2022, USD Million
- TABLE 282 Japan Virtual Reality In Retail Market, 2023 - 2030, USD Million
- TABLE 283 Japan Virtual Reality In Retail Market by Application, 2019 - 2022, USD Million
- TABLE 284 Japan Virtual Reality In Retail Market by Application, 2023 - 2030, USD Million
- TABLE 285 Japan Virtual Reality In Retail Market by Component, 2019 - 2022, USD Million
- TABLE 286 Japan Virtual Reality In Retail Market by Component, 2023 - 2030, USD Million
- TABLE 287 Japan Virtual Reality In Retail Market by Device, 2019 - 2022, USD Million
- TABLE 288 Japan Virtual Reality In Retail Market by Device, 2023 - 2030, USD Million
- TABLE 289 Japan Virtual Reality In Retail Market by Vertical, 2019 - 2022, USD Million
- TABLE 290 Japan Virtual Reality In Retail Market by Vertical, 2023 - 2030, USD Million
- TABLE 291 India Virtual Reality In Retail Market, 2019 - 2022, USD Million
- TABLE 292 India Virtual Reality In Retail Market, 2023 - 2030, USD Million
- TABLE 293 India Virtual Reality In Retail Market by Application, 2019 - 2022, USD Million
- TABLE 294 India Virtual Reality In Retail Market by Application, 2023 - 2030, USD Million
- TABLE 295 India Virtual Reality In Retail Market by Component, 2019 - 2022, USD Million
- TABLE 296 India Virtual Reality In Retail Market by Component, 2023 - 2030, USD Million
- TABLE 297 India Virtual Reality In Retail Market by Device, 2019 - 2022, USD Million
- TABLE 298 India Virtual Reality In Retail Market by Device, 2023 - 2030, USD Million
- TABLE 299 India Virtual Reality In Retail Market by Vertical, 2019 - 2022, USD Million
- TABLE 300 India Virtual Reality In Retail Market by Vertical, 2023 - 2030, USD Million
- TABLE 301 South Korea Virtual Reality In Retail Market, 2019 - 2022, USD Million
- TABLE 302 South Korea Virtual Reality In Retail Market, 2023 - 2030, USD Million
- TABLE 303 South Korea Virtual Reality In Retail Market by Application, 2019 - 2022, USD Million
- TABLE 304 South Korea Virtual Reality In Retail Market by Application, 2023 - 2030, USD Million
- TABLE 305 South Korea Virtual Reality In Retail Market by Component, 2019 - 2022, USD Million
- TABLE 306 South Korea Virtual Reality In Retail Market by Component, 2023 - 2030, USD Million
- TABLE 307 South Korea Virtual Reality In Retail Market by Device, 2019 - 2022, USD Million
- TABLE 308 South Korea Virtual Reality In Retail Market by Device, 2023 - 2030, USD Million
- TABLE 309 South Korea Virtual Reality In Retail Market by Vertical, 2019 - 2022, USD Million
- TABLE 310 South Korea Virtual Reality In Retail Market by Vertical, 2023 - 2030, USD Million
- TABLE 311 Singapore Virtual Reality In Retail Market, 2019 - 2022, USD Million
- TABLE 312 Singapore Virtual Reality In Retail Market, 2023 - 2030, USD Million
- TABLE 313 Singapore Virtual Reality In Retail Market by Application, 2019 - 2022, USD Million
- TABLE 314 Singapore Virtual Reality In Retail Market by Application, 2023 - 2030, USD Million
- TABLE 315 Singapore Virtual Reality In Retail Market by Component, 2019 - 2022, USD Million
- TABLE 316 Singapore Virtual Reality In Retail Market by Component, 2023 - 2030, USD Million
- TABLE 317 Singapore Virtual Reality In Retail Market by Device, 2019 - 2022, USD Million
- TABLE 318 Singapore Virtual Reality In Retail Market by Device, 2023 - 2030, USD Million
- TABLE 319 Singapore Virtual Reality In Retail Market by Vertical, 2019 - 2022, USD Million
- TABLE 320 Singapore Virtual Reality In Retail Market by Vertical, 2023 - 2030, USD Million
- TABLE 321 Malaysia Virtual Reality In Retail Market, 2019 - 2022, USD Million
- TABLE 322 Malaysia Virtual Reality In Retail Market, 2023 - 2030, USD Million
- TABLE 323 Malaysia Virtual Reality In Retail Market by Application, 2019 - 2022, USD Million
- TABLE 324 Malaysia Virtual Reality In Retail Market by Application, 2023 - 2030, USD Million
- TABLE 325 Malaysia Virtual Reality In Retail Market by Component, 2019 - 2022, USD Million
- TABLE 326 Malaysia Virtual Reality In Retail Market by Component, 2023 - 2030, USD Million
- TABLE 327 Malaysia Virtual Reality In Retail Market by Device, 2019 - 2022, USD Million
- TABLE 328 Malaysia Virtual Reality In Retail Market by Device, 2023 - 2030, USD Million
- TABLE 329 Malaysia Virtual Reality In Retail Market by Vertical, 2019 - 2022, USD Million
- TABLE 330 Malaysia Virtual Reality In Retail Market by Vertical, 2023 - 2030, USD Million
- TABLE 331 Rest of Asia Pacific Virtual Reality In Retail Market, 2019 - 2022, USD Million
- TABLE 332 Rest of Asia Pacific Virtual Reality In Retail Market, 2023 - 2030, USD Million
- TABLE 333 Rest of Asia Pacific Virtual Reality In Retail Market by Application, 2019 - 2022, USD Million
- TABLE 334 Rest of Asia Pacific Virtual Reality In Retail Market by Application, 2023 - 2030, USD Million
- TABLE 335 Rest of Asia Pacific Virtual Reality In Retail Market by Component, 2019 - 2022, USD Million
- TABLE 336 Rest of Asia Pacific Virtual Reality In Retail Market by Component, 2023 - 2030, USD Million
- TABLE 337 Rest of Asia Pacific Virtual Reality In Retail Market by Device, 2019 - 2022, USD Million
- TABLE 338 Rest of Asia Pacific Virtual Reality In Retail Market by Device, 2023 - 2030, USD Million
- TABLE 339 Rest of Asia Pacific Virtual Reality In Retail Market by Vertical, 2019 - 2022, USD Million
- TABLE 340 Rest of Asia Pacific Virtual Reality In Retail Market by Vertical, 2023 - 2030, USD Million
- TABLE 341 LAMEA Virtual Reality In Retail Market, 2019 - 2022, USD Million
- TABLE 342 LAMEA Virtual Reality In Retail Market, 2023 - 2030, USD Million
- TABLE 343 LAMEA Virtual Reality In Retail Market by Application, 2019 - 2022, USD Million
- TABLE 344 LAMEA Virtual Reality In Retail Market by Application, 2023 - 2030, USD Million
- TABLE 345 LAMEA Advertising & Marketing Market by Country, 2019 - 2022, USD Million
- TABLE 346 LAMEA Advertising & Marketing Market by Country, 2023 - 2030, USD Million
- TABLE 347 LAMEA Try-on Solutions Market by Country, 2019 - 2022, USD Million
- TABLE 348 LAMEA Try-on Solutions Market by Country, 2023 - 2030, USD Million
- TABLE 349 LAMEA Planning & Designing Market by Country, 2019 - 2022, USD Million
- TABLE 350 LAMEA Planning & Designing Market by Country, 2023 - 2030, USD Million
- TABLE 351 LAMEA Information Systems Market by Country, 2019 - 2022, USD Million
- TABLE 352 LAMEA Information Systems Market by Country, 2023 - 2030, USD Million
- TABLE 353 LAMEA Virtual Reality In Retail Market by Component, 2019 - 2022, USD Million
- TABLE 354 LAMEA Virtual Reality In Retail Market by Component, 2023 - 2030, USD Million
- TABLE 355 LAMEA Hardware Market by Country, 2019 - 2022, USD Million
- TABLE 356 LAMEA Hardware Market by Country, 2023 - 2030, USD Million
- TABLE 357 LAMEA Software Market by Country, 2019 - 2022, USD Million
- TABLE 358 LAMEA Software Market by Country, 2023 - 2030, USD Million
- TABLE 359 LAMEA Services Market by Country, 2019 - 2022, USD Million
- TABLE 360 LAMEA Services Market by Country, 2023 - 2030, USD Million
- TABLE 361 LAMEA Virtual Reality In Retail Market by Device, 2019 - 2022, USD Million
- TABLE 362 LAMEA Virtual Reality In Retail Market by Device, 2023 - 2030, USD Million
- TABLE 363 LAMEA Head Mounted Devices Market by Country, 2019 - 2022, USD Million
- TABLE 364 LAMEA Head Mounted Devices Market by Country, 2023 - 2030, USD Million
- TABLE 365 LAMEA Gesture Tracking Device Market by Country, 2019 - 2022, USD Million
- TABLE 366 LAMEA Gesture Tracking Device Market by Country, 2023 - 2030, USD Million
- TABLE 367 LAMEA Projectors & Display Wall Market by Country, 2019 - 2022, USD Million
- TABLE 368 LAMEA Projectors & Display Wall Market by Country, 2023 - 2030, USD Million
- TABLE 369 LAMEA Virtual Reality In Retail Market by Vertical, 2019 - 2022, USD Million
- TABLE 370 LAMEA Virtual Reality In Retail Market by Vertical, 2023 - 2030, USD Million
- TABLE 371 LAMEA Clothing Market by Country, 2019 - 2022, USD Million
- TABLE 372 LAMEA Clothing Market by Country, 2023 - 2030, USD Million
- TABLE 373 LAMEA Consumer Electronics Market by Country, 2019 - 2022, USD Million
- TABLE 374 LAMEA Consumer Electronics Market by Country, 2023 - 2030, USD Million
- TABLE 375 LAMEA Food & Beverages Market by Country, 2019 - 2022, USD Million
- TABLE 376 LAMEA Food & Beverages Market by Country, 2023 - 2030, USD Million
- TABLE 377 LAMEA Home Products Market by Country, 2019 - 2022, USD Million
- TABLE 378 LAMEA Home Products Market by Country, 2023 - 2030, USD Million
- TABLE 379 LAMEA Virtual Reality In Retail Market by Country, 2019 - 2022, USD Million
- TABLE 380 LAMEA Virtual Reality In Retail Market by Country, 2023 - 2030, USD Million
- TABLE 381 Brazil Virtual Reality In Retail Market, 2019 - 2022, USD Million
- TABLE 382 Brazil Virtual Reality In Retail Market, 2023 - 2030, USD Million
- TABLE 383 Brazil Virtual Reality In Retail Market by Application, 2019 - 2022, USD Million
- TABLE 384 Brazil Virtual Reality In Retail Market by Application, 2023 - 2030, USD Million
- TABLE 385 Brazil Virtual Reality In Retail Market by Component, 2019 - 2022, USD Million
- TABLE 386 Brazil Virtual Reality In Retail Market by Component, 2023 - 2030, USD Million
- TABLE 387 Brazil Virtual Reality In Retail Market by Device, 2019 - 2022, USD Million
- TABLE 388 Brazil Virtual Reality In Retail Market by Device, 2023 - 2030, USD Million
- TABLE 389 Brazil Virtual Reality In Retail Market by Vertical, 2019 - 2022, USD Million
- TABLE 390 Brazil Virtual Reality In Retail Market by Vertical, 2023 - 2030, USD Million
- TABLE 391 Argentina Virtual Reality In Retail Market, 2019 - 2022, USD Million
- TABLE 392 Argentina Virtual Reality In Retail Market, 2023 - 2030, USD Million
- TABLE 393 Argentina Virtual Reality In Retail Market by Application, 2019 - 2022, USD Million
- TABLE 394 Argentina Virtual Reality In Retail Market by Application, 2023 - 2030, USD Million
- TABLE 395 Argentina Virtual Reality In Retail Market by Component, 2019 - 2022, USD Million
- TABLE 396 Argentina Virtual Reality In Retail Market by Component, 2023 - 2030, USD Million
- TABLE 397 Argentina Virtual Reality In Retail Market by Device, 2019 - 2022, USD Million
- TABLE 398 Argentina Virtual Reality In Retail Market by Device, 2023 - 2030, USD Million
- TABLE 399 Argentina Virtual Reality In Retail Market by Vertical, 2019 - 2022, USD Million
- TABLE 400 Argentina Virtual Reality In Retail Market by Vertical, 2023 - 2030, USD Million
- TABLE 401 UAE Virtual Reality In Retail Market, 2019 - 2022, USD Million
- TABLE 402 UAE Virtual Reality In Retail Market, 2023 - 2030, USD Million
- TABLE 403 UAE Virtual Reality In Retail Market by Application, 2019 - 2022, USD Million
- TABLE 404 UAE Virtual Reality In Retail Market by Application, 2023 - 2030, USD Million
- TABLE 405 UAE Virtual Reality In Retail Market by Component, 2019 - 2022, USD Million
- TABLE 406 UAE Virtual Reality In Retail Market by Component, 2023 - 2030, USD Million
- TABLE 407 UAE Virtual Reality In Retail Market by Device, 2019 - 2022, USD Million
- TABLE 408 UAE Virtual Reality In Retail Market by Device, 2023 - 2030, USD Million
- TABLE 409 UAE Virtual Reality In Retail Market by Vertical, 2019 - 2022, USD Million
- TABLE 410 UAE Virtual Reality In Retail Market by Vertical, 2023 - 2030, USD Million
- TABLE 411 Saudi Arabia Virtual Reality In Retail Market, 2019 - 2022, USD Million
- TABLE 412 Saudi Arabia Virtual Reality In Retail Market, 2023 - 2030, USD Million
- TABLE 413 Saudi Arabia Virtual Reality In Retail Market by Application, 2019 - 2022, USD Million
- TABLE 414 Saudi Arabia Virtual Reality In Retail Market by Application, 2023 - 2030, USD Million
- TABLE 415 Saudi Arabia Virtual Reality In Retail Market by Component, 2019 - 2022, USD Million
- TABLE 416 Saudi Arabia Virtual Reality In Retail Market by Component, 2023 - 2030, USD Million
- TABLE 417 Saudi Arabia Virtual Reality In Retail Market by Device, 2019 - 2022, USD Million
- TABLE 418 Saudi Arabia Virtual Reality In Retail Market by Device, 2023 - 2030, USD Million
- TABLE 419 Saudi Arabia Virtual Reality In Retail Market by Vertical, 2019 - 2022, USD Million
- TABLE 420 Saudi Arabia Virtual Reality In Retail Market by Vertical, 2023 - 2030, USD Million
- TABLE 421 South Africa Virtual Reality In Retail Market, 2019 - 2022, USD Million
- TABLE 422 South Africa Virtual Reality In Retail Market, 2023 - 2030, USD Million
- TABLE 423 South Africa Virtual Reality In Retail Market by Application, 2019 - 2022, USD Million
- TABLE 424 South Africa Virtual Reality In Retail Market by Application, 2023 - 2030, USD Million
- TABLE 425 South Africa Virtual Reality In Retail Market by Component, 2019 - 2022, USD Million
- TABLE 426 South Africa Virtual Reality In Retail Market by Component, 2023 - 2030, USD Million
- TABLE 427 South Africa Virtual Reality In Retail Market by Device, 2019 - 2022, USD Million
- TABLE 428 South Africa Virtual Reality In Retail Market by Device, 2023 - 2030, USD Million
- TABLE 429 South Africa Virtual Reality In Retail Market by Vertical, 2019 - 2022, USD Million
- TABLE 430 South Africa Virtual Reality In Retail Market by Vertical, 2023 - 2030, USD Million
- TABLE 431 Nigeria Virtual Reality In Retail Market, 2019 - 2022, USD Million
- TABLE 432 Nigeria Virtual Reality In Retail Market, 2023 - 2030, USD Million
- TABLE 433 Nigeria Virtual Reality In Retail Market by Application, 2019 - 2022, USD Million
- TABLE 434 Nigeria Virtual Reality In Retail Market by Application, 2023 - 2030, USD Million
- TABLE 435 Nigeria Virtual Reality In Retail Market by Component, 2019 - 2022, USD Million
- TABLE 436 Nigeria Virtual Reality In Retail Market by Component, 2023 - 2030, USD Million
- TABLE 437 Nigeria Virtual Reality In Retail Market by Device, 2019 - 2022, USD Million
- TABLE 438 Nigeria Virtual Reality In Retail Market by Device, 2023 - 2030, USD Million
- TABLE 439 Nigeria Virtual Reality In Retail Market by Vertical, 2019 - 2022, USD Million
- TABLE 440 Nigeria Virtual Reality In Retail Market by Vertical, 2023 - 2030, USD Million
- TABLE 441 Rest of LAMEA Virtual Reality In Retail Market, 2019 - 2022, USD Million
- TABLE 442 Rest of LAMEA Virtual Reality In Retail Market, 2023 - 2030, USD Million
- TABLE 443 Rest of LAMEA Virtual Reality In Retail Market by Application, 2019 - 2022, USD Million
- TABLE 444 Rest of LAMEA Virtual Reality In Retail Market by Application, 2023 - 2030, USD Million
- TABLE 445 Rest of LAMEA Virtual Reality In Retail Market by Component, 2019 - 2022, USD Million
- TABLE 446 Rest of LAMEA Virtual Reality In Retail Market by Component, 2023 - 2030, USD Million
- TABLE 447 Rest of LAMEA Virtual Reality In Retail Market by Device, 2019 - 2022, USD Million
- TABLE 448 Rest of LAMEA Virtual Reality In Retail Market by Device, 2023 - 2030, USD Million
- TABLE 449 Rest of LAMEA Virtual Reality In Retail Market by Vertical, 2019 - 2022, USD Million
- TABLE 450 Rest of LAMEA Virtual Reality In Retail Market by Vertical, 2023 - 2030, USD Million
- TABLE 451 Key Information - Matterport, Inc.
- TABLE 452 Key Information - Scapic Innovations Private Limited
- TABLE 453 Key Information -FXGear, Inc.
- TABLE 454 Key Information - Visualise Creative Limited
- TABLE 455 Key Information -Panedia Pty Ltd.
- TABLE 456 Key Information -FireBird VR
- TABLE 457 Key Information - KonceptVR LLC
- TABLE 458 Key Information - WeMakeVR.
- TABLE 459 Key Information - Fiebak Medien
- TABLE 460 Key Information - Subvrsive, Inc.
List of Figures
- FIG 1 Methodology for the research
- FIG 2 Global Virtual Reality In Retail Market share by Application, 2022
- FIG 3 Global Virtual Reality In Retail Market share by Application, 2030
- FIG 4 Global Virtual Reality In Retail Market by Application, 2019 - 2030, USD Million
- FIG 5 Global Virtual Reality In Retail Market share by Component, 2022
- FIG 6 Global Virtual Reality In Retail Market share by Component, 2030
- FIG 7 Global Virtual Reality In Retail Market by Component, 2019 - 2030, USD Million
- FIG 8 Global Virtual Reality In Retail Market share by Device, 2022
- FIG 9 Global Virtual Reality In Retail Market share by Device, 2030
- FIG 10 Global Virtual Reality In Retail Market by Device, 2019 - 2030, USD Million
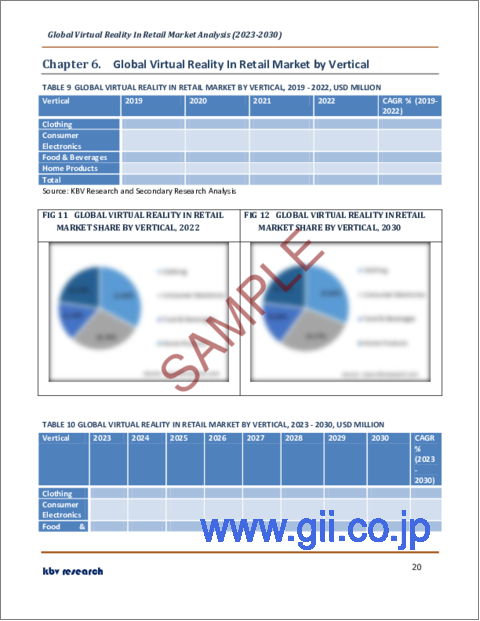
- FIG 11 Global Virtual Reality In Retail Market share by Vertical, 2022
- FIG 12 Global Virtual Reality In Retail Market share by Vertical, 2030
- FIG 13 Global Virtual Reality In Retail Market by Vertical, 2019 - 2030, USD Million
- FIG 14 Global Virtual Reality In Retail Market share by Region, 2022
- FIG 15 Global Virtual Reality In Retail Market share by Region, 2030
- FIG 16 Global Virtual Reality In Retail Market by Region, 2019 - 2030, USD Million
The Global Virtual Reality In Retail Market size is expected to reach $20.4 billion by 2030, rising at a market growth of 26.9% CAGR during the forecast period.
Europe is one of the promising regions in Virtual Reality in Retail because of the existence of several renowned fashion companies that are utilizing virtual reality to improve the consumer experience and expand their brand awareness. Thereby, Europe captured $954.3 million revenue in the market in 2022. Additionally, the increasing preference for online shopping, which offers customers individualized shopping experiences and access to a wide range of products. For example, one of Europe's largest e-commerce markets is Germany. Total sales increased 24 percent over 2020 to USD 127.5 billion in 2021. Germany's internet users are predicted to increase from 62.4 million in 2020 to 68.4 million in 2025. Some of the factors impacting the market are growing smartphone penetration, expansion of e-commerce sector, and easier said than done: omnichannel VR.
The smartphone usage has surged significantly over the past few years. The International Telecommunication Union (ITU) anticipates that by February 2021, 6.5 billion among 7 billion people will have access to a mobile phone. As a result, rising smartphone penetration has resulted in rising adoption of VR technologies in retail sector, leading to market growth. The use of smartphones is expanding globally, and internet usage has also become more prevalent. Adopting 4G and 5G communication technologies will positively affect the e-commerce sector. The trend of Internet shopping has grown rapidly in recent years. This will eventually offer significant prospects for market.
However, the store of the future will be a hybrid of the digital and physical worlds, combining the advantages of e-commerce in terms of ease with those of brick and mortar in terms of product research. Traditional retailers have recognized the value of digital merchandising and the influence of a first impression online. Considering these aspects collectively, the market may witness slow growth during the projection period.
Component Outlook
On the basis of component, the market is segmented into hardware, software, and services. In 2022, the hardware segment held the highest revenue share in the market. The development of headsets with a notable emphasis on display resolution, comfort, and overall performance. Additionally, eye-tracking technology will allow for gathering insightful consumer data, and gesture and motion tracking will improve user interaction. The requirement for scalable and cheap VR solutions to serve a wider range of retail stores and customers is another factor pushing innovation in the market's hardware which would eventually support the segment's expansion.
Device Outlook
Based on device, the market is classified into head mounted devices, gesture tracking device, and projectors & display wall. In 2022, the head mounted devices segment dominated the market with the maximum revenue share. The consumer demand for VR headsets like the Oculus Rift, HTC Vive, and PlayStation VR is driving the segment's expansion. For different retail applications, such as virtual product demos, virtual try-on, and virtual store visits, these headsets offer immersive experiences and are frequently used by various retail stores. Demand for HMDs is predicted to increase as prices decline and technology improves, enhancing the segment's position as a significant revenue source for the market.
Application Outlook
By application, the market is categorized into information systems, advertising & marketing, try-on solutions, and planning & designing. The planning & designing segment covered a considerable revenue share in the market in 2022. This is because of the benefits virtual reality offers the retail sector, including visual advertising, store prototypes, and store design & layout. Additionally, before applying virtual shop layouts & designs in actual spaces, retailers can view and build them using VR technology. They can also use virtual reality to experiment with product placement, shelving configurations, and design changes, which is anticipated to further propel the market growth over the coming years.
Vertical Outlook
Based on the vertical, the market is fragmented into food & beverage, home products, clothing, and consumer electronics. In 2022, the food & beverages segment projected a prominent revenue share in the market. Customers may explore menus, engage with virtual waitstaff, and immerse themselves in virtual restaurant environments. This development improves the whole eating experience and drives the development of VR in the food & beverage retail sector. Customers can use this trend to preview and experience dining alternatives before making reservations or placing food orders.
Regional Outlook
Region wise, the market is analyzed across North America, Europe, Asia Pacific, and LAMEA. In 2022, the North America region witnessed the largest revenue share in the market. This has been attributed to the region's rising digitalization and advancements in virtual reality technology. Additionally, the region's market growth is anticipated to be fueled by high levels of disposable income and falling prices for headsets with screens and processors. Also, the increased competition among stores in the region and the growing need for better customer purchasing experiences are anticipated to fuel the expansion of virtual reality in the retail market.
The market research report covers the analysis of key stake holders of the market. Key companies profiled in the report include Matterport, Inc., Scapic Innovations Private Limited (Flipkart Pvt. Ltd,) (Walmart Inc.), FXGear, Inc., Visualise Creative Limited, Panedia Pty Ltd., FireBird VR, KonceptVR LLC, WeMakeVR, Fiebak Medien, and Subvrsive, Inc.
Scope of the Study
Market Segments covered in the Report:
By Application
- Advertising & Marketing
- Try-on Solutions
- Planning & Designing
- Information Systems
By Component
- Hardware
- Software
- Services
By Device
- Head Mounted Devices
- Gesture Tracking Device
- Projectors & Display Wall
By Vertical
- Clothing
- Consumer Electronics
- Food & Beverages
- Home Products
By Geography
- North America
- US
- Canada
- Mexico
- Rest of North America
- Europe
- Germany
- UK
- France
- Russia
- Spain
- Italy
- Rest of Europe
- Asia Pacific
- China
- Japan
- India
- South Korea
- Singapore
- Malaysia
- Rest of Asia Pacific
- LAMEA
- Brazil
- Argentina
- UAE
- Saudi Arabia
- South Africa
- Nigeria
- Rest of LAMEA
Companies Profiled
- Matterport, Inc.
- Scapic Innovations Private Limited (Flipkart Pvt. Ltd,) (Walmart Inc.)
- FXGear, Inc.
- Visualise Creative Limited
- Panedia Pty Ltd.
- FireBird VR
- KonceptVR LLC
- WeMakeVR
- Fiebak Medien
- Subvrsive, Inc.
Unique Offerings from KBV Research
- Exhaustive coverage
- Highest number of market tables and figures
- Subscription based model available
- Guaranteed best price
- Assured post sales research support with 10% customization free
Table of Contents
Chapter 1. Market Scope & Methodology
- 1.1 Market Definition
- 1.2 Objectives
- 1.3 Market Scope
- 1.4 Segmentation
- 1.4.1 Global Virtual Reality In Retail Market, by Application
- 1.4.2 Global Virtual Reality In Retail Market, by Component
- 1.4.3 Global Virtual Reality In Retail Market, by Device
- 1.4.4 Global Virtual Reality In Retail Market, by Vertical
- 1.4.5 Global Virtual Reality In Retail Market, by Geography
- 1.5 Methodology for the research
Chapter 2. Market Overview
- 2.1 Introduction
- 2.1.1 Overview
- 2.1.1.1 Market Composition and Scenario
- 2.1.1 Overview
- 2.2 Key Factors Impacting the Market
- 2.2.1 Market Drivers
- 2.2.2 Market Restraints
Chapter 3. Global Virtual Reality In Retail Market by Application
- 3.1 Global Advertising & Marketing Market by Region
- 3.2 Global Try-on Solutions Market by Region
- 3.3 Global Planning & Designing Market by Region
- 3.4 Global Information Systems Market by Region
Chapter 4. Global Virtual Reality In Retail Market by Component
- 4.1 Global Hardware Market by Region
- 4.2 Global Software Market by Region
- 4.3 Global Services Market by Region
Chapter 5. Global Virtual Reality In Retail Market by Device
- 5.1 Global Head Mounted Devices Market by Region
- 5.2 Global Gesture Tracking Device Market by Region
- 5.3 Global Projectors & Display Wall Market by Region
Chapter 6. Global Virtual Reality In Retail Market by Vertical
- 6.1 Global Clothing Market by Region
- 6.2 Global Consumer Electronics Market by Region
- 6.3 Global Food & Beverages Market by Region
- 6.4 Global Home Products Market by Region
Chapter 7. Global Virtual Reality In Retail Market by Region
- 7.1 North America Virtual Reality In Retail Market
- 7.1.1 North America Virtual Reality In Retail Market by Application
- 7.1.1.1 North America Advertising & Marketing Market by Country
- 7.1.1.2 North America Try-on Solutions Market by Country
- 7.1.1.3 North America Planning & Designing Market by Country
- 7.1.1.4 North America Information Systems Market by Country
- 7.1.2 North America Virtual Reality In Retail Market by Component
- 7.1.2.1 North America Hardware Market by Country
- 7.1.2.2 North America Software Market by Country
- 7.1.2.3 North America Services Market by Country
- 7.1.3 North America Virtual Reality In Retail Market by Device
- 7.1.3.1 North America Head Mounted Devices Market by Country
- 7.1.3.2 North America Gesture Tracking Device Market by Country
- 7.1.3.3 North America Projectors & Display Wall Market by Country
- 7.1.4 North America Virtual Reality In Retail Market by Vertical
- 7.1.4.1 North America Clothing Market by Country
- 7.1.4.2 North America Consumer Electronics Market by Country
- 7.1.4.3 North America Food & Beverages Market by Country
- 7.1.4.4 North America Home Products Market by Country
- 7.1.5 North America Virtual Reality In Retail Market by Country
- 7.1.5.1 US Virtual Reality In Retail Market
- 7.1.5.1.1 US Virtual Reality In Retail Market by Application
- 7.1.5.1.2 US Virtual Reality In Retail Market by Component
- 7.1.5.1.3 US Virtual Reality In Retail Market by Device
- 7.1.5.1.4 US Virtual Reality In Retail Market by Vertical
- 7.1.5.2 Canada Virtual Reality In Retail Market
- 7.1.5.2.1 Canada Virtual Reality In Retail Market by Application
- 7.1.5.2.2 Canada Virtual Reality In Retail Market by Component
- 7.1.5.2.3 Canada Virtual Reality In Retail Market by Device
- 7.1.5.2.4 Canada Virtual Reality In Retail Market by Vertical
- 7.1.5.3 Mexico Virtual Reality In Retail Market
- 7.1.5.3.1 Mexico Virtual Reality In Retail Market by Application
- 7.1.5.3.2 Mexico Virtual Reality In Retail Market by Component
- 7.1.5.3.3 Mexico Virtual Reality In Retail Market by Device
- 7.1.5.3.4 Mexico Virtual Reality In Retail Market by Vertical
- 7.1.5.4 Rest of North America Virtual Reality In Retail Market
- 7.1.5.4.1 Rest of North America Virtual Reality In Retail Market by Application
- 7.1.5.4.2 Rest of North America Virtual Reality In Retail Market by Component
- 7.1.5.4.3 Rest of North America Virtual Reality In Retail Market by Device
- 7.1.5.4.4 Rest of North America Virtual Reality In Retail Market by Vertical
- 7.1.5.1 US Virtual Reality In Retail Market
- 7.1.1 North America Virtual Reality In Retail Market by Application
- 7.2 Europe Virtual Reality In Retail Market
- 7.2.1 Europe Virtual Reality In Retail Market by Application
- 7.2.1.1 Europe Advertising & Marketing Market by Country
- 7.2.1.2 Europe Try-on Solutions Market by Country
- 7.2.1.3 Europe Planning & Designing Market by Country
- 7.2.1.4 Europe Information Systems Market by Country
- 7.2.2 Europe Virtual Reality In Retail Market by Component
- 7.2.2.1 Europe Hardware Market by Country
- 7.2.2.2 Europe Software Market by Country
- 7.2.2.3 Europe Services Market by Country
- 7.2.3 Europe Virtual Reality In Retail Market by Device
- 7.2.3.1 Europe Head Mounted Devices Market by Country
- 7.2.3.2 Europe Gesture Tracking Device Market by Country
- 7.2.3.3 Europe Projectors & Display Wall Market by Country
- 7.2.4 Europe Virtual Reality In Retail Market by Vertical
- 7.2.4.1 Europe Clothing Market by Country
- 7.2.4.2 Europe Consumer Electronics Market by Country
- 7.2.4.3 Europe Food & Beverages Market by Country
- 7.2.4.4 Europe Home Products Market by Country
- 7.2.5 Europe Virtual Reality In Retail Market by Country
- 7.2.5.1 Germany Virtual Reality In Retail Market
- 7.2.5.1.1 Germany Virtual Reality In Retail Market by Application
- 7.2.5.1.2 Germany Virtual Reality In Retail Market by Component
- 7.2.5.1.3 Germany Virtual Reality In Retail Market by Device
- 7.2.5.1.4 Germany Virtual Reality In Retail Market by Vertical
- 7.2.5.2 UK Virtual Reality In Retail Market
- 7.2.5.2.1 UK Virtual Reality In Retail Market by Application
- 7.2.5.2.2 UK Virtual Reality In Retail Market by Component
- 7.2.5.2.3 UK Virtual Reality In Retail Market by Device
- 7.2.5.2.4 UK Virtual Reality In Retail Market by Vertical
- 7.2.5.3 France Virtual Reality In Retail Market
- 7.2.5.3.1 France Virtual Reality In Retail Market by Application
- 7.2.5.3.2 France Virtual Reality In Retail Market by Component
- 7.2.5.3.3 France Virtual Reality In Retail Market by Device
- 7.2.5.3.4 France Virtual Reality In Retail Market by Vertical
- 7.2.5.4 Russia Virtual Reality In Retail Market
- 7.2.5.4.1 Russia Virtual Reality In Retail Market by Application
- 7.2.5.4.2 Russia Virtual Reality In Retail Market by Component
- 7.2.5.4.3 Russia Virtual Reality In Retail Market by Device
- 7.2.5.4.4 Russia Virtual Reality In Retail Market by Vertical
- 7.2.5.5 Spain Virtual Reality In Retail Market
- 7.2.5.5.1 Spain Virtual Reality In Retail Market by Application
- 7.2.5.5.2 Spain Virtual Reality In Retail Market by Component
- 7.2.5.5.3 Spain Virtual Reality In Retail Market by Device
- 7.2.5.5.4 Spain Virtual Reality In Retail Market by Vertical
- 7.2.5.6 Italy Virtual Reality In Retail Market
- 7.2.5.6.1 Italy Virtual Reality In Retail Market by Application
- 7.2.5.6.2 Italy Virtual Reality In Retail Market by Component
- 7.2.5.6.3 Italy Virtual Reality In Retail Market by Device
- 7.2.5.6.4 Italy Virtual Reality In Retail Market by Vertical
- 7.2.5.7 Rest of Europe Virtual Reality In Retail Market
- 7.2.5.7.1 Rest of Europe Virtual Reality In Retail Market by Application
- 7.2.5.7.2 Rest of Europe Virtual Reality In Retail Market by Component
- 7.2.5.7.3 Rest of Europe Virtual Reality In Retail Market by Device
- 7.2.5.7.4 Rest of Europe Virtual Reality In Retail Market by Vertical
- 7.2.5.1 Germany Virtual Reality In Retail Market
- 7.2.1 Europe Virtual Reality In Retail Market by Application
- 7.3 Asia Pacific Virtual Reality In Retail Market
- 7.3.1 Asia Pacific Virtual Reality In Retail Market by Application
- 7.3.1.1 Asia Pacific Advertising & Marketing Market by Country
- 7.3.1.2 Asia Pacific Try-on Solutions Market by Country
- 7.3.1.3 Asia Pacific Planning & Designing Market by Country
- 7.3.1.4 Asia Pacific Information Systems Market by Country
- 7.3.2 Asia Pacific Virtual Reality In Retail Market by Component
- 7.3.2.1 Asia Pacific Hardware Market by Country
- 7.3.2.2 Asia Pacific Software Market by Country
- 7.3.2.3 Asia Pacific Services Market by Country
- 7.3.3 Asia Pacific Virtual Reality In Retail Market by Device
- 7.3.3.1 Asia Pacific Head Mounted Devices Market by Country
- 7.3.3.2 Asia Pacific Gesture Tracking Device Market by Country
- 7.3.3.3 Asia Pacific Projectors & Display Wall Market by Country
- 7.3.4 Asia Pacific Virtual Reality In Retail Market by Vertical
- 7.3.4.1 Asia Pacific Clothing Market by Country
- 7.3.4.2 Asia Pacific Consumer Electronics Market by Country
- 7.3.4.3 Asia Pacific Food & Beverages Market by Country
- 7.3.4.4 Asia Pacific Home Products Market by Country
- 7.3.5 Asia Pacific Virtual Reality In Retail Market by Country
- 7.3.5.1 China Virtual Reality In Retail Market
- 7.3.5.1.1 China Virtual Reality In Retail Market by Application
- 7.3.5.1.2 China Virtual Reality In Retail Market by Component
- 7.3.5.1.3 China Virtual Reality In Retail Market by Device
- 7.3.5.1.4 China Virtual Reality In Retail Market by Vertical
- 7.3.5.2 Japan Virtual Reality In Retail Market
- 7.3.5.2.1 Japan Virtual Reality In Retail Market by Application
- 7.3.5.2.2 Japan Virtual Reality In Retail Market by Component
- 7.3.5.2.3 Japan Virtual Reality In Retail Market by Device
- 7.3.5.2.4 Japan Virtual Reality In Retail Market by Vertical
- 7.3.5.3 India Virtual Reality In Retail Market
- 7.3.5.3.1 India Virtual Reality In Retail Market by Application
- 7.3.5.3.2 India Virtual Reality In Retail Market by Component
- 7.3.5.3.3 India Virtual Reality In Retail Market by Device
- 7.3.5.3.4 India Virtual Reality In Retail Market by Vertical
- 7.3.5.4 South Korea Virtual Reality In Retail Market
- 7.3.5.4.1 South Korea Virtual Reality In Retail Market by Application
- 7.3.5.4.2 South Korea Virtual Reality In Retail Market by Component
- 7.3.5.4.3 South Korea Virtual Reality In Retail Market by Device
- 7.3.5.4.4 South Korea Virtual Reality In Retail Market by Vertical
- 7.3.5.5 Singapore Virtual Reality In Retail Market
- 7.3.5.5.1 Singapore Virtual Reality In Retail Market by Application
- 7.3.5.5.2 Singapore Virtual Reality In Retail Market by Component
- 7.3.5.5.3 Singapore Virtual Reality In Retail Market by Device
- 7.3.5.5.4 Singapore Virtual Reality In Retail Market by Vertical
- 7.3.5.6 Malaysia Virtual Reality In Retail Market
- 7.3.5.6.1 Malaysia Virtual Reality In Retail Market by Application
- 7.3.5.6.2 Malaysia Virtual Reality In Retail Market by Component
- 7.3.5.6.3 Malaysia Virtual Reality In Retail Market by Device
- 7.3.5.6.4 Malaysia Virtual Reality In Retail Market by Vertical
- 7.3.5.7 Rest of Asia Pacific Virtual Reality In Retail Market
- 7.3.5.7.1 Rest of Asia Pacific Virtual Reality In Retail Market by Application
- 7.3.5.7.2 Rest of Asia Pacific Virtual Reality In Retail Market by Component
- 7.3.5.7.3 Rest of Asia Pacific Virtual Reality In Retail Market by Device
- 7.3.5.7.4 Rest of Asia Pacific Virtual Reality In Retail Market by Vertical
- 7.3.5.1 China Virtual Reality In Retail Market
- 7.3.1 Asia Pacific Virtual Reality In Retail Market by Application
- 7.4 LAMEA Virtual Reality In Retail Market
- 7.4.1 LAMEA Virtual Reality In Retail Market by Application
- 7.4.1.1 LAMEA Advertising & Marketing Market by Country
- 7.4.1.2 LAMEA Try-on Solutions Market by Country
- 7.4.1.3 LAMEA Planning & Designing Market by Country
- 7.4.1.4 LAMEA Information Systems Market by Country
- 7.4.2 LAMEA Virtual Reality In Retail Market by Component
- 7.4.2.1 LAMEA Hardware Market by Country
- 7.4.2.2 LAMEA Software Market by Country
- 7.4.2.3 LAMEA Services Market by Country
- 7.4.3 LAMEA Virtual Reality In Retail Market by Device
- 7.4.3.1 LAMEA Head Mounted Devices Market by Country
- 7.4.3.2 LAMEA Gesture Tracking Device Market by Country
- 7.4.3.3 LAMEA Projectors & Display Wall Market by Country
- 7.4.4 LAMEA Virtual Reality In Retail Market by Vertical
- 7.4.4.1 LAMEA Clothing Market by Country
- 7.4.4.2 LAMEA Consumer Electronics Market by Country
- 7.4.4.3 LAMEA Food & Beverages Market by Country
- 7.4.4.4 LAMEA Home Products Market by Country
- 7.4.5 LAMEA Virtual Reality In Retail Market by Country
- 7.4.5.1 Brazil Virtual Reality In Retail Market
- 7.4.5.1.1 Brazil Virtual Reality In Retail Market by Application
- 7.4.5.1.2 Brazil Virtual Reality In Retail Market by Component
- 7.4.5.1.3 Brazil Virtual Reality In Retail Market by Device
- 7.4.5.1.4 Brazil Virtual Reality In Retail Market by Vertical
- 7.4.5.2 Argentina Virtual Reality In Retail Market
- 7.4.5.2.1 Argentina Virtual Reality In Retail Market by Application
- 7.4.5.2.2 Argentina Virtual Reality In Retail Market by Component
- 7.4.5.2.3 Argentina Virtual Reality In Retail Market by Device
- 7.4.5.2.4 Argentina Virtual Reality In Retail Market by Vertical
- 7.4.5.3 UAE Virtual Reality In Retail Market
- 7.4.5.3.1 UAE Virtual Reality In Retail Market by Application
- 7.4.5.3.2 UAE Virtual Reality In Retail Market by Component
- 7.4.5.3.3 UAE Virtual Reality In Retail Market by Device
- 7.4.5.3.4 UAE Virtual Reality In Retail Market by Vertical
- 7.4.5.4 Saudi Arabia Virtual Reality In Retail Market
- 7.4.5.4.1 Saudi Arabia Virtual Reality In Retail Market by Application
- 7.4.5.4.2 Saudi Arabia Virtual Reality In Retail Market by Component
- 7.4.5.4.3 Saudi Arabia Virtual Reality In Retail Market by Device
- 7.4.5.4.4 Saudi Arabia Virtual Reality In Retail Market by Vertical
- 7.4.5.5 South Africa Virtual Reality In Retail Market
- 7.4.5.5.1 South Africa Virtual Reality In Retail Market by Application
- 7.4.5.5.2 South Africa Virtual Reality In Retail Market by Component
- 7.4.5.5.3 South Africa Virtual Reality In Retail Market by Device
- 7.4.5.5.4 South Africa Virtual Reality In Retail Market by Vertical
- 7.4.5.6 Nigeria Virtual Reality In Retail Market
- 7.4.5.6.1 Nigeria Virtual Reality In Retail Market by Application
- 7.4.5.6.2 Nigeria Virtual Reality In Retail Market by Component
- 7.4.5.6.3 Nigeria Virtual Reality In Retail Market by Device
- 7.4.5.6.4 Nigeria Virtual Reality In Retail Market by Vertical
- 7.4.5.7 Rest of LAMEA Virtual Reality In Retail Market
- 7.4.5.7.1 Rest of LAMEA Virtual Reality In Retail Market by Application
- 7.4.5.7.2 Rest of LAMEA Virtual Reality In Retail Market by Component
- 7.4.5.7.3 Rest of LAMEA Virtual Reality In Retail Market by Device
- 7.4.5.7.4 Rest of LAMEA Virtual Reality In Retail Market by Vertical
- 7.4.5.1 Brazil Virtual Reality In Retail Market
- 7.4.1 LAMEA Virtual Reality In Retail Market by Application
Chapter 8. Company Profiles
- 8.1 Matterport, Inc.
- 8.1.1 Company Overview
- 8.1.2 Financial Analysis
- 8.1.3 Research & Development Expenses
- 8.1.4 Recent strategies and developments:
- 8.1.4.1 Partnerships, Collaborations, and Agreements:
- 8.2 Scapic Innovations Private Limited (Flipkart Pvt. Ltd,) (Walmart Inc.)
- 8.2.1 Company Overview
- 8.2.2 Financial Analysis
- 8.2.3 Segmental and Regional Analysis
- 8.3 FXGear, Inc.
- 8.3.1 Company Overview
- 8.3.2 Recent strategies and developments:
- 8.3.2.1 Product Launches and Product Expansions:
- 8.4 Visualise Creative Limited
- 8.4.1 Company Overview
- 8.5 Panedia Pty Ltd.
- 8.5.1 Company Overview
- 8.6 FireBird VR
- 8.6.1 Company Overview
- 8.7 KonceptVR LLC
- 8.7.1 Company Overview
- 8.8 WeMakeVR.
- 8.8.1 Company Overview
- 8.9 Fiebak Medien
- 8.9.1 Company Overview
- 8.10. Subvrsive, Inc.
- 8.10.1 Company Overview
