|
|
市場調査レポート
商品コード
1309700
没入型分析の世界市場規模、シェア、産業動向分析レポート:オファリング別(ハードウェア(AR/VR/MRヘッドセット、ディスプレイ、センサー&コントローラ、その他)、ソリューション別、サービス別)、最終用途別、地域別展望と予測、2023年~2030年Global Immersive Analytics Market Size, Share & Industry Trends Analysis Report By Offering (Hardware (AR/VR/MR Headset, Displays, Sensors & Controllers, and Others), Solution, and Services), By End-Use, By Regional Outlook and Forecast, 2023 - 2030 |
||||||
|
|
|||||||
|
|||||||


| 没入型分析の世界市場規模、シェア、産業動向分析レポート:オファリング別(ハードウェア(AR/VR/MRヘッドセット、ディスプレイ、センサー&コントローラ、その他)、ソリューション別、サービス別)、最終用途別、地域別展望と予測、2023年~2030年 |
|
出版日: 2023年06月30日
発行: KBV Research
ページ情報: 英文 256 Pages
納期: 即納可能
|

- 全表示
- 概要
- 図表
- 目次
没入型分析市場規模は2030年までに132億米ドルに達すると予測され、予測期間中のCAGRは47.5%で上昇する見込みです。
オファリングの展望
オファリングに基づき、市場はハードウェア、ソリューション、サービスに分類されます。サービスセグメントは、2022年の市場においてかなりの成長率を確保しました。マネージドサービスとプロフェッショナルサービスは、どちらも没入型分析サービスに含まれます。組織が没入型データ可視化・分析技術の導入を成功させるために、これらのサービスは戦略的アドバイス、専門的開発、強化された可視化、トレーニングプログラム、シームレスなユーザー体験、既存システムとの統合、継続的サポートを提供します。没入型分析を利用して理解と意思決定を向上させるために、組織は独自のニーズに応じてサービスを選択することができます。
ハードウェアタイプの展望
ハードウェアの種類によって、市場はAR/VR/MRヘッドセット、ディスプレイ、センサー&コントローラー、その他に分類されます。AR/VR/MRヘッドセット分野は、2022年の市場で最大の収益シェアを獲得しました。AR/VR/MRヘッドセットは、ユーザーが3次元環境でデータに関与できるようにすることで、没入感を高める。複雑なデータセットの深い理解は、これらの改善された機能によって可能になり、従来のデータ表現では見つけることが困難であった複雑な動向やパターンを発見することも可能になります。これらのヘッドセットは、アナリスト、データ科学者、利害関係者間のシームレスなコミュニケーションを可能にし、データ分析と意思決定の効率、精度、品質を向上させます。
最終用途の展望
最終用途別では、ヘルスケア、政府・防衛、自動車・輸送、建設、メディア・娯楽、その他に分けられます。2022年の市場収益シェアは、ヘルスケア分野が最大となっています。ヘルスケア分野におけるデジタル変革により、没入型アナリティクスが普及すると予測されています。医療機器のモデリング、患者のモニタリング、患者の診断はすべて、ヘルスケア分野における技術的ブレークスルーと発明によって容易になっています。新しい治療法、状況、技術のシミュレーションとテストのために、没入型分析システムはヘルスケアとライフサイエンス企業が患者データの収集、取り扱い、処理、提示方法を効果的に管理するのを支援します。
地域別展望
地域別に見ると、市場は北米、欧州、アジア太平洋、LAMEAで分析されます。北米セグメントは、2022年の市場で最も高い収益シェアを獲得しました。北米市場の収益と利益は、同地域の新興国市場の拡大と消費者の嗜好の変化によるところが大きいです。ヘッドマウントディスプレイの需要拡大も、同地域の裕福な国々におけるその希少性と好感度の上昇によって拍車がかかっています。インタラクティブなバーチャル・イノベーションの需要は、Zeality Corporation、Unity Development Corporation、Lockheed Martin、HCL Technologies、Google、Wizard Jumping、Constrainedなど、業界をリードする企業が国内に存在するため、予測期間を通じて急速な収益成長が見込まれています。
目次
第1章 市場範囲と調査手法
- 市場の定義
- 目的
- 市場範囲
- セグメンテーション
- 調査手法
第2章 市場概要
- イントロダクション
- 概要
- 市場構成とシナリオ
- 概要
- 市場に影響を与える主な要因
- 市場促進要因
- 市場抑制要因
第3章 競合分析- 世界
- KBVカーディナルマトリックス
- 最近の業界全体の戦略的展開
- パートナーシップ、コラボレーション、および契約
- 製品の発売と製品の拡大
- 買収と合併
- 市場シェア分析、2021年
- 主要成功戦略
- 主な戦略
- 主要な戦略的動き
第4章 世界の没入型分析市場:オファリング別
- 世界のハードウェア市場:地域別
- 世界の没入型分析市場:ハードウェアの種類別
- 世界のAR/VR/MRヘッドセット市場:地域別
- 世界のディスプレイ市場:地域別
- 世界のセンサーおよびコントローラー市場:地域別
- 世界のその他の市場:地域別
- 世界のソリューション市場:地域別
- 世界のサービス市場:地域別
第5章 世界の没入型分析市場:最終用途別
- 世界のヘルスケア市場:地域別
- 世界の政府および防衛市場:地域別
- 世界の自動車および輸送市場:地域別
- 世界の建設市場:地域別
- 世界のメディア&エンターテインメント市場:地域別
- 世界のその他の市場:地域別
第6章 世界の没入型分析市場:地域別
- 北米
- 北米の市場:国別
- 米国
- カナダ
- メキシコ
- その他北米地域
- 北米の市場:国別
- 欧州
- 欧州の市場:国別
- ドイツ
- 英国
- フランス
- ロシア
- スペイン
- イタリア
- その他欧州地域
- 欧州の市場:国別
- アジア太平洋
- アジア太平洋の市場:国別
- 中国
- 日本
- インド
- 韓国
- シンガポール
- マレーシア
- その他アジア太平洋地域
- アジア太平洋の市場:国別
- ラテンアメリカ・中東・アフリカ
- ラテンアメリカ・中東・アフリカの市場:国別
- ブラジル
- アルゼンチン
- アラブ首長国連邦
- サウジアラビア
- 南アフリカ
- ナイジェリア
- その他ラテンアメリカ・中東・アフリカ地域
- ラテンアメリカ・中東・アフリカの市場:国別
第7章 企業プロファイル
- Microsoft Corporation
- IBM Corporation
- Accenture PLC
- Google LLC(Alphabet Inc)
- SAP SE
- Meta Platforms, Inc
- HTC Corporation
- HP, Inc
- Tibco Software, Inc(Vista Equity Partners)
- Magic Leap, Inc
LIST OF TABLES
- TABLE 1 Global Immersive Analytics Market, 2019 - 2022, USD Million
- TABLE 2 Global Immersive Analytics Market, 2023 - 2030, USD Million
- TABLE 3 Partnerships, Collaborations and Agreements- Immersive Analytics Market
- TABLE 4 Product Launches And Product Expansions- Immersive Analytics Market
- TABLE 5 Acquisition and Mergers- Immersive Analytics Market
- TABLE 6 Global Immersive Analytics Market by Offering, 2019 - 2022, USD Million
- TABLE 7 Global Immersive Analytics Market by Offering, 2023 - 2030, USD Million
- TABLE 8 Global Hardware Market by Region, 2019 - 2022, USD Million
- TABLE 9 Global Hardware Market by Region, 2023 - 2030, USD Million
- TABLE 10 Global Immersive Analytics Market by Hardware Type, 2019 - 2022, USD Million
- TABLE 11 Global Immersive Analytics Market by Hardware Type, 2023 - 2030, USD Million
- TABLE 12 Global AR/VR/MR Headset Market by Region, 2019 - 2022, USD Million
- TABLE 13 Global AR/VR/MR Headset Market by Region, 2023 - 2030, USD Million
- TABLE 14 Global Displays Market by Region, 2019 - 2022, USD Million
- TABLE 15 Global Displays Market by Region, 2023 - 2030, USD Million
- TABLE 16 Global Sensors & Controllers Market by Region, 2019 - 2022, USD Million
- TABLE 17 Global Sensors & Controllers Market by Region, 2023 - 2030, USD Million
- TABLE 18 Global Others Market by Region, 2019 - 2022, USD Million
- TABLE 19 Global Others Market by Region, 2023 - 2030, USD Million
- TABLE 20 Global Solution Market by Region, 2019 - 2022, USD Million
- TABLE 21 Global Solution Market by Region, 2023 - 2030, USD Million
- TABLE 22 Global Services Market by Region, 2019 - 2022, USD Million
- TABLE 23 Global Services Market by Region, 2023 - 2030, USD Million
- TABLE 24 Global Immersive Analytics Market by End-use, 2019 - 2022, USD Million
- TABLE 25 Global Immersive Analytics Market by End-use, 2023 - 2030, USD Million
- TABLE 26 Global Healthcare Market by Region, 2019 - 2022, USD Million
- TABLE 27 Global Healthcare Market by Region, 2023 - 2030, USD Million
- TABLE 28 Global Government & Defense Market by Region, 2019 - 2022, USD Million
- TABLE 29 Global Government & Defense Market by Region, 2023 - 2030, USD Million
- TABLE 30 Global Automotive & Transportation Market by Region, 2019 - 2022, USD Million
- TABLE 31 Global Automotive & Transportation Market by Region, 2023 - 2030, USD Million
- TABLE 32 Global Construction Market by Region, 2019 - 2022, USD Million
- TABLE 33 Global Construction Market by Region, 2023 - 2030, USD Million
- TABLE 34 Global Media & Entertainment Market by Region, 2019 - 2022, USD Million
- TABLE 35 Global Media & Entertainment Market by Region, 2023 - 2030, USD Million
- TABLE 36 Global Others Market by Region, 2019 - 2022, USD Million
- TABLE 37 Global Others Market by Region, 2023 - 2030, USD Million
- TABLE 38 Global Immersive Analytics Market by Region, 2019 - 2022, USD Million
- TABLE 39 Global Immersive Analytics Market by Region, 2023 - 2030, USD Million
- TABLE 40 North America Immersive Analytics Market, 2019 - 2022, USD Million
- TABLE 41 North America Immersive Analytics Market, 2023 - 2030, USD Million
- TABLE 42 North America Immersive Analytics Market by Offering, 2019 - 2022, USD Million
- TABLE 43 North America Immersive Analytics Market by Offering, 2023 - 2030, USD Million
- TABLE 44 North America Hardware Market by Country, 2019 - 2022, USD Million
- TABLE 45 North America Hardware Market by Country, 2023 - 2030, USD Million
- TABLE 46 North America Immersive Analytics Market by Hardware Type, 2019 - 2022, USD Million
- TABLE 47 North America Immersive Analytics Market by Hardware Type, 2023 - 2030, USD Million
- TABLE 48 North America AR/VR/MR Headset Market by Country, 2019 - 2022, USD Million
- TABLE 49 North America AR/VR/MR Headset Market by Country, 2023 - 2030, USD Million
- TABLE 50 North America Displays Market by Country, 2019 - 2022, USD Million
- TABLE 51 North America Displays Market by Country, 2023 - 2030, USD Million
- TABLE 52 North America Sensors & Controllers Market by Country, 2019 - 2022, USD Million
- TABLE 53 North America Sensors & Controllers Market by Country, 2023 - 2030, USD Million
- TABLE 54 North America Others Market by Country, 2019 - 2022, USD Million
- TABLE 55 North America Others Market by Country, 2023 - 2030, USD Million
- TABLE 56 North America Solution Market by Country, 2019 - 2022, USD Million
- TABLE 57 North America Solution Market by Country, 2023 - 2030, USD Million
- TABLE 58 North America Services Market by Country, 2019 - 2022, USD Million
- TABLE 59 North America Services Market by Country, 2023 - 2030, USD Million
- TABLE 60 North America Immersive Analytics Market by End-use, 2019 - 2022, USD Million
- TABLE 61 North America Immersive Analytics Market by End-use, 2023 - 2030, USD Million
- TABLE 62 North America Healthcare Market by Country, 2019 - 2022, USD Million
- TABLE 63 North America Healthcare Market by Country, 2023 - 2030, USD Million
- TABLE 64 North America Government & Defense Market by Country, 2019 - 2022, USD Million
- TABLE 65 North America Government & Defense Market by Country, 2023 - 2030, USD Million
- TABLE 66 North America Automotive & Transportation Market by Country, 2019 - 2022, USD Million
- TABLE 67 North America Automotive & Transportation Market by Country, 2023 - 2030, USD Million
- TABLE 68 North America Construction Market by Country, 2019 - 2022, USD Million
- TABLE 69 North America Construction Market by Country, 2023 - 2030, USD Million
- TABLE 70 North America Media & Entertainment Market by Country, 2019 - 2022, USD Million
- TABLE 71 North America Media & Entertainment Market by Country, 2023 - 2030, USD Million
- TABLE 72 North America Others Market by Country, 2019 - 2022, USD Million
- TABLE 73 North America Others Market by Country, 2023 - 2030, USD Million
- TABLE 74 North America Immersive Analytics Market by Country, 2019 - 2022, USD Million
- TABLE 75 North America Immersive Analytics Market by Country, 2023 - 2030, USD Million
- TABLE 76 US Immersive Analytics Market, 2019 - 2022, USD Million
- TABLE 77 US Immersive Analytics Market, 2023 - 2030, USD Million
- TABLE 78 US Immersive Analytics Market by Offering, 2019 - 2022, USD Million
- TABLE 79 US Immersive Analytics Market by Offering, 2023 - 2030, USD Million
- TABLE 80 US Immersive Analytics Market by Hardware Type, 2019 - 2022, USD Million
- TABLE 81 US Immersive Analytics Market by Hardware Type, 2023 - 2030, USD Million
- TABLE 82 US Immersive Analytics Market by End-use, 2019 - 2022, USD Million
- TABLE 83 US Immersive Analytics Market by End-use, 2023 - 2030, USD Million
- TABLE 84 Canada Immersive Analytics Market, 2019 - 2022, USD Million
- TABLE 85 Canada Immersive Analytics Market, 2023 - 2030, USD Million
- TABLE 86 Canada Immersive Analytics Market by Offering, 2019 - 2022, USD Million
- TABLE 87 Canada Immersive Analytics Market by Offering, 2023 - 2030, USD Million
- TABLE 88 Canada Immersive Analytics Market by Hardware Type, 2019 - 2022, USD Million
- TABLE 89 Canada Immersive Analytics Market by Hardware Type, 2023 - 2030, USD Million
- TABLE 90 Canada Immersive Analytics Market by End-use, 2019 - 2022, USD Million
- TABLE 91 Canada Immersive Analytics Market by End-use, 2023 - 2030, USD Million
- TABLE 92 Mexico Immersive Analytics Market, 2019 - 2022, USD Million
- TABLE 93 Mexico Immersive Analytics Market, 2023 - 2030, USD Million
- TABLE 94 Mexico Immersive Analytics Market by Offering, 2019 - 2022, USD Million
- TABLE 95 Mexico Immersive Analytics Market by Offering, 2023 - 2030, USD Million
- TABLE 96 Mexico Immersive Analytics Market by Hardware Type, 2019 - 2022, USD Million
- TABLE 97 Mexico Immersive Analytics Market by Hardware Type, 2023 - 2030, USD Million
- TABLE 98 Mexico Immersive Analytics Market by End-use, 2019 - 2022, USD Million
- TABLE 99 Mexico Immersive Analytics Market by End-use, 2023 - 2030, USD Million
- TABLE 100 Rest of North America Immersive Analytics Market, 2019 - 2022, USD Million
- TABLE 101 Rest of North America Immersive Analytics Market, 2023 - 2030, USD Million
- TABLE 102 Rest of North America Immersive Analytics Market by Offering, 2019 - 2022, USD Million
- TABLE 103 Rest of North America Immersive Analytics Market by Offering, 2023 - 2030, USD Million
- TABLE 104 Rest of North America Immersive Analytics Market by Hardware Type, 2019 - 2022, USD Million
- TABLE 105 Rest of North America Immersive Analytics Market by Hardware Type, 2023 - 2030, USD Million
- TABLE 106 Rest of North America Immersive Analytics Market by End-use, 2019 - 2022, USD Million
- TABLE 107 Rest of North America Immersive Analytics Market by End-use, 2023 - 2030, USD Million
- TABLE 108 Europe Immersive Analytics Market, 2019 - 2022, USD Million
- TABLE 109 Europe Immersive Analytics Market, 2023 - 2030, USD Million
- TABLE 110 Europe Immersive Analytics Market by Offering, 2019 - 2022, USD Million
- TABLE 111 Europe Immersive Analytics Market by Offering, 2023 - 2030, USD Million
- TABLE 112 Europe Hardware Market by Country, 2019 - 2022, USD Million
- TABLE 113 Europe Hardware Market by Country, 2023 - 2030, USD Million
- TABLE 114 Europe Immersive Analytics Market by Hardware Type, 2019 - 2022, USD Million
- TABLE 115 Europe Immersive Analytics Market by Hardware Type, 2023 - 2030, USD Million
- TABLE 116 Europe AR/VR/MR Headset Market by Country, 2019 - 2022, USD Million
- TABLE 117 Europe AR/VR/MR Headset Market by Country, 2023 - 2030, USD Million
- TABLE 118 Europe Displays Market by Country, 2019 - 2022, USD Million
- TABLE 119 Europe Displays Market by Country, 2023 - 2030, USD Million
- TABLE 120 Europe Sensors & Controllers Market by Country, 2019 - 2022, USD Million
- TABLE 121 Europe Sensors & Controllers Market by Country, 2023 - 2030, USD Million
- TABLE 122 Europe Others Market by Country, 2019 - 2022, USD Million
- TABLE 123 Europe Others Market by Country, 2023 - 2030, USD Million
- TABLE 124 Europe Solution Market by Country, 2019 - 2022, USD Million
- TABLE 125 Europe Solution Market by Country, 2023 - 2030, USD Million
- TABLE 126 Europe Services Market by Country, 2019 - 2022, USD Million
- TABLE 127 Europe Services Market by Country, 2023 - 2030, USD Million
- TABLE 128 Europe Immersive Analytics Market by End-use, 2019 - 2022, USD Million
- TABLE 129 Europe Immersive Analytics Market by End-use, 2023 - 2030, USD Million
- TABLE 130 Europe Healthcare Market by Country, 2019 - 2022, USD Million
- TABLE 131 Europe Healthcare Market by Country, 2023 - 2030, USD Million
- TABLE 132 Europe Government & Defense Market by Country, 2019 - 2022, USD Million
- TABLE 133 Europe Government & Defense Market by Country, 2023 - 2030, USD Million
- TABLE 134 Europe Automotive & Transportation Market by Country, 2019 - 2022, USD Million
- TABLE 135 Europe Automotive & Transportation Market by Country, 2023 - 2030, USD Million
- TABLE 136 Europe Construction Market by Country, 2019 - 2022, USD Million
- TABLE 137 Europe Construction Market by Country, 2023 - 2030, USD Million
- TABLE 138 Europe Media & Entertainment Market by Country, 2019 - 2022, USD Million
- TABLE 139 Europe Media & Entertainment Market by Country, 2023 - 2030, USD Million
- TABLE 140 Europe Others Market by Country, 2019 - 2022, USD Million
- TABLE 141 Europe Others Market by Country, 2023 - 2030, USD Million
- TABLE 142 Europe Immersive Analytics Market by Country, 2019 - 2022, USD Million
- TABLE 143 Europe Immersive Analytics Market by Country, 2023 - 2030, USD Million
- TABLE 144 Germany Immersive Analytics Market, 2019 - 2022, USD Million
- TABLE 145 Germany Immersive Analytics Market, 2023 - 2030, USD Million
- TABLE 146 Germany Immersive Analytics Market by Offering, 2019 - 2022, USD Million
- TABLE 147 Germany Immersive Analytics Market by Offering, 2023 - 2030, USD Million
- TABLE 148 Germany Immersive Analytics Market by Hardware Type, 2019 - 2022, USD Million
- TABLE 149 Germany Immersive Analytics Market by Hardware Type, 2023 - 2030, USD Million
- TABLE 150 Germany Immersive Analytics Market by End-use, 2019 - 2022, USD Million
- TABLE 151 Germany Immersive Analytics Market by End-use, 2023 - 2030, USD Million
- TABLE 152 UK Immersive Analytics Market, 2019 - 2022, USD Million
- TABLE 153 UK Immersive Analytics Market, 2023 - 2030, USD Million
- TABLE 154 UK Immersive Analytics Market by Offering, 2019 - 2022, USD Million
- TABLE 155 UK Immersive Analytics Market by Offering, 2023 - 2030, USD Million
- TABLE 156 UK Immersive Analytics Market by Hardware Type, 2019 - 2022, USD Million
- TABLE 157 UK Immersive Analytics Market by Hardware Type, 2023 - 2030, USD Million
- TABLE 158 UK Immersive Analytics Market by End-use, 2019 - 2022, USD Million
- TABLE 159 UK Immersive Analytics Market by End-use, 2023 - 2030, USD Million
- TABLE 160 France Immersive Analytics Market, 2019 - 2022, USD Million
- TABLE 161 France Immersive Analytics Market, 2023 - 2030, USD Million
- TABLE 162 France Immersive Analytics Market by Offering, 2019 - 2022, USD Million
- TABLE 163 France Immersive Analytics Market by Offering, 2023 - 2030, USD Million
- TABLE 164 France Immersive Analytics Market by Hardware Type, 2019 - 2022, USD Million
- TABLE 165 France Immersive Analytics Market by Hardware Type, 2023 - 2030, USD Million
- TABLE 166 France Immersive Analytics Market by End-use, 2019 - 2022, USD Million
- TABLE 167 France Immersive Analytics Market by End-use, 2023 - 2030, USD Million
- TABLE 168 Russia Immersive Analytics Market, 2019 - 2022, USD Million
- TABLE 169 Russia Immersive Analytics Market, 2023 - 2030, USD Million
- TABLE 170 Russia Immersive Analytics Market by Offering, 2019 - 2022, USD Million
- TABLE 171 Russia Immersive Analytics Market by Offering, 2023 - 2030, USD Million
- TABLE 172 Russia Immersive Analytics Market by Hardware Type, 2019 - 2022, USD Million
- TABLE 173 Russia Immersive Analytics Market by Hardware Type, 2023 - 2030, USD Million
- TABLE 174 Russia Immersive Analytics Market by End-use, 2019 - 2022, USD Million
- TABLE 175 Russia Immersive Analytics Market by End-use, 2023 - 2030, USD Million
- TABLE 176 Spain Immersive Analytics Market, 2019 - 2022, USD Million
- TABLE 177 Spain Immersive Analytics Market, 2023 - 2030, USD Million
- TABLE 178 Spain Immersive Analytics Market by Offering, 2019 - 2022, USD Million
- TABLE 179 Spain Immersive Analytics Market by Offering, 2023 - 2030, USD Million
- TABLE 180 Spain Immersive Analytics Market by Hardware Type, 2019 - 2022, USD Million
- TABLE 181 Spain Immersive Analytics Market by Hardware Type, 2023 - 2030, USD Million
- TABLE 182 Spain Immersive Analytics Market by End-use, 2019 - 2022, USD Million
- TABLE 183 Spain Immersive Analytics Market by End-use, 2023 - 2030, USD Million
- TABLE 184 Italy Immersive Analytics Market, 2019 - 2022, USD Million
- TABLE 185 Italy Immersive Analytics Market, 2023 - 2030, USD Million
- TABLE 186 Italy Immersive Analytics Market by Offering, 2019 - 2022, USD Million
- TABLE 187 Italy Immersive Analytics Market by Offering, 2023 - 2030, USD Million
- TABLE 188 Italy Immersive Analytics Market by Hardware Type, 2019 - 2022, USD Million
- TABLE 189 Italy Immersive Analytics Market by Hardware Type, 2023 - 2030, USD Million
- TABLE 190 Italy Immersive Analytics Market by End-use, 2019 - 2022, USD Million
- TABLE 191 Italy Immersive Analytics Market by End-use, 2023 - 2030, USD Million
- TABLE 192 Rest of Europe Immersive Analytics Market, 2019 - 2022, USD Million
- TABLE 193 Rest of Europe Immersive Analytics Market, 2023 - 2030, USD Million
- TABLE 194 Rest of Europe Immersive Analytics Market by Offering, 2019 - 2022, USD Million
- TABLE 195 Rest of Europe Immersive Analytics Market by Offering, 2023 - 2030, USD Million
- TABLE 196 Rest of Europe Immersive Analytics Market by Hardware Type, 2019 - 2022, USD Million
- TABLE 197 Rest of Europe Immersive Analytics Market by Hardware Type, 2023 - 2030, USD Million
- TABLE 198 Rest of Europe Immersive Analytics Market by End-use, 2019 - 2022, USD Million
- TABLE 199 Rest of Europe Immersive Analytics Market by End-use, 2023 - 2030, USD Million
- TABLE 200 Asia Pacific Immersive Analytics Market, 2019 - 2022, USD Million
- TABLE 201 Asia Pacific Immersive Analytics Market, 2023 - 2030, USD Million
- TABLE 202 Asia Pacific Immersive Analytics Market by Offering, 2019 - 2022, USD Million
- TABLE 203 Asia Pacific Immersive Analytics Market by Offering, 2023 - 2030, USD Million
- TABLE 204 Asia Pacific Hardware Market by Country, 2019 - 2022, USD Million
- TABLE 205 Asia Pacific Hardware Market by Country, 2023 - 2030, USD Million
- TABLE 206 Asia Pacific Immersive Analytics Market by Hardware Type, 2019 - 2022, USD Million
- TABLE 207 Asia Pacific Immersive Analytics Market by Hardware Type, 2023 - 2030, USD Million
- TABLE 208 Asia Pacific AR/VR/MR Headset Market by Country, 2019 - 2022, USD Million
- TABLE 209 Asia Pacific AR/VR/MR Headset Market by Country, 2023 - 2030, USD Million
- TABLE 210 Asia Pacific Displays Market by Country, 2019 - 2022, USD Million
- TABLE 211 Asia Pacific Displays Market by Country, 2023 - 2030, USD Million
- TABLE 212 Asia Pacific Sensors & Controllers Market by Country, 2019 - 2022, USD Million
- TABLE 213 Asia Pacific Sensors & Controllers Market by Country, 2023 - 2030, USD Million
- TABLE 214 Asia Pacific Others Market by Country, 2019 - 2022, USD Million
- TABLE 215 Asia Pacific Others Market by Country, 2023 - 2030, USD Million
- TABLE 216 Asia Pacific Solution Market by Country, 2019 - 2022, USD Million
- TABLE 217 Asia Pacific Solution Market by Country, 2023 - 2030, USD Million
- TABLE 218 Asia Pacific Services Market by Country, 2019 - 2022, USD Million
- TABLE 219 Asia Pacific Services Market by Country, 2023 - 2030, USD Million
- TABLE 220 Asia Pacific Immersive Analytics Market by End-use, 2019 - 2022, USD Million
- TABLE 221 Asia Pacific Immersive Analytics Market by End-use, 2023 - 2030, USD Million
- TABLE 222 Asia Pacific Healthcare Market by Country, 2019 - 2022, USD Million
- TABLE 223 Asia Pacific Healthcare Market by Country, 2023 - 2030, USD Million
- TABLE 224 Asia Pacific Government & Defense Market by Country, 2019 - 2022, USD Million
- TABLE 225 Asia Pacific Government & Defense Market by Country, 2023 - 2030, USD Million
- TABLE 226 Asia Pacific Automotive & Transportation Market by Country, 2019 - 2022, USD Million
- TABLE 227 Asia Pacific Automotive & Transportation Market by Country, 2023 - 2030, USD Million
- TABLE 228 Asia Pacific Construction Market by Country, 2019 - 2022, USD Million
- TABLE 229 Asia Pacific Construction Market by Country, 2023 - 2030, USD Million
- TABLE 230 Asia Pacific Media & Entertainment Market by Country, 2019 - 2022, USD Million
- TABLE 231 Asia Pacific Media & Entertainment Market by Country, 2023 - 2030, USD Million
- TABLE 232 Asia Pacific Others Market by Country, 2019 - 2022, USD Million
- TABLE 233 Asia Pacific Others Market by Country, 2023 - 2030, USD Million
- TABLE 234 Asia Pacific Immersive Analytics Market by Country, 2019 - 2022, USD Million
- TABLE 235 Asia Pacific Immersive Analytics Market by Country, 2023 - 2030, USD Million
- TABLE 236 China Immersive Analytics Market, 2019 - 2022, USD Million
- TABLE 237 China Immersive Analytics Market, 2023 - 2030, USD Million
- TABLE 238 China Immersive Analytics Market by Offering, 2019 - 2022, USD Million
- TABLE 239 China Immersive Analytics Market by Offering, 2023 - 2030, USD Million
- TABLE 240 China Immersive Analytics Market by Hardware Type, 2019 - 2022, USD Million
- TABLE 241 China Immersive Analytics Market by Hardware Type, 2023 - 2030, USD Million
- TABLE 242 China Immersive Analytics Market by End-use, 2019 - 2022, USD Million
- TABLE 243 China Immersive Analytics Market by End-use, 2023 - 2030, USD Million
- TABLE 244 Japan Immersive Analytics Market, 2019 - 2022, USD Million
- TABLE 245 Japan Immersive Analytics Market, 2023 - 2030, USD Million
- TABLE 246 Japan Immersive Analytics Market by Offering, 2019 - 2022, USD Million
- TABLE 247 Japan Immersive Analytics Market by Offering, 2023 - 2030, USD Million
- TABLE 248 Japan Immersive Analytics Market by Hardware Type, 2019 - 2022, USD Million
- TABLE 249 Japan Immersive Analytics Market by Hardware Type, 2023 - 2030, USD Million
- TABLE 250 Japan Immersive Analytics Market by End-use, 2019 - 2022, USD Million
- TABLE 251 Japan Immersive Analytics Market by End-use, 2023 - 2030, USD Million
- TABLE 252 India Immersive Analytics Market, 2019 - 2022, USD Million
- TABLE 253 India Immersive Analytics Market, 2023 - 2030, USD Million
- TABLE 254 India Immersive Analytics Market by Offering, 2019 - 2022, USD Million
- TABLE 255 India Immersive Analytics Market by Offering, 2023 - 2030, USD Million
- TABLE 256 India Immersive Analytics Market by Hardware Type, 2019 - 2022, USD Million
- TABLE 257 India Immersive Analytics Market by Hardware Type, 2023 - 2030, USD Million
- TABLE 258 India Immersive Analytics Market by End-use, 2019 - 2022, USD Million
- TABLE 259 India Immersive Analytics Market by End-use, 2023 - 2030, USD Million
- TABLE 260 South Korea Immersive Analytics Market, 2019 - 2022, USD Million
- TABLE 261 South Korea Immersive Analytics Market, 2023 - 2030, USD Million
- TABLE 262 South Korea Immersive Analytics Market by Offering, 2019 - 2022, USD Million
- TABLE 263 South Korea Immersive Analytics Market by Offering, 2023 - 2030, USD Million
- TABLE 264 South Korea Immersive Analytics Market by Hardware Type, 2019 - 2022, USD Million
- TABLE 265 South Korea Immersive Analytics Market by Hardware Type, 2023 - 2030, USD Million
- TABLE 266 South Korea Immersive Analytics Market by End-use, 2019 - 2022, USD Million
- TABLE 267 South Korea Immersive Analytics Market by End-use, 2023 - 2030, USD Million
- TABLE 268 Singapore Immersive Analytics Market, 2019 - 2022, USD Million
- TABLE 269 Singapore Immersive Analytics Market, 2023 - 2030, USD Million
- TABLE 270 Singapore Immersive Analytics Market by Offering, 2019 - 2022, USD Million
- TABLE 271 Singapore Immersive Analytics Market by Offering, 2023 - 2030, USD Million
- TABLE 272 Singapore Immersive Analytics Market by Hardware Type, 2019 - 2022, USD Million
- TABLE 273 Singapore Immersive Analytics Market by Hardware Type, 2023 - 2030, USD Million
- TABLE 274 Singapore Immersive Analytics Market by End-use, 2019 - 2022, USD Million
- TABLE 275 Singapore Immersive Analytics Market by End-use, 2023 - 2030, USD Million
- TABLE 276 Malaysia Immersive Analytics Market, 2019 - 2022, USD Million
- TABLE 277 Malaysia Immersive Analytics Market, 2023 - 2030, USD Million
- TABLE 278 Malaysia Immersive Analytics Market by Offering, 2019 - 2022, USD Million
- TABLE 279 Malaysia Immersive Analytics Market by Offering, 2023 - 2030, USD Million
- TABLE 280 Malaysia Immersive Analytics Market by Hardware Type, 2019 - 2022, USD Million
- TABLE 281 Malaysia Immersive Analytics Market by Hardware Type, 2023 - 2030, USD Million
- TABLE 282 Malaysia Immersive Analytics Market by End-use, 2019 - 2022, USD Million
- TABLE 283 Malaysia Immersive Analytics Market by End-use, 2023 - 2030, USD Million
- TABLE 284 Rest of Asia Pacific Immersive Analytics Market, 2019 - 2022, USD Million
- TABLE 285 Rest of Asia Pacific Immersive Analytics Market, 2023 - 2030, USD Million
- TABLE 286 Rest of Asia Pacific Immersive Analytics Market by Offering, 2019 - 2022, USD Million
- TABLE 287 Rest of Asia Pacific Immersive Analytics Market by Offering, 2023 - 2030, USD Million
- TABLE 288 Rest of Asia Pacific Immersive Analytics Market by Hardware Type, 2019 - 2022, USD Million
- TABLE 289 Rest of Asia Pacific Immersive Analytics Market by Hardware Type, 2023 - 2030, USD Million
- TABLE 290 Rest of Asia Pacific Immersive Analytics Market by End-use, 2019 - 2022, USD Million
- TABLE 291 Rest of Asia Pacific Immersive Analytics Market by End-use, 2023 - 2030, USD Million
- TABLE 292 LAMEA Immersive Analytics Market, 2019 - 2022, USD Million
- TABLE 293 LAMEA Immersive Analytics Market, 2023 - 2030, USD Million
- TABLE 294 LAMEA Immersive Analytics Market by Offering, 2019 - 2022, USD Million
- TABLE 295 LAMEA Immersive Analytics Market by Offering, 2023 - 2030, USD Million
- TABLE 296 LAMEA Hardware Market by Country, 2019 - 2022, USD Million
- TABLE 297 LAMEA Hardware Market by Country, 2023 - 2030, USD Million
- TABLE 298 LAMEA Immersive Analytics Market by Hardware Type, 2019 - 2022, USD Million
- TABLE 299 LAMEA Immersive Analytics Market by Hardware Type, 2023 - 2030, USD Million
- TABLE 300 LAMEA AR/VR/MR Headset Market by Country, 2019 - 2022, USD Million
- TABLE 301 LAMEA AR/VR/MR Headset Market by Country, 2023 - 2030, USD Million
- TABLE 302 LAMEA Displays Market by Country, 2019 - 2022, USD Million
- TABLE 303 LAMEA Displays Market by Country, 2023 - 2030, USD Million
- TABLE 304 LAMEA Sensors & Controllers Market by Country, 2019 - 2022, USD Million
- TABLE 305 LAMEA Sensors & Controllers Market by Country, 2023 - 2030, USD Million
- TABLE 306 LAMEA Others Market by Country, 2019 - 2022, USD Million
- TABLE 307 LAMEA Others Market by Country, 2023 - 2030, USD Million
- TABLE 308 LAMEA Solution Market by Country, 2019 - 2022, USD Million
- TABLE 309 LAMEA Solution Market by Country, 2023 - 2030, USD Million
- TABLE 310 LAMEA Services Market by Country, 2019 - 2022, USD Million
- TABLE 311 LAMEA Services Market by Country, 2023 - 2030, USD Million
- TABLE 312 LAMEA Immersive Analytics Market by End-use, 2019 - 2022, USD Million
- TABLE 313 LAMEA Immersive Analytics Market by End-use, 2023 - 2030, USD Million
- TABLE 314 LAMEA Healthcare Market by Country, 2019 - 2022, USD Million
- TABLE 315 LAMEA Healthcare Market by Country, 2023 - 2030, USD Million
- TABLE 316 LAMEA Government & Defense Market by Country, 2019 - 2022, USD Million
- TABLE 317 LAMEA Government & Defense Market by Country, 2023 - 2030, USD Million
- TABLE 318 LAMEA Automotive & Transportation Market by Country, 2019 - 2022, USD Million
- TABLE 319 LAMEA Automotive & Transportation Market by Country, 2023 - 2030, USD Million
- TABLE 320 LAMEA Construction Market by Country, 2019 - 2022, USD Million
- TABLE 321 LAMEA Construction Market by Country, 2023 - 2030, USD Million
- TABLE 322 LAMEA Media & Entertainment Market by Country, 2019 - 2022, USD Million
- TABLE 323 LAMEA Media & Entertainment Market by Country, 2023 - 2030, USD Million
- TABLE 324 LAMEA Others Market by Country, 2019 - 2022, USD Million
- TABLE 325 LAMEA Others Market by Country, 2023 - 2030, USD Million
- TABLE 326 LAMEA Immersive Analytics Market by Country, 2019 - 2022, USD Million
- TABLE 327 LAMEA Immersive Analytics Market by Country, 2023 - 2030, USD Million
- TABLE 328 Brazil Immersive Analytics Market, 2019 - 2022, USD Million
- TABLE 329 Brazil Immersive Analytics Market, 2023 - 2030, USD Million
- TABLE 330 Brazil Immersive Analytics Market by Offering, 2019 - 2022, USD Million
- TABLE 331 Brazil Immersive Analytics Market by Offering, 2023 - 2030, USD Million
- TABLE 332 Brazil Immersive Analytics Market by Hardware Type, 2019 - 2022, USD Million
- TABLE 333 Brazil Immersive Analytics Market by Hardware Type, 2023 - 2030, USD Million
- TABLE 334 Brazil Immersive Analytics Market by End-use, 2019 - 2022, USD Million
- TABLE 335 Brazil Immersive Analytics Market by End-use, 2023 - 2030, USD Million
- TABLE 336 Argentina Immersive Analytics Market, 2019 - 2022, USD Million
- TABLE 337 Argentina Immersive Analytics Market, 2023 - 2030, USD Million
- TABLE 338 Argentina Immersive Analytics Market by Offering, 2019 - 2022, USD Million
- TABLE 339 Argentina Immersive Analytics Market by Offering, 2023 - 2030, USD Million
- TABLE 340 Argentina Immersive Analytics Market by Hardware Type, 2019 - 2022, USD Million
- TABLE 341 Argentina Immersive Analytics Market by Hardware Type, 2023 - 2030, USD Million
- TABLE 342 Argentina Immersive Analytics Market by End-use, 2019 - 2022, USD Million
- TABLE 343 Argentina Immersive Analytics Market by End-use, 2023 - 2030, USD Million
- TABLE 344 UAE Immersive Analytics Market, 2019 - 2022, USD Million
- TABLE 345 UAE Immersive Analytics Market, 2023 - 2030, USD Million
- TABLE 346 UAE Immersive Analytics Market by Offering, 2019 - 2022, USD Million
- TABLE 347 UAE Immersive Analytics Market by Offering, 2023 - 2030, USD Million
- TABLE 348 UAE Immersive Analytics Market by Hardware Type, 2019 - 2022, USD Million
- TABLE 349 UAE Immersive Analytics Market by Hardware Type, 2023 - 2030, USD Million
- TABLE 350 UAE Immersive Analytics Market by End-use, 2019 - 2022, USD Million
- TABLE 351 UAE Immersive Analytics Market by End-use, 2023 - 2030, USD Million
- TABLE 352 Saudi Arabia Immersive Analytics Market, 2019 - 2022, USD Million
- TABLE 353 Saudi Arabia Immersive Analytics Market, 2023 - 2030, USD Million
- TABLE 354 Saudi Arabia Immersive Analytics Market by Offering, 2019 - 2022, USD Million
- TABLE 355 Saudi Arabia Immersive Analytics Market by Offering, 2023 - 2030, USD Million
- TABLE 356 Saudi Arabia Immersive Analytics Market by Hardware Type, 2019 - 2022, USD Million
- TABLE 357 Saudi Arabia Immersive Analytics Market by Hardware Type, 2023 - 2030, USD Million
- TABLE 358 Saudi Arabia Immersive Analytics Market by End-use, 2019 - 2022, USD Million
- TABLE 359 Saudi Arabia Immersive Analytics Market by End-use, 2023 - 2030, USD Million
- TABLE 360 South Africa Immersive Analytics Market, 2019 - 2022, USD Million
- TABLE 361 South Africa Immersive Analytics Market, 2023 - 2030, USD Million
- TABLE 362 South Africa Immersive Analytics Market by Offering, 2019 - 2022, USD Million
- TABLE 363 South Africa Immersive Analytics Market by Offering, 2023 - 2030, USD Million
- TABLE 364 South Africa Immersive Analytics Market by Hardware Type, 2019 - 2022, USD Million
- TABLE 365 South Africa Immersive Analytics Market by Hardware Type, 2023 - 2030, USD Million
- TABLE 366 South Africa Immersive Analytics Market by End-use, 2019 - 2022, USD Million
- TABLE 367 South Africa Immersive Analytics Market by End-use, 2023 - 2030, USD Million
- TABLE 368 Nigeria Immersive Analytics Market, 2019 - 2022, USD Million
- TABLE 369 Nigeria Immersive Analytics Market, 2023 - 2030, USD Million
- TABLE 370 Nigeria Immersive Analytics Market by Offering, 2019 - 2022, USD Million
- TABLE 371 Nigeria Immersive Analytics Market by Offering, 2023 - 2030, USD Million
- TABLE 372 Nigeria Immersive Analytics Market by Hardware Type, 2019 - 2022, USD Million
- TABLE 373 Nigeria Immersive Analytics Market by Hardware Type, 2023 - 2030, USD Million
- TABLE 374 Nigeria Immersive Analytics Market by End-use, 2019 - 2022, USD Million
- TABLE 375 Nigeria Immersive Analytics Market by End-use, 2023 - 2030, USD Million
- TABLE 376 Rest of LAMEA Immersive Analytics Market, 2019 - 2022, USD Million
- TABLE 377 Rest of LAMEA Immersive Analytics Market, 2023 - 2030, USD Million
- TABLE 378 Rest of LAMEA Immersive Analytics Market by Offering, 2019 - 2022, USD Million
- TABLE 379 Rest of LAMEA Immersive Analytics Market by Offering, 2023 - 2030, USD Million
- TABLE 380 Rest of LAMEA Immersive Analytics Market by Hardware Type, 2019 - 2022, USD Million
- TABLE 381 Rest of LAMEA Immersive Analytics Market by Hardware Type, 2023 - 2030, USD Million
- TABLE 382 Rest of LAMEA Immersive Analytics Market by End-use, 2019 - 2022, USD Million
- TABLE 383 Rest of LAMEA Immersive Analytics Market by End-use, 2023 - 2030, USD Million
- TABLE 384 key information - Microsoft Corporation
- TABLE 385 Key information - IBM Corporation
- TABLE 386 Key information - Accenture PLC
- TABLE 387 Key Information - Google LLC
- TABLE 388 Key Information - SAP SE
- TABLE 389 Key Information - Meta Platforms, Inc.
- TABLE 390 Key Information - HTC Corporation
- TABLE 391 Key Information - HP, Inc.
- TABLE 392 Key information - Tibco Software, Inc.
- TABLE 393 Key Information - Magic Leap, Inc.
List of Figures
- FIG 1 Methodology for the research
- FIG 2 KBV Cardinal Matrix
- FIG 3 Market Share Analysis, 2021
- FIG 4 Key Leading Strategies: Percentage Distribution (2019-2023)
- FIG 5 Key Strategic Move: (Product Launches and Product Expansions : 2019, Dec - 2023, Jun) Leading Players
- FIG 6 Global Immersive Analytics Market share by Offering, 2022
- FIG 7 Global Immersive Analytics Market share by Offering, 2030
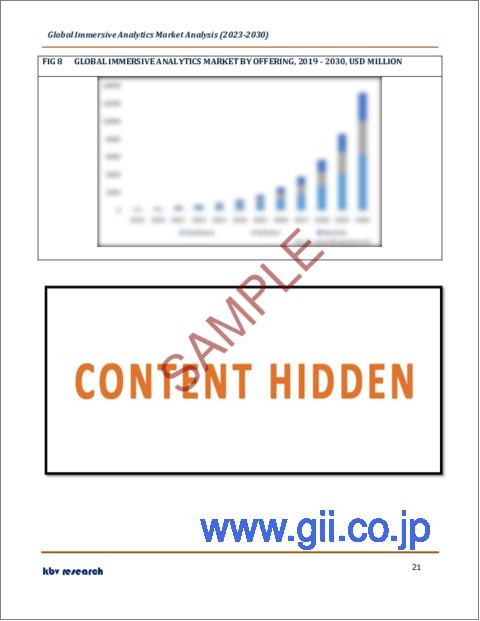
- FIG 8 Global Immersive Analytics Market by Offering, 2019 - 2030, USD Million
- FIG 9 Global Immersive Analytics Market share by End-use, 2022
- FIG 10 Global Immersive Analytics Market share by End-use, 2030
- FIG 11 Global Immersive Analytics Market by End-use, 2019 - 2030, USD Million
- FIG 12 Global Immersive Analytics Market share by Region, 2022
- FIG 13 Global Immersive Analytics Market share by Region, 2023
- FIG 14 Global Immersive Analytics Market by Region, 2019 - 2030, USD Million
- FIG 15 Recent strategies and developments: Microsoft Corporation
- FIG 16 SWOT Analysis: Microsoft Corporation
- FIG 17 Recent strategies and developments: IBM Corporation
- FIG 18 Swot analysis: IBM Corporation
- FIG 19 Swot analysis: Accenture plC
- FIG 20 Recent strategies and developments: Google LLC
- FIG 21 SWOT Analysis: Alphabet Inc. (Google LLC)
- FIG 22 Recent strategies and developments: SAP SE
- FIG 23 SWOT Analysis: SAP SE
- FIG 24 Recent strategies and developments: Meta Platforms, Inc.
- FIG 25 SWOT Analysis: Facebook
- FIG 26 Recent strategies and developments: HTC Corporation
- FIG 27 Recent strategies and developments: HP, Inc.
- FIG 28 Recent strategies and developments: Tibco Software, Inc.
- FIG 29 Recent strategies and developments: Magic Leap, Inc.
The Global Immersive Analytics Market size is expected to reach $13.2 billion by 2030, rising at a market growth of 47.5% CAGR during the forecast period.
Media and entertainment industry utilizes immersive technology and analytics in the form of immersive entertainment, which necessarily combines mixed reality, artificial intelligence (AI), augmented reality (AR), and virtual reality (VR). Hence, the Media and entertainment sector is expected to generate approximately 1/5th share of the market by 2030. The value of the worldwide music industry was estimated by the International Trade Administration (ITA) to be $80.2 billion in 2020. Regarding revenue, the top 5 countries worldwide are the US, Germany, Japan, the UK, and China. Additionally, streaming services continued to be a major force behind the expansion of the music and entertainment industries in 2020. Additionally, recorded music sales revenue globally climbed by 9.0% in 2022, according to the International Federation of the Phonographic Industry (IFPI). Digital revenues have been increasing steadily over the previous few years, and by 2022 streaming will account for 67.0% of all recorded music sales worldwide, up from 66.0% in 2021. At the end of that year, there were 589 million paid subscription accounts worldwide.
The major strategies followed by the market participants are Product Launches as the key developmental strategy to keep pace with the changing demands of end users. For instance, In April, 2022, SAP India unveiled Transformation Express, an immersive mobile experience centre. The launch of Transformation Express aims to advance cloud adoption and drive business transformation for the Indian mid-market. Additionally, In June, 2023, Meta Platforms announced the launch of the Quest 3, a next-generation mixed-reality headset. The launched product consists of a new Qualcomm chipset with double the graphics performance.
Based on the Analysis presented in the KBV Cardinal matrix; Microsoft Corporation and Google LLC (Alphabet Inc.) are the forerunners in the Market. In March, 2021, Microsoft announced the launch of Microsoft Mesh, the app to give users a cross-AR/VR meeting space to communicate with other users and 3D content, managing all of the technical hard parts of shared spatial multi-player experience on the web. This launch aims to deliver their VR Windows Mixed Reality platform and AR HoloLens platform with a shared platform for meetings. Companies such as SAP SE, Meta Platforms, Inc. and Tibco Software, Inc. (Vista Equity Partners) are some of the key innovators in the Market.
Market Growth Factors
Technology advancements and an increase in digitalization
The adoption of immersive technologies across a variety of industries, including healthcare, retail, and industry, has largely been driven by technological advancement and digitalization. Because of continual technological advancements, there has been a change in how people live, interact, commute, and study. Organizations and businesses have been able to reduce manufacturing costs and save time due to technological advancements in order to gain a competitive advantage. In order for smaller businesses to reach their target consumers, 3G and 4G, for instance, have reduced their operational costs. Furthermore, immersion training equips students with the skills necessary to analyze and control outcomes by merging concepts with real-world events in a secure environment. All these elements are expected to fuel market growth in the years to come.
Increased investment in virtual and augmented reality products
In recent years, interest in extended reality (XR) has grown significantly. Major commercial organizations are presently investing in mixed reality, augmented reality, and virtual reality technology. Many companies are looking into the various applications of XR, with many of them employing it in immersive learning, R&D, entertainment, as well as remote support. Extended reality technology will be used by more businesses to greatly expand their clientele within the anticipated time frame. Such elements will also promote the growth of the market.
Restraints Factors
Insufficient analytical expertise in the workforce
Enterprises are still struggling with the broad adoption of futuristic technology and are looking for advice on the best course of action in this disruptive environment. Worldwide, data scientists claim that the workforce's lack of adequate skill sets prevents the best use of these cutting-edge pervasive technologies, which is a major barrier to embracing immersive technology. Hence, throughout the forecast period, all these factors could negatively affect the market's ability to expand globally.
Offering Outlook
Based on offering, the market is characterized into hardware, solution, and services. The services segment procured a considerable growth rate in the market in 2022. Managed and professional services are both included in immersive analytics services. In order to help organizations, implement immersive data visualization and analysis technologies successfully, these services offer strategic advice, specialized development, enhanced visualizations, training programs, seamless user experiences, integration with existing systems, as well as ongoing support. To use immersive analytics for improved understanding and decision-making, organizations can select services depending on their unique needs.
Hardware Type Outlook
On the basis of hardware type, the market is classified into AR/VR/MR headset, displays, sensors & controllers, and others. The AR/VR/MR headset segment acquired the largest revenue share in the market in 2022. By enabling users to engage with data in a three-dimensional environment, AR/VR/MR headsets enhance the immersive experience. A profound understanding of complicated data sets is made possible by these improved capabilities, which also makes it possible to spot complex trends and patterns that could be difficult to spot with conventional data representations. These headsets enable seamless communication between analysts, data scientists, and stakeholders, improving the efficiency, accuracy, and quality of data analysis and decision-making.
End-use Outlook
By end-use, the market is divided into healthcare, government & defense, automotive & transportation, construction, media & entertainment, and others. The healthcare segment witnessed the maximum revenue share in the market in 2022. Immersive analytics are projected to become more popular due to digital transformation in the healthcare sector. The modeling of medical devices, patient monitoring, and patient diagnosis have all been made easier by technological breakthroughs and inventions in the healthcare sector. For the simulation and testing of new treatments, situations, and technologies, immersive analytics systems assist healthcare and life sciences enterprises in effectively managing how patient data is gathered, handled, processed, and presented.
Regional Outlook
Region wise, the market is analyzed across North America, Europe, Asia Pacific, and LAMEA. The North America segment acquired the highest revenue share in the market in 2022. The North America market's revenue and profit are mostly driven by the region's expanding technology developments and shifting consumer tastes. The growing demand for head-mounted displays is also spurred by their scarcity and rising favorability in the region's wealthier countries. The demand for interactive virtual innovation is expected to experience rapid revenue growth throughout the forecast period due to the presence of leading industry players in the country, including Zeality Corporation, Unity Development Corporation, Lockheed Martin, HCL Technologies, Google, Wizard Jumping, and Constrained.
The market research report covers the analysis of key stake holders of the market. Key companies profiled in the report include Microsoft Corporation, IBM Corporation, Accenture PLC, Google LLC (Alphabet Inc.), SAP SE, Meta Platforms, Inc., HTC Corporation, HP, Inc., Tibco Software, Inc. (Vista Equity Partners), and Magic Leap, Inc.
Recent Strategies Deployed in Immersive Analytics Market
Partnerships, Collaborations and Agreements:
May-2023: Meta teamed up with BMW, a German multinational manufacturer of luxury vehicles and motorcycles. This collaboration aims to bring AR and VR experiences to the automotive industry. Moreover, both companies would work together to transform various aspects of the automotive sector, consisting of design, manufacturing, sales, and customer experiences.
May-2023: SAP joined hands with Accenture, a professional services company. This collaboration aims to build immersive experiences and business models which are created on the SAP Business Technology Platform, that deliver future-ready interfaces contextualized with business data and processes.
May-2023: Google Cloud partnered with beIN, the Qatar-based media group, to advance digital technology. Under this partnership, Google Cloud begins a new journey into beIN's digital transformation journey, enhancing beIN's business processes and leading its strategies, and also making sure the global audiences enjoy the advanced experiences.
Oct-2022: HTC came into partnership with e&, The Middle Eastern operator group. The collaboration would aim to unleash people's imaginations, helping them to get work done, and enjoy new worlds in highly engaging ways.
Oct-2022: Microsoft collaborated with Meta, a company engaged in building technologies. The collaboration would bring Microsoft Teams and other production tools to VR headsets. Additionally, the integration of Mesh for Teams with Meta Quest Pro and Meta Quest 2 devices would allow people to team up and connect as they are together in person.
Aug-2022: HTC VIVE teamed up with MyndVR, the provider of immersive, therapeutic VR experiences designed for the aging population. Under this collaboration, both companies announced the launch of MyndVR 3.0 exclusively integrated with the latest HTC VIVE Flow Immersive Glasses.
May-2022: Magic Leap, Inc. signed a partnership with Globant, LLC, an IT and software development company. Through this partnership, both companies would aim to develop and deploy customized software solutions for enterprise customers.
Apr-2022: IBM came into partnership with Groove Jones, a developer of creative programs for brands through emerging technologies. Through this partnership, both companies would aim to develop an Augmented Reality and WebGL experience by releasing the IBM Power E1080 server, the servers based on the IBM Power10 processor.
Product Launches and Product Expansions:
Jun-2023: Meta Platforms announced the launch of the Quest 3, a next-generation mixed-reality headset. The launched product consists of a new Qualcomm chipset with double the graphics performance.
Mar-2023: TIBCO made enhancements to its TIBCO Spotfire and other scalable analytics solutions, the analytics portfolio delivering immersive, smart, and real-time analytics that supports customers to take action and benefit from faster, smarter insights. This enhancement closes the difference between insight and action, creating available abilities to boost time-to-decision and lower operations costs.
Feb-2023: Google Cloud announced the launch of Immersive Stream for XR service, a cloud-hosted graphics rendering service powered by Google Cloud's graphics processing units. With this launch, the company aims to empower high-quality photorealistic augmented reality experiences for millions of mobile devices.
Feb-2023: Google made enhancements to its Google Maps platform by adding an immersive view capability. The enhancement of Google Maps is part of its strategy to make the navigation app highly immersive and intuitive for users.
Feb-2023: HTC VIVE announced the launch of VIVERSE for business, the simple and intuitive way for companies to create their collaborative virtual spaces. The launch would empower businesses with new advancements and products to get the most out of its immersive technology.
Sep-2022: Magic Leap released Magic Leap 2, its next-generation enterprise augmented reality platform. The Magic Leap 2 is the lightest and smallest augmented reality device created for organizations to address historical barriers which prevented the widespread adoption of AR technology and is key to making AR a valuable tool for everyday usage in retail, healthcare, and defense sectors.
Sep-2022: IBM introduced Cognos 11.2.3, the new update in Cognos Analytics with Watson 11.2.x stream. The launch would be a breakthrough in helping business users simply navigate and extract more value from their data. Moreover, the launch would cover various features that would be from a major user interface service to useful combinations, to a host of latest updates.
Jul-2022: TIBCO Software Inc. launched TIBCO® ModelOps, which allows businesses to position AI models faster, from anywhere to everywhere, safely and at scale. The addition to Tibco's game-changing analytics suite helps customers easily scale cloud-based analytic model management, deployment, monitoring, and governance.
Apr-2022: SAP India unveiled Transformation Express, an immersive mobile experience center. The launch of Transformation Express aims to advance cloud adoption and drive business transformation for the Indian mid-market.
Mar-2022: HP introduced ExtendXR service for managing augmented reality as well as virtual reality devices simpler for enterprises. The launch of a new software-as-a-service solution would streamline deploying and managing enterprise Virtual Reality at scale.
Acquisitions and Mergers:
Jun-2023: SAP SE took over Taulia, a leading provider of working capital management solutions. This acquisition aimed to expand SAP's business network and strengthen SAP's solutions for the CFO office. Under this acquisition, Taulia's solutions would be closely unified into SAP software and continue to be available standalone.
Jun-2023: Accenture completed the acquisition of Nextira, an Amazon Web Services (AWS) Premier Partner that utilizes AWS to offer cloud-native innovation, predictive analytics, and immersive experiences for its clients. Following this acquisition, the services and solutions would accelerate Accenture Cloud First's robust set of engineering potentials and help clients take benefit of a complete cycle of cloud capabilities and tools.
Feb-2023: Meta took over Within, the maker of the subscription fitness app Supernatural. This acquisition would add a major fitness platform to Meta's suite of toolkits.
Sep-2022: Meta acquired Lofelt, a Berlin-based haptics developer. This acquisition allows Meta to benefit from technology that simulates user touch and feel feedback from a controller or glove. Additionally, the acquisition allows Meta to strengthen its commitment to its haptics research.
Aug-2022: HP Inc. acquired Poly, a company engaged in offering workplace collaboration solutions. The acquisition aims to boost HP's strategy to build highly growth-oriented offerings, strengthen its industry opportunity in hybrid work solutions, and place the integrated enterprise for long-term value creation and sustainable growth.
Jan-2022: Microsoft acquired Activision Blizzard, an American video game holding company. This acquisition strengthens Microsoft's position in a market that is rapidly transforming and focuses on interoperability and immersion across virtual worlds.
Scope of the Study
Market Segments covered in the Report:
By Offering
- Hardware
- AR/VR/MR Headset
- Displays
- Sensors & Controllers
- Others
- Solution
- Services
By End-Use
- Healthcare
- Government & Defense
- Automotive & Transportation
- Construction
- Media & Entertainment
- Others
By Geography
- North America
- US
- Canada
- Mexico
- Rest of North America
- Europe
- Germany
- UK
- France
- Russia
- Spain
- Italy
- Rest of Europe
- Asia Pacific
- China
- Japan
- India
- South Korea
- Singapore
- Malaysia
- Rest of Asia Pacific
- LAMEA
- Brazil
- Argentina
- UAE
- Saudi Arabia
- South Africa
- Nigeria
- Rest of LAMEA
Companies Profiled
- Microsoft Corporation
- IBM Corporation
- Accenture PLC
- Google LLC (Alphabet Inc.)
- SAP SE
- Meta Platforms, Inc.
- HTC Corporation
- HP, Inc.
- Tibco Software, Inc. (Vista Equity Partners)
- Magic Leap, Inc.
Unique Offerings from KBV Research
- Exhaustive coverage
- Highest number of market tables and figures
- Subscription based model available
- Guaranteed best price
- Assured post sales research support with 10% customization free
Table of Contents
Chapter 1. Market Scope & Methodology
- 1.1 Market Definition
- 1.2 Objectives
- 1.3 Market Scope
- 1.4 Segmentation
- 1.4.1 Global Immersive Analytics Market, by Offering
- 1.4.2 Global Immersive Analytics Market, by End-Use
- 1.4.3 Global Immersive Analytics Market, by Geography
- 1.5 Methodology for the research
Chapter 2. Market Overview
- 2.1 Introduction
- 2.1.1 Overview
- 2.1.1.1 Market Composition and Scenario
- 2.1.1 Overview
- 2.2 Key Factors Impacting the Market
- 2.2.1 Market Drivers
- 2.2.2 Market Restraints
Chapter 3. Competition Analysis - Global
- 3.1 KBV Cardinal Matrix
- 3.2 Recent Industry Wide Strategic Developments
- 3.2.1 Partnerships, Collaborations and Agreements
- 3.2.2 Product Launches and Product Expansions
- 3.2.3 Acquisition and Mergers
- 3.3 Market Share Analysis, 2021
- 3.4 Top Winning Strategies
- 3.4.1 Key Leading Strategies: Percentage Distribution (2019-2023)
- 3.4.2 Key Strategic Move: (Product Launches and Product Expansions: 2019, Dec - 2023, Jun) Leading Players
Chapter 4. Global Immersive Analytics Market by Offering
- 4.1 Global Hardware Market by Region
- 4.2 Global Immersive Analytics Market by Hardware Type
- 4.2.1 Global AR/VR/MR Headset Market by Region
- 4.2.2 Global Displays Market by Region
- 4.2.3 Global Sensors & Controllers Market by Region
- 4.2.4 Global Others Market by Region
- 4.3 Global Solution Market by Region
- 4.4 Global Services Market by Region
Chapter 5. Global Immersive Analytics Market by End-use
- 5.1 Global Healthcare Market by Region
- 5.2 Global Government & Defense Market by Region
- 5.3 Global Automotive & Transportation Market by Region
- 5.4 Global Construction Market by Region
- 5.5 Global Media & Entertainment Market by Region
- 5.6 Global Others Market by Region
Chapter 6. Global Immersive Analytics Market by Region
- 6.1 North America Immersive Analytics Market
- 6.1.1 North America Immersive Analytics Market by Offering
- 6.1.1.1 North America Hardware Market by Country
- 6.1.1.2 North America Immersive Analytics Market by Hardware Type
- 6.1.1.2.1 North America AR/VR/MR Headset Market by Country
- 6.1.1.2.2 North America Displays Market by Country
- 6.1.1.2.3 North America Sensors & Controllers Market by Country
- 6.1.1.2.4 North America Others Market by Country
- 6.1.1.3 North America Solution Market by Country
- 6.1.1.4 North America Services Market by Country
- 6.1.2 North America Immersive Analytics Market by End-use
- 6.1.2.1 North America Healthcare Market by Country
- 6.1.2.2 North America Government & Defense Market by Country
- 6.1.2.3 North America Automotive & Transportation Market by Country
- 6.1.2.4 North America Construction Market by Country
- 6.1.2.5 North America Media & Entertainment Market by Country
- 6.1.2.6 North America Others Market by Country
- 6.1.3 North America Immersive Analytics Market by Country
- 6.1.3.1 US Immersive Analytics Market
- 6.1.3.1.1 US Immersive Analytics Market by Offering
- 6.1.3.1.2 US Immersive Analytics Market by End-use
- 6.1.3.2 Canada Immersive Analytics Market
- 6.1.3.2.1 Canada Immersive Analytics Market by Offering
- 6.1.3.2.2 Canada Immersive Analytics Market by End-use
- 6.1.3.3 Mexico Immersive Analytics Market
- 6.1.3.3.1 Mexico Immersive Analytics Market by Offering
- 6.1.3.3.2 Mexico Immersive Analytics Market by End-use
- 6.1.3.4 Rest of North America Immersive Analytics Market
- 6.1.3.4.1 Rest of North America Immersive Analytics Market by Offering
- 6.1.3.4.2 Rest of North America Immersive Analytics Market by End-use
- 6.1.3.1 US Immersive Analytics Market
- 6.1.1 North America Immersive Analytics Market by Offering
- 6.2 Europe Immersive Analytics Market
- 6.2.1 Europe Immersive Analytics Market by Offering
- 6.2.1.1 Europe Hardware Market by Country
- 6.2.1.2 Europe Immersive Analytics Market by Hardware Type
- 6.2.1.2.1 Europe AR/VR/MR Headset Market by Country
- 6.2.1.2.2 Europe Displays Market by Country
- 6.2.1.2.3 Europe Sensors & Controllers Market by Country
- 6.2.1.2.4 Europe Others Market by Country
- 6.2.1.3 Europe Solution Market by Country
- 6.2.1.4 Europe Services Market by Country
- 6.2.2 Europe Immersive Analytics Market by End-use
- 6.2.2.1 Europe Healthcare Market by Country
- 6.2.2.2 Europe Government & Defense Market by Country
- 6.2.2.3 Europe Automotive & Transportation Market by Country
- 6.2.2.4 Europe Construction Market by Country
- 6.2.2.5 Europe Media & Entertainment Market by Country
- 6.2.2.6 Europe Others Market by Country
- 6.2.3 Europe Immersive Analytics Market by Country
- 6.2.3.1 Germany Immersive Analytics Market
- 6.2.3.1.1 Germany Immersive Analytics Market by Offering
- 6.2.3.1.2 Germany Immersive Analytics Market by End-use
- 6.2.3.2 UK Immersive Analytics Market
- 6.2.3.2.1 UK Immersive Analytics Market by Offering
- 6.2.3.2.2 UK Immersive Analytics Market by End-use
- 6.2.3.3 France Immersive Analytics Market
- 6.2.3.3.1 France Immersive Analytics Market by Offering
- 6.2.3.3.2 France Immersive Analytics Market by End-use
- 6.2.3.4 Russia Immersive Analytics Market
- 6.2.3.4.1 Russia Immersive Analytics Market by Offering
- 6.2.3.4.2 Russia Immersive Analytics Market by End-use
- 6.2.3.5 Spain Immersive Analytics Market
- 6.2.3.5.1 Spain Immersive Analytics Market by Offering
- 6.2.3.5.2 Spain Immersive Analytics Market by End-use
- 6.2.3.6 Italy Immersive Analytics Market
- 6.2.3.6.1 Italy Immersive Analytics Market by Offering
- 6.2.3.6.2 Italy Immersive Analytics Market by End-use
- 6.2.3.7 Rest of Europe Immersive Analytics Market
- 6.2.3.7.1 Rest of Europe Immersive Analytics Market by Offering
- 6.2.3.7.2 Rest of Europe Immersive Analytics Market by End-use
- 6.2.3.1 Germany Immersive Analytics Market
- 6.2.1 Europe Immersive Analytics Market by Offering
- 6.3 Asia Pacific Immersive Analytics Market
- 6.3.1 Asia Pacific Immersive Analytics Market by Offering
- 6.3.1.1 Asia Pacific Hardware Market by Country
- 6.3.1.2 Asia Pacific Immersive Analytics Market by Hardware Type
- 6.3.1.2.1 Asia Pacific AR/VR/MR Headset Market by Country
- 6.3.1.2.2 Asia Pacific Displays Market by Country
- 6.3.1.2.3 Asia Pacific Sensors & Controllers Market by Country
- 6.3.1.2.4 Asia Pacific Others Market by Country
- 6.3.1.3 Asia Pacific Solution Market by Country
- 6.3.1.4 Asia Pacific Services Market by Country
- 6.3.2 Asia Pacific Immersive Analytics Market by End-use
- 6.3.2.1 Asia Pacific Healthcare Market by Country
- 6.3.2.2 Asia Pacific Government & Defense Market by Country
- 6.3.2.3 Asia Pacific Automotive & Transportation Market by Country
- 6.3.2.4 Asia Pacific Construction Market by Country
- 6.3.2.5 Asia Pacific Media & Entertainment Market by Country
- 6.3.2.6 Asia Pacific Others Market by Country
- 6.3.3 Asia Pacific Immersive Analytics Market by Country
- 6.3.3.1 China Immersive Analytics Market
- 6.3.3.1.1 China Immersive Analytics Market by Offering
- 6.3.3.1.2 China Immersive Analytics Market by End-use
- 6.3.3.2 Japan Immersive Analytics Market
- 6.3.3.2.1 Japan Immersive Analytics Market by Offering
- 6.3.3.2.2 Japan Immersive Analytics Market by End-use
- 6.3.3.3 India Immersive Analytics Market
- 6.3.3.3.1 India Immersive Analytics Market by Offering
- 6.3.3.3.2 India Immersive Analytics Market by End-use
- 6.3.3.4 South Korea Immersive Analytics Market
- 6.3.3.4.1 South Korea Immersive Analytics Market by Offering
- 6.3.3.4.2 South Korea Immersive Analytics Market by End-use
- 6.3.3.5 Singapore Immersive Analytics Market
- 6.3.3.5.1 Singapore Immersive Analytics Market by Offering
- 6.3.3.5.2 Singapore Immersive Analytics Market by End-use
- 6.3.3.6 Malaysia Immersive Analytics Market
- 6.3.3.6.1 Malaysia Immersive Analytics Market by Offering
- 6.3.3.6.2 Malaysia Immersive Analytics Market by End-use
- 6.3.3.7 Rest of Asia Pacific Immersive Analytics Market
- 6.3.3.7.1 Rest of Asia Pacific Immersive Analytics Market by Offering
- 6.3.3.7.2 Rest of Asia Pacific Immersive Analytics Market by End-use
- 6.3.3.1 China Immersive Analytics Market
- 6.3.1 Asia Pacific Immersive Analytics Market by Offering
- 6.4 LAMEA Immersive Analytics Market
- 6.4.1 LAMEA Immersive Analytics Market by Offering
- 6.4.1.1 LAMEA Hardware Market by Country
- 6.4.1.2 LAMEA Immersive Analytics Market by Hardware Type
- 6.4.1.2.1 LAMEA AR/VR/MR Headset Market by Country
- 6.4.1.2.2 LAMEA Displays Market by Country
- 6.4.1.2.3 LAMEA Sensors & Controllers Market by Country
- 6.4.1.2.4 LAMEA Others Market by Country
- 6.4.1.3 LAMEA Solution Market by Country
- 6.4.1.4 LAMEA Services Market by Country
- 6.4.2 LAMEA Immersive Analytics Market by End-use
- 6.4.2.1 LAMEA Healthcare Market by Country
- 6.4.2.2 LAMEA Government & Defense Market by Country
- 6.4.2.3 LAMEA Automotive & Transportation Market by Country
- 6.4.2.4 LAMEA Construction Market by Country
- 6.4.2.5 LAMEA Media & Entertainment Market by Country
- 6.4.2.6 LAMEA Others Market by Country
- 6.4.3 LAMEA Immersive Analytics Market by Country
- 6.4.3.1 Brazil Immersive Analytics Market
- 6.4.3.1.1 Brazil Immersive Analytics Market by Offering
- 6.4.3.1.2 Brazil Immersive Analytics Market by End-use
- 6.4.3.2 Argentina Immersive Analytics Market
- 6.4.3.2.1 Argentina Immersive Analytics Market by Offering
- 6.4.3.2.2 Argentina Immersive Analytics Market by End-use
- 6.4.3.3 UAE Immersive Analytics Market
- 6.4.3.3.1 UAE Immersive Analytics Market by Offering
- 6.4.3.3.2 UAE Immersive Analytics Market by End-use
- 6.4.3.4 Saudi Arabia Immersive Analytics Market
- 6.4.3.4.1 Saudi Arabia Immersive Analytics Market by Offering
- 6.4.3.4.2 Saudi Arabia Immersive Analytics Market by End-use
- 6.4.3.5 South Africa Immersive Analytics Market
- 6.4.3.5.1 South Africa Immersive Analytics Market by Offering
- 6.4.3.5.2 South Africa Immersive Analytics Market by End-use
- 6.4.3.6 Nigeria Immersive Analytics Market
- 6.4.3.6.1 Nigeria Immersive Analytics Market by Offering
- 6.4.3.6.2 Nigeria Immersive Analytics Market by End-use
- 6.4.3.7 Rest of LAMEA Immersive Analytics Market
- 6.4.3.7.1 Rest of LAMEA Immersive Analytics Market by Offering
- 6.4.3.7.2 Rest of LAMEA Immersive Analytics Market by End-use
- 6.4.3.1 Brazil Immersive Analytics Market
- 6.4.1 LAMEA Immersive Analytics Market by Offering
Chapter 7. Company Profiles
- 7.1 Microsoft Corporation
- 7.1.1 Company Overview
- 7.1.2 Financial Analysis
- 7.1.3 Segmental and Regional Analysis
- 7.1.4 Research & Development Expenses
- 7.1.5 Recent strategies and developments:
- 7.1.5.1 Partnerships, Collaborations, and Agreements:
- 7.1.5.2 Product Launches and Product Expansions:
- 7.1.5.3 Acquisition and Mergers:
- 7.1.6 SWOT Analysis
- 7.2 IBM Corporation
- 7.2.1 Company Overview
- 7.2.2 Financial Analysis
- 7.2.3 Regional & Segmental Analysis
- 7.2.4 Research & Development Expenses
- 7.2.5 Recent strategies and developments:
- 7.2.5.1 Partnerships, Collaborations, and Agreements:
- 7.2.5.2 Product Launches and Product Expansions:
- 7.2.6 SWOT Analysis
- 7.3 Accenture PLC
- 7.3.1 Company Overview
- 7.3.2 Financial Analysis
- 7.3.3 Segmental and Regional Analysis
- 7.3.4 Research & Development Expenses
- 7.3.5 Recent strategies and developments:
- 7.3.5.1 Acquisition and Mergers:
- 7.3.6 SWOT Analysis
- 7.4 Google LLC (Alphabet Inc.)
- 7.4.1 Company Overview
- 7.4.2 Financial Analysis
- 7.4.3 Segmental and Regional Analysis
- 7.4.4 Research & Development Expense
- 7.4.5 Recent strategies and developments:
- 7.4.5.1 Partnerships, Collaborations, and Agreements:
- 7.4.5.2 Product Launches and Product Expansions:
- 7.4.6 SWOT Analysis
- 7.5 SAP SE
- 7.5.1 Company Overview
- 7.5.2 Financial Analysis
- 7.5.3 Segmental and Regional Analysis
- 7.5.4 Research & Development Expense
- 7.5.5 Recent strategies and developments:
- 7.5.5.1 Partnerships, Collaborations, and Agreements:
- 7.5.5.2 Product Launches and Product Expansions:
- 7.5.5.3 Acquisition and Mergers:
- 7.5.6 SWOT Analysis
- 7.6 Meta Platforms, Inc.
- 7.6.1 Company Overview
- 7.6.2 Financial Analysis
- 7.6.3 Segment and Regional Analysis
- 7.6.4 Research & Development Expense
- 7.6.5 Recent strategies and developments:
- 7.6.5.1 Partnerships, Collaborations, and Agreements:
- 7.6.5.2 Product Launches and Product Expansions:
- 7.6.5.3 Acquisition and Mergers:
- 7.6.6 SWOT Analysis
- 7.7 HTC Corporation
- 7.7.1 Company Overview
- 7.7.2 Financial Analysis
- 7.7.3 Regional Analysis
- 7.7.4 Research & Development Expense
- 7.7.5 Recent strategies and developments:
- 7.7.5.1 Partnerships, Collaborations, and Agreements:
- 7.7.5.2 Product Launches and Product Expansions:
- 7.8 HP, Inc.
- 7.8.1 Company Overview
- 7.8.2 Financial Analysis
- 7.8.3 Segmental and Regional Analysis
- 7.8.4 Research & Development Expenses
- 7.8.5 Recent strategies and developments:
- 7.8.5.1 Product Launches and Product Expansions:
- 7.8.5.2 Acquisition and Mergers:
- 7.9 Tibco Software, Inc. (Vista Equity Partners)
- 7.9.1 Company Overview
- 7.9.2 Recent strategies and developments:
- 7.9.2.1 Product Launches and Product Expansions:
- 7.9.2.2 Acquisition and Mergers:
- 7.10. Magic Leap, Inc.
- 7.10.1 Company Overview
- 7.10.2 Recent strategies and developments:
- 7.10.2.1 Partnerships, Collaborations, and Agreements:
- 7.10.2.2 Product Launches and Product Expansions: