|
|
市場調査レポート
商品コード
1276731
自律型トラクターの世界市場規模、シェア、産業動向分析レポート:作物タイプ別、コンポーネント別、農場用途別、馬力別、地域別展望と予測、2023~2029年Global Autonomous Tractors Market Size, Share & Industry Trends Analysis Report By Crop Type, By Component, By Farm Application, By Power Output, By Regional Outlook and Forecast, 2023 - 2029 |
||||||
|
|
|||||||


| 自律型トラクターの世界市場規模、シェア、産業動向分析レポート:作物タイプ別、コンポーネント別、農場用途別、馬力別、地域別展望と予測、2023~2029年 |
|
出版日: 2023年04月28日
発行: KBV Research
ページ情報: 英文 281 Pages
納期: 即納可能
|
- 全表示
- 概要
- 図表
- 目次
自律型トラクター市場規模は、2029年には40億米ドルに達し、予測期間中にCAGR20.0%の市場成長率で上昇すると予測されています。
トラクターは非常に多用途であり、さまざまなものに接続できるため、制御が難しく、人為的なミスが発生しやすくなっています。これらのエラーを減らすために、自律型トラクターが使用されます。さらに、自律走行トラクターを使用することで、農家は複数の農作業を一度に効率的に管理し、労働力を最大限に活用することができます。また、播種や耕起などの作業に自動運転トラクターを使用することで、灌漑用水の効率が大幅に改善されます。
農業労働のコスト上昇により、農業労働は減少しています。手作業に代わって、より安価で、利用しやすく、効果的な農作業を提供するために、農家は農業機械化をますます進めています。農業機械の運転は、主にトラクターによって実現されています。長期的に見れば、これは市場の拡大をサポートすると見られています。
COVID-19の影響分析
COVID-19ワクチンの市場投入に伴い、近い将来、COVID-19の患者数が減少することも予想されます。その結果、自律型トラクターを製造する事業が本格的に再開されることになっています。自律型トラクターメーカーは、COVID-19感染者の減少に伴い、人員、業務、供給網の確保に注力する必要があります。これにより、当面の危機に対処し、新しい業務手順を実施することができます。このように、自律型トラクター市場は、COVID-19の蔓延による好影響を示しました。
市場成長要因
農家を支援するための政府の取り組みが活発化
政府は様々な補助金に多額の資金を費やしています。コンバイン、トラクター、ハーベスターなどの農機具は高価であるため、農家が限られた資金源でこの機器を購入することは困難です。また、いくつかの国の政府も農業機械を供給しており、農業の機械化や女性に優しい道具や設備に援助しています。農家が農業機械を導入し、農作物の生産性を向上させることを目的として、多くの政府が補助金やクレジットを充実させ、支援を拡大しています。これが自律型トラクター市場の成長を支えていると推定されます。
農業従事者の不足と耕作地の減少
現在の課題を考慮し、農家は自律型トラクターのような技術を採用しています。これは、技術的に支援された農業には資格のある労働力が必要ですが、その労働力は緊急に不足しているため、生産性を上げることができます。そのため、この状況は市場を前進させる主な要因の1つとなっています。インド食料農業評議会(ICFA)によると、インドの農業労働者の数は今後数年間で劇的に減少すると予想されています。農業には訓練された人材が必要だが、入手が著しく困難であるため、農家は現在の困難を鑑みて生産性の高い自律型トラクターのようなイノベーションを受け入れています。その結果、市場は今後数年間で拡大すると予測されます。
市場抑制要因
データポイントを収集するための高度なツールの欠如
農作物からデータを収集するためにこれらの新しい技術を使用する場合、データ単体では無意味であるため、まとまった意味のあるものを作り出すことが課題となります。自律型トラクターは、人間のオペレーターのように、移り変わる状況や予期せぬ障害に柔軟に対応できない可能性があります。また、データの収集や検証には多くの時間と労力が必要です。こうした制約のため、自律型トラクターのような自律走行技術の採用が遅れ、最終的に予測期間中の自律型トラクター市場の拡大を阻害する可能性があります。
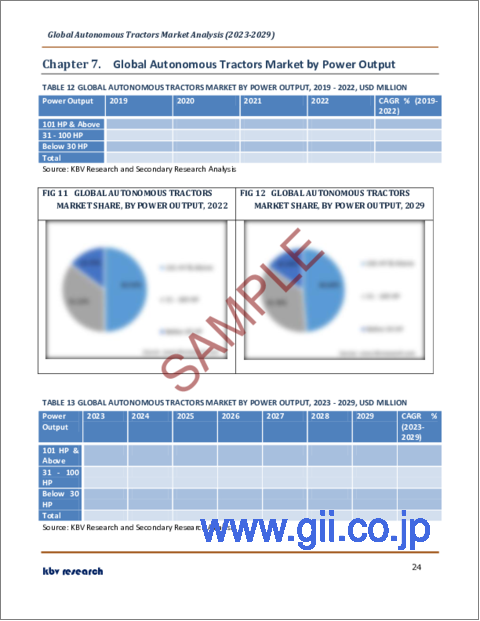
馬力の展望
自律型トラクター市場は、馬力ベースで、30HPまで、31-100HP、101HP以上に区分されます。2022年には、31-100HPのセグメントが自律型トラクター市場でかなりの収益シェアを占めています。このセグメントの拡大は、植え付け、収穫、種まき、耕作などのさまざまな農作業を行うための31-100HPトラクターの強い需要が主因です。これらのトラクターは、耐久性と積載能力を備えているため、輸送に最適です。さらに、31-100HPのトラクターは適応性が高く、粘土質の土壌でも優れた作業効率を発揮します。
コンポーネントの展望
コンポーネント別に見ると、自律型トラクター市場は、LiDAR、レーダー、GPS、カメラ/ビジョンシステム、超音波センサー、ハンドヘルドデバイスに細分化されています。GPSセグメントは、2022年の自律型トラクター市場でかなりの収益シェアを獲得しました。GPSの精度により、農家は畑の面積、道路の位置、関心のある場所間の距離を適切に表現した農場地図を作成することができます。これらの重要な情報を活用することで、農家は生産性を高めるために農作業を調整することができます。このような利点から、GPS対応ガジェットの普及が予想され、同分野の拡大が期待されています。
作物タイプの展望
作物の種類によって、自律型トラクター市場は、穀物・穀類、油糧種子・豆類、果物・野菜に二分されます。2022年には、果物&野菜セグメントが自律型トラクター市場を独占し、最大の収益シェアを獲得しました。世界人口の増加に伴う果物・野菜の需要増により、この分野はかなりの市場シェアを占めています。果物や野菜は、手作業で草取りや収穫をしなければなりません。そのため、労働集約型の農業を行うために、自律型トラクターのような最先端技術の必要性が高まっています。
農場用途の展望
自律型トラクター市場は、農場用途別に、耕うん(一次耕うん、二次耕うん)、種まき、収穫、その他に分類されます。2022年、耕作分野は自律型トラクター市場で最も高い収益シェアを記録しました。技術開発および多数の農学研究開発イニシアティブも、このセグメントの拡大に寄与していると考えられます。さらに、手作業による耕作作業はコストと時間がかかるため、連作作物を栽培する世界中の大・中規模の農場で耕作の自動化に対する需要が高まっています。
地域別展望
地域別に見ると、自律型トラクター市場は、北米、欧州、アジア太平洋、LAMEAで分析されます。2022年には、北米地域が最も高い収益シェアを獲得し、自律型トラクター市場を牽引しました。北米の大規模な農場規模は、先進技術の急速な導入に寄与しており、この地域の成長の要因となっています。米国のような豊かな国では、農家の労働力不足が問題となっています。そのため、こうした困難を克服するために、農家は自律型トラクターのような最先端の農業機械を導入し、市場の拡大に拍車をかけています。
市場参入企業がとる主な戦略は、「パートナーシップ」です。カーディナルマトリックスで示された分析によると、Deere &Companyが自律型トラクター市場の先駆者です。CNH Industrial N.V.、KUBOTA Corporation、AGCO Corporationなどの企業は、Autonomous Tractors市場における主要な革新的企業の一部です。
目次
第1章 市場範囲と調査手法
- 市場の定義
- 目的
- 市場範囲
- セグメンテーション
- 調査手法
第2章 市場概要
- イントロダクション
- 概要
- 市場構成とシナリオ
- 概要
- 市場に影響を与える主な要因
- 市場促進要因
- 市場抑制要因
第3章 競合分析- 世界
- KBVカーディナルマトリックス
- 最近の業界全体の戦略的展開
- パートナーシップ、コラボレーション、および契約
- 製品の発売と製品の拡大
- 買収と合併
- 主要成功戦略
- 主要なリーディングストラテジー
第4章 世界の自律型トラクター市場:作物タイプ別
- 世界の青果市場:地域別
- 世界の油糧種子および豆類市場:地域別
- 世界の穀物および穀物市場:地域別
第5章 世界の自律型トラクター市場:コンポーネント別
- 世界のレーダー市場:地域別
- 世界のGPS市場:地域別
- 世界のカメラ/ビジョンシステム市場:地域別
- 世界の超音波センサー市場:地域別
- 世界のLiDAR市場:地域別
- 世界のハンドヘルドデバイス市場:地域別
第6章 世界の自律型トラクター市場:農場用途別
- 世界の耕作市場:地域別
- 世界の収穫市場:地域別
- 世界の種子播種市場:地域別
- 世界のその他の市場:地域別
第7章 世界の自律型トラクター市場:馬力別
- 世界の101HP以上市場:地域別
- 世界の31~100HP市場:地域別
- 世界の30HP未満市場:地域別
第8章 世界の自律型トラクター市場:地域別
- 北米
- 北米の市場:国別
- 米国
- カナダ
- メキシコ
- その他北米地域
- 北米の市場:国別
- 欧州
- 欧州の市場:国別
- ドイツ
- 英国
- フランス
- ロシア
- スペイン
- イタリア
- その他欧州地域
- 欧州の市場:国別
- アジア太平洋
- アジア太平洋の市場:国別
- 中国
- 日本
- インド
- 韓国
- オーストラリア
- マレーシア
- その他アジア太平洋地域
- アジア太平洋の市場:国別
- ラテンアメリカ・中東・アフリカ
- ラテンアメリカ・中東・アフリカの市場:国別
- ブラジル
- アルゼンチン
- アラブ首長国連邦
- サウジアラビア
- 南アフリカ
- ナイジェリア
- その他ラテンアメリカ・中東・アフリカ地域
- ラテンアメリカ・中東・アフリカの市場:国別
第9章 企業プロファイル
- KUBOTA Corporation
- CNH Industrial NV
- Deere & Company
- AGCO Corporation
- Mahindra & Mahindra Limited(Mahindra Group)
- Kinze Manufacturing, Inc
- Alamo Group Inc(Dutch Power B.V.)
- Yanmar Holdings Co, Ltd.
- Trimble, Inc
- Autonomous Tractor Corporation
LIST OF TABLES
- TABLE 1 Global Autonomous Tractors Market, 2019 - 2022, USD Million
- TABLE 2 Global Autonomous Tractors Market, 2023 - 2029, USD Million
- TABLE 3 Partnerships, Collaborations and Agreements- Autonomous Tractors Market
- TABLE 4 Product Launches And Product Expansions- Autonomous Tractors Market
- TABLE 5 Acquisition and Mergers- Autonomous Tractors Market
- TABLE 6 Global Autonomous Tractors Market by Crop Type, 2019 - 2022, USD Million
- TABLE 7 Global Autonomous Tractors Market by Crop Type, 2023 - 2029, USD Million
- TABLE 8 Global Fruits & Vegetables Market by Region, 2019 - 2022, USD Million
- TABLE 9 Global Fruits & Vegetables Market by Region, 2023 - 2029, USD Million
- TABLE 10 Global Oilseeds & Pulses Market by Region, 2019 - 2022, USD Million
- TABLE 11 Global Oilseeds & Pulses Market by Region, 2023 - 2029, USD Million
- TABLE 12 Global Cereals & Grains Market by Region, 2019 - 2022, USD Million
- TABLE 13 Global Cereals & Grains Market by Region, 2023 - 2029, USD Million
- TABLE 14 Global Autonomous Tractors Market by Component, 2019 - 2022, USD Million
- TABLE 15 Global Autonomous Tractors Market by Component, 2023 - 2029, USD Million
- TABLE 16 Global Radar Market by Region, 2019 - 2022, USD Million
- TABLE 17 Global Radar Market by Region, 2023 - 2029, USD Million
- TABLE 18 Global GPS Market by Region, 2019 - 2022, USD Million
- TABLE 19 Global GPS Market by Region, 2023 - 2029, USD Million
- TABLE 20 Global Camera/Vision Systems Market by Region, 2019 - 2022, USD Million
- TABLE 21 Global Camera/Vision Systems Market by Region, 2023 - 2029, USD Million
- TABLE 22 Global Ultrasonic Sensors Market by Region, 2019 - 2022, USD Million
- TABLE 23 Global Ultrasonic Sensors Market by Region, 2023 - 2029, USD Million
- TABLE 24 Global LiDAR Market by Region, 2019 - 2022, USD Million
- TABLE 25 Global LiDAR Market by Region, 2023 - 2029, USD Million
- TABLE 26 Global Hand-held Devices Market by Region, 2019 - 2022, USD Million
- TABLE 27 Global Hand-held Devices Market by Region, 2023 - 2029, USD Million
- TABLE 28 Global Autonomous Tractors Market by Farm Application, 2019 - 2022, USD Million
- TABLE 29 Global Autonomous Tractors Market by Farm Application, 2023 - 2029, USD Million
- TABLE 30 Global Tillage Market by Region, 2019 - 2022, USD Million
- TABLE 31 Global Tillage Market by Region, 2023 - 2029, USD Million
- TABLE 32 Global Harvesting Market by Region, 2019 - 2022, USD Million
- TABLE 33 Global Harvesting Market by Region, 2023 - 2029, USD Million
- TABLE 34 Global Seed Sowing Market by Region, 2019 - 2022, USD Million
- TABLE 35 Global Seed Sowing Market by Region, 2023 - 2029, USD Million
- TABLE 36 Global Others Market by Region, 2019 - 2022, USD Million
- TABLE 37 Global Others Market by Region, 2023 - 2029, USD Million
- TABLE 38 Global Autonomous Tractors Market by Power Output, 2019 - 2022, USD Million
- TABLE 39 Global Autonomous Tractors Market by Power Output, 2023 - 2029, USD Million
- TABLE 40 Global 101 HP & Above Market by Region, 2019 - 2022, USD Million
- TABLE 41 Global 101 HP & Above Market by Region, 2023 - 2029, USD Million
- TABLE 42 Global 31 - 100 HP Market by Region, 2019 - 2022, USD Million
- TABLE 43 Global 31 - 100 HP Market by Region, 2023 - 2029, USD Million
- TABLE 44 Global Below 30 HP Market by Region, 2019 - 2022, USD Million
- TABLE 45 Global Below 30 HP Market by Region, 2023 - 2029, USD Million
- TABLE 46 Global Autonomous Tractors Market by Region, 2019 - 2022, USD Million
- TABLE 47 Global Autonomous Tractors Market by Region, 2023 - 2029, USD Million
- TABLE 48 North America Autonomous Tractors Market, 2019 - 2022, USD Million
- TABLE 49 North America Autonomous Tractors Market, 2023 - 2029, USD Million
- TABLE 50 North America Autonomous Tractors Market by Crop Type, 2019 - 2022, USD Million
- TABLE 51 North America Autonomous Tractors Market by Crop Type, 2023 - 2029, USD Million
- TABLE 52 North America Fruits & Vegetables Market by Country, 2019 - 2022, USD Million
- TABLE 53 North America Fruits & Vegetables Market by Country, 2023 - 2029, USD Million
- TABLE 54 North America Oilseeds & Pulses Market by Country, 2019 - 2022, USD Million
- TABLE 55 North America Oilseeds & Pulses Market by Country, 2023 - 2029, USD Million
- TABLE 56 North America Cereals & Grains Market by Country, 2019 - 2022, USD Million
- TABLE 57 North America Cereals & Grains Market by Country, 2023 - 2029, USD Million
- TABLE 58 North America Autonomous Tractors Market by Component, 2019 - 2022, USD Million
- TABLE 59 North America Autonomous Tractors Market by Component, 2023 - 2029, USD Million
- TABLE 60 North America Radar Market by Country, 2019 - 2022, USD Million
- TABLE 61 North America Radar Market by Country, 2023 - 2029, USD Million
- TABLE 62 North America GPS Market by Country, 2019 - 2022, USD Million
- TABLE 63 North America GPS Market by Country, 2023 - 2029, USD Million
- TABLE 64 North America Camera/Vision Systems Market by Country, 2019 - 2022, USD Million
- TABLE 65 North America Camera/Vision Systems Market by Country, 2023 - 2029, USD Million
- TABLE 66 North America Ultrasonic Sensors Market by Country, 2019 - 2022, USD Million
- TABLE 67 North America Ultrasonic Sensors Market by Country, 2023 - 2029, USD Million
- TABLE 68 North America LiDAR Market by Country, 2019 - 2022, USD Million
- TABLE 69 North America LiDAR Market by Country, 2023 - 2029, USD Million
- TABLE 70 North America Hand-held Devices Market by Country, 2019 - 2022, USD Million
- TABLE 71 North America Hand-held Devices Market by Country, 2023 - 2029, USD Million
- TABLE 72 North America Autonomous Tractors Market by Farm Application, 2019 - 2022, USD Million
- TABLE 73 North America Autonomous Tractors Market by Farm Application, 2023 - 2029, USD Million
- TABLE 74 North America Tillage Market by Country, 2019 - 2022, USD Million
- TABLE 75 North America Tillage Market by Country, 2023 - 2029, USD Million
- TABLE 76 North America Harvesting Market by Country, 2019 - 2022, USD Million
- TABLE 77 North America Harvesting Market by Country, 2023 - 2029, USD Million
- TABLE 78 North America Seed Sowing Market by Country, 2019 - 2022, USD Million
- TABLE 79 North America Seed Sowing Market by Country, 2023 - 2029, USD Million
- TABLE 80 North America Others Market by Country, 2019 - 2022, USD Million
- TABLE 81 North America Others Market by Country, 2023 - 2029, USD Million
- TABLE 82 North America Autonomous Tractors Market by Power Output, 2019 - 2022, USD Million
- TABLE 83 North America Autonomous Tractors Market by Power Output, 2023 - 2029, USD Million
- TABLE 84 North America 101 HP & Above Market by Country, 2019 - 2022, USD Million
- TABLE 85 North America 101 HP & Above Market by Country, 2023 - 2029, USD Million
- TABLE 86 North America 31 - 100 HP Market by Country, 2019 - 2022, USD Million
- TABLE 87 North America 31 - 100 HP Market by Country, 2023 - 2029, USD Million
- TABLE 88 North America Below 30 HP Market by Country, 2019 - 2022, USD Million
- TABLE 89 North America Below 30 HP Market by Country, 2023 - 2029, USD Million
- TABLE 90 North America Autonomous Tractors Market by Country, 2019 - 2022, USD Million
- TABLE 91 North America Autonomous Tractors Market by Country, 2023 - 2029, USD Million
- TABLE 92 US Autonomous Tractors Market, 2019 - 2022, USD Million
- TABLE 93 US Autonomous Tractors Market, 2023 - 2029, USD Million
- TABLE 94 US Autonomous Tractors Market by Crop Type, 2019 - 2022, USD Million
- TABLE 95 US Autonomous Tractors Market by Crop Type, 2023 - 2029, USD Million
- TABLE 96 US Autonomous Tractors Market by Component, 2019 - 2022, USD Million
- TABLE 97 US Autonomous Tractors Market by Component, 2023 - 2029, USD Million
- TABLE 98 US Autonomous Tractors Market by Farm Application, 2019 - 2022, USD Million
- TABLE 99 US Autonomous Tractors Market by Farm Application, 2023 - 2029, USD Million
- TABLE 100 US Autonomous Tractors Market by Power Output, 2019 - 2022, USD Million
- TABLE 101 US Autonomous Tractors Market by Power Output, 2023 - 2029, USD Million
- TABLE 102 Canada Autonomous Tractors Market, 2019 - 2022, USD Million
- TABLE 103 Canada Autonomous Tractors Market, 2023 - 2029, USD Million
- TABLE 104 Canada Autonomous Tractors Market by Crop Type, 2019 - 2022, USD Million
- TABLE 105 Canada Autonomous Tractors Market by Crop Type, 2023 - 2029, USD Million
- TABLE 106 Canada Autonomous Tractors Market by Component, 2019 - 2022, USD Million
- TABLE 107 Canada Autonomous Tractors Market by Component, 2023 - 2029, USD Million
- TABLE 108 Canada Autonomous Tractors Market by Farm Application, 2019 - 2022, USD Million
- TABLE 109 Canada Autonomous Tractors Market by Farm Application, 2023 - 2029, USD Million
- TABLE 110 Canada Autonomous Tractors Market by Power Output, 2019 - 2022, USD Million
- TABLE 111 Canada Autonomous Tractors Market by Power Output, 2023 - 2029, USD Million
- TABLE 112 Mexico Autonomous Tractors Market, 2019 - 2022, USD Million
- TABLE 113 Mexico Autonomous Tractors Market, 2023 - 2029, USD Million
- TABLE 114 Mexico Autonomous Tractors Market by Crop Type, 2019 - 2022, USD Million
- TABLE 115 Mexico Autonomous Tractors Market by Crop Type, 2023 - 2029, USD Million
- TABLE 116 Mexico Autonomous Tractors Market by Component, 2019 - 2022, USD Million
- TABLE 117 Mexico Autonomous Tractors Market by Component, 2023 - 2029, USD Million
- TABLE 118 Mexico Autonomous Tractors Market by Farm Application, 2019 - 2022, USD Million
- TABLE 119 Mexico Autonomous Tractors Market by Farm Application, 2023 - 2029, USD Million
- TABLE 120 Mexico Autonomous Tractors Market by Power Output, 2019 - 2022, USD Million
- TABLE 121 Mexico Autonomous Tractors Market by Power Output, 2023 - 2029, USD Million
- TABLE 122 Rest of North America Autonomous Tractors Market, 2019 - 2022, USD Million
- TABLE 123 Rest of North America Autonomous Tractors Market, 2023 - 2029, USD Million
- TABLE 124 Rest of North America Autonomous Tractors Market by Crop Type, 2019 - 2022, USD Million
- TABLE 125 Rest of North America Autonomous Tractors Market by Crop Type, 2023 - 2029, USD Million
- TABLE 126 Rest of North America Autonomous Tractors Market by Component, 2019 - 2022, USD Million
- TABLE 127 Rest of North America Autonomous Tractors Market by Component, 2023 - 2029, USD Million
- TABLE 128 Rest of North America Autonomous Tractors Market by Farm Application, 2019 - 2022, USD Million
- TABLE 129 Rest of North America Autonomous Tractors Market by Farm Application, 2023 - 2029, USD Million
- TABLE 130 Rest of North America Autonomous Tractors Market by Power Output, 2019 - 2022, USD Million
- TABLE 131 Rest of North America Autonomous Tractors Market by Power Output, 2023 - 2029, USD Million
- TABLE 132 Europe Autonomous Tractors Market, 2019 - 2022, USD Million
- TABLE 133 Europe Autonomous Tractors Market, 2023 - 2029, USD Million
- TABLE 134 Europe Autonomous Tractors Market by Crop Type, 2019 - 2022, USD Million
- TABLE 135 Europe Autonomous Tractors Market by Crop Type, 2023 - 2029, USD Million
- TABLE 136 Europe Fruits & Vegetables Market by Country, 2019 - 2022, USD Million
- TABLE 137 Europe Fruits & Vegetables Market by Country, 2023 - 2029, USD Million
- TABLE 138 Europe Oilseeds & Pulses Market by Country, 2019 - 2022, USD Million
- TABLE 139 Europe Oilseeds & Pulses Market by Country, 2023 - 2029, USD Million
- TABLE 140 Europe Cereals & Grains Market by Country, 2019 - 2022, USD Million
- TABLE 141 Europe Cereals & Grains Market by Country, 2023 - 2029, USD Million
- TABLE 142 Europe Autonomous Tractors Market by Component, 2019 - 2022, USD Million
- TABLE 143 Europe Autonomous Tractors Market by Component, 2023 - 2029, USD Million
- TABLE 144 Europe Radar Market by Country, 2019 - 2022, USD Million
- TABLE 145 Europe Radar Market by Country, 2023 - 2029, USD Million
- TABLE 146 Europe GPS Market by Country, 2019 - 2022, USD Million
- TABLE 147 Europe GPS Market by Country, 2023 - 2029, USD Million
- TABLE 148 Europe Camera/Vision Systems Market by Country, 2019 - 2022, USD Million
- TABLE 149 Europe Camera/Vision Systems Market by Country, 2023 - 2029, USD Million
- TABLE 150 Europe Ultrasonic Sensors Market by Country, 2019 - 2022, USD Million
- TABLE 151 Europe Ultrasonic Sensors Market by Country, 2023 - 2029, USD Million
- TABLE 152 Europe LiDAR Market by Country, 2019 - 2022, USD Million
- TABLE 153 Europe LiDAR Market by Country, 2023 - 2029, USD Million
- TABLE 154 Europe Hand-held Devices Market by Country, 2019 - 2022, USD Million
- TABLE 155 Europe Hand-held Devices Market by Country, 2023 - 2029, USD Million
- TABLE 156 Europe Autonomous Tractors Market by Farm Application, 2019 - 2022, USD Million
- TABLE 157 Europe Autonomous Tractors Market by Farm Application, 2023 - 2029, USD Million
- TABLE 158 Europe Tillage Market by Country, 2019 - 2022, USD Million
- TABLE 159 Europe Tillage Market by Country, 2023 - 2029, USD Million
- TABLE 160 Europe Harvesting Market by Country, 2019 - 2022, USD Million
- TABLE 161 Europe Harvesting Market by Country, 2023 - 2029, USD Million
- TABLE 162 Europe Seed Sowing Market by Country, 2019 - 2022, USD Million
- TABLE 163 Europe Seed Sowing Market by Country, 2023 - 2029, USD Million
- TABLE 164 Europe Others Market by Country, 2019 - 2022, USD Million
- TABLE 165 Europe Others Market by Country, 2023 - 2029, USD Million
- TABLE 166 Europe Autonomous Tractors Market by Power Output, 2019 - 2022, USD Million
- TABLE 167 Europe Autonomous Tractors Market by Power Output, 2023 - 2029, USD Million
- TABLE 168 Europe 101 HP & Above Market by Country, 2019 - 2022, USD Million
- TABLE 169 Europe 101 HP & Above Market by Country, 2023 - 2029, USD Million
- TABLE 170 Europe 31 - 100 HP Market by Country, 2019 - 2022, USD Million
- TABLE 171 Europe 31 - 100 HP Market by Country, 2023 - 2029, USD Million
- TABLE 172 Europe Below 30 HP Market by Country, 2019 - 2022, USD Million
- TABLE 173 Europe Below 30 HP Market by Country, 2023 - 2029, USD Million
- TABLE 174 Europe Autonomous Tractors Market by Country, 2019 - 2022, USD Million
- TABLE 175 Europe Autonomous Tractors Market by Country, 2023 - 2029, USD Million
- TABLE 176 Germany Autonomous Tractors Market, 2019 - 2022, USD Million
- TABLE 177 Germany Autonomous Tractors Market, 2023 - 2029, USD Million
- TABLE 178 Germany Autonomous Tractors Market by Crop Type, 2019 - 2022, USD Million
- TABLE 179 Germany Autonomous Tractors Market by Crop Type, 2023 - 2029, USD Million
- TABLE 180 Germany Autonomous Tractors Market by Component, 2019 - 2022, USD Million
- TABLE 181 Germany Autonomous Tractors Market by Component, 2023 - 2029, USD Million
- TABLE 182 Germany Autonomous Tractors Market by Farm Application, 2019 - 2022, USD Million
- TABLE 183 Germany Autonomous Tractors Market by Farm Application, 2023 - 2029, USD Million
- TABLE 184 Germany Autonomous Tractors Market by Power Output, 2019 - 2022, USD Million
- TABLE 185 Germany Autonomous Tractors Market by Power Output, 2023 - 2029, USD Million
- TABLE 186 UK Autonomous Tractors Market, 2019 - 2022, USD Million
- TABLE 187 UK Autonomous Tractors Market, 2023 - 2029, USD Million
- TABLE 188 UK Autonomous Tractors Market by Crop Type, 2019 - 2022, USD Million
- TABLE 189 UK Autonomous Tractors Market by Crop Type, 2023 - 2029, USD Million
- TABLE 190 UK Autonomous Tractors Market by Component, 2019 - 2022, USD Million
- TABLE 191 UK Autonomous Tractors Market by Component, 2023 - 2029, USD Million
- TABLE 192 UK Autonomous Tractors Market by Farm Application, 2019 - 2022, USD Million
- TABLE 193 UK Autonomous Tractors Market by Farm Application, 2023 - 2029, USD Million
- TABLE 194 UK Autonomous Tractors Market by Power Output, 2019 - 2022, USD Million
- TABLE 195 UK Autonomous Tractors Market by Power Output, 2023 - 2029, USD Million
- TABLE 196 France Autonomous Tractors Market, 2019 - 2022, USD Million
- TABLE 197 France Autonomous Tractors Market, 2023 - 2029, USD Million
- TABLE 198 France Autonomous Tractors Market by Crop Type, 2019 - 2022, USD Million
- TABLE 199 France Autonomous Tractors Market by Crop Type, 2023 - 2029, USD Million
- TABLE 200 France Autonomous Tractors Market by Component, 2019 - 2022, USD Million
- TABLE 201 France Autonomous Tractors Market by Component, 2023 - 2029, USD Million
- TABLE 202 France Autonomous Tractors Market by Farm Application, 2019 - 2022, USD Million
- TABLE 203 France Autonomous Tractors Market by Farm Application, 2023 - 2029, USD Million
- TABLE 204 France Autonomous Tractors Market by Power Output, 2019 - 2022, USD Million
- TABLE 205 France Autonomous Tractors Market by Power Output, 2023 - 2029, USD Million
- TABLE 206 Russia Autonomous Tractors Market, 2019 - 2022, USD Million
- TABLE 207 Russia Autonomous Tractors Market, 2023 - 2029, USD Million
- TABLE 208 Russia Autonomous Tractors Market by Crop Type, 2019 - 2022, USD Million
- TABLE 209 Russia Autonomous Tractors Market by Crop Type, 2023 - 2029, USD Million
- TABLE 210 Russia Autonomous Tractors Market by Component, 2019 - 2022, USD Million
- TABLE 211 Russia Autonomous Tractors Market by Component, 2023 - 2029, USD Million
- TABLE 212 Russia Autonomous Tractors Market by Farm Application, 2019 - 2022, USD Million
- TABLE 213 Russia Autonomous Tractors Market by Farm Application, 2023 - 2029, USD Million
- TABLE 214 Russia Autonomous Tractors Market by Power Output, 2019 - 2022, USD Million
- TABLE 215 Russia Autonomous Tractors Market by Power Output, 2023 - 2029, USD Million
- TABLE 216 Spain Autonomous Tractors Market, 2019 - 2022, USD Million
- TABLE 217 Spain Autonomous Tractors Market, 2023 - 2029, USD Million
- TABLE 218 Spain Autonomous Tractors Market by Crop Type, 2019 - 2022, USD Million
- TABLE 219 Spain Autonomous Tractors Market by Crop Type, 2023 - 2029, USD Million
- TABLE 220 Spain Autonomous Tractors Market by Component, 2019 - 2022, USD Million
- TABLE 221 Spain Autonomous Tractors Market by Component, 2023 - 2029, USD Million
- TABLE 222 Spain Autonomous Tractors Market by Farm Application, 2019 - 2022, USD Million
- TABLE 223 Spain Autonomous Tractors Market by Farm Application, 2023 - 2029, USD Million
- TABLE 224 Spain Autonomous Tractors Market by Power Output, 2019 - 2022, USD Million
- TABLE 225 Spain Autonomous Tractors Market by Power Output, 2023 - 2029, USD Million
- TABLE 226 Italy Autonomous Tractors Market, 2019 - 2022, USD Million
- TABLE 227 Italy Autonomous Tractors Market, 2023 - 2029, USD Million
- TABLE 228 Italy Autonomous Tractors Market by Crop Type, 2019 - 2022, USD Million
- TABLE 229 Italy Autonomous Tractors Market by Crop Type, 2023 - 2029, USD Million
- TABLE 230 Italy Autonomous Tractors Market by Component, 2019 - 2022, USD Million
- TABLE 231 Italy Autonomous Tractors Market by Component, 2023 - 2029, USD Million
- TABLE 232 Italy Autonomous Tractors Market by Farm Application, 2019 - 2022, USD Million
- TABLE 233 Italy Autonomous Tractors Market by Farm Application, 2023 - 2029, USD Million
- TABLE 234 Italy Autonomous Tractors Market by Power Output, 2019 - 2022, USD Million
- TABLE 235 Italy Autonomous Tractors Market by Power Output, 2023 - 2029, USD Million
- TABLE 236 Rest of Europe Autonomous Tractors Market, 2019 - 2022, USD Million
- TABLE 237 Rest of Europe Autonomous Tractors Market, 2023 - 2029, USD Million
- TABLE 238 Rest of Europe Autonomous Tractors Market by Crop Type, 2019 - 2022, USD Million
- TABLE 239 Rest of Europe Autonomous Tractors Market by Crop Type, 2023 - 2029, USD Million
- TABLE 240 Rest of Europe Autonomous Tractors Market by Component, 2019 - 2022, USD Million
- TABLE 241 Rest of Europe Autonomous Tractors Market by Component, 2023 - 2029, USD Million
- TABLE 242 Rest of Europe Autonomous Tractors Market by Farm Application, 2019 - 2022, USD Million
- TABLE 243 Rest of Europe Autonomous Tractors Market by Farm Application, 2023 - 2029, USD Million
- TABLE 244 Rest of Europe Autonomous Tractors Market by Power Output, 2019 - 2022, USD Million
- TABLE 245 Rest of Europe Autonomous Tractors Market by Power Output, 2023 - 2029, USD Million
- TABLE 246 Asia Pacific Autonomous Tractors Market, 2019 - 2022, USD Million
- TABLE 247 Asia Pacific Autonomous Tractors Market, 2023 - 2029, USD Million
- TABLE 248 Asia Pacific Autonomous Tractors Market by Crop Type, 2019 - 2022, USD Million
- TABLE 249 Asia Pacific Autonomous Tractors Market by Crop Type, 2023 - 2029, USD Million
- TABLE 250 Asia Pacific Fruits & Vegetables Market by Country, 2019 - 2022, USD Million
- TABLE 251 Asia Pacific Fruits & Vegetables Market by Country, 2023 - 2029, USD Million
- TABLE 252 Asia Pacific Oilseeds & Pulses Market by Country, 2019 - 2022, USD Million
- TABLE 253 Asia Pacific Oilseeds & Pulses Market by Country, 2023 - 2029, USD Million
- TABLE 254 Asia Pacific Cereals & Grains Market by Country, 2019 - 2022, USD Million
- TABLE 255 Asia Pacific Cereals & Grains Market by Country, 2023 - 2029, USD Million
- TABLE 256 Asia Pacific Autonomous Tractors Market by Component, 2019 - 2022, USD Million
- TABLE 257 Asia Pacific Autonomous Tractors Market by Component, 2023 - 2029, USD Million
- TABLE 258 Asia Pacific Radar Market by Country, 2019 - 2022, USD Million
- TABLE 259 Asia Pacific Radar Market by Country, 2023 - 2029, USD Million
- TABLE 260 Asia Pacific GPS Market by Country, 2019 - 2022, USD Million
- TABLE 261 Asia Pacific GPS Market by Country, 2023 - 2029, USD Million
- TABLE 262 Asia Pacific Camera/Vision Systems Market by Country, 2019 - 2022, USD Million
- TABLE 263 Asia Pacific Camera/Vision Systems Market by Country, 2023 - 2029, USD Million
- TABLE 264 Asia Pacific Ultrasonic Sensors Market by Country, 2019 - 2022, USD Million
- TABLE 265 Asia Pacific Ultrasonic Sensors Market by Country, 2023 - 2029, USD Million
- TABLE 266 Asia Pacific LiDAR Market by Country, 2019 - 2022, USD Million
- TABLE 267 Asia Pacific LiDAR Market by Country, 2023 - 2029, USD Million
- TABLE 268 Asia Pacific Hand-held Devices Market by Country, 2019 - 2022, USD Million
- TABLE 269 Asia Pacific Hand-held Devices Market by Country, 2023 - 2029, USD Million
- TABLE 270 Asia Pacific Autonomous Tractors Market by Farm Application, 2019 - 2022, USD Million
- TABLE 271 Asia Pacific Autonomous Tractors Market by Farm Application, 2023 - 2029, USD Million
- TABLE 272 Asia Pacific Tillage Market by Country, 2019 - 2022, USD Million
- TABLE 273 Asia Pacific Tillage Market by Country, 2023 - 2029, USD Million
- TABLE 274 Asia Pacific Harvesting Market by Country, 2019 - 2022, USD Million
- TABLE 275 Asia Pacific Harvesting Market by Country, 2023 - 2029, USD Million
- TABLE 276 Asia Pacific Seed Sowing Market by Country, 2019 - 2022, USD Million
- TABLE 277 Asia Pacific Seed Sowing Market by Country, 2023 - 2029, USD Million
- TABLE 278 Asia Pacific Others Market by Country, 2019 - 2022, USD Million
- TABLE 279 Asia Pacific Others Market by Country, 2023 - 2029, USD Million
- TABLE 280 Asia Pacific Autonomous Tractors Market by Power Output, 2019 - 2022, USD Million
- TABLE 281 Asia Pacific Autonomous Tractors Market by Power Output, 2023 - 2029, USD Million
- TABLE 282 Asia Pacific 101 HP & Above Market by Country, 2019 - 2022, USD Million
- TABLE 283 Asia Pacific 101 HP & Above Market by Country, 2023 - 2029, USD Million
- TABLE 284 Asia Pacific 31 - 100 HP Market by Country, 2019 - 2022, USD Million
- TABLE 285 Asia Pacific 31 - 100 HP Market by Country, 2023 - 2029, USD Million
- TABLE 286 Asia Pacific Below 30 HP Market by Country, 2019 - 2022, USD Million
- TABLE 287 Asia Pacific Below 30 HP Market by Country, 2023 - 2029, USD Million
- TABLE 288 Asia Pacific Autonomous Tractors Market by Country, 2019 - 2022, USD Million
- TABLE 289 Asia Pacific Autonomous Tractors Market by Country, 2023 - 2029, USD Million
- TABLE 290 China Autonomous Tractors Market, 2019 - 2022, USD Million
- TABLE 291 China Autonomous Tractors Market, 2023 - 2029, USD Million
- TABLE 292 China Autonomous Tractors Market by Crop Type, 2019 - 2022, USD Million
- TABLE 293 China Autonomous Tractors Market by Crop Type, 2023 - 2029, USD Million
- TABLE 294 China Autonomous Tractors Market by Component, 2019 - 2022, USD Million
- TABLE 295 China Autonomous Tractors Market by Component, 2023 - 2029, USD Million
- TABLE 296 China Autonomous Tractors Market by Farm Application, 2019 - 2022, USD Million
- TABLE 297 China Autonomous Tractors Market by Farm Application, 2023 - 2029, USD Million
- TABLE 298 China Autonomous Tractors Market by Power Output, 2019 - 2022, USD Million
- TABLE 299 China Autonomous Tractors Market by Power Output, 2023 - 2029, USD Million
- TABLE 300 Japan Autonomous Tractors Market, 2019 - 2022, USD Million
- TABLE 301 Japan Autonomous Tractors Market, 2023 - 2029, USD Million
- TABLE 302 Japan Autonomous Tractors Market by Crop Type, 2019 - 2022, USD Million
- TABLE 303 Japan Autonomous Tractors Market by Crop Type, 2023 - 2029, USD Million
- TABLE 304 Japan Autonomous Tractors Market by Component, 2019 - 2022, USD Million
- TABLE 305 Japan Autonomous Tractors Market by Component, 2023 - 2029, USD Million
- TABLE 306 Japan Autonomous Tractors Market by Farm Application, 2019 - 2022, USD Million
- TABLE 307 Japan Autonomous Tractors Market by Farm Application, 2023 - 2029, USD Million
- TABLE 308 Japan Autonomous Tractors Market by Power Output, 2019 - 2022, USD Million
- TABLE 309 Japan Autonomous Tractors Market by Power Output, 2023 - 2029, USD Million
- TABLE 310 India Autonomous Tractors Market, 2019 - 2022, USD Million
- TABLE 311 India Autonomous Tractors Market, 2023 - 2029, USD Million
- TABLE 312 India Autonomous Tractors Market by Crop Type, 2019 - 2022, USD Million
- TABLE 313 India Autonomous Tractors Market by Crop Type, 2023 - 2029, USD Million
- TABLE 314 India Autonomous Tractors Market by Component, 2019 - 2022, USD Million
- TABLE 315 India Autonomous Tractors Market by Component, 2023 - 2029, USD Million
- TABLE 316 India Autonomous Tractors Market by Farm Application, 2019 - 2022, USD Million
- TABLE 317 India Autonomous Tractors Market by Farm Application, 2023 - 2029, USD Million
- TABLE 318 India Autonomous Tractors Market by Power Output, 2019 - 2022, USD Million
- TABLE 319 India Autonomous Tractors Market by Power Output, 2023 - 2029, USD Million
- TABLE 320 South Korea Autonomous Tractors Market, 2019 - 2022, USD Million
- TABLE 321 South Korea Autonomous Tractors Market, 2023 - 2029, USD Million
- TABLE 322 South Korea Autonomous Tractors Market by Crop Type, 2019 - 2022, USD Million
- TABLE 323 South Korea Autonomous Tractors Market by Crop Type, 2023 - 2029, USD Million
- TABLE 324 South Korea Autonomous Tractors Market by Component, 2019 - 2022, USD Million
- TABLE 325 South Korea Autonomous Tractors Market by Component, 2023 - 2029, USD Million
- TABLE 326 South Korea Autonomous Tractors Market by Farm Application, 2019 - 2022, USD Million
- TABLE 327 South Korea Autonomous Tractors Market by Farm Application, 2023 - 2029, USD Million
- TABLE 328 South Korea Autonomous Tractors Market by Power Output, 2019 - 2022, USD Million
- TABLE 329 South Korea Autonomous Tractors Market by Power Output, 2023 - 2029, USD Million
- TABLE 330 Australia Autonomous Tractors Market, 2019 - 2022, USD Million
- TABLE 331 Australia Autonomous Tractors Market, 2023 - 2029, USD Million
- TABLE 332 Australia Autonomous Tractors Market by Crop Type, 2019 - 2022, USD Million
- TABLE 333 Australia Autonomous Tractors Market by Crop Type, 2023 - 2029, USD Million
- TABLE 334 Australia Autonomous Tractors Market by Component, 2019 - 2022, USD Million
- TABLE 335 Australia Autonomous Tractors Market by Component, 2023 - 2029, USD Million
- TABLE 336 Australia Autonomous Tractors Market by Farm Application, 2019 - 2022, USD Million
- TABLE 337 Australia Autonomous Tractors Market by Farm Application, 2023 - 2029, USD Million
- TABLE 338 Australia Autonomous Tractors Market by Power Output, 2019 - 2022, USD Million
- TABLE 339 Australia Autonomous Tractors Market by Power Output, 2023 - 2029, USD Million
- TABLE 340 Malaysia Autonomous Tractors Market, 2019 - 2022, USD Million
- TABLE 341 Malaysia Autonomous Tractors Market, 2023 - 2029, USD Million
- TABLE 342 Malaysia Autonomous Tractors Market by Crop Type, 2019 - 2022, USD Million
- TABLE 343 Malaysia Autonomous Tractors Market by Crop Type, 2023 - 2029, USD Million
- TABLE 344 Malaysia Autonomous Tractors Market by Component, 2019 - 2022, USD Million
- TABLE 345 Malaysia Autonomous Tractors Market by Component, 2023 - 2029, USD Million
- TABLE 346 Malaysia Autonomous Tractors Market by Farm Application, 2019 - 2022, USD Million
- TABLE 347 Malaysia Autonomous Tractors Market by Farm Application, 2023 - 2029, USD Million
- TABLE 348 Malaysia Autonomous Tractors Market by Power Output, 2019 - 2022, USD Million
- TABLE 349 Malaysia Autonomous Tractors Market by Power Output, 2023 - 2029, USD Million
- TABLE 350 Rest of Asia Pacific Autonomous Tractors Market, 2019 - 2022, USD Million
- TABLE 351 Rest of Asia Pacific Autonomous Tractors Market, 2023 - 2029, USD Million
- TABLE 352 Rest of Asia Pacific Autonomous Tractors Market by Crop Type, 2019 - 2022, USD Million
- TABLE 353 Rest of Asia Pacific Autonomous Tractors Market by Crop Type, 2023 - 2029, USD Million
- TABLE 354 Rest of Asia Pacific Autonomous Tractors Market by Component, 2019 - 2022, USD Million
- TABLE 355 Rest of Asia Pacific Autonomous Tractors Market by Component, 2023 - 2029, USD Million
- TABLE 356 Rest of Asia Pacific Autonomous Tractors Market by Farm Application, 2019 - 2022, USD Million
- TABLE 357 Rest of Asia Pacific Autonomous Tractors Market by Farm Application, 2023 - 2029, USD Million
- TABLE 358 Rest of Asia Pacific Autonomous Tractors Market by Power Output, 2019 - 2022, USD Million
- TABLE 359 Rest of Asia Pacific Autonomous Tractors Market by Power Output, 2023 - 2029, USD Million
- TABLE 360 LAMEA Autonomous Tractors Market, 2019 - 2022, USD Million
- TABLE 361 LAMEA Autonomous Tractors Market, 2023 - 2029, USD Million
- TABLE 362 LAMEA Autonomous Tractors Market by Crop Type, 2019 - 2022, USD Million
- TABLE 363 LAMEA Autonomous Tractors Market by Crop Type, 2023 - 2029, USD Million
- TABLE 364 LAMEA Fruits & Vegetables Market by Country, 2019 - 2022, USD Million
- TABLE 365 LAMEA Fruits & Vegetables Market by Country, 2023 - 2029, USD Million
- TABLE 366 LAMEA Oilseeds & Pulses Market by Country, 2019 - 2022, USD Million
- TABLE 367 LAMEA Oilseeds & Pulses Market by Country, 2023 - 2029, USD Million
- TABLE 368 LAMEA Cereals & Grains Market by Country, 2019 - 2022, USD Million
- TABLE 369 LAMEA Cereals & Grains Market by Country, 2023 - 2029, USD Million
- TABLE 370 LAMEA Autonomous Tractors Market by Component, 2019 - 2022, USD Million
- TABLE 371 LAMEA Autonomous Tractors Market by Component, 2023 - 2029, USD Million
- TABLE 372 LAMEA Radar Market by Country, 2019 - 2022, USD Million
- TABLE 373 LAMEA Radar Market by Country, 2023 - 2029, USD Million
- TABLE 374 LAMEA GPS Market by Country, 2019 - 2022, USD Million
- TABLE 375 LAMEA GPS Market by Country, 2023 - 2029, USD Million
- TABLE 376 LAMEA Camera/Vision Systems Market by Country, 2019 - 2022, USD Million
- TABLE 377 LAMEA Camera/Vision Systems Market by Country, 2023 - 2029, USD Million
- TABLE 378 LAMEA Ultrasonic Sensors Market by Country, 2019 - 2022, USD Million
- TABLE 379 LAMEA Ultrasonic Sensors Market by Country, 2023 - 2029, USD Million
- TABLE 380 LAMEA LiDAR Market by Country, 2019 - 2022, USD Million
- TABLE 381 LAMEA LiDAR Market by Country, 2023 - 2029, USD Million
- TABLE 382 LAMEA Hand-held Devices Market by Country, 2019 - 2022, USD Million
- TABLE 383 LAMEA Hand-held Devices Market by Country, 2023 - 2029, USD Million
- TABLE 384 LAMEA Autonomous Tractors Market by Farm Application, 2019 - 2022, USD Million
- TABLE 385 LAMEA Autonomous Tractors Market by Farm Application, 2023 - 2029, USD Million
- TABLE 386 LAMEA Tillage Market by Country, 2019 - 2022, USD Million
- TABLE 387 LAMEA Tillage Market by Country, 2023 - 2029, USD Million
- TABLE 388 LAMEA Harvesting Market by Country, 2019 - 2022, USD Million
- TABLE 389 LAMEA Harvesting Market by Country, 2023 - 2029, USD Million
- TABLE 390 LAMEA Seed Sowing Market by Country, 2019 - 2022, USD Million
- TABLE 391 LAMEA Seed Sowing Market by Country, 2023 - 2029, USD Million
- TABLE 392 LAMEA Others Market by Country, 2019 - 2022, USD Million
- TABLE 393 LAMEA Others Market by Country, 2023 - 2029, USD Million
- TABLE 394 LAMEA Autonomous Tractors Market by Power Output, 2019 - 2022, USD Million
- TABLE 395 LAMEA Autonomous Tractors Market by Power Output, 2023 - 2029, USD Million
- TABLE 396 LAMEA 101 HP & Above Market by Country, 2019 - 2022, USD Million
- TABLE 397 LAMEA 101 HP & Above Market by Country, 2023 - 2029, USD Million
- TABLE 398 LAMEA 31 - 100 HP Market by Country, 2019 - 2022, USD Million
- TABLE 399 LAMEA 31 - 100 HP Market by Country, 2023 - 2029, USD Million
- TABLE 400 LAMEA Below 30 HP Market by Country, 2019 - 2022, USD Million
- TABLE 401 LAMEA Below 30 HP Market by Country, 2023 - 2029, USD Million
- TABLE 402 LAMEA Autonomous Tractors Market by Country, 2019 - 2022, USD Million
- TABLE 403 LAMEA Autonomous Tractors Market by Country, 2023 - 2029, USD Million
- TABLE 404 Brazil Autonomous Tractors Market, 2019 - 2022, USD Million
- TABLE 405 Brazil Autonomous Tractors Market, 2023 - 2029, USD Million
- TABLE 406 Brazil Autonomous Tractors Market by Crop Type, 2019 - 2022, USD Million
- TABLE 407 Brazil Autonomous Tractors Market by Crop Type, 2023 - 2029, USD Million
- TABLE 408 Brazil Autonomous Tractors Market by Component, 2019 - 2022, USD Million
- TABLE 409 Brazil Autonomous Tractors Market by Component, 2023 - 2029, USD Million
- TABLE 410 Brazil Autonomous Tractors Market by Farm Application, 2019 - 2022, USD Million
- TABLE 411 Brazil Autonomous Tractors Market by Farm Application, 2023 - 2029, USD Million
- TABLE 412 Brazil Autonomous Tractors Market by Power Output, 2019 - 2022, USD Million
- TABLE 413 Brazil Autonomous Tractors Market by Power Output, 2023 - 2029, USD Million
- TABLE 414 Argentina Autonomous Tractors Market, 2019 - 2022, USD Million
- TABLE 415 Argentina Autonomous Tractors Market, 2023 - 2029, USD Million
- TABLE 416 Argentina Autonomous Tractors Market by Crop Type, 2019 - 2022, USD Million
- TABLE 417 Argentina Autonomous Tractors Market by Crop Type, 2023 - 2029, USD Million
- TABLE 418 Argentina Autonomous Tractors Market by Component, 2019 - 2022, USD Million
- TABLE 419 Argentina Autonomous Tractors Market by Component, 2023 - 2029, USD Million
- TABLE 420 Argentina Autonomous Tractors Market by Farm Application, 2019 - 2022, USD Million
- TABLE 421 Argentina Autonomous Tractors Market by Farm Application, 2023 - 2029, USD Million
- TABLE 422 Argentina Autonomous Tractors Market by Power Output, 2019 - 2022, USD Million
- TABLE 423 Argentina Autonomous Tractors Market by Power Output, 2023 - 2029, USD Million
- TABLE 424 UAE Autonomous Tractors Market, 2019 - 2022, USD Million
- TABLE 425 UAE Autonomous Tractors Market, 2023 - 2029, USD Million
- TABLE 426 UAE Autonomous Tractors Market by Crop Type, 2019 - 2022, USD Million
- TABLE 427 UAE Autonomous Tractors Market by Crop Type, 2023 - 2029, USD Million
- TABLE 428 UAE Autonomous Tractors Market by Component, 2019 - 2022, USD Million
- TABLE 429 UAE Autonomous Tractors Market by Component, 2023 - 2029, USD Million
- TABLE 430 UAE Autonomous Tractors Market by Farm Application, 2019 - 2022, USD Million
- TABLE 431 UAE Autonomous Tractors Market by Farm Application, 2023 - 2029, USD Million
- TABLE 432 UAE Autonomous Tractors Market by Power Output, 2019 - 2022, USD Million
- TABLE 433 UAE Autonomous Tractors Market by Power Output, 2023 - 2029, USD Million
- TABLE 434 Saudi Arabia Autonomous Tractors Market, 2019 - 2022, USD Million
- TABLE 435 Saudi Arabia Autonomous Tractors Market, 2023 - 2029, USD Million
- TABLE 436 Saudi Arabia Autonomous Tractors Market by Crop Type, 2019 - 2022, USD Million
- TABLE 437 Saudi Arabia Autonomous Tractors Market by Crop Type, 2023 - 2029, USD Million
- TABLE 438 Saudi Arabia Autonomous Tractors Market by Component, 2019 - 2022, USD Million
- TABLE 439 Saudi Arabia Autonomous Tractors Market by Component, 2023 - 2029, USD Million
- TABLE 440 Saudi Arabia Autonomous Tractors Market by Farm Application, 2019 - 2022, USD Million
- TABLE 441 Saudi Arabia Autonomous Tractors Market by Farm Application, 2023 - 2029, USD Million
- TABLE 442 Saudi Arabia Autonomous Tractors Market by Power Output, 2019 - 2022, USD Million
- TABLE 443 Saudi Arabia Autonomous Tractors Market by Power Output, 2023 - 2029, USD Million
- TABLE 444 South Africa Autonomous Tractors Market, 2019 - 2022, USD Million
- TABLE 445 South Africa Autonomous Tractors Market, 2023 - 2029, USD Million
- TABLE 446 South Africa Autonomous Tractors Market by Crop Type, 2019 - 2022, USD Million
- TABLE 447 South Africa Autonomous Tractors Market by Crop Type, 2023 - 2029, USD Million
- TABLE 448 South Africa Autonomous Tractors Market by Component, 2019 - 2022, USD Million
- TABLE 449 South Africa Autonomous Tractors Market by Component, 2023 - 2029, USD Million
- TABLE 450 South Africa Autonomous Tractors Market by Farm Application, 2019 - 2022, USD Million
- TABLE 451 South Africa Autonomous Tractors Market by Farm Application, 2023 - 2029, USD Million
- TABLE 452 South Africa Autonomous Tractors Market by Power Output, 2019 - 2022, USD Million
- TABLE 453 South Africa Autonomous Tractors Market by Power Output, 2023 - 2029, USD Million
- TABLE 454 Nigeria Autonomous Tractors Market, 2019 - 2022, USD Million
- TABLE 455 Nigeria Autonomous Tractors Market, 2023 - 2029, USD Million
- TABLE 456 Nigeria Autonomous Tractors Market by Crop Type, 2019 - 2022, USD Million
- TABLE 457 Nigeria Autonomous Tractors Market by Crop Type, 2023 - 2029, USD Million
- TABLE 458 Nigeria Autonomous Tractors Market by Component, 2019 - 2022, USD Million
- TABLE 459 Nigeria Autonomous Tractors Market by Component, 2023 - 2029, USD Million
- TABLE 460 Nigeria Autonomous Tractors Market by Farm Application, 2019 - 2022, USD Million
- TABLE 461 Nigeria Autonomous Tractors Market by Farm Application, 2023 - 2029, USD Million
- TABLE 462 Nigeria Autonomous Tractors Market by Power Output, 2019 - 2022, USD Million
- TABLE 463 Nigeria Autonomous Tractors Market by Power Output, 2023 - 2029, USD Million
- TABLE 464 Rest of LAMEA Autonomous Tractors Market, 2019 - 2022, USD Million
- TABLE 465 Rest of LAMEA Autonomous Tractors Market, 2023 - 2029, USD Million
- TABLE 466 Rest of LAMEA Autonomous Tractors Market by Crop Type, 2019 - 2022, USD Million
- TABLE 467 Rest of LAMEA Autonomous Tractors Market by Crop Type, 2023 - 2029, USD Million
- TABLE 468 Rest of LAMEA Autonomous Tractors Market by Component, 2019 - 2022, USD Million
- TABLE 469 Rest of LAMEA Autonomous Tractors Market by Component, 2023 - 2029, USD Million
- TABLE 470 Rest of LAMEA Autonomous Tractors Market by Farm Application, 2019 - 2022, USD Million
- TABLE 471 Rest of LAMEA Autonomous Tractors Market by Farm Application, 2023 - 2029, USD Million
- TABLE 472 Rest of LAMEA Autonomous Tractors Market by Power Output, 2019 - 2022, USD Million
- TABLE 473 Rest of LAMEA Autonomous Tractors Market by Power Output, 2023 - 2029, USD Million
- TABLE 474 Key Information - KUBOTA Corporation
- TABLE 475 Key Information - CNH Industrial N.V.
- TABLE 476 Key Information - Deere & Company
- TABLE 477 Key Information - AGCO Corporation
- TABLE 478 key Information - Mahindra & Mahindra Limited
- TABLE 479 Key Information - Kinze Manufacturing, Inc.
- TABLE 480 Key Information - Alamo Group Inc.
- TABLE 481 Key Information - Yanmar Holdings Co., Ltd.
- TABLE 482 Key Information - Trimble, Inc.
- TABLE 483 Key Information - Autonomous Tractor Corporation
List of Figures
- FIG 1 Methodology for the research
- FIG 2 KBV Cardinal Matrix
- FIG 3 Key Leading Strategies: Percentage Distribution (2019-2023)
- FIG 4 Global Autonomous Tractors Market by Crop Type, 2019 - 2029, USD Million
- FIG 5 Global Autonomous Tractors Market share, by Component, 2022
- FIG 6 Global Autonomous Tractors Market share, by Component, 2029
- FIG 7 Global Autonomous Tractors Market by Component, 2019 - 2029, USD Million
- FIG 8 Global Autonomous Tractors Market share, by Farm Application, 2022
- FIG 9 Global Autonomous Tractors Market share, by Farm Application, 2029
- FIG 10 Global Autonomous Tractors Market by Farm Application, 2019 - 2029, USD Million
- FIG 11 Global Autonomous Tractors Market share, by Power Output, 2022
- FIG 12 Global Autonomous Tractors Market share, by Power Output, 2029
- FIG 13 Global Autonomous Tractors Market by Power Output, 2019 - 2029, USD Million
- FIG 14 Global Autonomous Tractors Market share, by Region, 2022
- FIG 15 Global Autonomous Tractors Market share, by Region, 2029
- FIG 16 Global Autonomous Tractors Market by Region, 2019 - 2029, USD Million
- FIG 17 Recent strategies and developments: KUBOTA Corporation
- FIG 18 Recent strategies and developments: CNH Industrial N.V.
- FIG 19 Recent strategies and developments: Deere & Company
- FIG 20 Recent strategies and developments: AGCO Corporation
The Global Autonomous Tractors Market size is expected to reach $4 billion by 2029, rising at a market growth of 20.0% CAGR during the forecast period.
Autonomous tractors are a form of agricultural machinery that can operate without the presence of a driver. Autonomous tractors' technology, such as vision systems, GPS systems, and sensors, allows them to function continuously without constant human input. Therefore, efficiency improvement and reduced human intervention are the main goals in developing autonomous tractors.
Growing demand for agricultural yields results from the market for autonomous tractors. Moreover, managing the effectiveness of activities like tillage, seed sowing, harvesting, and fertilizing is important because cultivable land is limited, and the farm's output depends on outside environmental conditions. The accuracy of many farming procedures is greatly improved by using autonomous tractors, which also increases farm output.
Tractors are very versatile and can be connected to various things, making them difficult to control and vulnerable to human mistakes. To reduce these errors, autonomous tractors are used. Furthermore, with the help of autonomous tractors, farmers can effectively manage several farming operations at once and maximize the use of their labor. In addition, employing self-driving tractors for tasks like seeding and tillage greatly improves irrigation water efficiency.
Due to the increased cost of farm labor, agricultural labor is declining. To replace manual labor and provide more affordable, accessible, and effective agricultural operations, farmers are increasingly turning to agricultural mechanization. Driving agricultural equipment is primarily accomplished by tractors. On a long-term basis, this has been seen to support market expansion.
COVID-19 Impact Analysis
As the COVID-19 vaccine enters the market, it is also anticipated that the number of cases of COVID-19 will decline in the near future. The result has been the full-scale reopening of businesses that manufacture autonomous tractors. Autonomous tractor manufacturers must concentrate on securing their personnel, business operations, and supply networks as COVID-19 infection cases diminish. This will allow them to deal with immediate crises and implement new operational procedures. Thus, the autonomous tractors market witnessed a positive impact of the COVID-19 outspread.
Market Growth Factors
Rising government initiatives in order to support the farmers
The government spends a lot of money on various subsidies. It is difficult for farmers to buy this equipment with restricted finance sources since farm equipment like combines, tractors, and harvesters, is expensive. The governments of several countries also supply agricultural equipment, where help is given for farm mechanization and women-friendly tools and equipment. Intending to encourage farmers to embrace autonomous equipment and boost crop productivity, numerous governments have expanded their support through better subsidies and credits. This is estimated to support the growth of the autonomous tractors market.
Dearth of farm labor and reduced arable land
Considering the current challenges, farmers are adopting technology like autonomous tractors, which can be productive because technologically aided agriculture requires qualified manpower, of which there is an urgent scarcity. Therefore, this circumstance is one of the main things that propel the market forward. The number of agricultural laborers in India is anticipated to fall dramatically in the next years, according to the Indian Council of Food and Agriculture (ICFA). Farmers are embracing innovations like autonomous tractors that can be productive in light of the current difficulty, as agriculture needs trained personnel, but there is a severe scarcity of availability. As a result, the market is projected to expand in the years to come.
Market Restraining Factors
Lack of advanced tools to collect the data points
The issue of using these new technologies to collect data from crops is to produce something cohesive and meaningful, as data by themselves are pointless. It's possible that autonomous tractors won't be as flexible as a human operator to adjust to shifting conditions or unforeseen impediments. In addition, collecting and examining such data need a lot of time and effort. Because of these constraints, the adoption of autonomous technology, like autonomous tractors, may be slowed down, ultimately impeding the expansion of the autonomous tractors market during the projection period.
Power Outlook
On the basis of power, the autonomous tractors market is segmented into up to 30 HP, 31-100 HP, and 101 HP & above. In 2022, the 31-100 HP segment covered a considerable revenue share in the autonomous tractors market. This segment's expansion is mostly driven by the strong demand for 31-100 HP tractors to carry out various farming tasks like planting, harvesting, sowing, and tilling. These tractors are perfect for transporting because of their durability and loading capacity. Additionally, tractors in the 31-100 HP range are adaptable and offer excellent work efficiency in clay soil.
Component Outlook
By component, the autonomous tractors market is fragmented into LiDAR, radar, GPS, camera/ vision systems, ultrasonic sensors, and hand-held devices. The GPS segment acquired a substantial revenue share in the autonomous tractors market in 2022. Due to the precision of GPS, farmers are able to produce farm maps that properly represent the size of field areas, the position of roads, and the distances between locations of interest. With the use of all this crucial information, farmers may adjust their farming practices to increase productivity. The popularity of GPS-enabled gadgets is anticipated to rise as a result of these advantages, consequently fostering the segment's expansion.
Crop Type Outlook
Based on crop type, the autonomous tractors market is bifurcated into cereals & grains, oilseeds & pulses, and fruit & vegetables. In 2022, the fruit & vegetables segment dominated the autonomous tractors market with the maximum revenue share. Due to the growing demand for fruits & vegetables brought on by the increase in world population, this segment holds a sizable market share. Fruits & vegetables must be weeded and harvested by hand. As a result, there is a rise in the need for cutting-edge technologies, like autonomous tractors, to perform labour-intensive farming.
Farm Application Outlook
On the basis of farm application, the autonomous tractors market is classified into tillage (primary & secondary tillage), seed sowing., harvesting, and others. In 2022, the tillage segment registered the highest revenue share in the autonomous tractors market. Technology developments and numerous agronomic research and development initiatives are also credited with this segment's expansion. Additionally, there is a growing demand for automation of tillage on large and medium-sized farms worldwide that grow row crops because manual tillage tasks are more costly and time-consuming.
Regional Outlook
Region wise, the autonomous tractors market is analysed across North America, Europe, Asia Pacific and LAMEA. In 2022, the North America region led the autonomous tractors market by generating the highest revenue share. Large farm sizes in North America contribute to the rapid adoption of advanced technologies, which is responsible for the region's growth. Labor shortages are a problem for farmers in affluent nations like the U.S. Therefore, to overcome these difficulties, farmers adopt cutting-edge farming machinery, like autonomous tractors, fueling the market's expansion.
The major strategies followed by the market participants are Partnerships. Based on the Analysis presented in the Cardinal matrix; Deere & Company are the forerunners in the Autonomous Tractors Market. Companies such as CNH Industrial N.V., KUBOTA Corporation and AGCO Corporation are some of the key innovators in the Autonomous Tractors Market.
The market research report covers the analysis of key stake holders of the market. Key companies profiled in the report include KUBOTA Corporation, CNH Industrial N.V., Deere & Company, AGCO Corporation, Mahindra & Mahindra Limited (Mahindra Group), Kinze Manufacturing, Inc., Alamo Group Inc. (Dutch Power B.V.), Yanmar Holdings Co., Ltd., Trimble, Inc. and Autonomous Tractor Corporation.
Recent Strategies Deployed in Autonomous Tractors Market
Partnerships, Collaborations and Agreements:
Mar-2023: Mahindra & Mahindra partnered with the State Bank of India, an Indian multinational public sector bank, to offer easy loan options for tractors and farm machinery products all over India. With this partnership, SBI would finance Mahindra's broad range of tractors and farm machinery enabling customers to easily get financing options for various tractors and farm machinery while visiting the Mahindra Tractor dealership.
Jun-2022: AGCO expanded its partnership with Apex.AI., an autonomous software developer. Through this partnership, Apex.OS, an elemental software framework and development kit facilitating the development of powerful autonomous capabilities, would strengthen AGCO to apply safety-critical applications from autonomous driving that can be deployed all over the line of solutions worldwide.
Nov-2021: CNH Industrial signed a licensing agreement with Monarch Tractor, an American-based AgTech company that specializes in fully electric autonomous tractors. With this agreement, both companies would combine their respective expertise to develop a modular electrification platform aiming at low horsepower tractors, empowering CNH Industrial to amplify its internal electrification capabilities and generate innovative electrified platforms faster.
Product Launches and Product Expansions:
Jan-2023: Deere announced the launch of ExactShot™ and an Electric Excavator, the latest technologies facilitating Deere's customers to become more productive. ExactShot technology utilizes sensors and robotics to locate starter fertilizer sharply onto seeds when put in the soil enabling farmers to mitigate the amount of starter fertilizer required during planting, Whereas, Electric Excavator would deliver construction workforce and road builders the less operating costs, powerful machine reliability, and enhanced performance.
Dec-2022: CNH Industrial made enhancements in adding capabilities to its equipment and a full-electric tractor. The new autonomous potential would facilitate enhancing farmer productivity. The improved solutions would be Driverless Tillage, Driver Assist Harvest, and Baler Automation. Driver Assist Harvest solution combines Raven Autonomy with Case IH's harvest technology, allowing the system to chart the way and speed of the tractor easing out to pull the grain cart beside a combine harvester, while Driverless tillage enables remote operation from outside of an operator cab utilizing an advanced Perception System and Remote Command & Control capability from Raven, whereas Baler Automation uses a lidar sensor.
Jan-2022: Deere released a fully autonomous tractor beneficial in wide-ranging production. The machine consolidates Deere's 8R tractor, TruSet-enabled chisel plow, GPS guidance system, and powerful technologies. The autonomous tractor would possess six pairs of stereo cameras capable of detecting barriers all around 360 degrees and easily calculating distance. Moreover, the machine would examine its position with respect to a geofence, easing out the operations.
Aug-2021: Kinze made enhancements in adding capabilities to its True Speed Planter portfolio. Kinze's 4905 True Speed planter was introduced in 16 and 24-row models, empowering corn and soybean farmers with the capabilities in seed placement at higher speeds. The fast-paced technology would allow farmers to precisely double-fold the acres planted. The expansion of the True Speed portfolio incorporates 4905 12R30 configuration for minor operations, 31/32R15 split-row and 16R30 configurations of the Kinze 3665-a 15-inch soybean planter for high-residue circumstances, 24R30 and 36R20 configurations of the 4705 elevated-flotation planter for limited width crops.
Feb-2021: Yanmar made enhancements in adding capabilities to its autonomous tractor series. The upgraded robot/auto tractors would use a multi-frequency antenna for balanced connection and precise positioning providing a safe and enhanced performing autonomous tractor.
Acquisitions and Mergers:
Mar-2023: CNH Industrial acquired Augmenta, a machine vision enterprise, to drive the growth of innovative Sense & Act technology. With this acquisition, Augmenta's technology would accelerate the enhancement of Sense & Act capabilities, helpful in providing customers with the machine selective potential beneficial in directing and controlling the spray volume.
Mar-2023: Mahindra & Mahindra Limited completed the acquisition of MITRA Agro Equipment's Private Limited, a spraying machine developer. With this acquisition, leveraging the power of MITRA in providing advanced spraying machines would enable Mahindra to strengthen its farm machinery business beneficial in well positioning Mahindra & Mahindra in the horticulture market.
May-2022: AGCO took over JCA Industries, developer of autonomous software for agricultural machines, implement controls and electronic system components. With this acquisition, JCA's autonomous machine technologies would empower AGCO's supplying capabilities of machine automation and autonomous systems enhancing farmer productivity.
Oct-2021: Kubota signed an acquisition agreement with AgJunction, an advanced guidance, and autosteering solutions provider for precision agriculture applications. Through this agreement, Kubota would acquire AgJunction, enabling Kubota to leverage the powers of AgJunction's technologies helpful in achieving Kubota's aim of developing a framework for technologies related to automation and autonomy, connectivity.
Aug-2021: Deere & Company took over Bear Flag Robotics, an agriculture technology startup, to advance autonomous technology on the Farm. With this acquisition, Bear Flag's technology would be combined with Deere's technology targets facilitating farmers acquiring enhanced outcomes through advanced technology, including autonomy.
Scope of the Study
Market Segments covered in the Report:
By Crop Type
- Fruits & Vegetables
- Oilseeds & Pulses
- Cereals & Grains
By Component
- Radar
- GPS
- Camera/Vision Systems
- Ultrasonic Sensors
- LiDAR
- Hand-held Devices
By Farm Application
- Tillage
- Harvesting
- Seed Sowing
- Others
By Power Output
- 101 HP & Above
- 31 - 100 HP
- Below 30 HP
By Geography
- North America
- US
- Canada
- Mexico
- Rest of North America
- Europe
- Germany
- UK
- France
- Russia
- Spain
- Italy
- Rest of Europe
- Asia Pacific
- China
- Japan
- India
- South Korea
- Australia
- Malaysia
- Rest of Asia Pacific
- LAMEA
- Brazil
- Argentina
- UAE
- Saudi Arabia
- South Africa
- Nigeria
- Rest of LAMEA
Companies Profiled
- KUBOTA Corporation
- CNH Industrial N.V.
- Deere & Company
- AGCO Corporation
- Mahindra & Mahindra Limited (Mahindra Group)
- Kinze Manufacturing, Inc.
- Alamo Group Inc. (Dutch Power B.V.)
- Yanmar Holdings Co., Ltd.
- Trimble, Inc.
- Autonomous Tractor Corporation
Unique Offerings from KBV Research
- Exhaustive coverage
- Highest number of market tables and figures
- Subscription based model available
- Guaranteed best price
- Assured post sales research support with 10% customization free
Table of Contents
Chapter 1. Market Scope & Methodology
- 1.1 Market Definition
- 1.2 Objectives
- 1.3 Market Scope
- 1.4 Segmentation
- 1.4.1 Global Autonomous Tractors Market, by Crop Type
- 1.4.2 Global Autonomous Tractors Market, by Component
- 1.4.3 Global Autonomous Tractors Market, by Farm Application
- 1.4.4 Global Autonomous Tractors Market, by Power Output
- 1.4.5 Global Autonomous Tractors Market, by Geography
- 1.5 Methodology for the research
Chapter 2. Market Overview
- 2.1 Introduction
- 2.1.1 Overview
- 2.1.1.1 Market Composition & Scenario
- 2.1.1 Overview
- 2.2 Key Factors Impacting the Market
- 2.2.1 Market Drivers
- 2.2.2 Market Restraints
Chapter 3. Competition Analysis - Global
- 3.1 KBV Cardinal Matrix
- 3.2 Recent Industry Wide Strategic Developments
- 3.2.1 Partnerships, Collaborations and Agreements
- 3.2.2 Product Launches and Product Expansions
- 3.2.3 Acquisition and Mergers
- 3.3 Top Winning Strategies
- 3.3.1 Key Leading Strategies: Percentage Distribution (2019-2023)
Chapter 4. Global Autonomous Tractors Market by Crop Type
- 4.1 Global Fruits & Vegetables Market by Region
- 4.2 Global Oilseeds & Pulses Market by Region
- 4.3 Global Cereals & Grains Market by Region
Chapter 5. Global Autonomous Tractors Market by Component
- 5.1 Global Radar Market by Region
- 5.2 Global GPS Market by Region
- 5.3 Global Camera/Vision Systems Market by Region
- 5.4 Global Ultrasonic Sensors Market by Region
- 5.5 Global LiDAR Market by Region
- 5.6 Global Hand-held Devices Market by Region
Chapter 6. Global Autonomous Tractors Market by Farm Application
- 6.1 Global Tillage Market by Region
- 6.2 Global Harvesting Market by Region
- 6.3 Global Seed Sowing Market by Region
- 6.4 Global Others Market by Region
Chapter 7. Global Autonomous Tractors Market by Power Output
- 7.1 Global 101 HP & Above Market by Region
- 7.2 Global 31 - 100 HP Market by Region
- 7.3 Global Below 30 HP Market by Region
Chapter 8. Global Autonomous Tractors Market by Region
- 8.1 North America Autonomous Tractors Market
- 8.1.1 North America Autonomous Tractors Market by Crop Type
- 8.1.1.1 North America Fruits & Vegetables Market by Country
- 8.1.1.2 North America Oilseeds & Pulses Market by Country
- 8.1.1.3 North America Cereals & Grains Market by Country
- 8.1.2 North America Autonomous Tractors Market by Component
- 8.1.2.1 North America Radar Market by Country
- 8.1.2.2 North America GPS Market by Country
- 8.1.2.3 North America Camera/Vision Systems Market by Country
- 8.1.2.4 North America Ultrasonic Sensors Market by Country
- 8.1.2.5 North America LiDAR Market by Country
- 8.1.2.6 North America Hand-held Devices Market by Country
- 8.1.3 North America Autonomous Tractors Market by Farm Application
- 8.1.3.1 North America Tillage Market by Country
- 8.1.3.2 North America Harvesting Market by Country
- 8.1.3.3 North America Seed Sowing Market by Country
- 8.1.3.4 North America Others Market by Country
- 8.1.4 North America Autonomous Tractors Market by Power Output
- 8.1.4.1 North America 101 HP & Above Market by Country
- 8.1.4.2 North America 31 - 100 HP Market by Country
- 8.1.4.3 North America Below 30 HP Market by Country
- 8.1.5 North America Autonomous Tractors Market by Country
- 8.1.5.1 US Autonomous Tractors Market
- 8.1.5.1.1 US Autonomous Tractors Market by Crop Type
- 8.1.5.1.2 US Autonomous Tractors Market by Component
- 8.1.5.1.3 US Autonomous Tractors Market by Farm Application
- 8.1.5.1.4 US Autonomous Tractors Market by Power Output
- 8.1.5.2 Canada Autonomous Tractors Market
- 8.1.5.2.1 Canada Autonomous Tractors Market by Crop Type
- 8.1.5.2.2 Canada Autonomous Tractors Market by Component
- 8.1.5.2.3 Canada Autonomous Tractors Market by Farm Application
- 8.1.5.2.4 Canada Autonomous Tractors Market by Power Output
- 8.1.5.3 Mexico Autonomous Tractors Market
- 8.1.5.3.1 Mexico Autonomous Tractors Market by Crop Type
- 8.1.5.3.2 Mexico Autonomous Tractors Market by Component
- 8.1.5.3.3 Mexico Autonomous Tractors Market by Farm Application
- 8.1.5.3.4 Mexico Autonomous Tractors Market by Power Output
- 8.1.5.4 Rest of North America Autonomous Tractors Market
- 8.1.5.4.1 Rest of North America Autonomous Tractors Market by Crop Type
- 8.1.5.4.2 Rest of North America Autonomous Tractors Market by Component
- 8.1.5.4.3 Rest of North America Autonomous Tractors Market by Farm Application
- 8.1.5.4.4 Rest of North America Autonomous Tractors Market by Power Output
- 8.1.5.1 US Autonomous Tractors Market
- 8.1.1 North America Autonomous Tractors Market by Crop Type
- 8.2 Europe Autonomous Tractors Market
- 8.2.1 Europe Autonomous Tractors Market by Crop Type
- 8.2.1.1 Europe Fruits & Vegetables Market by Country
- 8.2.1.2 Europe Oilseeds & Pulses Market by Country
- 8.2.1.3 Europe Cereals & Grains Market by Country
- 8.2.2 Europe Autonomous Tractors Market by Component
- 8.2.2.1 Europe Radar Market by Country
- 8.2.2.2 Europe GPS Market by Country
- 8.2.2.3 Europe Camera/Vision Systems Market by Country
- 8.2.2.4 Europe Ultrasonic Sensors Market by Country
- 8.2.2.5 Europe LiDAR Market by Country
- 8.2.2.6 Europe Hand-held Devices Market by Country
- 8.2.3 Europe Autonomous Tractors Market by Farm Application
- 8.2.3.1 Europe Tillage Market by Country
- 8.2.3.2 Europe Harvesting Market by Country
- 8.2.3.3 Europe Seed Sowing Market by Country
- 8.2.3.4 Europe Others Market by Country
- 8.2.4 Europe Autonomous Tractors Market by Power Output
- 8.2.4.1 Europe 101 HP & Above Market by Country
- 8.2.4.2 Europe 31 - 100 HP Market by Country
- 8.2.4.3 Europe Below 30 HP Market by Country
- 8.2.5 Europe Autonomous Tractors Market by Country
- 8.2.5.1 Germany Autonomous Tractors Market
- 8.2.5.1.1 Germany Autonomous Tractors Market by Crop Type
- 8.2.5.1.2 Germany Autonomous Tractors Market by Component
- 8.2.5.1.3 Germany Autonomous Tractors Market by Farm Application
- 8.2.5.1.4 Germany Autonomous Tractors Market by Power Output
- 8.2.5.2 UK Autonomous Tractors Market
- 8.2.5.2.1 UK Autonomous Tractors Market by Crop Type
- 8.2.5.2.2 UK Autonomous Tractors Market by Component
- 8.2.5.2.3 UK Autonomous Tractors Market by Farm Application
- 8.2.5.2.4 UK Autonomous Tractors Market by Power Output
- 8.2.5.3 France Autonomous Tractors Market
- 8.2.5.3.1 France Autonomous Tractors Market by Crop Type
- 8.2.5.3.2 France Autonomous Tractors Market by Component
- 8.2.5.3.3 France Autonomous Tractors Market by Farm Application
- 8.2.5.3.4 France Autonomous Tractors Market by Power Output
- 8.2.5.4 Russia Autonomous Tractors Market
- 8.2.5.4.1 Russia Autonomous Tractors Market by Crop Type
- 8.2.5.4.2 Russia Autonomous Tractors Market by Component
- 8.2.5.4.3 Russia Autonomous Tractors Market by Farm Application
- 8.2.5.4.4 Russia Autonomous Tractors Market by Power Output
- 8.2.5.5 Spain Autonomous Tractors Market
- 8.2.5.5.1 Spain Autonomous Tractors Market by Crop Type
- 8.2.5.5.2 Spain Autonomous Tractors Market by Component
- 8.2.5.5.3 Spain Autonomous Tractors Market by Farm Application
- 8.2.5.5.4 Spain Autonomous Tractors Market by Power Output
- 8.2.5.6 Italy Autonomous Tractors Market
- 8.2.5.6.1 Italy Autonomous Tractors Market by Crop Type
- 8.2.5.6.2 Italy Autonomous Tractors Market by Component
- 8.2.5.6.3 Italy Autonomous Tractors Market by Farm Application
- 8.2.5.6.4 Italy Autonomous Tractors Market by Power Output
- 8.2.5.7 Rest of Europe Autonomous Tractors Market
- 8.2.5.7.1 Rest of Europe Autonomous Tractors Market by Crop Type
- 8.2.5.7.2 Rest of Europe Autonomous Tractors Market by Component
- 8.2.5.7.3 Rest of Europe Autonomous Tractors Market by Farm Application
- 8.2.5.7.4 Rest of Europe Autonomous Tractors Market by Power Output
- 8.2.5.1 Germany Autonomous Tractors Market
- 8.2.1 Europe Autonomous Tractors Market by Crop Type
- 8.3 Asia Pacific Autonomous Tractors Market
- 8.3.1 Asia Pacific Autonomous Tractors Market by Crop Type
- 8.3.1.1 Asia Pacific Fruits & Vegetables Market by Country
- 8.3.1.2 Asia Pacific Oilseeds & Pulses Market by Country
- 8.3.1.3 Asia Pacific Cereals & Grains Market by Country
- 8.3.2 Asia Pacific Autonomous Tractors Market by Component
- 8.3.2.1 Asia Pacific Radar Market by Country
- 8.3.2.2 Asia Pacific GPS Market by Country
- 8.3.2.3 Asia Pacific Camera/Vision Systems Market by Country
- 8.3.2.4 Asia Pacific Ultrasonic Sensors Market by Country
- 8.3.2.5 Asia Pacific LiDAR Market by Country
- 8.3.2.6 Asia Pacific Hand-held Devices Market by Country
- 8.3.3 Asia Pacific Autonomous Tractors Market by Farm Application
- 8.3.3.1 Asia Pacific Tillage Market by Country
- 8.3.3.2 Asia Pacific Harvesting Market by Country
- 8.3.3.3 Asia Pacific Seed Sowing Market by Country
- 8.3.3.4 Asia Pacific Others Market by Country
- 8.3.4 Asia Pacific Autonomous Tractors Market by Power Output
- 8.3.4.1 Asia Pacific 101 HP & Above Market by Country
- 8.3.4.2 Asia Pacific 31 - 100 HP Market by Country
- 8.3.4.3 Asia Pacific Below 30 HP Market by Country
- 8.3.5 Asia Pacific Autonomous Tractors Market by Country
- 8.3.5.1 China Autonomous Tractors Market
- 8.3.5.1.1 China Autonomous Tractors Market by Crop Type
- 8.3.5.1.2 China Autonomous Tractors Market by Component
- 8.3.5.1.3 China Autonomous Tractors Market by Farm Application
- 8.3.5.1.4 China Autonomous Tractors Market by Power Output
- 8.3.5.2 Japan Autonomous Tractors Market
- 8.3.5.2.1 Japan Autonomous Tractors Market by Crop Type
- 8.3.5.2.2 Japan Autonomous Tractors Market by Component
- 8.3.5.2.3 Japan Autonomous Tractors Market by Farm Application
- 8.3.5.2.4 Japan Autonomous Tractors Market by Power Output
- 8.3.5.3 India Autonomous Tractors Market
- 8.3.5.3.1 India Autonomous Tractors Market by Crop Type
- 8.3.5.3.2 India Autonomous Tractors Market by Component
- 8.3.5.3.3 India Autonomous Tractors Market by Farm Application
- 8.3.5.3.4 India Autonomous Tractors Market by Power Output
- 8.3.5.4 South Korea Autonomous Tractors Market
- 8.3.5.4.1 South Korea Autonomous Tractors Market by Crop Type
- 8.3.5.4.2 South Korea Autonomous Tractors Market by Component
- 8.3.5.4.3 South Korea Autonomous Tractors Market by Farm Application
- 8.3.5.4.4 South Korea Autonomous Tractors Market by Power Output
- 8.3.5.5 Australia Autonomous Tractors Market
- 8.3.5.5.1 Australia Autonomous Tractors Market by Crop Type
- 8.3.5.5.2 Australia Autonomous Tractors Market by Component
- 8.3.5.5.3 Australia Autonomous Tractors Market by Farm Application
- 8.3.5.5.4 Australia Autonomous Tractors Market by Power Output
- 8.3.5.6 Malaysia Autonomous Tractors Market
- 8.3.5.6.1 Malaysia Autonomous Tractors Market by Crop Type
- 8.3.5.6.2 Malaysia Autonomous Tractors Market by Component
- 8.3.5.6.3 Malaysia Autonomous Tractors Market by Farm Application
- 8.3.5.6.4 Malaysia Autonomous Tractors Market by Power Output
- 8.3.5.7 Rest of Asia Pacific Autonomous Tractors Market
- 8.3.5.7.1 Rest of Asia Pacific Autonomous Tractors Market by Crop Type
- 8.3.5.7.2 Rest of Asia Pacific Autonomous Tractors Market by Component
- 8.3.5.7.3 Rest of Asia Pacific Autonomous Tractors Market by Farm Application
- 8.3.5.7.4 Rest of Asia Pacific Autonomous Tractors Market by Power Output
- 8.3.5.1 China Autonomous Tractors Market
- 8.3.1 Asia Pacific Autonomous Tractors Market by Crop Type
- 8.4 LAMEA Autonomous Tractors Market
- 8.4.1 LAMEA Autonomous Tractors Market by Crop Type
- 8.4.1.1 LAMEA Fruits & Vegetables Market by Country
- 8.4.1.2 LAMEA Oilseeds & Pulses Market by Country
- 8.4.1.3 LAMEA Cereals & Grains Market by Country
- 8.4.2 LAMEA Autonomous Tractors Market by Component
- 8.4.2.1 LAMEA Radar Market by Country
- 8.4.2.2 LAMEA GPS Market by Country
- 8.4.2.3 LAMEA Camera/Vision Systems Market by Country
- 8.4.2.4 LAMEA Ultrasonic Sensors Market by Country
- 8.4.2.5 LAMEA LiDAR Market by Country
- 8.4.2.6 LAMEA Hand-held Devices Market by Country
- 8.4.3 LAMEA Autonomous Tractors Market by Farm Application
- 8.4.3.1 LAMEA Tillage Market by Country
- 8.4.3.2 LAMEA Harvesting Market by Country
- 8.4.3.3 LAMEA Seed Sowing Market by Country
- 8.4.3.4 LAMEA Others Market by Country
- 8.4.4 LAMEA Autonomous Tractors Market by Power Output
- 8.4.4.1 LAMEA 101 HP & Above Market by Country
- 8.4.4.2 LAMEA 31 - 100 HP Market by Country
- 8.4.4.3 LAMEA Below 30 HP Market by Country
- 8.4.5 LAMEA Autonomous Tractors Market by Country
- 8.4.5.1 Brazil Autonomous Tractors Market
- 8.4.5.1.1 Brazil Autonomous Tractors Market by Crop Type
- 8.4.5.1.2 Brazil Autonomous Tractors Market by Component
- 8.4.5.1.3 Brazil Autonomous Tractors Market by Farm Application
- 8.4.5.1.4 Brazil Autonomous Tractors Market by Power Output
- 8.4.5.2 Argentina Autonomous Tractors Market
- 8.4.5.2.1 Argentina Autonomous Tractors Market by Crop Type
- 8.4.5.2.2 Argentina Autonomous Tractors Market by Component
- 8.4.5.2.3 Argentina Autonomous Tractors Market by Farm Application
- 8.4.5.2.4 Argentina Autonomous Tractors Market by Power Output
- 8.4.5.3 UAE Autonomous Tractors Market
- 8.4.5.3.1 UAE Autonomous Tractors Market by Crop Type
- 8.4.5.3.2 UAE Autonomous Tractors Market by Component
- 8.4.5.3.3 UAE Autonomous Tractors Market by Farm Application
- 8.4.5.3.4 UAE Autonomous Tractors Market by Power Output
- 8.4.5.4 Saudi Arabia Autonomous Tractors Market
- 8.4.5.4.1 Saudi Arabia Autonomous Tractors Market by Crop Type
- 8.4.5.4.2 Saudi Arabia Autonomous Tractors Market by Component
- 8.4.5.4.3 Saudi Arabia Autonomous Tractors Market by Farm Application
- 8.4.5.4.4 Saudi Arabia Autonomous Tractors Market by Power Output
- 8.4.5.5 South Africa Autonomous Tractors Market
- 8.4.5.5.1 South Africa Autonomous Tractors Market by Crop Type
- 8.4.5.5.2 South Africa Autonomous Tractors Market by Component
- 8.4.5.5.3 South Africa Autonomous Tractors Market by Farm Application
- 8.4.5.5.4 South Africa Autonomous Tractors Market by Power Output
- 8.4.5.6 Nigeria Autonomous Tractors Market
- 8.4.5.6.1 Nigeria Autonomous Tractors Market by Crop Type
- 8.4.5.6.2 Nigeria Autonomous Tractors Market by Component
- 8.4.5.6.3 Nigeria Autonomous Tractors Market by Farm Application
- 8.4.5.6.4 Nigeria Autonomous Tractors Market by Power Output
- 8.4.5.7 Rest of LAMEA Autonomous Tractors Market
- 8.4.5.7.1 Rest of LAMEA Autonomous Tractors Market by Crop Type
- 8.4.5.7.2 Rest of LAMEA Autonomous Tractors Market by Component
- 8.4.5.7.3 Rest of LAMEA Autonomous Tractors Market by Farm Application
- 8.4.5.7.4 Rest of LAMEA Autonomous Tractors Market by Power Output
- 8.4.5.1 Brazil Autonomous Tractors Market
- 8.4.1 LAMEA Autonomous Tractors Market by Crop Type
Chapter 9. Company Profiles
- 9.1 KUBOTA Corporation
- 9.1.1 Company Overview
- 9.1.2 Financial Analysis
- 9.1.3 Segmental and Regional Analysis
- 9.1.4 Research & Development Expenses
- 9.1.5 Recent strategies and developments:
- 9.1.5.1 Partnerships, Collaborations, and Agreements:
- 9.1.5.2 Product Launches and Product Expansions:
- 9.1.5.3 Acquisition and Mergers:
- 9.2 CNH Industrial N.V
- 9.2.1 Company Overview
- 9.2.2 Financial Analysis
- 9.2.3 Regional & Segmental Analysis
- 9.2.4 Research & Development Expenses
- 9.2.5 Recent strategies and developments:
- 9.2.5.1 Partnerships, Collaborations, and Agreements:
- 9.2.5.2 Product Launches and Product Expansions:
- 9.2.5.3 Acquisition and Mergers:
- 9.3 Deere & Company
- 9.3.1 Company Overview
- 9.3.2 Financial Analysis
- 9.3.3 Segmental and Regional Analysis
- 9.3.4 Research & Development Expenses
- 9.3.5 Recent strategies and developments:
- 9.3.5.1 Product Launches and Product Expansions:
- 9.3.5.2 Acquisition and Mergers:
- 9.4 AGCO Corporation
- 9.4.1 Company Overview
- 9.4.2 Financial Analysis
- 9.4.3 Regional Analysis
- 9.4.4 Research & Development Expenses
- 9.4.5 Recent strategies and developments:
- 9.4.5.1 Partnerships, Collaborations, and Agreements:
- 9.4.5.2 Acquisition and Mergers:
- 9.5 Mahindra & Mahindra Limited (Mahindra Group)
- 9.5.1 Company Overview
- 9.5.2 Financial Analysis
- 9.5.3 Segmental and Regional Analysis
- 9.5.4 Research & Development Expense
- 9.5.5 Recent strategies and developments:
- 9.5.5.1 Partnerships, Collaborations, and Agreements:
- 9.5.5.2 Acquisition and Mergers:
- 9.6 Kinze Manufacturing, Inc.
- 9.6.1 Company Overview
- 9.6.2 Recent strategies and developments:
- 9.6.2.1 Product Launches and Product Expansions:
- 9.7 Alamo Group Inc. (Dutch Power B.V.)
- 9.7.1 Company Overview
- 9.7.2 Financial Analysis
- 9.7.3 Segmental and Regional Analysis
- 9.7.4 Research & Development Expenses
- 9.8 Yanmar Holdings Co., Ltd.
- 9.8.1 Company Overview
- 9.8.2 Financial Analysis
- 9.8.3 Recent strategies and developments:
- 9.8.3.1 Product Launches and Product Expansions:
- 9.9 Trimble, Inc.
- 9.9.1 Company Overview
- 9.9.2 Financial Analysis
- 9.9.3 Segmental and Regional Analysis
- 9.9.4 Research & Development Expenses
- 9.10. Autonomous Tractor Corporation
- 9.10.1 Company Overview