|
|
市場調査レポート
商品コード
1276612
ユーティリティマーカーの世界市場規模、シェア、産業動向分析レポート:構成別(パッシブ、プログラマブル)、ユーティリティタイプ別、タイプ別(ボールマーカー、ディスクマーカー、テープマーカー)、地域別展望と予測、2023~2029年Global Utility Markers Market Size, Share & Industry Trends Analysis Report By Configuration (Passive and Programmable), By Utility Type, By Type (Ball Markers, Disk Markers, Tape Markers), By Regional Outlook and Forecast, 2023 - 2029 |
||||||
|
|
|||||||


| ユーティリティマーカーの世界市場規模、シェア、産業動向分析レポート:構成別(パッシブ、プログラマブル)、ユーティリティタイプ別、タイプ別(ボールマーカー、ディスクマーカー、テープマーカー)、地域別展望と予測、2023~2029年 |
|
出版日: 2023年04月28日
発行: KBV Research
ページ情報: 英文 196 Pages
納期: 即納可能
|
- 全表示
- 概要
- 図表
- 目次
ユーティリティマーカー市場規模は、2029年までに4億7,580万米ドルに達すると予測され、予測期間中にCAGR6.5%で上昇すると予想されています。
また、建設や掘削の前に地下埋設物の位置を確認することを義務付ける政府の厳しい法律や規制が、ユーティリティマーカー市場の世界の拡大を大きく後押ししています。このような「インパクトのある」マークは、掘削作業者に短期的な目印を与える一方で、インパクトの少ないソリューションでは、ユーティリティマーカーの設置場所を人目に触れないようにし、実用上大きな利点をもたらします。埋設されたユーティリティやその他の資産の位置は、通常の標識ではアクセスできないことがよくあります。
ユーティリティマーカーは、掘削業者が作業を続行する前にマーキングの完全なセットを要求することを知らせ、または地下資産を明確に指定し、各作業の前に適切なマーキングが行われることを保証します。柔軟なプラスチック製ユーティリティマーカーは、人目を引く注意や位置のマーキングが背景に溶け込み、近隣からの苦情を防ぐとともに、現在使用されているスプレー塗料やその他の一時的な方法に代わる長持ちする方法として、両者の長所を兼ね備えています。
COVID-19の影響分析
パンデミックにより、高速鉄道などの国際的なプロジェクトも影響を受けた。COVID-19による封鎖のため、ユーティリティマーキング業界ではいくつかの製品の製造が停止しています。その結果、ロックダウンの間の市場の拡大は限定的なものとなりました。コロナウイルスの発生以前は、製造大国からの需要が大幅に増加していましたが、その後、そのニーズは減少しています。しかし、パンデミック発生後、ユーティリティマーカーの需要は以前の水準に戻り、市場が当初の落ち込みから回復することが期待されます。
市場の成長要因
政府の規則とリアルタイムでのユーティリティ位置特定・マーキングの需要
高度な技術により、地下埋設物の所有者は、それらの施設をリアルタイムで分析することができます。フリートテレメトリーシステム、GISデータ装置、GPS装置、複数のGPRアンテナで構成されたGPR装置(「GPRアレイ」と呼ばれる)などが、ユーティリティロケーション・マーキング装置やサービスプロバイダーによって使用され始めています。これらの装置は、複数のGPRプロファイルを収集することで、より迅速に地域を調査し、ユーティリティ・ロケーティング・サービスを提供することができます。このように、予測期間中、リアルタイムでのユーティリティ・ロケーティングとマーキングの需要が、ユーティリティ・マーカー市場を活性化すると予測されます。
通信セクターの絶え間ない成長
公共および民間のすべての経済部門は、電話やインターネットサービスのためにこれらのケーブルにアクセスすることができます。電気通信サービスの中断は、公共部門と民間部門に大きな財務的損失をもたらす可能性があります。地下の電気通信インフラを見つけ、地図を作成し、指定するためには、それが不可欠です。したがって、通信業界の拡大に伴い、地下通信網の発見とマッピングの必要性が高まることが予想され、地下用ユーティリティマーカーの需要が高まり、ユーティリティマーカー市場に成長機会がもたらされるでしょう。
市場の抑制要因
新興国におけるユーティリティマーカーに関する知識と規格の狭さ
現場の検査官は、地下のユーティリティの配給・収集システムを構築・維持するための方針、実践、方法を知っておく必要があります。ユーティリティの正確な物理的詳細と位置を知るために、現場検査員はコンピューターやソフトウェア関連の専門家でもある必要があります。電子式または手動式のユーティリティ・ロケーター機器、現地調査、ユーティリティ・マップや建設図面に関する認識に関する情報が不足しているため、ユーティリティの位置確認作業は現場担当者にとってあまり魅力的ではありません。このように、特に未開発の地域では、ユーティリティマーキングに関する適切な規制や認識がないことが、ユーティリティマーカー市場の成長を妨げています。
タイプの展望
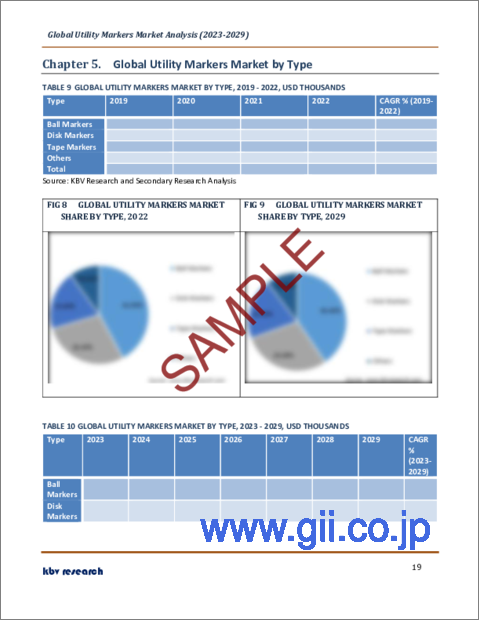
ユーティリティマーカー市場は、タイプ別に、ボールマーカー、ディスクマーカー、テープマーカー、その他に分類されます。これは、ボールマーカーが下に埋められたとき、ボールのように形成され、内部にいくつかのコンポーネントが含まれ、水、化学物質、汚れからそれらを遮蔽するためです。これらのマーカーにはセルフレベリング機構があり、地中のどこに設置しても水平に保たれるようになっています。例えば、埋設物を正確に位置決めする電子マーカーボールを供給する企業もあります。
コンフィギュレーションの展望
ユーティリティマーカー市場は、構成によってパッシブ型とプログラマブル型に分けられます。パッシブセグメントは、2022年のユーティリティマーカー市場において最大の収益シェアをしめしました。これは、数フィートまでの深さの地下施設を特定するための正確で実用的、かつ耐久性のある手段であるという事実に起因しています。職場の安全性を高めるために、パッシブマーカーはユーティリティの位置を示すのに最適です。
ユーティリティの種類別展望
ユーティリティマーカー市場は、ユーティリティの種類によって、ガス、電力、通信、上下水道に分類されます。2022年のユーティリティマーカー市場では、ガス分野が突出した収益シェアを獲得しました。この成長は、ガスがユーティリティマーカーが使用される主要産業の1つであることに起因しています。パイプ通路、導管スタブ、バルブ、ティー、道路横断、メーターボックス、雪に覆われた施設などは、ガス管にユーティリティマーカーを設置できるいくつかの重要な場所です。
地域別展望
ユーティリティマーカー市場は、北米、欧州、アジア太平洋、LAMEAの各地域で分析されています。北米地域は、2022年に最大の収益シェアを獲得し、ユーティリティマーカー市場をリードしています。北米のユーティリティマーカー市場の成長を促進する主な理由は、インフラの劣化と新しいインフラの建設が進行中であることです。水道、電力網、インターネット網への投資の増加に伴い、ユーティリティマーカーが採用されています。北米政府は、インフラを強化するためのプロジェクトを順次後援しています。
目次
第1章 市場範囲と調査手法
- 市場の定義
- 目的
- 市場範囲
- セグメンテーション
- 調査手法
第2章 市場概要
- イントロダクション
- 概要
- 市場構成とシナリオ
- 概要
- 市場に影響を与える主な要因
- 市場促進要因
- 市場抑制要因
第3章 世界のユーティリティマーカー市場:構成別
- 世界のパッシブ市場:地域別
- 世界のプログラマブル市場:地域別
第4章 世界のユーティリティマーカー市場:ユーティリティタイプ別
- 世界の通信市場:地域別
- 世界のガス市場:地域別
- 世界の電力市場:地域別
- 世界の上下水市場:地域別
第5章 世界のユーティリティマーカー市場:タイプ別
- 世界のボールマーカー市場:地域別
- 世界のディスクマーカー市場:地域別
- 世界のテープマーカー市場:地域別
- 世界のその他の市場:地域別
第6章 世界のユーティリティマーカー市場:地域別
- 北米
- 北米の市場:国別
- 米国
- カナダ
- メキシコ
- その他北米地域
- 北米の市場:国別
- 欧州
- 欧州の市場:国別
- ドイツ
- 英国
- フランス
- ロシア
- スペイン
- イタリア
- その他欧州地域
- 欧州の市場:国別
- アジア太平洋
- アジア太平洋の市場:国別
- 中国
- 日本
- インド
- 韓国
- シンガポール
- マレーシア
- その他アジア太平洋地域
- アジア太平洋の市場:国別
- ラテンアメリカ・中東・アフリカ
- ラテンアメリカ・中東・アフリカの市場:国別
- ブラジル
- アルゼンチン
- アラブ首長国連邦
- サウジアラビア
- 南アフリカ
- ナイジェリア
- その他ラテンアメリカ・中東・アフリカ地域
- ラテンアメリカ・中東・アフリカの市場:国別
第7章 企業プロファイル
- 3M Company
- Radiodetection Ltd(SPX Technologies, Inc.)
- Dura Line ltd(Orbia Advance Corporation, S.A.B. de C.V.)
- Hexatronic Group AB
- Tempo Communications, Inc
- Trident Solutions, Inc
- RYCOM Instruments, Inc
- Berntsen International, Inc
- National Marker Company(Justrite Safety Group)
- Komplex sr.o
LIST OF TABLES
- TABLE 1 Global Utility Markers Market, 2019 - 2022, USD Thousands
- TABLE 2 Global Utility Markers Market, 2023 - 2029, USD Thousands
- TABLE 3 Global Utility Markers Market by Configuration, 2019 - 2022, USD Thousands
- TABLE 4 Global Utility Markers Market by Configuration, 2023 - 2029, USD Thousands
- TABLE 5 Global Passive Market by Region, 2019 - 2022, USD Thousands
- TABLE 6 Global Passive Market by Region, 2023 - 2029, USD Thousands
- TABLE 7 Global Programmable Market by Region, 2019 - 2022, USD Thousands
- TABLE 8 Global Programmable Market by Region, 2023 - 2029, USD Thousands
- TABLE 9 Global Utility Markers Market by Utility Type, 2019 - 2022, USD Thousands
- TABLE 10 Global Utility Markers Market by Utility Type, 2023 - 2029, USD Thousands
- TABLE 11 Global Telecommunications Market by Region, 2019 - 2022, USD Thousands
- TABLE 12 Global Telecommunications Market by Region, 2023 - 2029, USD Thousands
- TABLE 13 Global Gas Market by Region, 2019 - 2022, USD Thousands
- TABLE 14 Global Gas Market by Region, 2023 - 2029, USD Thousands
- TABLE 15 Global Power Market by Region, 2019 - 2022, USD Thousands
- TABLE 16 Global Power Market by Region, 2023 - 2029, USD Thousands
- TABLE 17 Global Water & Wastewater Market by Region, 2019 - 2022, USD Thousands
- TABLE 18 Global Water & Wastewater Market by Region, 2023 - 2029, USD Thousands
- TABLE 19 Global Utility Markers Market by Type, 2019 - 2022, USD Thousands
- TABLE 20 Global Utility Markers Market by Type, 2023 - 2029, USD Thousands
- TABLE 21 Global Ball Markers Market by Region, 2019 - 2022, USD Thousands
- TABLE 22 Global Ball Markers Market by Region, 2023 - 2029, USD Thousands
- TABLE 23 Global Disk Markers Market by Region, 2019 - 2022, USD Thousands
- TABLE 24 Global Disk Markers Market by Region, 2023 - 2029, USD Thousands
- TABLE 25 Global Tape Markers Market by Region, 2019 - 2022, USD Thousands
- TABLE 26 Global Tape Markers Market by Region, 2023 - 2029, USD Thousands
- TABLE 27 Global Others Market by Region, 2019 - 2022, USD Thousands
- TABLE 28 Global Others Market by Region, 2023 - 2029, USD Thousands
- TABLE 29 Global Utility Markers Market by Region, 2019 - 2022, USD Thousands
- TABLE 30 Global Utility Markers Market by Region, 2023 - 2029, USD Thousands
- TABLE 31 North America Utility Markers Market, 2019 - 2022, USD Thousands
- TABLE 32 North America Utility Markers Market, 2023 - 2029, USD Thousands
- TABLE 33 North America Utility Markers Market by Configuration, 2019 - 2022, USD Thousands
- TABLE 34 North America Utility Markers Market by Configuration, 2023 - 2029, USD Thousands
- TABLE 35 North America Passive Market by Country, 2019 - 2022, USD Thousands
- TABLE 36 North America Passive Market by Country, 2023 - 2029, USD Thousands
- TABLE 37 North America Programmable Market by Country, 2019 - 2022, USD Thousands
- TABLE 38 North America Programmable Market by Country, 2023 - 2029, USD Thousands
- TABLE 39 North America Utility Markers Market by Utility Type, 2019 - 2022, USD Thousands
- TABLE 40 North America Utility Markers Market by Utility Type, 2023 - 2029, USD Thousands
- TABLE 41 North America Telecommunications Market by Country, 2019 - 2022, USD Thousands
- TABLE 42 North America Telecommunications Market by Country, 2023 - 2029, USD Thousands
- TABLE 43 North America Gas Market by Country, 2019 - 2022, USD Thousands
- TABLE 44 North America Gas Market by Country, 2023 - 2029, USD Thousands
- TABLE 45 North America Power Market by Country, 2019 - 2022, USD Thousands
- TABLE 46 North America Power Market by Country, 2023 - 2029, USD Thousands
- TABLE 47 North America Water & Wastewater Market by Country, 2019 - 2022, USD Thousands
- TABLE 48 North America Water & Wastewater Market by Country, 2023 - 2029, USD Thousands
- TABLE 49 North America Utility Markers Market by Type, 2019 - 2022, USD Thousands
- TABLE 50 North America Utility Markers Market by Type, 2023 - 2029, USD Thousands
- TABLE 51 North America Ball Markers Market by Country, 2019 - 2022, USD Thousands
- TABLE 52 North America Ball Markers Market by Country, 2023 - 2029, USD Thousands
- TABLE 53 North America Disk Markers Market by Country, 2019 - 2022, USD Thousands
- TABLE 54 North America Disk Markers Market by Country, 2023 - 2029, USD Thousands
- TABLE 55 North America Tape Markers Market by Country, 2019 - 2022, USD Thousands
- TABLE 56 North America Tape Markers Market by Country, 2023 - 2029, USD Thousands
- TABLE 57 North America Others Market by Country, 2019 - 2022, USD Thousands
- TABLE 58 North America Others Market by Country, 2023 - 2029, USD Thousands
- TABLE 59 North America Utility Markers Market by Country, 2019 - 2022, USD Thousands
- TABLE 60 North America Utility Markers Market by Country, 2023 - 2029, USD Thousands
- TABLE 61 US Utility Markers Market, 2019 - 2022, USD Thousands
- TABLE 62 US Utility Markers Market, 2023 - 2029, USD Thousands
- TABLE 63 US Utility Markers Market by Configuration, 2019 - 2022, USD Thousands
- TABLE 64 US Utility Markers Market by Configuration, 2023 - 2029, USD Thousands
- TABLE 65 US Utility Markers Market by Utility Type, 2019 - 2022, USD Thousands
- TABLE 66 US Utility Markers Market by Utility Type, 2023 - 2029, USD Thousands
- TABLE 67 US Utility Markers Market by Type, 2019 - 2022, USD Thousands
- TABLE 68 US Utility Markers Market by Type, 2023 - 2029, USD Thousands
- TABLE 69 Canada Utility Markers Market, 2019 - 2022, USD Thousands
- TABLE 70 Canada Utility Markers Market, 2023 - 2029, USD Thousands
- TABLE 71 Canada Utility Markers Market by Configuration, 2019 - 2022, USD Thousands
- TABLE 72 Canada Utility Markers Market by Configuration, 2023 - 2029, USD Thousands
- TABLE 73 Canada Utility Markers Market by Utility Type, 2019 - 2022, USD Thousands
- TABLE 74 Canada Utility Markers Market by Utility Type, 2023 - 2029, USD Thousands
- TABLE 75 Canada Utility Markers Market by Type, 2019 - 2022, USD Thousands
- TABLE 76 Canada Utility Markers Market by Type, 2023 - 2029, USD Thousands
- TABLE 77 Mexico Utility Markers Market, 2019 - 2022, USD Thousands
- TABLE 78 Mexico Utility Markers Market, 2023 - 2029, USD Thousands
- TABLE 79 Mexico Utility Markers Market by Configuration, 2019 - 2022, USD Thousands
- TABLE 80 Mexico Utility Markers Market by Configuration, 2023 - 2029, USD Thousands
- TABLE 81 Mexico Utility Markers Market by Utility Type, 2019 - 2022, USD Thousands
- TABLE 82 Mexico Utility Markers Market by Utility Type, 2023 - 2029, USD Thousands
- TABLE 83 Mexico Utility Markers Market by Type, 2019 - 2022, USD Thousands
- TABLE 84 Mexico Utility Markers Market by Type, 2023 - 2029, USD Thousands
- TABLE 85 Rest of North America Utility Markers Market, 2019 - 2022, USD Thousands
- TABLE 86 Rest of North America Utility Markers Market, 2023 - 2029, USD Thousands
- TABLE 87 Rest of North America Utility Markers Market by Configuration, 2019 - 2022, USD Thousands
- TABLE 88 Rest of North America Utility Markers Market by Configuration, 2023 - 2029, USD Thousands
- TABLE 89 Rest of North America Utility Markers Market by Utility Type, 2019 - 2022, USD Thousands
- TABLE 90 Rest of North America Utility Markers Market by Utility Type, 2023 - 2029, USD Thousands
- TABLE 91 Rest of North America Utility Markers Market by Type, 2019 - 2022, USD Thousands
- TABLE 92 Rest of North America Utility Markers Market by Type, 2023 - 2029, USD Thousands
- TABLE 93 Europe Utility Markers Market, 2019 - 2022, USD Thousands
- TABLE 94 Europe Utility Markers Market, 2023 - 2029, USD Thousands
- TABLE 95 Europe Utility Markers Market by Configuration, 2019 - 2022, USD Thousands
- TABLE 96 Europe Utility Markers Market by Configuration, 2023 - 2029, USD Thousands
- TABLE 97 Europe Passive Market by Country, 2019 - 2022, USD Thousands
- TABLE 98 Europe Passive Market by Country, 2023 - 2029, USD Thousands
- TABLE 99 Europe Programmable Market by Country, 2019 - 2022, USD Thousands
- TABLE 100 Europe Programmable Market by Country, 2023 - 2029, USD Thousands
- TABLE 101 Europe Utility Markers Market by Utility Type, 2019 - 2022, USD Thousands
- TABLE 102 Europe Utility Markers Market by Utility Type, 2023 - 2029, USD Thousands
- TABLE 103 Europe Telecommunications Market by Country, 2019 - 2022, USD Thousands
- TABLE 104 Europe Telecommunications Market by Country, 2023 - 2029, USD Thousands
- TABLE 105 Europe Gas Market by Country, 2019 - 2022, USD Thousands
- TABLE 106 Europe Gas Market by Country, 2023 - 2029, USD Thousands
- TABLE 107 Europe Power Market by Country, 2019 - 2022, USD Thousands
- TABLE 108 Europe Power Market by Country, 2023 - 2029, USD Thousands
- TABLE 109 Europe Water & Wastewater Market by Country, 2019 - 2022, USD Thousands
- TABLE 110 Europe Water & Wastewater Market by Country, 2023 - 2029, USD Thousands
- TABLE 111 Europe Utility Markers Market by Type, 2019 - 2022, USD Thousands
- TABLE 112 Europe Utility Markers Market by Type, 2023 - 2029, USD Thousands
- TABLE 113 Europe Ball Markers Market by Country, 2019 - 2022, USD Thousands
- TABLE 114 Europe Ball Markers Market by Country, 2023 - 2029, USD Thousands
- TABLE 115 Europe Disk Markers Market by Country, 2019 - 2022, USD Thousands
- TABLE 116 Europe Disk Markers Market by Country, 2023 - 2029, USD Thousands
- TABLE 117 Europe Tape Markers Market by Country, 2019 - 2022, USD Thousands
- TABLE 118 Europe Tape Markers Market by Country, 2023 - 2029, USD Thousands
- TABLE 119 Europe Others Market by Country, 2019 - 2022, USD Thousands
- TABLE 120 Europe Others Market by Country, 2023 - 2029, USD Thousands
- TABLE 121 Europe Utility Markers Market by Country, 2019 - 2022, USD Thousands
- TABLE 122 Europe Utility Markers Market by Country, 2023 - 2029, USD Thousands
- TABLE 123 Germany Utility Markers Market, 2019 - 2022, USD Thousands
- TABLE 124 Germany Utility Markers Market, 2023 - 2029, USD Thousands
- TABLE 125 Germany Utility Markers Market by Configuration, 2019 - 2022, USD Thousands
- TABLE 126 Germany Utility Markers Market by Configuration, 2023 - 2029, USD Thousands
- TABLE 127 Germany Utility Markers Market by Utility Type, 2019 - 2022, USD Thousands
- TABLE 128 Germany Utility Markers Market by Utility Type, 2023 - 2029, USD Thousands
- TABLE 129 Germany Utility Markers Market by Type, 2019 - 2022, USD Thousands
- TABLE 130 Germany Utility Markers Market by Type, 2023 - 2029, USD Thousands
- TABLE 131 UK Utility Markers Market, 2019 - 2022, USD Thousands
- TABLE 132 UK Utility Markers Market, 2023 - 2029, USD Thousands
- TABLE 133 UK Utility Markers Market by Configuration, 2019 - 2022, USD Thousands
- TABLE 134 UK Utility Markers Market by Configuration, 2023 - 2029, USD Thousands
- TABLE 135 UK Utility Markers Market by Utility Type, 2019 - 2022, USD Thousands
- TABLE 136 UK Utility Markers Market by Utility Type, 2023 - 2029, USD Thousands
- TABLE 137 UK Utility Markers Market by Type, 2019 - 2022, USD Thousands
- TABLE 138 UK Utility Markers Market by Type, 2023 - 2029, USD Thousands
- TABLE 139 France Utility Markers Market, 2019 - 2022, USD Thousands
- TABLE 140 France Utility Markers Market, 2023 - 2029, USD Thousands
- TABLE 141 France Utility Markers Market by Configuration, 2019 - 2022, USD Thousands
- TABLE 142 France Utility Markers Market by Configuration, 2023 - 2029, USD Thousands
- TABLE 143 France Utility Markers Market by Utility Type, 2019 - 2022, USD Thousands
- TABLE 144 France Utility Markers Market by Utility Type, 2023 - 2029, USD Thousands
- TABLE 145 France Utility Markers Market by Type, 2019 - 2022, USD Thousands
- TABLE 146 France Utility Markers Market by Type, 2023 - 2029, USD Thousands
- TABLE 147 Russia Utility Markers Market, 2019 - 2022, USD Thousands
- TABLE 148 Russia Utility Markers Market, 2023 - 2029, USD Thousands
- TABLE 149 Russia Utility Markers Market by Configuration, 2019 - 2022, USD Thousands
- TABLE 150 Russia Utility Markers Market by Configuration, 2023 - 2029, USD Thousands
- TABLE 151 Russia Utility Markers Market by Utility Type, 2019 - 2022, USD Thousands
- TABLE 152 Russia Utility Markers Market by Utility Type, 2023 - 2029, USD Thousands
- TABLE 153 Russia Utility Markers Market by Type, 2019 - 2022, USD Thousands
- TABLE 154 Russia Utility Markers Market by Type, 2023 - 2029, USD Thousands
- TABLE 155 Spain Utility Markers Market, 2019 - 2022, USD Thousands
- TABLE 156 Spain Utility Markers Market, 2023 - 2029, USD Thousands
- TABLE 157 Spain Utility Markers Market by Configuration, 2019 - 2022, USD Thousands
- TABLE 158 Spain Utility Markers Market by Configuration, 2023 - 2029, USD Thousands
- TABLE 159 Spain Utility Markers Market by Utility Type, 2019 - 2022, USD Thousands
- TABLE 160 Spain Utility Markers Market by Utility Type, 2023 - 2029, USD Thousands
- TABLE 161 Spain Utility Markers Market by Type, 2019 - 2022, USD Thousands
- TABLE 162 Spain Utility Markers Market by Type, 2023 - 2029, USD Thousands
- TABLE 163 Italy Utility Markers Market, 2019 - 2022, USD Thousands
- TABLE 164 Italy Utility Markers Market, 2023 - 2029, USD Thousands
- TABLE 165 Italy Utility Markers Market by Configuration, 2019 - 2022, USD Thousands
- TABLE 166 Italy Utility Markers Market by Configuration, 2023 - 2029, USD Thousands
- TABLE 167 Italy Utility Markers Market by Utility Type, 2019 - 2022, USD Thousands
- TABLE 168 Italy Utility Markers Market by Utility Type, 2023 - 2029, USD Thousands
- TABLE 169 Italy Utility Markers Market by Type, 2019 - 2022, USD Thousands
- TABLE 170 Italy Utility Markers Market by Type, 2023 - 2029, USD Thousands
- TABLE 171 Rest of Europe Utility Markers Market, 2019 - 2022, USD Thousands
- TABLE 172 Rest of Europe Utility Markers Market, 2023 - 2029, USD Thousands
- TABLE 173 Rest of Europe Utility Markers Market by Configuration, 2019 - 2022, USD Thousands
- TABLE 174 Rest of Europe Utility Markers Market by Configuration, 2023 - 2029, USD Thousands
- TABLE 175 Rest of Europe Utility Markers Market by Utility Type, 2019 - 2022, USD Thousands
- TABLE 176 Rest of Europe Utility Markers Market by Utility Type, 2023 - 2029, USD Thousands
- TABLE 177 Rest of Europe Utility Markers Market by Type, 2019 - 2022, USD Thousands
- TABLE 178 Rest of Europe Utility Markers Market by Type, 2023 - 2029, USD Thousands
- TABLE 179 Asia Pacific Utility Markers Market, 2019 - 2022, USD Thousands
- TABLE 180 Asia Pacific Utility Markers Market, 2023 - 2029, USD Thousands
- TABLE 181 Asia Pacific Utility Markers Market by Configuration, 2019 - 2022, USD Thousands
- TABLE 182 Asia Pacific Utility Markers Market by Configuration, 2023 - 2029, USD Thousands
- TABLE 183 Asia Pacific Passive Market by Country, 2019 - 2022, USD Thousands
- TABLE 184 Asia Pacific Passive Market by Country, 2023 - 2029, USD Thousands
- TABLE 185 Asia Pacific Programmable Market by Country, 2019 - 2022, USD Thousands
- TABLE 186 Asia Pacific Programmable Market by Country, 2023 - 2029, USD Thousands
- TABLE 187 Asia Pacific Utility Markers Market by Utility Type, 2019 - 2022, USD Thousands
- TABLE 188 Asia Pacific Utility Markers Market by Utility Type, 2023 - 2029, USD Thousands
- TABLE 189 Asia Pacific Telecommunications Market by Country, 2019 - 2022, USD Thousands
- TABLE 190 Asia Pacific Telecommunications Market by Country, 2023 - 2029, USD Thousands
- TABLE 191 Asia Pacific Gas Market by Country, 2019 - 2022, USD Thousands
- TABLE 192 Asia Pacific Gas Market by Country, 2023 - 2029, USD Thousands
- TABLE 193 Asia Pacific Power Market by Country, 2019 - 2022, USD Thousands
- TABLE 194 Asia Pacific Power Market by Country, 2023 - 2029, USD Thousands
- TABLE 195 Asia Pacific Water & Wastewater Market by Country, 2019 - 2022, USD Thousands
- TABLE 196 Asia Pacific Water & Wastewater Market by Country, 2023 - 2029, USD Thousands
- TABLE 197 Asia Pacific Utility Markers Market by Type, 2019 - 2022, USD Thousands
- TABLE 198 Asia Pacific Utility Markers Market by Type, 2023 - 2029, USD Thousands
- TABLE 199 Asia Pacific Ball Markers Market by Country, 2019 - 2022, USD Thousands
- TABLE 200 Asia Pacific Ball Markers Market by Country, 2023 - 2029, USD Thousands
- TABLE 201 Asia Pacific Disk Markers Market by Country, 2019 - 2022, USD Thousands
- TABLE 202 Asia Pacific Disk Markers Market by Country, 2023 - 2029, USD Thousands
- TABLE 203 Asia Pacific Tape Markers Market by Country, 2019 - 2022, USD Thousands
- TABLE 204 Asia Pacific Tape Markers Market by Country, 2023 - 2029, USD Thousands
- TABLE 205 Asia Pacific Others Market by Country, 2019 - 2022, USD Thousands
- TABLE 206 Asia Pacific Others Market by Country, 2023 - 2029, USD Thousands
- TABLE 207 Asia Pacific Utility Markers Market by Country, 2019 - 2022, USD Thousands
- TABLE 208 Asia Pacific Utility Markers Market by Country, 2023 - 2029, USD Thousands
- TABLE 209 China Utility Markers Market, 2019 - 2022, USD Thousands
- TABLE 210 China Utility Markers Market, 2023 - 2029, USD Thousands
- TABLE 211 China Utility Markers Market by Configuration, 2019 - 2022, USD Thousands
- TABLE 212 China Utility Markers Market by Configuration, 2023 - 2029, USD Thousands
- TABLE 213 China Utility Markers Market by Utility Type, 2019 - 2022, USD Thousands
- TABLE 214 China Utility Markers Market by Utility Type, 2023 - 2029, USD Thousands
- TABLE 215 China Utility Markers Market by Type, 2019 - 2022, USD Thousands
- TABLE 216 China Utility Markers Market by Type, 2023 - 2029, USD Thousands
- TABLE 217 Japan Utility Markers Market, 2019 - 2022, USD Thousands
- TABLE 218 Japan Utility Markers Market, 2023 - 2029, USD Thousands
- TABLE 219 Japan Utility Markers Market by Configuration, 2019 - 2022, USD Thousands
- TABLE 220 Japan Utility Markers Market by Configuration, 2023 - 2029, USD Thousands
- TABLE 221 Japan Utility Markers Market by Utility Type, 2019 - 2022, USD Thousands
- TABLE 222 Japan Utility Markers Market by Utility Type, 2023 - 2029, USD Thousands
- TABLE 223 Japan Utility Markers Market by Type, 2019 - 2022, USD Thousands
- TABLE 224 Japan Utility Markers Market by Type, 2023 - 2029, USD Thousands
- TABLE 225 India Utility Markers Market, 2019 - 2022, USD Thousands
- TABLE 226 India Utility Markers Market, 2023 - 2029, USD Thousands
- TABLE 227 India Utility Markers Market by Configuration, 2019 - 2022, USD Thousands
- TABLE 228 India Utility Markers Market by Configuration, 2023 - 2029, USD Thousands
- TABLE 229 India Utility Markers Market by Utility Type, 2019 - 2022, USD Thousands
- TABLE 230 India Utility Markers Market by Utility Type, 2023 - 2029, USD Thousands
- TABLE 231 India Utility Markers Market by Type, 2019 - 2022, USD Thousands
- TABLE 232 India Utility Markers Market by Type, 2023 - 2029, USD Thousands
- TABLE 233 South Korea Utility Markers Market, 2019 - 2022, USD Thousands
- TABLE 234 South Korea Utility Markers Market, 2023 - 2029, USD Thousands
- TABLE 235 South Korea Utility Markers Market by Configuration, 2019 - 2022, USD Thousands
- TABLE 236 South Korea Utility Markers Market by Configuration, 2023 - 2029, USD Thousands
- TABLE 237 South Korea Utility Markers Market by Utility Type, 2019 - 2022, USD Thousands
- TABLE 238 South Korea Utility Markers Market by Utility Type, 2023 - 2029, USD Thousands
- TABLE 239 South Korea Utility Markers Market by Type, 2019 - 2022, USD Thousands
- TABLE 240 South Korea Utility Markers Market by Type, 2023 - 2029, USD Thousands
- TABLE 241 Singapore Utility Markers Market, 2019 - 2022, USD Thousands
- TABLE 242 Singapore Utility Markers Market, 2023 - 2029, USD Thousands
- TABLE 243 Singapore Utility Markers Market by Configuration, 2019 - 2022, USD Thousands
- TABLE 244 Singapore Utility Markers Market by Configuration, 2023 - 2029, USD Thousands
- TABLE 245 Singapore Utility Markers Market by Utility Type, 2019 - 2022, USD Thousands
- TABLE 246 Singapore Utility Markers Market by Utility Type, 2023 - 2029, USD Thousands
- TABLE 247 Singapore Utility Markers Market by Type, 2019 - 2022, USD Thousands
- TABLE 248 Singapore Utility Markers Market by Type, 2023 - 2029, USD Thousands
- TABLE 249 Malaysia Utility Markers Market, 2019 - 2022, USD Thousands
- TABLE 250 Malaysia Utility Markers Market, 2023 - 2029, USD Thousands
- TABLE 251 Malaysia Utility Markers Market by Configuration, 2019 - 2022, USD Thousands
- TABLE 252 Malaysia Utility Markers Market by Configuration, 2023 - 2029, USD Thousands
- TABLE 253 Malaysia Utility Markers Market by Utility Type, 2019 - 2022, USD Thousands
- TABLE 254 Malaysia Utility Markers Market by Utility Type, 2023 - 2029, USD Thousands
- TABLE 255 Malaysia Utility Markers Market by Type, 2019 - 2022, USD Thousands
- TABLE 256 Malaysia Utility Markers Market by Type, 2023 - 2029, USD Thousands
- TABLE 257 Rest of Asia Pacific Utility Markers Market, 2019 - 2022, USD Thousands
- TABLE 258 Rest of Asia Pacific Utility Markers Market, 2023 - 2029, USD Thousands
- TABLE 259 Rest of Asia Pacific Utility Markers Market by Configuration, 2019 - 2022, USD Thousands
- TABLE 260 Rest of Asia Pacific Utility Markers Market by Configuration, 2023 - 2029, USD Thousands
- TABLE 261 Rest of Asia Pacific Utility Markers Market by Utility Type, 2019 - 2022, USD Thousands
- TABLE 262 Rest of Asia Pacific Utility Markers Market by Utility Type, 2023 - 2029, USD Thousands
- TABLE 263 Rest of Asia Pacific Utility Markers Market by Type, 2019 - 2022, USD Thousands
- TABLE 264 Rest of Asia Pacific Utility Markers Market by Type, 2023 - 2029, USD Thousands
- TABLE 265 LAMEA Utility Markers Market, 2019 - 2022, USD Thousands
- TABLE 266 LAMEA Utility Markers Market, 2023 - 2029, USD Thousands
- TABLE 267 LAMEA Utility Markers Market by Configuration, 2019 - 2022, USD Thousands
- TABLE 268 LAMEA Utility Markers Market by Configuration, 2023 - 2029, USD Thousands
- TABLE 269 LAMEA Passive Market by Country, 2019 - 2022, USD Thousands
- TABLE 270 LAMEA Passive Market by Country, 2023 - 2029, USD Thousands
- TABLE 271 LAMEA Programmable Market by Country, 2019 - 2022, USD Thousands
- TABLE 272 LAMEA Programmable Market by Country, 2023 - 2029, USD Thousands
- TABLE 273 LAMEA Utility Markers Market by Utility Type, 2019 - 2022, USD Thousands
- TABLE 274 LAMEA Utility Markers Market by Utility Type, 2023 - 2029, USD Thousands
- TABLE 275 LAMEA Telecommunications Market by Country, 2019 - 2022, USD Thousands
- TABLE 276 LAMEA Telecommunications Market by Country, 2023 - 2029, USD Thousands
- TABLE 277 LAMEA Gas Market by Country, 2019 - 2022, USD Thousands
- TABLE 278 LAMEA Gas Market by Country, 2023 - 2029, USD Thousands
- TABLE 279 LAMEA Power Market by Country, 2019 - 2022, USD Thousands
- TABLE 280 LAMEA Power Market by Country, 2023 - 2029, USD Thousands
- TABLE 281 LAMEA Water & Wastewater Market by Country, 2019 - 2022, USD Thousands
- TABLE 282 LAMEA Water & Wastewater Market by Country, 2023 - 2029, USD Thousands
- TABLE 283 LAMEA Utility Markers Market by Type, 2019 - 2022, USD Thousands
- TABLE 284 LAMEA Utility Markers Market by Type, 2023 - 2029, USD Thousands
- TABLE 285 LAMEA Ball Markers Market by Country, 2019 - 2022, USD Thousands
- TABLE 286 LAMEA Ball Markers Market by Country, 2023 - 2029, USD Thousands
- TABLE 287 LAMEA Disk Markers Market by Country, 2019 - 2022, USD Thousands
- TABLE 288 LAMEA Disk Markers Market by Country, 2023 - 2029, USD Thousands
- TABLE 289 LAMEA Tape Markers Market by Country, 2019 - 2022, USD Thousands
- TABLE 290 LAMEA Tape Markers Market by Country, 2023 - 2029, USD Thousands
- TABLE 291 LAMEA Others Market by Country, 2019 - 2022, USD Thousands
- TABLE 292 LAMEA Others Market by Country, 2023 - 2029, USD Thousands
- TABLE 293 LAMEA Utility Markers Market by Country, 2019 - 2022, USD Thousands
- TABLE 294 LAMEA Utility Markers Market by Country, 2023 - 2029, USD Thousands
- TABLE 295 Brazil Utility Markers Market, 2019 - 2022, USD Thousands
- TABLE 296 Brazil Utility Markers Market, 2023 - 2029, USD Thousands
- TABLE 297 Brazil Utility Markers Market by Configuration, 2019 - 2022, USD Thousands
- TABLE 298 Brazil Utility Markers Market by Configuration, 2023 - 2029, USD Thousands
- TABLE 299 Brazil Utility Markers Market by Utility Type, 2019 - 2022, USD Thousands
- TABLE 300 Brazil Utility Markers Market by Utility Type, 2023 - 2029, USD Thousands
- TABLE 301 Brazil Utility Markers Market by Type, 2019 - 2022, USD Thousands
- TABLE 302 Brazil Utility Markers Market by Type, 2023 - 2029, USD Thousands
- TABLE 303 Argentina Utility Markers Market, 2019 - 2022, USD Thousands
- TABLE 304 Argentina Utility Markers Market, 2023 - 2029, USD Thousands
- TABLE 305 Argentina Utility Markers Market by Configuration, 2019 - 2022, USD Thousands
- TABLE 306 Argentina Utility Markers Market by Configuration, 2023 - 2029, USD Thousands
- TABLE 307 Argentina Utility Markers Market by Utility Type, 2019 - 2022, USD Thousands
- TABLE 308 Argentina Utility Markers Market by Utility Type, 2023 - 2029, USD Thousands
- TABLE 309 Argentina Utility Markers Market by Type, 2019 - 2022, USD Thousands
- TABLE 310 Argentina Utility Markers Market by Type, 2023 - 2029, USD Thousands
- TABLE 311 UAE Utility Markers Market, 2019 - 2022, USD Thousands
- TABLE 312 UAE Utility Markers Market, 2023 - 2029, USD Thousands
- TABLE 313 UAE Utility Markers Market by Configuration, 2019 - 2022, USD Thousands
- TABLE 314 UAE Utility Markers Market by Configuration, 2023 - 2029, USD Thousands
- TABLE 315 UAE Utility Markers Market by Utility Type, 2019 - 2022, USD Thousands
- TABLE 316 UAE Utility Markers Market by Utility Type, 2023 - 2029, USD Thousands
- TABLE 317 UAE Utility Markers Market by Type, 2019 - 2022, USD Thousands
- TABLE 318 UAE Utility Markers Market by Type, 2023 - 2029, USD Thousands
- TABLE 319 Saudi Arabia Utility Markers Market, 2019 - 2022, USD Thousands
- TABLE 320 Saudi Arabia Utility Markers Market, 2023 - 2029, USD Thousands
- TABLE 321 Saudi Arabia Utility Markers Market by Configuration, 2019 - 2022, USD Thousands
- TABLE 322 Saudi Arabia Utility Markers Market by Configuration, 2023 - 2029, USD Thousands
- TABLE 323 Saudi Arabia Utility Markers Market by Utility Type, 2019 - 2022, USD Thousands
- TABLE 324 Saudi Arabia Utility Markers Market by Utility Type, 2023 - 2029, USD Thousands
- TABLE 325 Saudi Arabia Utility Markers Market by Type, 2019 - 2022, USD Thousands
- TABLE 326 Saudi Arabia Utility Markers Market by Type, 2023 - 2029, USD Thousands
- TABLE 327 South Africa Utility Markers Market, 2019 - 2022, USD Thousands
- TABLE 328 South Africa Utility Markers Market, 2023 - 2029, USD Thousands
- TABLE 329 South Africa Utility Markers Market by Configuration, 2019 - 2022, USD Thousands
- TABLE 330 South Africa Utility Markers Market by Configuration, 2023 - 2029, USD Thousands
- TABLE 331 South Africa Utility Markers Market by Utility Type, 2019 - 2022, USD Thousands
- TABLE 332 South Africa Utility Markers Market by Utility Type, 2023 - 2029, USD Thousands
- TABLE 333 South Africa Utility Markers Market by Type, 2019 - 2022, USD Thousands
- TABLE 334 South Africa Utility Markers Market by Type, 2023 - 2029, USD Thousands
- TABLE 335 Nigeria Utility Markers Market, 2019 - 2022, USD Thousands
- TABLE 336 Nigeria Utility Markers Market, 2023 - 2029, USD Thousands
- TABLE 337 Nigeria Utility Markers Market by Configuration, 2019 - 2022, USD Thousands
- TABLE 338 Nigeria Utility Markers Market by Configuration, 2023 - 2029, USD Thousands
- TABLE 339 Nigeria Utility Markers Market by Utility Type, 2019 - 2022, USD Thousands
- TABLE 340 Nigeria Utility Markers Market by Utility Type, 2023 - 2029, USD Thousands
- TABLE 341 Nigeria Utility Markers Market by Type, 2019 - 2022, USD Thousands
- TABLE 342 Nigeria Utility Markers Market by Type, 2023 - 2029, USD Thousands
- TABLE 343 Rest of LAMEA Utility Markers Market, 2019 - 2022, USD Thousands
- TABLE 344 Rest of LAMEA Utility Markers Market, 2023 - 2029, USD Thousands
- TABLE 345 Rest of LAMEA Utility Markers Market by Configuration, 2019 - 2022, USD Thousands
- TABLE 346 Rest of LAMEA Utility Markers Market by Configuration, 2023 - 2029, USD Thousands
- TABLE 347 Rest of LAMEA Utility Markers Market by Utility Type, 2019 - 2022, USD Thousands
- TABLE 348 Rest of LAMEA Utility Markers Market by Utility Type, 2023 - 2029, USD Thousands
- TABLE 349 Rest of LAMEA Utility Markers Market by Type, 2019 - 2022, USD Thousands
- TABLE 350 Rest of LAMEA Utility Markers Market by Type, 2023 - 2029, USD Thousands
- TABLE 351 Key Information - 3M Company
- TABLE 352 Key Information - Radiodetection Ltd.
- TABLE 353 Key Information - Dura Line ltd.
- TABLE 354 Key Information - Hexatronic Group Ab
- TABLE 355 Key Information - Tempo Communications, Inc.
- TABLE 356 Key Information - Trident Solutions, Inc.
- TABLE 357 Key Information - RYCOM Instruments, Inc.
- TABLE 358 Key Information - Berntsen International, Inc.
- TABLE 359 Key Information - National Marker Company
- TABLE 360 Key Information - Komplex s.r.o.
List of Figures
- FIG 1 Methodology for the research
- FIG 2 Global Utility Markers Market Share by Configuration, 2022
- FIG 3 Global Utility Markers Market Share by Configuration, 2029
- FIG 4 Global Utility Markers Market by Configuration, 2019 - 2029, USD Thousands
- FIG 5 Global Utility Markers Market Share by Utility Type, 2022
- FIG 6 Global Utility Markers Market Share by Utility Type, 2029
- FIG 7 Global Utility Markers Market by Utility Type, 2019 - 2029, USD Thousands
- FIG 8 Global Utility Markers Market Share by Type, 2022
- FIG 9 Global Utility Markers Market Share by Type, 2029
- FIG 10 Global Utility Markers Market by Type, 2019 - 2029, USD Thousands
- FIG 11 Global Utility Markers Market Share by Region, 2022
- FIG 12 Global Utility Markers Market Share by Region, 2029
- FIG 13 Global Utility Markers Market by Region, 2019 - 2029, USD Thousands
- FIG 14 SWOT Analysis: 3M Company
The Global Utility Markers Market size is expected to reach $475.8 Million by 2029, rising at a market growth of 6.5% CAGR during the forecast period.
Utility markers adhere to the uniform color codes prescribed by the relevant Public Works Association authorities of the location for temporarily designating their facilities because it might be challenging to keep track of exactly what is buried beneath on a worksite. These colors aid in identifying hidden dangers that must be considered during excavation. However, the color-coding scheme serves to alert employees to the specific danger. With the implementation of the universal color code, other utility marking codes were used to correctly identify underground conduits, cables, and pipelines, as well as the owners and descriptions of the corresponding facilities.
The public utility includes lines for water mains, street lighting, fiber optics, storm drains, traffic signals, telecommunication, electricity distribution, and water mains. The bulk of essential national security communication lines, oil and gas pipelines, public transportation, and road and rail networks are also competing for underground space in other places. The concern for the safety and security of underground services is credited with driving the rapid expansion of utility markers.
In addition, the strict government laws and regulations requiring the location of underground utilities prior to construction and excavation are considerably fueling the expansion of the utility markers market globally. While these "high impact" marks give excavators essential short-term visual cues, low-impact solutions keep these utility marker sites out of the public's view while offering significant practical advantages. The locations of buried utilities and other assets are frequently inaccessible for the use of standard signage.
Utility markers let excavators know to call for a complete set of markings prior to continuing, or they clearly designate underground assets to ensure that proper marking is done before each job. Flexible plastic utility markers offer the best of both worlds: eye-catching caution and location markings that blend in with the background, preventing complaints from neighbors while offering a long-lasting alternative to spray paint and other temporary methods now in use.
COVID-19 Impact Analysis
Due to the pandemic, ongoing international projects like high-speed rail lines were also impacted. Due to the lockdown brought on by COVID-19, the manufacture of several products in the utility marking industry has been halted. As a result, the market's expansion during the lockdown has been limited. Before the emergence of the coronavirus, the market for utility markers was experiencing a significant increase in demand from large manufacturing nations, but this need has since decreased. However, the demand for utility markers is expected to return to its prior level following the pandemic's upsurge and help the market recover from its initial decline.
Market Growth Factors
Government rules and the demand for real time utility locating and marking
Due to sophisticated techniques, the owners of the underground utilities can analyze those facilities in real-time. Fleet telemetry systems, GIS data devices, GPS devices, and GPR devices composed of multiple GPR antennas, referred to as "GPR Arrays," have all started to be used by utility locating and marking equipment and service providers. These devices allow surveying the areas more quickly by collecting several GPR profiles and providing utility locating services. Thus, it is projected that the demand for real-time utility locating and marking during the forecast period will fuel the market for utility markers.
The constant growth of the telecommunication sector
All public and private economic sectors can access these cables for telephony and internet services. Any interruption to telecom services could result in significant financial losses for the public and private sectors. In order to find, map, and designate underground telecom infrastructure, it is essential. Hence, with the telecommunications industry expanding, there will likely be a greater requirement for finding and mapping underground telecom networks, increasing the demand for underground utility markers and providing growth opportunities for the utility markers market.
Market Restraining Factors
Limited knowledge and standards regarding utility markers in emerging economies
The field inspector must know the policies, practices, and methods for building and maintaining subsurface utility distribution and collection systems. To learn the precise physical details and location of the utility, the field inspector should also be an expert in computer and software-related activities. The task of utility locating is less appealing for the field officer due to a lack of information regarding electronic or manual utility locator equipment, field survey, and awareness regarding utility maps and construction drawings. Thus, the absence of proper regulations and awareness regarding utility marking, especially in underdeveloped regions, hinders the growth of the utility marker market.
Type Outlook
Based on type, the utility markers market is segmented into ball markers, disk markers, tape markers and others. This is because when buried below, ball markers are formed like a ball and contain several components inside, shielding them from water, chemicals, and dirt. These markers have a self-leveling mechanism that makes sure they stay horizontal no matter where they are positioned in the ground. Companies, for instance, supply an electronic marker ball that positions the buried items precisely.
Configuration Outlook
On the basis of configuration, the utility markers market is divided into passive and programmable. The passive segment witnessed the largest revenue share in the utility markers market in 2022. This is owing to the fact that they are accurate, practical, and durable means of identifying underground facilities at depths of up to a few feet. For greater workplace safety, passive markers are perfect for marking the locations of utilities.
Utility Type Outlook
By utility type, the utility markers market is classified into gas, power, telecommunications and water & wastewater. The gas segment garnered a prominent revenue share in the utility markers market in 2022. The growth is attributed to gas being one of the main industries where utility markers are used. Pipe pathways, conduit stubs, valves, tees, road crossings, meter boxes, and installations that are covered in snow are a few crucial locations where utility markers can be installed in gas lines.
Regional Outlook
Region-wise, the utility markers market is analyzed across North America, Europe, Asia Pacific, and LAMEA. The North America region led the utility markers market by generating the maximum revenue share in 2022. The primary reasons driving the growth of the utility markers market in North America are the deteriorating infrastructure and the ongoing building of new infrastructure. Utility markers are being adopted as investments in the water, electricity grid, and internet networks increase. The government of North America is progressively sponsoring projects to enhance infrastructure.
The market research report covers the analysis of key stake holders of the market. Key companies profiled in the report include 3M Company, Radiodetection Ltd. (SPX Technologies, Inc.), Dura Line ltd. (Orbia Advance Corporation, S.A.B. de C.V.), Tempo Communications, Inc., Komplex s.r.o., Hexatronic Group AB, RYCOM Instruments, Inc., Berntsen International, Inc., Trident Solutions, Inc., and National Marker Company (Justrite Safety Group).
Scope of the Study
Market Segments covered in the Report:
By Configuration
- Passive
- Programmable
By Utility Type
- Telecommunications
- Gas
- Power
- Water & Wastewater
By Type
- Ball Markers
- Disk Markers
- Tape Markers
- Others
By Geography
- North America
- US
- Canada
- Mexico
- Rest of North America
- Europe
- Germany
- UK
- France
- Russia
- Spain
- Italy
- Rest of Europe
- Asia Pacific
- China
- Japan
- India
- South Korea
- Singapore
- Malaysia
- Rest of Asia Pacific
- LAMEA
- Brazil
- Argentina
- UAE
- Saudi Arabia
- South Africa
- Nigeria
- Rest of LAMEA
Companies Profiled
- 3M Company
- Radiodetection Ltd. (SPX Technologies, Inc.)
- Dura Line ltd. (Orbia Advance Corporation, S.A.B. de C.V.)
- Tempo Communications, Inc.
- Komplex s.r.o.
- Hexatronic Group AB
- RYCOM Instruments, Inc.
- Berntsen International, Inc.
- Trident Solutions, Inc.
- National Marker Company (Justrite Safety Group)
Unique Offerings from KBV Research
- Exhaustive coverage
- Highest number of market tables and figures
- Subscription based model available
- Guaranteed best price
- Assured post sales research support with 10% customization free
Table of Contents
Chapter 1. Market Scope & Methodology
- 1.1 Market Definition
- 1.2 Objectives
- 1.3 Market Scope
- 1.4 Segmentation
- 1.4.1 Global Utility Markers Market, by Configuration
- 1.4.2 Global Utility Markers Market, by Utility Type
- 1.4.3 Global Utility Markers Market, by Type
- 1.4.4 Global Utility Markers Market, by Geography
- 1.5 Methodology for the research
Chapter 2. Market Overview
- 2.1 Introduction
- 2.1.1 Overview
- 2.1.1.1 Market composition & scenario
- 2.1.1 Overview
- 2.2 Key Factors Impacting the Market
- 2.2.1 Market Drivers
- 2.2.2 Market Restraints
Chapter 3. Global Utility Markers Market by Configuration
- 3.1 Global Passive Market by Region
- 3.2 Global Programmable Market by Region
Chapter 4. Global Utility Markers Market by Utility Type
- 4.1 Global Telecommunications Market by Region
- 4.2 Global Gas Market by Region
- 4.3 Global Power Market by Region
- 4.4 Global Water & Wastewater Market by Region
Chapter 5. Global Utility Markers Market by Type
- 5.1 Global Ball Markers Market by Region
- 5.2 Global Disk Markers Market by Region
- 5.3 Global Tape Markers Market by Region
- 5.4 Global Others Market by Region
Chapter 6. Global Utility Markers Market by Region
- 6.1 North America Utility Markers Market
- 6.1.1 North America Utility Markers Market by Configuration
- 6.1.1.1 North America Passive Market by Country
- 6.1.1.2 North America Programmable Market by Country
- 6.1.2 North America Utility Markers Market by Utility Type
- 6.1.2.1 North America Telecommunications Market by Country
- 6.1.2.2 North America Gas Market by Country
- 6.1.2.3 North America Power Market by Country
- 6.1.2.4 North America Water & Wastewater Market by Country
- 6.1.3 North America Utility Markers Market by Type
- 6.1.3.1 North America Ball Markers Market by Country
- 6.1.3.2 North America Disk Markers Market by Country
- 6.1.3.3 North America Tape Markers Market by Country
- 6.1.3.4 North America Others Market by Country
- 6.1.4 North America Utility Markers Market by Country
- 6.1.4.1 US Utility Markers Market
- 6.1.4.1.1 US Utility Markers Market by Configuration
- 6.1.4.1.2 US Utility Markers Market by Utility Type
- 6.1.4.1.3 US Utility Markers Market by Type
- 6.1.4.2 Canada Utility Markers Market
- 6.1.4.2.1 Canada Utility Markers Market by Configuration
- 6.1.4.2.2 Canada Utility Markers Market by Utility Type
- 6.1.4.2.3 Canada Utility Markers Market by Type
- 6.1.4.3 Mexico Utility Markers Market
- 6.1.4.3.1 Mexico Utility Markers Market by Configuration
- 6.1.4.3.2 Mexico Utility Markers Market by Utility Type
- 6.1.4.3.3 Mexico Utility Markers Market by Type
- 6.1.4.4 Rest of North America Utility Markers Market
- 6.1.4.4.1 Rest of North America Utility Markers Market by Configuration
- 6.1.4.4.2 Rest of North America Utility Markers Market by Utility Type
- 6.1.4.4.3 Rest of North America Utility Markers Market by Type
- 6.1.4.1 US Utility Markers Market
- 6.1.1 North America Utility Markers Market by Configuration
- 6.2 Europe Utility Markers Market
- 6.2.1 Europe Utility Markers Market by Configuration
- 6.2.1.1 Europe Passive Market by Country
- 6.2.1.2 Europe Programmable Market by Country
- 6.2.2 Europe Utility Markers Market by Utility Type
- 6.2.2.1 Europe Telecommunications Market by Country
- 6.2.2.2 Europe Gas Market by Country
- 6.2.2.3 Europe Power Market by Country
- 6.2.2.4 Europe Water & Wastewater Market by Country
- 6.2.3 Europe Utility Markers Market by Type
- 6.2.3.1 Europe Ball Markers Market by Country
- 6.2.3.2 Europe Disk Markers Market by Country
- 6.2.3.3 Europe Tape Markers Market by Country
- 6.2.3.4 Europe Others Market by Country
- 6.2.4 Europe Utility Markers Market by Country
- 6.2.4.1 Germany Utility Markers Market
- 6.2.4.1.1 Germany Utility Markers Market by Configuration
- 6.2.4.1.2 Germany Utility Markers Market by Utility Type
- 6.2.4.1.3 Germany Utility Markers Market by Type
- 6.2.4.2 UK Utility Markers Market
- 6.2.4.2.1 UK Utility Markers Market by Configuration
- 6.2.4.2.2 UK Utility Markers Market by Utility Type
- 6.2.4.2.3 UK Utility Markers Market by Type
- 6.2.4.3 France Utility Markers Market
- 6.2.4.3.1 France Utility Markers Market by Configuration
- 6.2.4.3.2 France Utility Markers Market by Utility Type
- 6.2.4.3.3 France Utility Markers Market by Type
- 6.2.4.4 Russia Utility Markers Market
- 6.2.4.4.1 Russia Utility Markers Market by Configuration
- 6.2.4.4.2 Russia Utility Markers Market by Utility Type
- 6.2.4.4.3 Russia Utility Markers Market by Type
- 6.2.4.5 Spain Utility Markers Market
- 6.2.4.5.1 Spain Utility Markers Market by Configuration
- 6.2.4.5.2 Spain Utility Markers Market by Utility Type
- 6.2.4.5.3 Spain Utility Markers Market by Type
- 6.2.4.6 Italy Utility Markers Market
- 6.2.4.6.1 Italy Utility Markers Market by Configuration
- 6.2.4.6.2 Italy Utility Markers Market by Utility Type
- 6.2.4.6.3 Italy Utility Markers Market by Type
- 6.2.4.7 Rest of Europe Utility Markers Market
- 6.2.4.7.1 Rest of Europe Utility Markers Market by Configuration
- 6.2.4.7.2 Rest of Europe Utility Markers Market by Utility Type
- 6.2.4.7.3 Rest of Europe Utility Markers Market by Type
- 6.2.4.1 Germany Utility Markers Market
- 6.2.1 Europe Utility Markers Market by Configuration
- 6.3 Asia Pacific Utility Markers Market
- 6.3.1 Asia Pacific Utility Markers Market by Configuration
- 6.3.1.1 Asia Pacific Passive Market by Country
- 6.3.1.2 Asia Pacific Programmable Market by Country
- 6.3.2 Asia Pacific Utility Markers Market by Utility Type
- 6.3.2.1 Asia Pacific Telecommunications Market by Country
- 6.3.2.2 Asia Pacific Gas Market by Country
- 6.3.2.3 Asia Pacific Power Market by Country
- 6.3.2.4 Asia Pacific Water & Wastewater Market by Country
- 6.3.3 Asia Pacific Utility Markers Market by Type
- 6.3.3.1 Asia Pacific Ball Markers Market by Country
- 6.3.3.2 Asia Pacific Disk Markers Market by Country
- 6.3.3.3 Asia Pacific Tape Markers Market by Country
- 6.3.3.4 Asia Pacific Others Market by Country
- 6.3.4 Asia Pacific Utility Markers Market by Country
- 6.3.4.1 China Utility Markers Market
- 6.3.4.1.1 China Utility Markers Market by Configuration
- 6.3.4.1.2 China Utility Markers Market by Utility Type
- 6.3.4.1.3 China Utility Markers Market by Type
- 6.3.4.2 Japan Utility Markers Market
- 6.3.4.2.1 Japan Utility Markers Market by Configuration
- 6.3.4.2.2 Japan Utility Markers Market by Utility Type
- 6.3.4.2.3 Japan Utility Markers Market by Type
- 6.3.4.3 India Utility Markers Market
- 6.3.4.3.1 India Utility Markers Market by Configuration
- 6.3.4.3.2 India Utility Markers Market by Utility Type
- 6.3.4.3.3 India Utility Markers Market by Type
- 6.3.4.4 South Korea Utility Markers Market
- 6.3.4.4.1 South Korea Utility Markers Market by Configuration
- 6.3.4.4.2 South Korea Utility Markers Market by Utility Type
- 6.3.4.4.3 South Korea Utility Markers Market by Type
- 6.3.4.5 Singapore Utility Markers Market
- 6.3.4.5.1 Singapore Utility Markers Market by Configuration
- 6.3.4.5.2 Singapore Utility Markers Market by Utility Type
- 6.3.4.5.3 Singapore Utility Markers Market by Type
- 6.3.4.6 Malaysia Utility Markers Market
- 6.3.4.6.1 Malaysia Utility Markers Market by Configuration
- 6.3.4.6.2 Malaysia Utility Markers Market by Utility Type
- 6.3.4.6.3 Malaysia Utility Markers Market by Type
- 6.3.4.7 Rest of Asia Pacific Utility Markers Market
- 6.3.4.7.1 Rest of Asia Pacific Utility Markers Market by Configuration
- 6.3.4.7.2 Rest of Asia Pacific Utility Markers Market by Utility Type
- 6.3.4.7.3 Rest of Asia Pacific Utility Markers Market by Type
- 6.3.4.1 China Utility Markers Market
- 6.3.1 Asia Pacific Utility Markers Market by Configuration
- 6.4 LAMEA Utility Markers Market
- 6.4.1 LAMEA Utility Markers Market by Configuration
- 6.4.1.1 LAMEA Passive Market by Country
- 6.4.1.2 LAMEA Programmable Market by Country
- 6.4.2 LAMEA Utility Markers Market by Utility Type
- 6.4.2.1 LAMEA Telecommunications Market by Country
- 6.4.2.2 LAMEA Gas Market by Country
- 6.4.2.3 LAMEA Power Market by Country
- 6.4.2.4 LAMEA Water & Wastewater Market by Country
- 6.4.3 LAMEA Utility Markers Market by Type
- 6.4.3.1 LAMEA Ball Markers Market by Country
- 6.4.3.2 LAMEA Disk Markers Market by Country
- 6.4.3.3 LAMEA Tape Markers Market by Country
- 6.4.3.4 LAMEA Others Market by Country
- 6.4.4 LAMEA Utility Markers Market by Country
- 6.4.4.1 Brazil Utility Markers Market
- 6.4.4.1.1 Brazil Utility Markers Market by Configuration
- 6.4.4.1.2 Brazil Utility Markers Market by Utility Type
- 6.4.4.1.3 Brazil Utility Markers Market by Type
- 6.4.4.2 Argentina Utility Markers Market
- 6.4.4.2.1 Argentina Utility Markers Market by Configuration
- 6.4.4.2.2 Argentina Utility Markers Market by Utility Type
- 6.4.4.2.3 Argentina Utility Markers Market by Type
- 6.4.4.3 UAE Utility Markers Market
- 6.4.4.3.1 UAE Utility Markers Market by Configuration
- 6.4.4.3.2 UAE Utility Markers Market by Utility Type
- 6.4.4.3.3 UAE Utility Markers Market by Type
- 6.4.4.4 Saudi Arabia Utility Markers Market
- 6.4.4.4.1 Saudi Arabia Utility Markers Market by Configuration
- 6.4.4.4.2 Saudi Arabia Utility Markers Market by Utility Type
- 6.4.4.4.3 Saudi Arabia Utility Markers Market by Type
- 6.4.4.5 South Africa Utility Markers Market
- 6.4.4.5.1 South Africa Utility Markers Market by Configuration
- 6.4.4.5.2 South Africa Utility Markers Market by Utility Type
- 6.4.4.5.3 South Africa Utility Markers Market by Type
- 6.4.4.6 Nigeria Utility Markers Market
- 6.4.4.6.1 Nigeria Utility Markers Market by Configuration
- 6.4.4.6.2 Nigeria Utility Markers Market by Utility Type
- 6.4.4.6.3 Nigeria Utility Markers Market by Type
- 6.4.4.7 Rest of LAMEA Utility Markers Market
- 6.4.4.7.1 Rest of LAMEA Utility Markers Market by Configuration
- 6.4.4.7.2 Rest of LAMEA Utility Markers Market by Utility Type
- 6.4.4.7.3 Rest of LAMEA Utility Markers Market by Type
- 6.4.4.1 Brazil Utility Markers Market
- 6.4.1 LAMEA Utility Markers Market by Configuration
Chapter 7. Company Profiles
- 7.1 3M Company
- 7.1.1 Company Overview
- 7.1.2 Financial Analysis
- 7.1.3 Segmental and Regional Analysis
- 7.1.4 Research & Development Expense
- 7.1.5 SWOT Analysis
- 7.2 Radiodetection Ltd. (SPX Technologies, Inc.)
- 7.2.1 Company Overview
- 7.2.2 Financial Analysis
- 7.2.3 Segmental and Regional Analysis
- 7.2.4 Research & Development Expenses
- 7.2.5 Recent strategies and developments:
- 7.2.5.1 Product Launches and Product Expansions:
- 7.3 Dura Line ltd. (Orbia Advance Corporation, S.A.B. de C.V.)
- 7.3.1 Company Overview
- 7.3.2 Financial Analysis
- 7.3.3 Regional Analysis
- 7.4 Hexatronic Group AB
- 7.4.1 Company Overview
- 7.4.2 Financial Analysis
- 7.4.3 Segmental and Regional Analysis
- 7.5 Tempo Communications, Inc.
- 7.5.1 Company Overview
- 7.5.2 Recent strategies and developments:
- 7.5.2.1 Product Launches and Product Expansions:
- 7.6 Trident Solutions, Inc.
- 7.6.1 Company Overview
- 7.6.2 Recent strategies and developments:
- 7.6.2.1 Acquisition and Mergers:
- 7.7 RYCOM Instruments, Inc.
- 7.7.1 Company Overview
- 7.8 Berntsen International, Inc.
- 7.8.1 Company Overview
- 7.9 National Marker Company (Justrite Safety Group)
- 7.9.1 Company Overview
- 7.10. Komplex s.r.o.
- 7.10.1 Company Overview