|
|
市場調査レポート
商品コード
1276552
スクリーンレスディスプレイの世界市場規模、シェア、産業動向分析レポート:分野別、タイプ別、用途別(ホログラフィックプロジェクション、ヘッドアップディスプレイ、ヘッドマウントディスプレイ、その他)、地域別展望と予測、2023~2029年Global Screenless Display Market Size, Share & Industry Trends Analysis Report By Vertical, By Type, By Application (Holographic Projection, Head-up Display, Head-mounted Display and Others), By Regional Outlook and Forecast, 2023 - 2029 |
||||||
|
|
|||||||


| スクリーンレスディスプレイの世界市場規模、シェア、産業動向分析レポート:分野別、タイプ別、用途別(ホログラフィックプロジェクション、ヘッドアップディスプレイ、ヘッドマウントディスプレイ、その他)、地域別展望と予測、2023~2029年 |
|
出版日: 2023年04月28日
発行: KBV Research
ページ情報: 英文 222 Pages
納期: 即納可能
|
- 全表示
- 概要
- 図表
- 目次
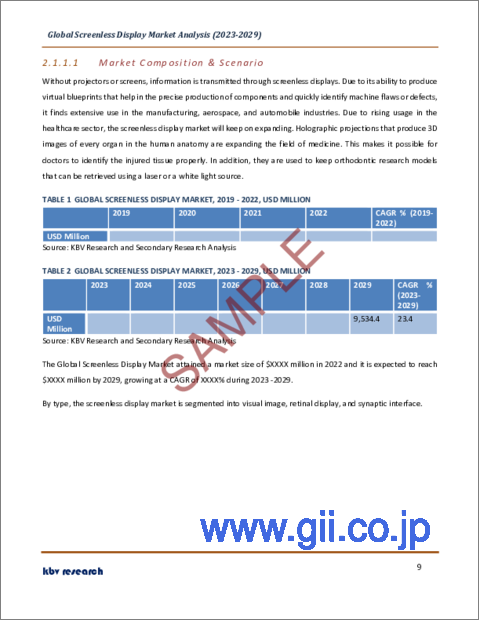
スクリーンレスディスプレイ市場規模は、2029年までに95億米ドルに達すると予測され、予測期間中のCAGRは23.4%の市場成長率で上昇すると予想されています。
この技術の導入により、ディスプレイの設置スペースの問題が解決され、十分な周囲長を持つ場所であれば、ほぼどこでも持ち運びが可能になりました。スクリーンレスディスプレイは、プライバシーやセキュリティの欠点に対処し、エラーの可能性を減らすと予想されるため、市場の成長が見込まれています。スクリーンレスディスプレイは、視覚的な画像で、人間の目を使ってあらゆる物体や画像を認識するものです。視覚画像ディスプレイのいくつかの図解が以下に提供される:ヘッドアップディスプレイ、バーチャルリアリティゴーグル、ホログラフィックディスプレイがその例です。
網膜ディスプレイでは、光の反射のために中間的な物体を使用する代わりに、画像が網膜に直接投影されます。シナプスインターフェースは、光を使わずに人間の脳に直接データを伝達するものです。すでに人体実験が行われているため、ほとんどの企業が効率的なコミュニケーション、ビジネス、教育、セキュリティシステムとしてこの技術を使い始めています。
COVID-19の影響分析
COVID-19の流行は、主に市場にいくつかの課題をもたらしました。熟練労働者の不足、部分的または全体的な世界ロックダウンによるプロジェクトの遅延やキャンセルなどです。さらに、技術の重要なエンドユーザーの1つである自動車は、パンデミックの間、顕著な需要の減少を目の当たりにしました。このことは、自動車分野でのパンデミック期間中のスクリーンレスディスプレイ技術の需要にも悪影響を及ぼしました。しかし、COVID-19以降のスクリーンレスディスプレイの市場機会は、世界のスマートインフラソリューションの導入の急増によって強化されると予想されます。
市場成長要因
医療用デモンストレーションやトレーニングにおける採用の拡大
ホログラムによる3D映像の投影は、レーザービームとオブジェクトビームが衝突することで、あたかも空中に浮いているような印象を与えます。医療分野では、ホログラム技術により、内臓や体の一部を徹底的に3Dで表現しています。これにより、医療従事者は病気や怪我をより詳細に把握することができ、正確な診断につなげることができます。ウェアラブル・スクリーンレス端末は、患者のプライバシーを守るための最も効率的な技術であると言えるでしょう。また、情報にアクセスできるのはユーザーだけであるため、ウェアラブル・スクリーンレスディスプレイはリスクを減少させる可能性があります。予測期間中、スクリーンレスディスプレイの市場は、これらの要因によって、より急速に成長すると思われます。
ゲーム分野の成長
ホログラフィックプロジェクションやヘッドマウントスクリーンは、ユーザーの視界を完全に支配し、仮想環境へ移動させるために使用されます。ゲームのシナリオがプレイヤーにとってリアルなものになるのです。360度の広角視野で、スクリーンサイズに制限はないです。あらゆる物体を3次元で可視化することで、視聴者は、あらゆる場所にあらゆる物体の浮遊感を生み出すことができます。鑑賞者は、写真を作成したり、ビジュアルコンテンツを見るために、コンピューター、モニター、タブレットを必要としないです。ゲーム産業の成長とゲームにおけるスクリーンレスディスプレイ技術の幅広い利用が、スクリーンレスディスプレイ市場の拡大をサポートすると予測されています。
市場抑制要因
採用前に多くの調査が必要
網膜が損傷し、最終的に失明に至る可能性があります。ユーザーの視界に映し出される画像は、間違いなく現実にあるものを邪魔し、最も必要な時に注意をそらす可能性があります。また、この技術は、より正確な評価を行うための知識や使い方がまだ十分ではありません。そのため、スクリーンレスディスプレイが比較的新しいアイデアであることを考えると、多くのエンドユーザー業界関係者が必要な調査作業を行うことができないため、採用が制限される可能性があります。したがって、スクリーンレスディスプレイ市場は緩やかな成長を遂げると思われます。
タイプ別展望
タイプ別に見ると、スクリーンレスディスプレイ市場は、ビジュアルイメージ、網膜ディスプレイ、シナプティックインターフェースに分けられます。2022年、網膜ディスプレイセグメントは、スクリーンレスディスプレイ市場でかなりの収益シェアを占めています。スクリーンレスディスプレイの一分類であるレティナルダイレクトディスプレイでは、網膜に直接映像が投影されます。中間物体からの反射光ではなく、網膜に直接投影されるため、視覚映像システムとは異なります。網膜直下型ディスプレイが実用化されれば、公共の場でコンピュータ作業を行う際に、完全なプライバシーを確保できるようになります。
用途の展望
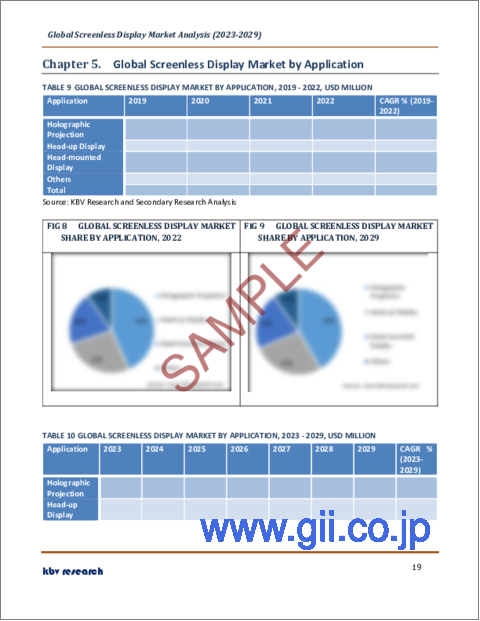
スクリーンレスディスプレイ市場は、用途別に、ホログラフィックプロジェクション、ヘッドマウントディスプレイ、ヘッドアップディスプレイ、その他に分類されます。2022年、ホログラフィックプロジェクションセグメントは、スクリーンレスディスプレイ市場において最大の収益シェアをしめしました。ホログラフィック技術は、顧客と製品のコミュニケーションを向上させます。バーチャルホログラフィックアシスタントは、ホテルの客室で、食事の注文、旅程の整理、タクシーの呼び出しなど、さまざまなタスクに採用されています。また、エンゲージメントを高めるために、バーチャルアシスタントは音声通話サービスにも採用されています。
垂直方向の展望
スクリーンレスディスプレイ市場は、産業別では航空宇宙・防衛、自動車、ヘルスケア、家電、商業に分類されます。2022年のスクリーンレスディスプレイ市場では、ヘルスケア分野が顕著な収益シェアを記録しました。ヘルスケアトレーニングは、あらゆるタイプのスクリーンレスディスプレイを使用して実施することができます。バクテリア、解剖学、細胞など、一人では見ることができないものを、誰でもかなりの大きさで表示することができます。ホログラムは、インストラクターと学生が同時に3D画像を見ることができ、その画像と対話しながらあらゆる質問に答えることができるため、スクリーンディスプレイよりも優れています。
地域別展望
地域別に見ると、スクリーンレスディスプレイ市場は、北米、欧州、アジア太平洋、LAMEAで分析されています。2022年、北米地域は最も高い収益シェアを獲得し、スクリーンレスディスプレイ市場をリードしました。次世代スクリーンレスディスプレイ技術の創出に向けた重要な市場参入企業による投資の増加により、北米のスクリーンレスディスプレイ市場は拡大しています。また、北米の主要な政府機関および企業は、スクリーンレスディスプレイ技術の開発に多額の投資を行っており、市場の拡大に拍車をかけています。
目次
第1章 市場範囲と調査手法
- 市場の定義
- 目的
- 市場範囲
- セグメンテーション
- 調査手法
第2章 市場概要
- イントロダクション
- 概要
- 市場構成とシナリオ
- 概要
- 市場に影響を与える主な要因
- 市場促進要因
- 市場抑制要因
第3章 世界のスクリーンレスディスプレイ市場:業界別
- 世界の航空宇宙および防衛市場:地域別
- 世界の自動車市場:地域別
- 世界のヘルスケア市場:地域別
- 世界の家電市場:地域別
- 世界の商業市場:地域別
第4章 世界のスクリーンレスディスプレイ市場:タイプ別
- 世界の映像市場:地域別
- 世界の網膜ディスプレイ市場:地域別
- 世界のシナプスインターフェイス市場:地域別
第5章 世界のスクリーンレスディスプレイ市場:用途別
- 世界のホログラフィックプロジェクション市場:地域別
- 世界のヘッドアップディスプレイ市場:地域別
- 世界のヘッドマウントディスプレイ市場:地域別
- 世界のその他の市場:地域別
第6章 世界のスクリーンレスディスプレイ市場:地域別
- 北米
- 北米の市場:国別
- 米国
- カナダ
- メキシコ
- その他北米地域
- 北米の市場:国別
- 欧州
- 欧州の市場:国別
- ドイツ
- 英国
- フランス
- ロシア
- スペイン
- イタリア
- その他欧州地域
- 欧州の市場:国別
- アジア太平洋
- アジア太平洋の市場:国別
- 中国
- 日本
- インド
- 韓国
- シンガポール
- マレーシア
- その他アジア太平洋地域
- アジア太平洋の市場:国別
- ラテンアメリカ・中東・アフリカ
- ラテンアメリカ・中東・アフリカの市場:国別
- ブラジル
- アルゼンチン
- アラブ首長国連邦
- サウジアラビア
- 南アフリカ
- ナイジェリア
- その他ラテンアメリカ・中東・アフリカ地域
- ラテンアメリカ・中東・アフリカの市場:国別
第7章 企業プロファイル
- Microsoft Corporation
- Google LLC(Alphabet, Inc)
- BAE Systems PLC
- Avegant Corporation
- RealView Imaging Ltd
- Holoxica Limited
- SeeReal Technologies SA
- MicroVision, Inc
- Synaptics Incorporated
- Leia, Inc
LIST OF TABLES
- TABLE 1 Global Screenless Display Market, 2019 - 2022, USD Million
- TABLE 2 Global Screenless Display Market, 2023 - 2029, USD Million
- TABLE 3 Global Screenless Display Market by Vertical, 2019 - 2022, USD Million
- TABLE 4 Global Screenless Display Market by Vertical, 2023 - 2029, USD Million
- TABLE 5 Global Aerospace & Defense Market by Region, 2019 - 2022, USD Million
- TABLE 6 Global Aerospace & Defense Market by Region, 2023 - 2029, USD Million
- TABLE 7 Global Automotive Market by Region, 2019 - 2022, USD Million
- TABLE 8 Global Automotive Market by Region, 2023 - 2029, USD Million
- TABLE 9 Global Healthcare Market by Region, 2019 - 2022, USD Million
- TABLE 10 Global Healthcare Market by Region, 2023 - 2029, USD Million
- TABLE 11 Global Consumer Electronics Market by Region, 2019 - 2022, USD Million
- TABLE 12 Global Consumer Electronics Market by Region, 2023 - 2029, USD Million
- TABLE 13 Global Commercial Market by Region, 2019 - 2022, USD Million
- TABLE 14 Global Commercial Market by Region, 2023 - 2029, USD Million
- TABLE 15 Global Screenless Display Market by Type, 2019 - 2022, USD Million
- TABLE 16 Global Screenless Display Market by Type, 2023 - 2029, USD Million
- TABLE 17 Global Visual Image Market by Region, 2019 - 2022, USD Million
- TABLE 18 Global Visual Image Market by Region, 2023 - 2029, USD Million
- TABLE 19 Global Retinal Display Market by Region, 2019 - 2022, USD Million
- TABLE 20 Global Retinal Display Market by Region, 2023 - 2029, USD Million
- TABLE 21 Global Synaptic Interface Market by Region, 2019 - 2022, USD Million
- TABLE 22 Global Synaptic Interface Market by Region, 2023 - 2029, USD Million
- TABLE 23 Global Screenless Display Market by Application, 2019 - 2022, USD Million
- TABLE 24 Global Screenless Display Market by Application, 2023 - 2029, USD Million
- TABLE 25 Global Holographic Projection Market by Region, 2019 - 2022, USD Million
- TABLE 26 Global Holographic Projection Market by Region, 2023 - 2029, USD Million
- TABLE 27 Global Head-up Display Market by Region, 2019 - 2022, USD Million
- TABLE 28 Global Head-up Display Market by Region, 2023 - 2029, USD Million
- TABLE 29 Global Head-mounted Display Market by Region, 2019 - 2022, USD Million
- TABLE 30 Global Head-mounted Display Market by Region, 2023 - 2029, USD Million
- TABLE 31 Global Others Market by Region, 2019 - 2022, USD Million
- TABLE 32 Global Others Market by Region, 2023 - 2029, USD Million
- TABLE 33 Global Screenless Display Market by Region, 2019 - 2022, USD Million
- TABLE 34 Global Screenless Display Market by Region, 2023 - 2029, USD Million
- TABLE 35 North America Screenless Display Market, 2019 - 2022, USD Million
- TABLE 36 North America Screenless Display Market, 2023 - 2029, USD Million
- TABLE 37 North America Screenless Display Market by Vertical, 2019 - 2022, USD Million
- TABLE 38 North America Screenless Display Market by Vertical, 2023 - 2029, USD Million
- TABLE 39 North America Aerospace & Defense Market by Country, 2019 - 2022, USD Million
- TABLE 40 North America Aerospace & Defense Market by Country, 2023 - 2029, USD Million
- TABLE 41 North America Automotive Market by Country, 2019 - 2022, USD Million
- TABLE 42 North America Automotive Market by Country, 2023 - 2029, USD Million
- TABLE 43 North America Healthcare Market by Country, 2019 - 2022, USD Million
- TABLE 44 North America Healthcare Market by Country, 2023 - 2029, USD Million
- TABLE 45 North America Consumer Electronics Market by Country, 2019 - 2022, USD Million
- TABLE 46 North America Consumer Electronics Market by Country, 2023 - 2029, USD Million
- TABLE 47 North America Commercial Market by Country, 2019 - 2022, USD Million
- TABLE 48 North America Commercial Market by Country, 2023 - 2029, USD Million
- TABLE 49 North America Screenless Display Market by Type, 2019 - 2022, USD Million
- TABLE 50 North America Screenless Display Market by Type, 2023 - 2029, USD Million
- TABLE 51 North America Visual Image Market by Country, 2019 - 2022, USD Million
- TABLE 52 North America Visual Image Market by Country, 2023 - 2029, USD Million
- TABLE 53 North America Retinal Display Market by Country, 2019 - 2022, USD Million
- TABLE 54 North America Retinal Display Market by Country, 2023 - 2029, USD Million
- TABLE 55 North America Synaptic Interface Market by Country, 2019 - 2022, USD Million
- TABLE 56 North America Synaptic Interface Market by Country, 2023 - 2029, USD Million
- TABLE 57 North America Screenless Display Market by Application, 2019 - 2022, USD Million
- TABLE 58 North America Screenless Display Market by Application, 2023 - 2029, USD Million
- TABLE 59 North America Holographic Projection Market by Country, 2019 - 2022, USD Million
- TABLE 60 North America Holographic Projection Market by Country, 2023 - 2029, USD Million
- TABLE 61 North America Head-up Display Market by Country, 2019 - 2022, USD Million
- TABLE 62 North America Head-up Display Market by Country, 2023 - 2029, USD Million
- TABLE 63 North America Head-mounted Display Market by Country, 2019 - 2022, USD Million
- TABLE 64 North America Head-mounted Display Market by Country, 2023 - 2029, USD Million
- TABLE 65 North America Others Market by Country, 2019 - 2022, USD Million
- TABLE 66 North America Others Market by Country, 2023 - 2029, USD Million
- TABLE 67 North America Screenless Display Market by Country, 2019 - 2022, USD Million
- TABLE 68 North America Screenless Display Market by Country, 2023 - 2029, USD Million
- TABLE 69 US Screenless Display Market, 2019 - 2022, USD Million
- TABLE 70 US Screenless Display Market, 2023 - 2029, USD Million
- TABLE 71 US Screenless Display Market by Vertical, 2019 - 2022, USD Million
- TABLE 72 US Screenless Display Market by Vertical, 2023 - 2029, USD Million
- TABLE 73 US Screenless Display Market by Type, 2019 - 2022, USD Million
- TABLE 74 US Screenless Display Market by Type, 2023 - 2029, USD Million
- TABLE 75 US Screenless Display Market by Application, 2019 - 2022, USD Million
- TABLE 76 US Screenless Display Market by Application, 2023 - 2029, USD Million
- TABLE 77 Canada Screenless Display Market, 2019 - 2022, USD Million
- TABLE 78 Canada Screenless Display Market, 2023 - 2029, USD Million
- TABLE 79 Canada Screenless Display Market by Vertical, 2019 - 2022, USD Million
- TABLE 80 Canada Screenless Display Market by Vertical, 2023 - 2029, USD Million
- TABLE 81 Canada Screenless Display Market by Type, 2019 - 2022, USD Million
- TABLE 82 Canada Screenless Display Market by Type, 2023 - 2029, USD Million
- TABLE 83 Canada Screenless Display Market by Application, 2019 - 2022, USD Million
- TABLE 84 Canada Screenless Display Market by Application, 2023 - 2029, USD Million
- TABLE 85 Mexico Screenless Display Market, 2019 - 2022, USD Million
- TABLE 86 Mexico Screenless Display Market, 2023 - 2029, USD Million
- TABLE 87 Mexico Screenless Display Market by Vertical, 2019 - 2022, USD Million
- TABLE 88 Mexico Screenless Display Market by Vertical, 2023 - 2029, USD Million
- TABLE 89 Mexico Screenless Display Market by Type, 2019 - 2022, USD Million
- TABLE 90 Mexico Screenless Display Market by Type, 2023 - 2029, USD Million
- TABLE 91 Mexico Screenless Display Market by Application, 2019 - 2022, USD Million
- TABLE 92 Mexico Screenless Display Market by Application, 2023 - 2029, USD Million
- TABLE 93 Rest of North America Screenless Display Market, 2019 - 2022, USD Million
- TABLE 94 Rest of North America Screenless Display Market, 2023 - 2029, USD Million
- TABLE 95 Rest of North America Screenless Display Market by Vertical, 2019 - 2022, USD Million
- TABLE 96 Rest of North America Screenless Display Market by Vertical, 2023 - 2029, USD Million
- TABLE 97 Rest of North America Screenless Display Market by Type, 2019 - 2022, USD Million
- TABLE 98 Rest of North America Screenless Display Market by Type, 2023 - 2029, USD Million
- TABLE 99 Rest of North America Screenless Display Market by Application, 2019 - 2022, USD Million
- TABLE 100 Rest of North America Screenless Display Market by Application, 2023 - 2029, USD Million
- TABLE 101 Europe Screenless Display Market, 2019 - 2022, USD Million
- TABLE 102 Europe Screenless Display Market, 2023 - 2029, USD Million
- TABLE 103 Europe Screenless Display Market by Vertical, 2019 - 2022, USD Million
- TABLE 104 Europe Screenless Display Market by Vertical, 2023 - 2029, USD Million
- TABLE 105 Europe Aerospace & Defense Market by Country, 2019 - 2022, USD Million
- TABLE 106 Europe Aerospace & Defense Market by Country, 2023 - 2029, USD Million
- TABLE 107 Europe Automotive Market by Country, 2019 - 2022, USD Million
- TABLE 108 Europe Automotive Market by Country, 2023 - 2029, USD Million
- TABLE 109 Europe Healthcare Market by Country, 2019 - 2022, USD Million
- TABLE 110 Europe Healthcare Market by Country, 2023 - 2029, USD Million
- TABLE 111 Europe Consumer Electronics Market by Country, 2019 - 2022, USD Million
- TABLE 112 Europe Consumer Electronics Market by Country, 2023 - 2029, USD Million
- TABLE 113 Europe Commercial Market by Country, 2019 - 2022, USD Million
- TABLE 114 Europe Commercial Market by Country, 2023 - 2029, USD Million
- TABLE 115 Europe Screenless Display Market by Type, 2019 - 2022, USD Million
- TABLE 116 Europe Screenless Display Market by Type, 2023 - 2029, USD Million
- TABLE 117 Europe Visual Image Market by Country, 2019 - 2022, USD Million
- TABLE 118 Europe Visual Image Market by Country, 2023 - 2029, USD Million
- TABLE 119 Europe Retinal Display Market by Country, 2019 - 2022, USD Million
- TABLE 120 Europe Retinal Display Market by Country, 2023 - 2029, USD Million
- TABLE 121 Europe Synaptic Interface Market by Country, 2019 - 2022, USD Million
- TABLE 122 Europe Synaptic Interface Market by Country, 2023 - 2029, USD Million
- TABLE 123 Europe Screenless Display Market by Application, 2019 - 2022, USD Million
- TABLE 124 Europe Screenless Display Market by Application, 2023 - 2029, USD Million
- TABLE 125 Europe Holographic Projection Market by Country, 2019 - 2022, USD Million
- TABLE 126 Europe Holographic Projection Market by Country, 2023 - 2029, USD Million
- TABLE 127 Europe Head-up Display Market by Country, 2019 - 2022, USD Million
- TABLE 128 Europe Head-up Display Market by Country, 2023 - 2029, USD Million
- TABLE 129 Europe Head-mounted Display Market by Country, 2019 - 2022, USD Million
- TABLE 130 Europe Head-mounted Display Market by Country, 2023 - 2029, USD Million
- TABLE 131 Europe Others Market by Country, 2019 - 2022, USD Million
- TABLE 132 Europe Others Market by Country, 2023 - 2029, USD Million
- TABLE 133 Europe Screenless Display Market by Country, 2019 - 2022, USD Million
- TABLE 134 Europe Screenless Display Market by Country, 2023 - 2029, USD Million
- TABLE 135 Germany Screenless Display Market, 2019 - 2022, USD Million
- TABLE 136 Germany Screenless Display Market, 2023 - 2029, USD Million
- TABLE 137 Germany Screenless Display Market by Vertical, 2019 - 2022, USD Million
- TABLE 138 Germany Screenless Display Market by Vertical, 2023 - 2029, USD Million
- TABLE 139 Germany Screenless Display Market by Type, 2019 - 2022, USD Million
- TABLE 140 Germany Screenless Display Market by Type, 2023 - 2029, USD Million
- TABLE 141 Germany Screenless Display Market by Application, 2019 - 2022, USD Million
- TABLE 142 Germany Screenless Display Market by Application, 2023 - 2029, USD Million
- TABLE 143 UK Screenless Display Market, 2019 - 2022, USD Million
- TABLE 144 UK Screenless Display Market, 2023 - 2029, USD Million
- TABLE 145 UK Screenless Display Market by Vertical, 2019 - 2022, USD Million
- TABLE 146 UK Screenless Display Market by Vertical, 2023 - 2029, USD Million
- TABLE 147 UK Screenless Display Market by Type, 2019 - 2022, USD Million
- TABLE 148 UK Screenless Display Market by Type, 2023 - 2029, USD Million
- TABLE 149 UK Screenless Display Market by Application, 2019 - 2022, USD Million
- TABLE 150 UK Screenless Display Market by Application, 2023 - 2029, USD Million
- TABLE 151 France Screenless Display Market, 2019 - 2022, USD Million
- TABLE 152 France Screenless Display Market, 2023 - 2029, USD Million
- TABLE 153 France Screenless Display Market by Vertical, 2019 - 2022, USD Million
- TABLE 154 France Screenless Display Market by Vertical, 2023 - 2029, USD Million
- TABLE 155 France Screenless Display Market by Type, 2019 - 2022, USD Million
- TABLE 156 France Screenless Display Market by Type, 2023 - 2029, USD Million
- TABLE 157 France Screenless Display Market by Application, 2019 - 2022, USD Million
- TABLE 158 France Screenless Display Market by Application, 2023 - 2029, USD Million
- TABLE 159 Russia Screenless Display Market, 2019 - 2022, USD Million
- TABLE 160 Russia Screenless Display Market, 2023 - 2029, USD Million
- TABLE 161 Russia Screenless Display Market by Vertical, 2019 - 2022, USD Million
- TABLE 162 Russia Screenless Display Market by Vertical, 2023 - 2029, USD Million
- TABLE 163 Russia Screenless Display Market by Type, 2019 - 2022, USD Million
- TABLE 164 Russia Screenless Display Market by Type, 2023 - 2029, USD Million
- TABLE 165 Russia Screenless Display Market by Application, 2019 - 2022, USD Million
- TABLE 166 Russia Screenless Display Market by Application, 2023 - 2029, USD Million
- TABLE 167 Spain Screenless Display Market, 2019 - 2022, USD Million
- TABLE 168 Spain Screenless Display Market, 2023 - 2029, USD Million
- TABLE 169 Spain Screenless Display Market by Vertical, 2019 - 2022, USD Million
- TABLE 170 Spain Screenless Display Market by Vertical, 2023 - 2029, USD Million
- TABLE 171 Spain Screenless Display Market by Type, 2019 - 2022, USD Million
- TABLE 172 Spain Screenless Display Market by Type, 2023 - 2029, USD Million
- TABLE 173 Spain Screenless Display Market by Application, 2019 - 2022, USD Million
- TABLE 174 Spain Screenless Display Market by Application, 2023 - 2029, USD Million
- TABLE 175 Italy Screenless Display Market, 2019 - 2022, USD Million
- TABLE 176 Italy Screenless Display Market, 2023 - 2029, USD Million
- TABLE 177 Italy Screenless Display Market by Vertical, 2019 - 2022, USD Million
- TABLE 178 Italy Screenless Display Market by Vertical, 2023 - 2029, USD Million
- TABLE 179 Italy Screenless Display Market by Type, 2019 - 2022, USD Million
- TABLE 180 Italy Screenless Display Market by Type, 2023 - 2029, USD Million
- TABLE 181 Italy Screenless Display Market by Application, 2019 - 2022, USD Million
- TABLE 182 Italy Screenless Display Market by Application, 2023 - 2029, USD Million
- TABLE 183 Rest of Europe Screenless Display Market, 2019 - 2022, USD Million
- TABLE 184 Rest of Europe Screenless Display Market, 2023 - 2029, USD Million
- TABLE 185 Rest of Europe Screenless Display Market by Vertical, 2019 - 2022, USD Million
- TABLE 186 Rest of Europe Screenless Display Market by Vertical, 2023 - 2029, USD Million
- TABLE 187 Rest of Europe Screenless Display Market by Type, 2019 - 2022, USD Million
- TABLE 188 Rest of Europe Screenless Display Market by Type, 2023 - 2029, USD Million
- TABLE 189 Rest of Europe Screenless Display Market by Application, 2019 - 2022, USD Million
- TABLE 190 Rest of Europe Screenless Display Market by Application, 2023 - 2029, USD Million
- TABLE 191 Asia Pacific Screenless Display Market, 2019 - 2022, USD Million
- TABLE 192 Asia Pacific Screenless Display Market, 2023 - 2029, USD Million
- TABLE 193 Asia Pacific Screenless Display Market by Vertical, 2019 - 2022, USD Million
- TABLE 194 Asia Pacific Screenless Display Market by Vertical, 2023 - 2029, USD Million
- TABLE 195 Asia Pacific Aerospace & Defense Market by Country, 2019 - 2022, USD Million
- TABLE 196 Asia Pacific Aerospace & Defense Market by Country, 2023 - 2029, USD Million
- TABLE 197 Asia Pacific Automotive Market by Country, 2019 - 2022, USD Million
- TABLE 198 Asia Pacific Automotive Market by Country, 2023 - 2029, USD Million
- TABLE 199 Asia Pacific Healthcare Market by Country, 2019 - 2022, USD Million
- TABLE 200 Asia Pacific Healthcare Market by Country, 2023 - 2029, USD Million
- TABLE 201 Asia Pacific Consumer Electronics Market by Country, 2019 - 2022, USD Million
- TABLE 202 Asia Pacific Consumer Electronics Market by Country, 2023 - 2029, USD Million
- TABLE 203 Asia Pacific Commercial Market by Country, 2019 - 2022, USD Million
- TABLE 204 Asia Pacific Commercial Market by Country, 2023 - 2029, USD Million
- TABLE 205 Asia Pacific Screenless Display Market by Type, 2019 - 2022, USD Million
- TABLE 206 Asia Pacific Screenless Display Market by Type, 2023 - 2029, USD Million
- TABLE 207 Asia Pacific Visual Image Market by Country, 2019 - 2022, USD Million
- TABLE 208 Asia Pacific Visual Image Market by Country, 2023 - 2029, USD Million
- TABLE 209 Asia Pacific Retinal Display Market by Country, 2019 - 2022, USD Million
- TABLE 210 Asia Pacific Retinal Display Market by Country, 2023 - 2029, USD Million
- TABLE 211 Asia Pacific Synaptic Interface Market by Country, 2019 - 2022, USD Million
- TABLE 212 Asia Pacific Synaptic Interface Market by Country, 2023 - 2029, USD Million
- TABLE 213 Asia Pacific Screenless Display Market by Application, 2019 - 2022, USD Million
- TABLE 214 Asia Pacific Screenless Display Market by Application, 2023 - 2029, USD Million
- TABLE 215 Asia Pacific Holographic Projection Market by Country, 2019 - 2022, USD Million
- TABLE 216 Asia Pacific Holographic Projection Market by Country, 2023 - 2029, USD Million
- TABLE 217 Asia Pacific Head-up Display Market by Country, 2019 - 2022, USD Million
- TABLE 218 Asia Pacific Head-up Display Market by Country, 2023 - 2029, USD Million
- TABLE 219 Asia Pacific Head-mounted Display Market by Country, 2019 - 2022, USD Million
- TABLE 220 Asia Pacific Head-mounted Display Market by Country, 2023 - 2029, USD Million
- TABLE 221 Asia Pacific Others Market by Country, 2019 - 2022, USD Million
- TABLE 222 Asia Pacific Others Market by Country, 2023 - 2029, USD Million
- TABLE 223 Asia Pacific Screenless Display Market by Country, 2019 - 2022, USD Million
- TABLE 224 Asia Pacific Screenless Display Market by Country, 2023 - 2029, USD Million
- TABLE 225 China Screenless Display Market, 2019 - 2022, USD Million
- TABLE 226 China Screenless Display Market, 2023 - 2029, USD Million
- TABLE 227 China Screenless Display Market by Vertical, 2019 - 2022, USD Million
- TABLE 228 China Screenless Display Market by Vertical, 2023 - 2029, USD Million
- TABLE 229 China Screenless Display Market by Type, 2019 - 2022, USD Million
- TABLE 230 China Screenless Display Market by Type, 2023 - 2029, USD Million
- TABLE 231 China Screenless Display Market by Application, 2019 - 2022, USD Million
- TABLE 232 China Screenless Display Market by Application, 2023 - 2029, USD Million
- TABLE 233 Japan Screenless Display Market, 2019 - 2022, USD Million
- TABLE 234 Japan Screenless Display Market, 2023 - 2029, USD Million
- TABLE 235 Japan Screenless Display Market by Vertical, 2019 - 2022, USD Million
- TABLE 236 Japan Screenless Display Market by Vertical, 2023 - 2029, USD Million
- TABLE 237 Japan Screenless Display Market by Type, 2019 - 2022, USD Million
- TABLE 238 Japan Screenless Display Market by Type, 2023 - 2029, USD Million
- TABLE 239 Japan Screenless Display Market by Application, 2019 - 2022, USD Million
- TABLE 240 Japan Screenless Display Market by Application, 2023 - 2029, USD Million
- TABLE 241 India Screenless Display Market, 2019 - 2022, USD Million
- TABLE 242 India Screenless Display Market, 2023 - 2029, USD Million
- TABLE 243 India Screenless Display Market by Vertical, 2019 - 2022, USD Million
- TABLE 244 India Screenless Display Market by Vertical, 2023 - 2029, USD Million
- TABLE 245 India Screenless Display Market by Type, 2019 - 2022, USD Million
- TABLE 246 India Screenless Display Market by Type, 2023 - 2029, USD Million
- TABLE 247 India Screenless Display Market by Application, 2019 - 2022, USD Million
- TABLE 248 India Screenless Display Market by Application, 2023 - 2029, USD Million
- TABLE 249 South Korea Screenless Display Market, 2019 - 2022, USD Million
- TABLE 250 South Korea Screenless Display Market, 2023 - 2029, USD Million
- TABLE 251 South Korea Screenless Display Market by Vertical, 2019 - 2022, USD Million
- TABLE 252 South Korea Screenless Display Market by Vertical, 2023 - 2029, USD Million
- TABLE 253 South Korea Screenless Display Market by Type, 2019 - 2022, USD Million
- TABLE 254 South Korea Screenless Display Market by Type, 2023 - 2029, USD Million
- TABLE 255 South Korea Screenless Display Market by Application, 2019 - 2022, USD Million
- TABLE 256 South Korea Screenless Display Market by Application, 2023 - 2029, USD Million
- TABLE 257 Singapore Screenless Display Market, 2019 - 2022, USD Million
- TABLE 258 Singapore Screenless Display Market, 2023 - 2029, USD Million
- TABLE 259 Singapore Screenless Display Market by Vertical, 2019 - 2022, USD Million
- TABLE 260 Singapore Screenless Display Market by Vertical, 2023 - 2029, USD Million
- TABLE 261 Singapore Screenless Display Market by Type, 2019 - 2022, USD Million
- TABLE 262 Singapore Screenless Display Market by Type, 2023 - 2029, USD Million
- TABLE 263 Singapore Screenless Display Market by Application, 2019 - 2022, USD Million
- TABLE 264 Singapore Screenless Display Market by Application, 2023 - 2029, USD Million
- TABLE 265 Malaysia Screenless Display Market, 2019 - 2022, USD Million
- TABLE 266 Malaysia Screenless Display Market, 2023 - 2029, USD Million
- TABLE 267 Malaysia Screenless Display Market by Vertical, 2019 - 2022, USD Million
- TABLE 268 Malaysia Screenless Display Market by Vertical, 2023 - 2029, USD Million
- TABLE 269 Malaysia Screenless Display Market by Type, 2019 - 2022, USD Million
- TABLE 270 Malaysia Screenless Display Market by Type, 2023 - 2029, USD Million
- TABLE 271 Malaysia Screenless Display Market by Application, 2019 - 2022, USD Million
- TABLE 272 Malaysia Screenless Display Market by Application, 2023 - 2029, USD Million
- TABLE 273 Rest of Asia Pacific Screenless Display Market, 2019 - 2022, USD Million
- TABLE 274 Rest of Asia Pacific Screenless Display Market, 2023 - 2029, USD Million
- TABLE 275 Rest of Asia Pacific Screenless Display Market by Vertical, 2019 - 2022, USD Million
- TABLE 276 Rest of Asia Pacific Screenless Display Market by Vertical, 2023 - 2029, USD Million
- TABLE 277 Rest of Asia Pacific Screenless Display Market by Type, 2019 - 2022, USD Million
- TABLE 278 Rest of Asia Pacific Screenless Display Market by Type, 2023 - 2029, USD Million
- TABLE 279 Rest of Asia Pacific Screenless Display Market by Application, 2019 - 2022, USD Million
- TABLE 280 Rest of Asia Pacific Screenless Display Market by Application, 2023 - 2029, USD Million
- TABLE 281 LAMEA Screenless Display Market, 2019 - 2022, USD Million
- TABLE 282 LAMEA Screenless Display Market, 2023 - 2029, USD Million
- TABLE 283 LAMEA Screenless Display Market by Vertical, 2019 - 2022, USD Million
- TABLE 284 LAMEA Screenless Display Market by Vertical, 2023 - 2029, USD Million
- TABLE 285 LAMEA Aerospace & Defense Market by Country, 2019 - 2022, USD Million
- TABLE 286 LAMEA Aerospace & Defense Market by Country, 2023 - 2029, USD Million
- TABLE 287 LAMEA Automotive Market by Country, 2019 - 2022, USD Million
- TABLE 288 LAMEA Automotive Market by Country, 2023 - 2029, USD Million
- TABLE 289 LAMEA Healthcare Market by Country, 2019 - 2022, USD Million
- TABLE 290 LAMEA Healthcare Market by Country, 2023 - 2029, USD Million
- TABLE 291 LAMEA Consumer Electronics Market by Country, 2019 - 2022, USD Million
- TABLE 292 LAMEA Consumer Electronics Market by Country, 2023 - 2029, USD Million
- TABLE 293 LAMEA Commercial Market by Country, 2019 - 2022, USD Million
- TABLE 294 LAMEA Commercial Market by Country, 2023 - 2029, USD Million
- TABLE 295 LAMEA Screenless Display Market by Type, 2019 - 2022, USD Million
- TABLE 296 LAMEA Screenless Display Market by Type, 2023 - 2029, USD Million
- TABLE 297 LAMEA Visual Image Market by Country, 2019 - 2022, USD Million
- TABLE 298 LAMEA Visual Image Market by Country, 2023 - 2029, USD Million
- TABLE 299 LAMEA Retinal Display Market by Country, 2019 - 2022, USD Million
- TABLE 300 LAMEA Retinal Display Market by Country, 2023 - 2029, USD Million
- TABLE 301 LAMEA Synaptic Interface Market by Country, 2019 - 2022, USD Million
- TABLE 302 LAMEA Synaptic Interface Market by Country, 2023 - 2029, USD Million
- TABLE 303 LAMEA Screenless Display Market by Application, 2019 - 2022, USD Million
- TABLE 304 LAMEA Screenless Display Market by Application, 2023 - 2029, USD Million
- TABLE 305 LAMEA Holographic Projection Market by Country, 2019 - 2022, USD Million
- TABLE 306 LAMEA Holographic Projection Market by Country, 2023 - 2029, USD Million
- TABLE 307 LAMEA Head-up Display Market by Country, 2019 - 2022, USD Million
- TABLE 308 LAMEA Head-up Display Market by Country, 2023 - 2029, USD Million
- TABLE 309 LAMEA Head-mounted Display Market by Country, 2019 - 2022, USD Million
- TABLE 310 LAMEA Head-mounted Display Market by Country, 2023 - 2029, USD Million
- TABLE 311 LAMEA Others Market by Country, 2019 - 2022, USD Million
- TABLE 312 LAMEA Others Market by Country, 2023 - 2029, USD Million
- TABLE 313 LAMEA Screenless Display Market by Country, 2019 - 2022, USD Million
- TABLE 314 LAMEA Screenless Display Market by Country, 2023 - 2029, USD Million
- TABLE 315 Brazil Screenless Display Market, 2019 - 2022, USD Million
- TABLE 316 Brazil Screenless Display Market, 2023 - 2029, USD Million
- TABLE 317 Brazil Screenless Display Market by Vertical, 2019 - 2022, USD Million
- TABLE 318 Brazil Screenless Display Market by Vertical, 2023 - 2029, USD Million
- TABLE 319 Brazil Screenless Display Market by Type, 2019 - 2022, USD Million
- TABLE 320 Brazil Screenless Display Market by Type, 2023 - 2029, USD Million
- TABLE 321 Brazil Screenless Display Market by Application, 2019 - 2022, USD Million
- TABLE 322 Brazil Screenless Display Market by Application, 2023 - 2029, USD Million
- TABLE 323 Argentina Screenless Display Market, 2019 - 2022, USD Million
- TABLE 324 Argentina Screenless Display Market, 2023 - 2029, USD Million
- TABLE 325 Argentina Screenless Display Market by Vertical, 2019 - 2022, USD Million
- TABLE 326 Argentina Screenless Display Market by Vertical, 2023 - 2029, USD Million
- TABLE 327 Argentina Screenless Display Market by Type, 2019 - 2022, USD Million
- TABLE 328 Argentina Screenless Display Market by Type, 2023 - 2029, USD Million
- TABLE 329 Argentina Screenless Display Market by Application, 2019 - 2022, USD Million
- TABLE 330 Argentina Screenless Display Market by Application, 2023 - 2029, USD Million
- TABLE 331 UAE Screenless Display Market, 2019 - 2022, USD Million
- TABLE 332 UAE Screenless Display Market, 2023 - 2029, USD Million
- TABLE 333 UAE Screenless Display Market by Vertical, 2019 - 2022, USD Million
- TABLE 334 UAE Screenless Display Market by Vertical, 2023 - 2029, USD Million
- TABLE 335 UAE Screenless Display Market by Type, 2019 - 2022, USD Million
- TABLE 336 UAE Screenless Display Market by Type, 2023 - 2029, USD Million
- TABLE 337 UAE Screenless Display Market by Application, 2019 - 2022, USD Million
- TABLE 338 UAE Screenless Display Market by Application, 2023 - 2029, USD Million
- TABLE 339 Saudi Arabia Screenless Display Market, 2019 - 2022, USD Million
- TABLE 340 Saudi Arabia Screenless Display Market, 2023 - 2029, USD Million
- TABLE 341 Saudi Arabia Screenless Display Market by Vertical, 2019 - 2022, USD Million
- TABLE 342 Saudi Arabia Screenless Display Market by Vertical, 2023 - 2029, USD Million
- TABLE 343 Saudi Arabia Screenless Display Market by Type, 2019 - 2022, USD Million
- TABLE 344 Saudi Arabia Screenless Display Market by Type, 2023 - 2029, USD Million
- TABLE 345 Saudi Arabia Screenless Display Market by Application, 2019 - 2022, USD Million
- TABLE 346 Saudi Arabia Screenless Display Market by Application, 2023 - 2029, USD Million
- TABLE 347 South Africa Screenless Display Market, 2019 - 2022, USD Million
- TABLE 348 South Africa Screenless Display Market, 2023 - 2029, USD Million
- TABLE 349 South Africa Screenless Display Market by Vertical, 2019 - 2022, USD Million
- TABLE 350 South Africa Screenless Display Market by Vertical, 2023 - 2029, USD Million
- TABLE 351 South Africa Screenless Display Market by Type, 2019 - 2022, USD Million
- TABLE 352 South Africa Screenless Display Market by Type, 2023 - 2029, USD Million
- TABLE 353 South Africa Screenless Display Market by Application, 2019 - 2022, USD Million
- TABLE 354 South Africa Screenless Display Market by Application, 2023 - 2029, USD Million
- TABLE 355 Nigeria Screenless Display Market, 2019 - 2022, USD Million
- TABLE 356 Nigeria Screenless Display Market, 2023 - 2029, USD Million
- TABLE 357 Nigeria Screenless Display Market by Vertical, 2019 - 2022, USD Million
- TABLE 358 Nigeria Screenless Display Market by Vertical, 2023 - 2029, USD Million
- TABLE 359 Nigeria Screenless Display Market by Type, 2019 - 2022, USD Million
- TABLE 360 Nigeria Screenless Display Market by Type, 2023 - 2029, USD Million
- TABLE 361 Nigeria Screenless Display Market by Application, 2019 - 2022, USD Million
- TABLE 362 Nigeria Screenless Display Market by Application, 2023 - 2029, USD Million
- TABLE 363 Rest of LAMEA Screenless Display Market, 2019 - 2022, USD Million
- TABLE 364 Rest of LAMEA Screenless Display Market, 2023 - 2029, USD Million
- TABLE 365 Rest of LAMEA Screenless Display Market by Vertical, 2019 - 2022, USD Million
- TABLE 366 Rest of LAMEA Screenless Display Market by Vertical, 2023 - 2029, USD Million
- TABLE 367 Rest of LAMEA Screenless Display Market by Type, 2019 - 2022, USD Million
- TABLE 368 Rest of LAMEA Screenless Display Market by Type, 2023 - 2029, USD Million
- TABLE 369 Rest of LAMEA Screenless Display Market by Application, 2019 - 2022, USD Million
- TABLE 370 Rest of LAMEA Screenless Display Market by Application, 2023 - 2029, USD Million
- TABLE 371 key information - Microsoft Corporation
- TABLE 372 Key Information - Google LLC
- TABLE 373 Key Information - BAE Systems PLC
- TABLE 374 Key Information - Avegant Corporation
- TABLE 375 Key Information - RealView Imaging Ltd.
- TABLE 376 Key Information - Holoxica Limited
- TABLE 377 Key Information - SeeReal Technologies S.A.
- TABLE 378 Key Information - MicroVision, Inc.
- TABLE 379 Key Information - Synaptics Incorporated
- TABLE 380 Key Information - Leia, Inc.
List of Figures
- FIG 1 Methodology for the research
- FIG 2 Global Screenless Display Market share by Vertical, 2022
- FIG 3 Global Screenless Display Market share by Vertical, 2029
- FIG 4 Global Screenless Display Market by Vertical, 2019 - 2029, USD Million
- FIG 5 Global Screenless Display Market share by Type, 2022
- FIG 6 Global Screenless Display Market share by Type, 2029
- FIG 7 Global Screenless Display Market by Type, 2019 - 2029, USD Million
- FIG 8 Global Screenless Display Market share by Application, 2022
- FIG 9 Global Screenless Display Market share by Application, 2029
- FIG 10 Global Screenless Display Market by Application, 2019 - 2029, USD Million
- FIG 11 Global Screenless Display Market share by Region, 2022
- FIG 12 Global Screenless Display Market share by Region, 2029
- FIG 13 Global Screenless Display Market by Region, 2019 - 2029, USD Million
- FIG 14 SWOT Analysis: Microsoft Corporation
- FIG 15 SWOT Analysis: Alphabet Inc. (Google LLC)
- FIG 16 SWOT Analysis: BAE SYSTEMS PLC
The Global Screenless Display Market size is expected to reach $9.5 billion by 2029, rising at a market growth of 23.4% CAGR during the forecast period.
Modern display technology, which replaces touch screen technology to address the issues, uses screenless displays. A projector or screen is unnecessary with the emerging display technology known as "screenless display," which enables users to communicate and show data. For their cutting-edge screen-less display technology, several companies are investing in patents. Although this technology is still in its infancy, its usage is anticipated to increase throughout the forecast period due to technological advancements that enable businesses to lower the cost of producing hardware components.
The screenless display also uses visual display and interactive 3D projection technology. Furthermore, during the forecast period, the market for screenless displays is expected to benefit significantly from the increased adoption of next-generation holographic solutions. Screenless displays project visual information through ricocheting light sources like plastic films, mirrors, and fog. In order to determine whether air can be used to display the data, research is now being conducted.
Due to its portability at virtually any location with sufficient circumference, this technology's introduction resolves the display space issue. The market is anticipated to grow due to the screenless display, which is anticipated to address privacy and security flaws and reduce the likelihood of error. A screenless display, a visual picture, uses the human eye to recognize any object or image. Several illustrations of the visual image display are provided below: Heads-up displays, virtual reality goggles, and holographic displays are a few examples.
The image is directly projected onto the retina by retina displays instead of using an intermediary object for light reflection. The synaptic interface entails transmitting data without the use of light straight to the human brain. Most businesses have started using this technology for efficient communication, business, education, and security systems because it has already been tested on humans.
COVID-19 Impact Analysis
The COVID-19 pandemic primarily caused several challenges for the market, including a shortage of skilled workers and project delays or cancellations due to global lockdowns that were either partial or total. In addition, one of the significant end-user of technology is automotive, which has witnessed a notable decline in demand during the pandemic. This has also negatively impacted the demand for screenless display technology during the pandemic period in the automotive sector. However, it is anticipated that the market opportunity for screenless displays after COVID-19 will be strengthened by the surge in the adoption of smart infrastructure solutions worldwide.
Market Growth Factors
Growing adoption in medical demonstration and training
Holographic projections of 3D images give the impression that they are floating in the air when the laser & object beams collide. In medicine, hologram technology projects a thorough 3D representation of internal organs and body parts. This makes it possible for medical personnel to assess diseases and injuries in more detail, leading to an accurate diagnosis. Wearable screenless devices may be the most efficient technology for protecting patient privacy. In addition, because only the user can access the information, wearable screenless displays could decrease the risk. Over the forecast period, the market for screenless displays will grow more quickly due to these factors.
Growth of gaming sector
Holographic projections or head-mounted screens are used to entirely take over the user's vision and transport them into a virtual environment. The gaming scenarios become real to the player. With a 360-degree wide-angle view, there are no restrictions on screen size. Visualizing any object in three dimensions allows viewers to generate floating representations of any object in any location. The viewer does not need computers, monitors, or tablets to create photos or view visual content. The growth of the gaming industry and the wide usage of screenless display technology in gaming is predicted to support the expansion of the screenless display market.
Market Restraining Factors
Need A lot of research before adoption
The retina may suffer harm, eventually leading to blindness. The image projected into the user's sight will undoubtedly obstruct the items in reality and may divert his attention when it is most needed. Additionally, this technology still lacks knowledge and usage to make more accurate assessments. The adoption may therefore be limited because many end-user industry players may not be able to carry out the necessary research efforts given that the screenless display is a relatively new idea. Thus, the screenless display market would witness slow growth.
Type Outlook
By type, the screenless display market is segmented into visual image, retinal display, and synaptic interface. In 2022, the retinal display segment covered a considerable revenue share in the screenless display market. Images are projected directly into the retina with Retinal Direct displays, a category of screenless displays. Because the light is projected directly onto the retina instead of being reflected from an intermediary object, they differ from visual image systems. Once marketed, direct retinal systems hold out the promise of complete privacy when computing work is done in public settings.
Application Outlook
Based on application, the screenless display market is fragmented into holographic projection, head-mounted display, head-up display, and others. In 2022, the holographic projection segment witnessed the largest revenue share in the screenless display market. Holographic technology improves customer-product communication. Virtual holographic assistants are employed in hotel rooms for various tasks, including placing food orders, organizing itineraries, calling cabs, and more. In order to improve engagement, virtual holographic assistants are also employed in voice call services.
Vertical Outlook
On the basis of vertical, the screenless display market is bifurcated into aerospace & defense, automotive, healthcare, consumer electronics, and commercial. The healthcare segment recorded a remarkable revenue share in the screenless display market in 2022. Healthcare training can be conducted using any type of screenless display. Everyone can offer a sizable display of bacteria, anatomy, cells, or anything else that cannot be seen unaided. Holograms have an advantage over screen displays because they allow instructors and students to view a 3D image simultaneously and interact with it to answer any queries.
Regional Outlook
Region wise, the screenless display market is analyzed across North America, Europe, Asia Pacific and LAMEA. In 2022, the North America region led the screenless display market by generating the highest revenue share. Due to the growing investments made by significant market participants in creating next-generation screenless display technologies, the screenless display market in North America has been expanding. In addition, major government organizations & companies in North American nations are heavily investing in developing screenless display technology, fueling the market's expansion.
The market research report covers the analysis of key stake holders of the market. Key companies profiled in the report include Microsoft Corporation, Google LLC, BAE Systems PLC, Avegant Corporation, RealView Imaging Ltd., Holoxica Limited, SeeReal Technologies S.A., MicroVision, Inc., Synaptics Incorporated and Leia, Inc.
Scope of the Study
Market Segments covered in the Report:
By Vertical
- Aerospace & Defense
- Automotive
- Healthcare
- Consumer Electronics
- Commercial
By Type
- Visual Image
- Retinal Display
- Synaptic Interface
By Application
- Holographic Projection
- Head-up Display
- Head-mounted Display
- Others
By Geography
- North America
- US
- Canada
- Mexico
- Rest of North America
- Europe
- Germany
- UK
- France
- Russia
- Spain
- Italy
- Rest of Europe
- Asia Pacific
- China
- Japan
- India
- South Korea
- Singapore
- Malaysia
- Rest of Asia Pacific
- LAMEA
- Brazil
- Argentina
- UAE
- Saudi Arabia
- South Africa
- Nigeria
- Rest of LAMEA
Companies Profiled
- Microsoft Corporation
- Google LLC
- BAE Systems PLC
- Avegant Corporation
- RealView Imaging Ltd.
- Holoxica Limited
- SeeReal Technologies S.A.
- MicroVision, Inc.
- Synaptics Incorporated
- Leia, Inc.
Unique Offerings from KBV Research
- Exhaustive coverage
- Highest number of market tables and figures
- Subscription based model available
- Guaranteed best price
- Assured post sales research support with 10% customization free
Table of Contents
Chapter 1. Market Scope & Methodology
- 1.1 Market Definition
- 1.2 Objectives
- 1.3 Market Scope
- 1.4 Segmentation
- 1.4.1 Global Screenless Display Market, by Vertical
- 1.4.2 Global Screenless Display Market, by Type
- 1.4.3 Global Screenless Display Market, by Application
- 1.4.4 Global Screenless Display Market, by Geography
- 1.5 Methodology for the research
Chapter 2. Market Overview
- 2.1 Introduction
- 2.1.1 Overview
- 2.1.1.1 Market Composition & Scenario
- 2.1.1 Overview
- 2.2 Key Factors Impacting the Market
- 2.2.1 Market Drivers
- 2.2.2 Market Restraints
Chapter 3. Global Screenless Display Market by Vertical
- 3.1 Global Aerospace & Defense Market by Region
- 3.2 Global Automotive Market by Region
- 3.3 Global Healthcare Market by Region
- 3.4 Global Consumer Electronics Market by Region
- 3.5 Global Commercial Market by Region
Chapter 4. Global Screenless Display Market by Type
- 4.1 Global Visual Image Market by Region
- 4.2 Global Retinal Display Market by Region
- 4.3 Global Synaptic Interface Market by Region
Chapter 5. Global Screenless Display Market by Application
- 5.1 Global Holographic Projection Market by Region
- 5.2 Global Head-up Display Market by Region
- 5.3 Global Head-mounted Display Market by Region
- 5.4 Global Others Market by Region
Chapter 6. Global Screenless Display Market by Region
- 6.1 North America Screenless Display Market
- 6.1.1 North America Screenless Display Market by Vertical
- 6.1.1.1 North America Aerospace & Defense Market by Country
- 6.1.1.2 North America Automotive Market by Country
- 6.1.1.3 North America Healthcare Market by Country
- 6.1.1.4 North America Consumer Electronics Market by Country
- 6.1.1.5 North America Commercial Market by Country
- 6.1.2 North America Screenless Display Market by Type
- 6.1.2.1 North America Visual Image Market by Country
- 6.1.2.2 North America Retinal Display Market by Country
- 6.1.2.3 North America Synaptic Interface Market by Country
- 6.1.3 North America Screenless Display Market by Application
- 6.1.3.1 North America Holographic Projection Market by Country
- 6.1.3.2 North America Head-up Display Market by Country
- 6.1.3.3 North America Head-mounted Display Market by Country
- 6.1.3.4 North America Others Market by Country
- 6.1.4 North America Screenless Display Market by Country
- 6.1.4.1 US Screenless Display Market
- 6.1.4.1.1 US Screenless Display Market by Vertical
- 6.1.4.1.2 US Screenless Display Market by Type
- 6.1.4.1.3 US Screenless Display Market by Application
- 6.1.4.2 Canada Screenless Display Market
- 6.1.4.2.1 Canada Screenless Display Market by Vertical
- 6.1.4.2.2 Canada Screenless Display Market by Type
- 6.1.4.2.3 Canada Screenless Display Market by Application
- 6.1.4.3 Mexico Screenless Display Market
- 6.1.4.3.1 Mexico Screenless Display Market by Vertical
- 6.1.4.3.2 Mexico Screenless Display Market by Type
- 6.1.4.3.3 Mexico Screenless Display Market by Application
- 6.1.4.4 Rest of North America Screenless Display Market
- 6.1.4.4.1 Rest of North America Screenless Display Market by Vertical
- 6.1.4.4.2 Rest of North America Screenless Display Market by Type
- 6.1.4.4.3 Rest of North America Screenless Display Market by Application
- 6.1.4.1 US Screenless Display Market
- 6.1.1 North America Screenless Display Market by Vertical
- 6.2 Europe Screenless Display Market
- 6.2.1 Europe Screenless Display Market by Vertical
- 6.2.1.1 Europe Aerospace & Defense Market by Country
- 6.2.1.2 Europe Automotive Market by Country
- 6.2.1.3 Europe Healthcare Market by Country
- 6.2.1.4 Europe Consumer Electronics Market by Country
- 6.2.1.5 Europe Commercial Market by Country
- 6.2.2 Europe Screenless Display Market by Type
- 6.2.2.1 Europe Visual Image Market by Country
- 6.2.2.2 Europe Retinal Display Market by Country
- 6.2.2.3 Europe Synaptic Interface Market by Country
- 6.2.3 Europe Screenless Display Market by Application
- 6.2.3.1 Europe Holographic Projection Market by Country
- 6.2.3.2 Europe Head-up Display Market by Country
- 6.2.3.3 Europe Head-mounted Display Market by Country
- 6.2.3.4 Europe Others Market by Country
- 6.2.4 Europe Screenless Display Market by Country
- 6.2.4.1 Germany Screenless Display Market
- 6.2.4.1.1 Germany Screenless Display Market by Vertical
- 6.2.4.1.2 Germany Screenless Display Market by Type
- 6.2.4.1.3 Germany Screenless Display Market by Application
- 6.2.4.2 UK Screenless Display Market
- 6.2.4.2.1 UK Screenless Display Market by Vertical
- 6.2.4.2.2 UK Screenless Display Market by Type
- 6.2.4.2.3 UK Screenless Display Market by Application
- 6.2.4.3 France Screenless Display Market
- 6.2.4.3.1 France Screenless Display Market by Vertical
- 6.2.4.3.2 France Screenless Display Market by Type
- 6.2.4.3.3 France Screenless Display Market by Application
- 6.2.4.4 Russia Screenless Display Market
- 6.2.4.4.1 Russia Screenless Display Market by Vertical
- 6.2.4.4.2 Russia Screenless Display Market by Type
- 6.2.4.4.3 Russia Screenless Display Market by Application
- 6.2.4.5 Spain Screenless Display Market
- 6.2.4.5.1 Spain Screenless Display Market by Vertical
- 6.2.4.5.2 Spain Screenless Display Market by Type
- 6.2.4.5.3 Spain Screenless Display Market by Application
- 6.2.4.6 Italy Screenless Display Market
- 6.2.4.6.1 Italy Screenless Display Market by Vertical
- 6.2.4.6.2 Italy Screenless Display Market by Type
- 6.2.4.6.3 Italy Screenless Display Market by Application
- 6.2.4.7 Rest of Europe Screenless Display Market
- 6.2.4.7.1 Rest of Europe Screenless Display Market by Vertical
- 6.2.4.7.2 Rest of Europe Screenless Display Market by Type
- 6.2.4.7.3 Rest of Europe Screenless Display Market by Application
- 6.2.4.1 Germany Screenless Display Market
- 6.2.1 Europe Screenless Display Market by Vertical
- 6.3 Asia Pacific Screenless Display Market
- 6.3.1 Asia Pacific Screenless Display Market by Vertical
- 6.3.1.1 Asia Pacific Aerospace & Defense Market by Country
- 6.3.1.2 Asia Pacific Automotive Market by Country
- 6.3.1.3 Asia Pacific Healthcare Market by Country
- 6.3.1.4 Asia Pacific Consumer Electronics Market by Country
- 6.3.1.5 Asia Pacific Commercial Market by Country
- 6.3.2 Asia Pacific Screenless Display Market by Type
- 6.3.2.1 Asia Pacific Visual Image Market by Country
- 6.3.2.2 Asia Pacific Retinal Display Market by Country
- 6.3.2.3 Asia Pacific Synaptic Interface Market by Country
- 6.3.3 Asia Pacific Screenless Display Market by Application
- 6.3.3.1 Asia Pacific Holographic Projection Market by Country
- 6.3.3.2 Asia Pacific Head-up Display Market by Country
- 6.3.3.3 Asia Pacific Head-mounted Display Market by Country
- 6.3.3.4 Asia Pacific Others Market by Country
- 6.3.4 Asia Pacific Screenless Display Market by Country
- 6.3.4.1 China Screenless Display Market
- 6.3.4.1.1 China Screenless Display Market by Vertical
- 6.3.4.1.2 China Screenless Display Market by Type
- 6.3.4.1.3 China Screenless Display Market by Application
- 6.3.4.2 Japan Screenless Display Market
- 6.3.4.2.1 Japan Screenless Display Market by Vertical
- 6.3.4.2.2 Japan Screenless Display Market by Type
- 6.3.4.2.3 Japan Screenless Display Market by Application
- 6.3.4.3 India Screenless Display Market
- 6.3.4.3.1 India Screenless Display Market by Vertical
- 6.3.4.3.2 India Screenless Display Market by Type
- 6.3.4.3.3 India Screenless Display Market by Application
- 6.3.4.4 South Korea Screenless Display Market
- 6.3.4.4.1 South Korea Screenless Display Market by Vertical
- 6.3.4.4.2 South Korea Screenless Display Market by Type
- 6.3.4.4.3 South Korea Screenless Display Market by Application
- 6.3.4.5 Singapore Screenless Display Market
- 6.3.4.5.1 Singapore Screenless Display Market by Vertical
- 6.3.4.5.2 Singapore Screenless Display Market by Type
- 6.3.4.5.3 Singapore Screenless Display Market by Application
- 6.3.4.6 Malaysia Screenless Display Market
- 6.3.4.6.1 Malaysia Screenless Display Market by Vertical
- 6.3.4.6.2 Malaysia Screenless Display Market by Type
- 6.3.4.6.3 Malaysia Screenless Display Market by Application
- 6.3.4.7 Rest of Asia Pacific Screenless Display Market
- 6.3.4.7.1 Rest of Asia Pacific Screenless Display Market by Vertical
- 6.3.4.7.2 Rest of Asia Pacific Screenless Display Market by Type
- 6.3.4.7.3 Rest of Asia Pacific Screenless Display Market by Application
- 6.3.4.1 China Screenless Display Market
- 6.3.1 Asia Pacific Screenless Display Market by Vertical
- 6.4 LAMEA Screenless Display Market
- 6.4.1 LAMEA Screenless Display Market by Vertical
- 6.4.1.1 LAMEA Aerospace & Defense Market by Country
- 6.4.1.2 LAMEA Automotive Market by Country
- 6.4.1.3 LAMEA Healthcare Market by Country
- 6.4.1.4 LAMEA Consumer Electronics Market by Country
- 6.4.1.5 LAMEA Commercial Market by Country
- 6.4.2 LAMEA Screenless Display Market by Type
- 6.4.2.1 LAMEA Visual Image Market by Country
- 6.4.2.2 LAMEA Retinal Display Market by Country
- 6.4.2.3 LAMEA Synaptic Interface Market by Country
- 6.4.3 LAMEA Screenless Display Market by Application
- 6.4.3.1 LAMEA Holographic Projection Market by Country
- 6.4.3.2 LAMEA Head-up Display Market by Country
- 6.4.3.3 LAMEA Head-mounted Display Market by Country
- 6.4.3.4 LAMEA Others Market by Country
- 6.4.4 LAMEA Screenless Display Market by Country
- 6.4.4.1 Brazil Screenless Display Market
- 6.4.4.1.1 Brazil Screenless Display Market by Vertical
- 6.4.4.1.2 Brazil Screenless Display Market by Type
- 6.4.4.1.3 Brazil Screenless Display Market by Application
- 6.4.4.2 Argentina Screenless Display Market
- 6.4.4.2.1 Argentina Screenless Display Market by Vertical
- 6.4.4.2.2 Argentina Screenless Display Market by Type
- 6.4.4.2.3 Argentina Screenless Display Market by Application
- 6.4.4.3 UAE Screenless Display Market
- 6.4.4.3.1 UAE Screenless Display Market by Vertical
- 6.4.4.3.2 UAE Screenless Display Market by Type
- 6.4.4.3.3 UAE Screenless Display Market by Application
- 6.4.4.4 Saudi Arabia Screenless Display Market
- 6.4.4.4.1 Saudi Arabia Screenless Display Market by Vertical
- 6.4.4.4.2 Saudi Arabia Screenless Display Market by Type
- 6.4.4.4.3 Saudi Arabia Screenless Display Market by Application
- 6.4.4.5 South Africa Screenless Display Market
- 6.4.4.5.1 South Africa Screenless Display Market by Vertical
- 6.4.4.5.2 South Africa Screenless Display Market by Type
- 6.4.4.5.3 South Africa Screenless Display Market by Application
- 6.4.4.6 Nigeria Screenless Display Market
- 6.4.4.6.1 Nigeria Screenless Display Market by Vertical
- 6.4.4.6.2 Nigeria Screenless Display Market by Type
- 6.4.4.6.3 Nigeria Screenless Display Market by Application
- 6.4.4.7 Rest of LAMEA Screenless Display Market
- 6.4.4.7.1 Rest of LAMEA Screenless Display Market by Vertical
- 6.4.4.7.2 Rest of LAMEA Screenless Display Market by Type
- 6.4.4.7.3 Rest of LAMEA Screenless Display Market by Application
- 6.4.4.1 Brazil Screenless Display Market
- 6.4.1 LAMEA Screenless Display Market by Vertical
Chapter 7. Company Profiles
- 7.1 Microsoft Corporation
- 7.1.1 Company Overview
- 7.1.2 Financial Analysis
- 7.1.3 Segmental and Regional Analysis
- 7.1.4 Research & Development Expenses
- 7.1.5 SWOT Analysis
- 7.2 Google LLC (Alphabet, Inc.)
- 7.2.1 Company Overview
- 7.2.2 Financial Analysis
- 7.2.3 Segmental and Regional Analysis
- 7.2.4 Research & Development Expense
- 7.2.5 SWOT Analysis
- 7.3 BAE Systems PLC
- 7.3.1 Company Overview
- 7.3.2 Financial Analysis
- 7.3.3 Segmental and Regional Analysis
- 7.3.4 Research & Development Expenses
- 7.3.5 SWOT Analysis
- 7.4 Avegant Corporation
- 7.4.1 Company Overview
- 7.5 RealView Imaging Ltd.
- 7.5.1 Company Overview
- 7.6 Holoxica Limited
- 7.6.1 Company Overview
- 7.7 SeeReal Technologies S.A.
- 7.7.1 Company Overview
- 7.8 MicroVision, Inc.
- 7.8.1 Company Overview
- 7.8.2 Financial Analysis
- 7.8.3 Research & Development Expenses
- 7.9 Synaptics Incorporated
- 7.9.1 Company Overview
- 7.9.2 Financial Analysis
- 7.9.3 Regional Analysis
- 7.9.4 Research & Development Expenses
- 7.10. Leia, Inc.
- 7.10.1 Company Overview