|
|
市場調査レポート
商品コード
1276333
石油・ガス向けフローコンピューターの世界市場規模、シェア、産業動向分析レポート:工程別(中流・下流、上流)、コンポーネント別(ハードウェア、ソフトウェア、サポートサービス)、地域別展望・予測、2023年~2029年Global Flow Computer in Oil & Gas Market Size, Share & Industry Trends Analysis Report By Operation (Midstream & Downstream and Upstream), By Component (Hardware, Software and Support Services), By Regional Outlook and Forecast, 2023 - 2029 |
||||||
|
|
|||||||


| 石油・ガス向けフローコンピューターの世界市場規模、シェア、産業動向分析レポート:工程別(中流・下流、上流)、コンポーネント別(ハードウェア、ソフトウェア、サポートサービス)、地域別展望・予測、2023年~2029年 |
|
出版日: 2023年04月28日
発行: KBV Research
ページ情報: 英文 168 Pages
納期: 即納可能
|
- 全表示
- 概要
- 図表
- 目次
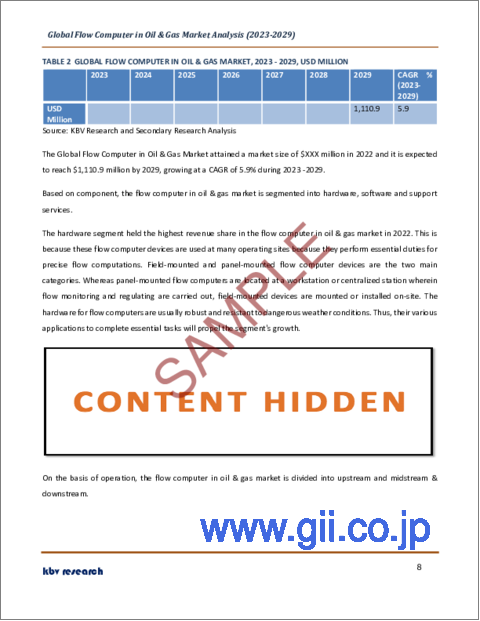
石油・ガス向けフローコンピューター市場規模は、2029年には11億米ドルに達し、予測期間中にCAGR5.9%の市場成長率で上昇すると予測されています。
このため、圧力計、温度プローブ、ガス組成センサー、密度測定ツールなど、流れる質量をモニターするために多くの種類の補助装置が必要となります。また、システム内のさまざまなセンサーから収集されるデータを検証するために、サンプリングシステムやメータープローバーも必要となります。また、配管が乱流である場合、フローコンディショニングユニットの採用は、流体力学の速度プロファイルを検証する上で非常に有効です。
さらに、これらのセンサーはそれぞれ、それが動作する環境に合わせる必要がありますが、フローコンピューターは、それらが動作するプロセスの段階に特有の多くの優先順位に従って、これらすべてのデータソースを同時に集約するように構成することができます。これらの要件は、安全上の懸念や環境状況から生じるものから、ボリュームロギングや組成データに至るまで、通信される流体の種類に依存することがあります。
COVID-19の影響分析
COVID-19の大流行は、市場の拡大と経済全体の状態の両方に大きな影響を与えました。この流行により、いくつかの企業が一時的に営業を停止したり、大幅に業務を縮小したりし、サプライチェーンを混乱させ、経済的な不安定さをもたらしています。COVID-19は、石油・ガス向けフローコンピューター市場のいくつかの側面に影響を及ぼしています。例えば、個人消費の減少により、市場の商品・サービスに対する需要が低下しました。また、多くの石油・ガス会社が一時的に操業を縮小・停止せざるを得なくなり、市場の成長と利益に悪影響を及ぼしました。このように、石油・ガス向けフローコンピューター市場は、初期の損失から回復し、パンデミック後の成長に貢献しました。
市場の成長要因
石油・ガスセクターの技術的進歩
石油・ガスセクターは、より良いオペレーションを実現するために急速にデジタル化を進めており、デジタル経済の出現を促しています。この分野の新たな展開として、デジタルトランスフォーメーションとオートメーションがあります。例えば、デジタルトランスフォーメーションやオートメーションは、遠隔地の陸上や海上の探査現場に最小限の人員を配置することを可能にしています。拡大する車両に供給される石油や燃料は限られており、その結果、運用可能なデジタル油田ソリューションへの需要が高まるため、石油業界は新しく強化された技術を採用せざるを得ません。このように、石油・ガス産業における技術の進歩は、同産業におけるフローコンピューターの導入を増加させ、それによって市場の成長を促進すると予想されます。
石油・ガス産業の絶え間ない成長
シェールガスやタイトガスなどの非在来型石油・ガス資産の継続的な利用や、より効果的な石油・ガス生産率のための最先端技術ソリューションが、業界の浸透に拍車をかけると考えられます。原油生産量を高めるための投資の増加や軽留分へのニーズの高まりは、業界の情勢にプラスの影響を与えるでしょう。このセグメントの統計は、発電資源の高い信頼性と石炭火力発電の変電所の引退によって補完されるでしょう。石油・ガス産業が増加することで、フローコンピューターの導入と利用が急増すると予想され、操作中に提供される利点により、市場の成長を促進します。
市場抑制要因
フローコンピューターに関連する高コスト
フローコンピューターは、石油・ガス分野において、正確で信頼性の高い流量計測を提供することで知られています。高精度で信頼性の高い流量計測を行うためには、専用の部品と製造手順が必要です。最新の部品は、複数の流体パラメータの同時測定や診断・校正機能など、従来の流量測定装置よりも優位な機能や特徴を備えています。それゆえ、所有コストを削減したい事業者は、高い製品コストとメンテナンスコストに制約され、市場の成長を妨げています。
工程の展望
石油・ガス向けフローコンピューター市場は、工程別に上流と中流・下流に分けられます。2022年の石油・ガス向けフローコンピューター市場では、中流・下流セグメントが最大の収益シェアを示しました。これは、中流域のパイプラインやタンカーが原油・天然ガスを輸送するためです。これらのパイプラインは高価で重要な物資を輸送するため、常に監視する必要があります。フローコンピューターは、バルブ制御、バッチ処理、製品インターフェース、メータリング、メータプロービング、チケッティング、メータリングを処理します。フローコンピューターに接続される容積式、超音波式、コリオリ式、タービン式の流量計は、主に中流域のアプリケーションで採用されています。
コンポーネントの展望
石油・ガス向けフローコンピューター市場は、コンポーネントによって、ハードウェア、ソフトウェア、サポートサービスに区分されます。2022年の石油・ガス向けフローコンピューター市場では、サポートサービス部門が有望な成長率を獲得しました。これは、これらのサポートサービスが、投資収益率を最大化するために必要なサービスの全領域を提供するという事実に起因しています。これらのサービスは、プラントのコンセプトからスタートアップまで、アイデアを実践してビジネスをサポートします。事業が軌道に乗った後は、必要に応じてメンテナンス、信頼性、性能に関する幅広いサービスを提供します。
地域別展望
石油・ガス向けフローコンピューター市場は、北米、欧州、アジア太平洋、LAMEAの4地域で分析されています。アジア太平洋地域は、2022年の石油・ガス向けフローコンピューター市場においてかなりの成長率を獲得しました。これは、この地域が他の地域と比較して、新興技術の成長速度が最も速いためです。企業は、石油・ガス部門向けに設計された自動化を提供するために移転しています。この地域の石油・ガス事業者は、計算能力を可能にする流量測定器を設置しています。
目次
第1章 市場範囲と調査手法
- 市場の定義
- 目的
- 市場範囲
- セグメンテーション
- 石油・ガス向けフローコンピューター市場:工程別
- 石油・ガス向けフローコンピューター市場:コンポーネント別
- 石油・ガス向けフローコンピューター市場:地域別
- 調査手法
第2章 市場概要
- イントロダクション
- 概要
- 市場構成とシナリオ
- 概要
- 市場に影響を与える主な要因
- 市場促進要因
- 市場抑制要因
第3章 競合分析- 世界
- 市場シェア分析2022
- 石油・ガス向けフローコンピューター市場に導入された戦略
第4章 石油・ガス向けフローコンピューター市場:工程別
- 世界の中流・下流市場:地域別
- 世界の上流市場:地域別
第5章 石油・ガス向けフローコンピューター市場:コンポーネント別
- 世界のハードウェア市場:地域別
- 世界のソフトウェア市場:地域別
- 世界のサポートサービス市場:地域別
第6章 石油・ガス向けフローコンピューター市場:地域別
- 北米
- 北米の市場:国別
- 米国
- カナダ
- メキシコ
- その他北米地域
- 北米の市場:国別
- 欧州
- 欧州の市場:国別
- ドイツ
- 英国
- フランス
- ロシア
- スペイン
- イタリア
- その他欧州地域
- 欧州の市場:国別
- アジア太平洋
- アジア太平洋の市場:国別
- 中国
- 日本
- インド
- 韓国
- シンガポール
- マレーシア
- その他アジア太平洋地域
- アジア太平洋の市場:国別
- ラテンアメリカ・中東・アフリカ
- ラテンアメリカ・中東・アフリカの市場:国別
- ブラジル
- アルゼンチン
- アラブ首長国連邦
- サウジアラビア
- 南アフリカ
- ナイジェリア
- その他ラテンアメリカ・中東・アフリカ地域
- ラテンアメリカ・中東・アフリカの市場:国別
第7章 企業プロファイル
- Emerson Electric Co
- Honeywell International, Inc
- ABB Ltd
- Thermo Fisher Scientific, Inc
- Schneider Electric SE
- TechnipFMC plc
- Sick AG
- Badger Meter, Inc
- Hoffer Flow Controls, Inc
- Spirax Sarco Limited
LIST OF TABLES
- TABLE 1 Global Flow Computer in Oil & Gas Market, 2019 - 2022, USD Million
- TABLE 2 Global Flow Computer in Oil & Gas Market, 2023 - 2029, USD Million
- TABLE 3 Global Flow Computer in Oil & Gas Market by Operation, 2019 - 2022, USD Million
- TABLE 4 Global Flow Computer in Oil & Gas Market by Operation, 2023 - 2029, USD Million
- TABLE 5 Global Midstream & Downstream Market by Region, 2019 - 2022, USD Million
- TABLE 6 Global Midstream & Downstream Market by Region, 2023 - 2029, USD Million
- TABLE 7 Global Upstream Market by Region, 2019 - 2022, USD Million
- TABLE 8 Global Upstream Market by Region, 2023 - 2029, USD Million
- TABLE 9 Global Flow Computer in Oil & Gas Market by Component, 2019 - 2022, USD Million
- TABLE 10 Global Flow Computer in Oil & Gas Market by Component, 2023 - 2029, USD Million
- TABLE 11 Global Hardware Market by Region, 2019 - 2022, USD Million
- TABLE 12 Global Hardware Market by Region, 2023 - 2029, USD Million
- TABLE 13 Global Software Market by Region, 2019 - 2022, USD Million
- TABLE 14 Global Software Market by Region, 2023 - 2029, USD Million
- TABLE 15 Global Support Services Market by Region, 2019 - 2022, USD Million
- TABLE 16 Global Support Services Market by Region, 2023 - 2029, USD Million
- TABLE 17 Global Flow Computer in Oil & Gas Market by Region, 2019 - 2022, USD Million
- TABLE 18 Global Flow Computer in Oil & Gas Market by Region, 2023 - 2029, USD Million
- TABLE 19 North America Flow Computer in Oil & Gas Market, 2019 - 2022, USD Million
- TABLE 20 North America Flow Computer in Oil & Gas Market, 2023 - 2029, USD Million
- TABLE 21 North America Flow Computer in Oil & Gas Market by Operation, 2019 - 2022, USD Million
- TABLE 22 North America Flow Computer in Oil & Gas Market by Operation, 2023 - 2029, USD Million
- TABLE 23 North America Midstream & Downstream Market by Country, 2019 - 2022, USD Million
- TABLE 24 North America Midstream & Downstream Market by Country, 2023 - 2029, USD Million
- TABLE 25 North America Upstream Market by Country, 2019 - 2022, USD Million
- TABLE 26 North America Upstream Market by Country, 2023 - 2029, USD Million
- TABLE 27 North America Flow Computer in Oil & Gas Market by Component, 2019 - 2022, USD Million
- TABLE 28 North America Flow Computer in Oil & Gas Market by Component, 2023 - 2029, USD Million
- TABLE 29 North America Hardware Market by Country, 2019 - 2022, USD Million
- TABLE 30 North America Hardware Market by Country, 2023 - 2029, USD Million
- TABLE 31 North America Software Market by Country, 2019 - 2022, USD Million
- TABLE 32 North America Software Market by Country, 2023 - 2029, USD Million
- TABLE 33 North America Support Services Market by Country, 2019 - 2022, USD Million
- TABLE 34 North America Support Services Market by Country, 2023 - 2029, USD Million
- TABLE 35 North America Flow Computer in Oil & Gas Market by Country, 2019 - 2022, USD Million
- TABLE 36 North America Flow Computer in Oil & Gas Market by Country, 2023 - 2029, USD Million
- TABLE 37 US Flow Computer in Oil & Gas Market, 2019 - 2022, USD Million
- TABLE 38 US Flow Computer in Oil & Gas Market, 2023 - 2029, USD Million
- TABLE 39 US Flow Computer in Oil & Gas Market by Operation, 2019 - 2022, USD Million
- TABLE 40 US Flow Computer in Oil & Gas Market by Operation, 2023 - 2029, USD Million
- TABLE 41 US Flow Computer in Oil & Gas Market by Component, 2019 - 2022, USD Million
- TABLE 42 US Flow Computer in Oil & Gas Market by Component, 2023 - 2029, USD Million
- TABLE 43 Canada Flow Computer in Oil & Gas Market, 2019 - 2022, USD Million
- TABLE 44 Canada Flow Computer in Oil & Gas Market, 2023 - 2029, USD Million
- TABLE 45 Canada Flow Computer in Oil & Gas Market by Operation, 2019 - 2022, USD Million
- TABLE 46 Canada Flow Computer in Oil & Gas Market by Operation, 2023 - 2029, USD Million
- TABLE 47 Canada Flow Computer in Oil & Gas Market by Component, 2019 - 2022, USD Million
- TABLE 48 Canada Flow Computer in Oil & Gas Market by Component, 2023 - 2029, USD Million
- TABLE 49 Mexico Flow Computer in Oil & Gas Market, 2019 - 2022, USD Million
- TABLE 50 Mexico Flow Computer in Oil & Gas Market, 2023 - 2029, USD Million
- TABLE 51 Mexico Flow Computer in Oil & Gas Market by Operation, 2019 - 2022, USD Million
- TABLE 52 Mexico Flow Computer in Oil & Gas Market by Operation, 2023 - 2029, USD Million
- TABLE 53 Mexico Flow Computer in Oil & Gas Market by Component, 2019 - 2022, USD Million
- TABLE 54 Mexico Flow Computer in Oil & Gas Market by Component, 2023 - 2029, USD Million
- TABLE 55 Rest of North America Flow Computer in Oil & Gas Market, 2019 - 2022, USD Million
- TABLE 56 Rest of North America Flow Computer in Oil & Gas Market, 2023 - 2029, USD Million
- TABLE 57 Rest of North America Flow Computer in Oil & Gas Market by Operation, 2019 - 2022, USD Million
- TABLE 58 Rest of North America Flow Computer in Oil & Gas Market by Operation, 2023 - 2029, USD Million
- TABLE 59 Rest of North America Flow Computer in Oil & Gas Market by Component, 2019 - 2022, USD Million
- TABLE 60 Rest of North America Flow Computer in Oil & Gas Market by Component, 2023 - 2029, USD Million
- TABLE 61 Europe Flow Computer in Oil & Gas Market, 2019 - 2022, USD Million
- TABLE 62 Europe Flow Computer in Oil & Gas Market, 2023 - 2029, USD Million
- TABLE 63 Europe Flow Computer in Oil & Gas Market by Operation, 2019 - 2022, USD Million
- TABLE 64 Europe Flow Computer in Oil & Gas Market by Operation, 2023 - 2029, USD Million
- TABLE 65 Europe Midstream & Downstream Market by Country, 2019 - 2022, USD Million
- TABLE 66 Europe Midstream & Downstream Market by Country, 2023 - 2029, USD Million
- TABLE 67 Europe Upstream Market by Country, 2019 - 2022, USD Million
- TABLE 68 Europe Upstream Market by Country, 2023 - 2029, USD Million
- TABLE 69 Europe Flow Computer in Oil & Gas Market by Component, 2019 - 2022, USD Million
- TABLE 70 Europe Flow Computer in Oil & Gas Market by Component, 2023 - 2029, USD Million
- TABLE 71 Europe Hardware Market by Country, 2019 - 2022, USD Million
- TABLE 72 Europe Hardware Market by Country, 2023 - 2029, USD Million
- TABLE 73 Europe Software Market by Country, 2019 - 2022, USD Million
- TABLE 74 Europe Software Market by Country, 2023 - 2029, USD Million
- TABLE 75 Europe Support Services Market by Country, 2019 - 2022, USD Million
- TABLE 76 Europe Support Services Market by Country, 2023 - 2029, USD Million
- TABLE 77 Europe Flow Computer in Oil & Gas Market by Country, 2019 - 2022, USD Million
- TABLE 78 Europe Flow Computer in Oil & Gas Market by Country, 2023 - 2029, USD Million
- TABLE 79 Germany Flow Computer in Oil & Gas Market, 2019 - 2022, USD Million
- TABLE 80 Germany Flow Computer in Oil & Gas Market, 2023 - 2029, USD Million
- TABLE 81 Germany Flow Computer in Oil & Gas Market by Operation, 2019 - 2022, USD Million
- TABLE 82 Germany Flow Computer in Oil & Gas Market by Operation, 2023 - 2029, USD Million
- TABLE 83 Germany Flow Computer in Oil & Gas Market by Component, 2019 - 2022, USD Million
- TABLE 84 Germany Flow Computer in Oil & Gas Market by Component, 2023 - 2029, USD Million
- TABLE 85 UK Flow Computer in Oil & Gas Market, 2019 - 2022, USD Million
- TABLE 86 UK Flow Computer in Oil & Gas Market, 2023 - 2029, USD Million
- TABLE 87 UK Flow Computer in Oil & Gas Market by Operation, 2019 - 2022, USD Million
- TABLE 88 UK Flow Computer in Oil & Gas Market by Operation, 2023 - 2029, USD Million
- TABLE 89 UK Flow Computer in Oil & Gas Market by Component, 2019 - 2022, USD Million
- TABLE 90 UK Flow Computer in Oil & Gas Market by Component, 2023 - 2029, USD Million
- TABLE 91 France Flow Computer in Oil & Gas Market, 2019 - 2022, USD Million
- TABLE 92 France Flow Computer in Oil & Gas Market, 2023 - 2029, USD Million
- TABLE 93 France Flow Computer in Oil & Gas Market by Operation, 2019 - 2022, USD Million
- TABLE 94 France Flow Computer in Oil & Gas Market by Operation, 2023 - 2029, USD Million
- TABLE 95 France Flow Computer in Oil & Gas Market by Component, 2019 - 2022, USD Million
- TABLE 96 France Flow Computer in Oil & Gas Market by Component, 2023 - 2029, USD Million
- TABLE 97 Russia Flow Computer in Oil & Gas Market, 2019 - 2022, USD Million
- TABLE 98 Russia Flow Computer in Oil & Gas Market, 2023 - 2029, USD Million
- TABLE 99 Russia Flow Computer in Oil & Gas Market by Operation, 2019 - 2022, USD Million
- TABLE 100 Russia Flow Computer in Oil & Gas Market by Operation, 2023 - 2029, USD Million
- TABLE 101 Russia Flow Computer in Oil & Gas Market by Component, 2019 - 2022, USD Million
- TABLE 102 Russia Flow Computer in Oil & Gas Market by Component, 2023 - 2029, USD Million
- TABLE 103 Spain Flow Computer in Oil & Gas Market, 2019 - 2022, USD Million
- TABLE 104 Spain Flow Computer in Oil & Gas Market, 2023 - 2029, USD Million
- TABLE 105 Spain Flow Computer in Oil & Gas Market by Operation, 2019 - 2022, USD Million
- TABLE 106 Spain Flow Computer in Oil & Gas Market by Operation, 2023 - 2029, USD Million
- TABLE 107 Spain Flow Computer in Oil & Gas Market by Component, 2019 - 2022, USD Million
- TABLE 108 Spain Flow Computer in Oil & Gas Market by Component, 2023 - 2029, USD Million
- TABLE 109 Italy Flow Computer in Oil & Gas Market, 2019 - 2022, USD Million
- TABLE 110 Italy Flow Computer in Oil & Gas Market, 2023 - 2029, USD Million
- TABLE 111 Italy Flow Computer in Oil & Gas Market by Operation, 2019 - 2022, USD Million
- TABLE 112 Italy Flow Computer in Oil & Gas Market by Operation, 2023 - 2029, USD Million
- TABLE 113 Italy Flow Computer in Oil & Gas Market by Component, 2019 - 2022, USD Million
- TABLE 114 Italy Flow Computer in Oil & Gas Market by Component, 2023 - 2029, USD Million
- TABLE 115 Rest of Europe Flow Computer in Oil & Gas Market, 2019 - 2022, USD Million
- TABLE 116 Rest of Europe Flow Computer in Oil & Gas Market, 2023 - 2029, USD Million
- TABLE 117 Rest of Europe Flow Computer in Oil & Gas Market by Operation, 2019 - 2022, USD Million
- TABLE 118 Rest of Europe Flow Computer in Oil & Gas Market by Operation, 2023 - 2029, USD Million
- TABLE 119 Rest of Europe Flow Computer in Oil & Gas Market by Component, 2019 - 2022, USD Million
- TABLE 120 Rest of Europe Flow Computer in Oil & Gas Market by Component, 2023 - 2029, USD Million
- TABLE 121 Asia Pacific Flow Computer in Oil & Gas Market, 2019 - 2022, USD Million
- TABLE 122 Asia Pacific Flow Computer in Oil & Gas Market, 2023 - 2029, USD Million
- TABLE 123 Asia Pacific Flow Computer in Oil & Gas Market by Operation, 2019 - 2022, USD Million
- TABLE 124 Asia Pacific Flow Computer in Oil & Gas Market by Operation, 2023 - 2029, USD Million
- TABLE 125 Asia Pacific Midstream & Downstream Market by Country, 2019 - 2022, USD Million
- TABLE 126 Asia Pacific Midstream & Downstream Market by Country, 2023 - 2029, USD Million
- TABLE 127 Asia Pacific Upstream Market by Country, 2019 - 2022, USD Million
- TABLE 128 Asia Pacific Upstream Market by Country, 2023 - 2029, USD Million
- TABLE 129 Asia Pacific Flow Computer in Oil & Gas Market by Component, 2019 - 2022, USD Million
- TABLE 130 Asia Pacific Flow Computer in Oil & Gas Market by Component, 2023 - 2029, USD Million
- TABLE 131 Asia Pacific Hardware Market by Country, 2019 - 2022, USD Million
- TABLE 132 Asia Pacific Hardware Market by Country, 2023 - 2029, USD Million
- TABLE 133 Asia Pacific Software Market by Country, 2019 - 2022, USD Million
- TABLE 134 Asia Pacific Software Market by Country, 2023 - 2029, USD Million
- TABLE 135 Asia Pacific Support Services Market by Country, 2019 - 2022, USD Million
- TABLE 136 Asia Pacific Support Services Market by Country, 2023 - 2029, USD Million
- TABLE 137 Asia Pacific Flow Computer in Oil & Gas Market by Country, 2019 - 2022, USD Million
- TABLE 138 Asia Pacific Flow Computer in Oil & Gas Market by Country, 2023 - 2029, USD Million
- TABLE 139 China Flow Computer in Oil & Gas Market, 2019 - 2022, USD Million
- TABLE 140 China Flow Computer in Oil & Gas Market, 2023 - 2029, USD Million
- TABLE 141 China Flow Computer in Oil & Gas Market by Operation, 2019 - 2022, USD Million
- TABLE 142 China Flow Computer in Oil & Gas Market by Operation, 2023 - 2029, USD Million
- TABLE 143 China Flow Computer in Oil & Gas Market by Component, 2019 - 2022, USD Million
- TABLE 144 China Flow Computer in Oil & Gas Market by Component, 2023 - 2029, USD Million
- TABLE 145 Japan Flow Computer in Oil & Gas Market, 2019 - 2022, USD Million
- TABLE 146 Japan Flow Computer in Oil & Gas Market, 2023 - 2029, USD Million
- TABLE 147 Japan Flow Computer in Oil & Gas Market by Operation, 2019 - 2022, USD Million
- TABLE 148 Japan Flow Computer in Oil & Gas Market by Operation, 2023 - 2029, USD Million
- TABLE 149 Japan Flow Computer in Oil & Gas Market by Component, 2019 - 2022, USD Million
- TABLE 150 Japan Flow Computer in Oil & Gas Market by Component, 2023 - 2029, USD Million
- TABLE 151 India Flow Computer in Oil & Gas Market, 2019 - 2022, USD Million
- TABLE 152 India Flow Computer in Oil & Gas Market, 2023 - 2029, USD Million
- TABLE 153 India Flow Computer in Oil & Gas Market by Operation, 2019 - 2022, USD Million
- TABLE 154 India Flow Computer in Oil & Gas Market by Operation, 2023 - 2029, USD Million
- TABLE 155 India Flow Computer in Oil & Gas Market by Component, 2019 - 2022, USD Million
- TABLE 156 India Flow Computer in Oil & Gas Market by Component, 2023 - 2029, USD Million
- TABLE 157 South Korea Flow Computer in Oil & Gas Market, 2019 - 2022, USD Million
- TABLE 158 South Korea Flow Computer in Oil & Gas Market, 2023 - 2029, USD Million
- TABLE 159 South Korea Flow Computer in Oil & Gas Market by Operation, 2019 - 2022, USD Million
- TABLE 160 South Korea Flow Computer in Oil & Gas Market by Operation, 2023 - 2029, USD Million
- TABLE 161 South Korea Flow Computer in Oil & Gas Market by Component, 2019 - 2022, USD Million
- TABLE 162 South Korea Flow Computer in Oil & Gas Market by Component, 2023 - 2029, USD Million
- TABLE 163 Singapore Flow Computer in Oil & Gas Market, 2019 - 2022, USD Million
- TABLE 164 Singapore Flow Computer in Oil & Gas Market, 2023 - 2029, USD Million
- TABLE 165 Singapore Flow Computer in Oil & Gas Market by Operation, 2019 - 2022, USD Million
- TABLE 166 Singapore Flow Computer in Oil & Gas Market by Operation, 2023 - 2029, USD Million
- TABLE 167 Singapore Flow Computer in Oil & Gas Market by Component, 2019 - 2022, USD Million
- TABLE 168 Singapore Flow Computer in Oil & Gas Market by Component, 2023 - 2029, USD Million
- TABLE 169 Malaysia Flow Computer in Oil & Gas Market, 2019 - 2022, USD Million
- TABLE 170 Malaysia Flow Computer in Oil & Gas Market, 2023 - 2029, USD Million
- TABLE 171 Malaysia Flow Computer in Oil & Gas Market by Operation, 2019 - 2022, USD Million
- TABLE 172 Malaysia Flow Computer in Oil & Gas Market by Operation, 2023 - 2029, USD Million
- TABLE 173 Malaysia Flow Computer in Oil & Gas Market by Component, 2019 - 2022, USD Million
- TABLE 174 Malaysia Flow Computer in Oil & Gas Market by Component, 2023 - 2029, USD Million
- TABLE 175 Rest of Asia Pacific Flow Computer in Oil & Gas Market, 2019 - 2022, USD Million
- TABLE 176 Rest of Asia Pacific Flow Computer in Oil & Gas Market, 2023 - 2029, USD Million
- TABLE 177 Rest of Asia Pacific Flow Computer in Oil & Gas Market by Operation, 2019 - 2022, USD Million
- TABLE 178 Rest of Asia Pacific Flow Computer in Oil & Gas Market by Operation, 2023 - 2029, USD Million
- TABLE 179 Rest of Asia Pacific Flow Computer in Oil & Gas Market by Component, 2019 - 2022, USD Million
- TABLE 180 Rest of Asia Pacific Flow Computer in Oil & Gas Market by Component, 2023 - 2029, USD Million
- TABLE 181 LAMEA Flow Computer in Oil & Gas Market, 2019 - 2022, USD Million
- TABLE 182 LAMEA Flow Computer in Oil & Gas Market, 2023 - 2029, USD Million
- TABLE 183 LAMEA Flow Computer in Oil & Gas Market by Operation, 2019 - 2022, USD Million
- TABLE 184 LAMEA Flow Computer in Oil & Gas Market by Operation, 2023 - 2029, USD Million
- TABLE 185 LAMEA Midstream & Downstream Market by Country, 2019 - 2022, USD Million
- TABLE 186 LAMEA Midstream & Downstream Market by Country, 2023 - 2029, USD Million
- TABLE 187 LAMEA Upstream Market by Country, 2019 - 2022, USD Million
- TABLE 188 LAMEA Upstream Market by Country, 2023 - 2029, USD Million
- TABLE 189 LAMEA Flow Computer in Oil & Gas Market by Component, 2019 - 2022, USD Million
- TABLE 190 LAMEA Flow Computer in Oil & Gas Market by Component, 2023 - 2029, USD Million
- TABLE 191 LAMEA Hardware Market by Country, 2019 - 2022, USD Million
- TABLE 192 LAMEA Hardware Market by Country, 2023 - 2029, USD Million
- TABLE 193 LAMEA Software Market by Country, 2019 - 2022, USD Million
- TABLE 194 LAMEA Software Market by Country, 2023 - 2029, USD Million
- TABLE 195 LAMEA Support Services Market by Country, 2019 - 2022, USD Million
- TABLE 196 LAMEA Support Services Market by Country, 2023 - 2029, USD Million
- TABLE 197 LAMEA Flow Computer in Oil & Gas Market by Country, 2019 - 2022, USD Million
- TABLE 198 LAMEA Flow Computer in Oil & Gas Market by Country, 2023 - 2029, USD Million
- TABLE 199 Brazil Flow Computer in Oil & Gas Market, 2019 - 2022, USD Million
- TABLE 200 Brazil Flow Computer in Oil & Gas Market, 2023 - 2029, USD Million
- TABLE 201 Brazil Flow Computer in Oil & Gas Market by Operation, 2019 - 2022, USD Million
- TABLE 202 Brazil Flow Computer in Oil & Gas Market by Operation, 2023 - 2029, USD Million
- TABLE 203 Brazil Flow Computer in Oil & Gas Market by Component, 2019 - 2022, USD Million
- TABLE 204 Brazil Flow Computer in Oil & Gas Market by Component, 2023 - 2029, USD Million
- TABLE 205 Argentina Flow Computer in Oil & Gas Market, 2019 - 2022, USD Million
- TABLE 206 Argentina Flow Computer in Oil & Gas Market, 2023 - 2029, USD Million
- TABLE 207 Argentina Flow Computer in Oil & Gas Market by Operation, 2019 - 2022, USD Million
- TABLE 208 Argentina Flow Computer in Oil & Gas Market by Operation, 2023 - 2029, USD Million
- TABLE 209 Argentina Flow Computer in Oil & Gas Market by Component, 2019 - 2022, USD Million
- TABLE 210 Argentina Flow Computer in Oil & Gas Market by Component, 2023 - 2029, USD Million
- TABLE 211 UAE Flow Computer in Oil & Gas Market, 2019 - 2022, USD Million
- TABLE 212 UAE Flow Computer in Oil & Gas Market, 2023 - 2029, USD Million
- TABLE 213 UAE Flow Computer in Oil & Gas Market by Operation, 2019 - 2022, USD Million
- TABLE 214 UAE Flow Computer in Oil & Gas Market by Operation, 2023 - 2029, USD Million
- TABLE 215 UAE Flow Computer in Oil & Gas Market by Component, 2019 - 2022, USD Million
- TABLE 216 UAE Flow Computer in Oil & Gas Market by Component, 2023 - 2029, USD Million
- TABLE 217 Saudi Arabia Flow Computer in Oil & Gas Market, 2019 - 2022, USD Million
- TABLE 218 Saudi Arabia Flow Computer in Oil & Gas Market, 2023 - 2029, USD Million
- TABLE 219 Saudi Arabia Flow Computer in Oil & Gas Market by Operation, 2019 - 2022, USD Million
- TABLE 220 Saudi Arabia Flow Computer in Oil & Gas Market by Operation, 2023 - 2029, USD Million
- TABLE 221 Saudi Arabia Flow Computer in Oil & Gas Market by Component, 2019 - 2022, USD Million
- TABLE 222 Saudi Arabia Flow Computer in Oil & Gas Market by Component, 2023 - 2029, USD Million
- TABLE 223 South Africa Flow Computer in Oil & Gas Market, 2019 - 2022, USD Million
- TABLE 224 South Africa Flow Computer in Oil & Gas Market, 2023 - 2029, USD Million
- TABLE 225 South Africa Flow Computer in Oil & Gas Market by Operation, 2019 - 2022, USD Million
- TABLE 226 South Africa Flow Computer in Oil & Gas Market by Operation, 2023 - 2029, USD Million
- TABLE 227 South Africa Flow Computer in Oil & Gas Market by Component, 2019 - 2022, USD Million
- TABLE 228 South Africa Flow Computer in Oil & Gas Market by Component, 2023 - 2029, USD Million
- TABLE 229 Nigeria Flow Computer in Oil & Gas Market, 2019 - 2022, USD Million
- TABLE 230 Nigeria Flow Computer in Oil & Gas Market, 2023 - 2029, USD Million
- TABLE 231 Nigeria Flow Computer in Oil & Gas Market by Operation, 2019 - 2022, USD Million
- TABLE 232 Nigeria Flow Computer in Oil & Gas Market by Operation, 2023 - 2029, USD Million
- TABLE 233 Nigeria Flow Computer in Oil & Gas Market by Component, 2019 - 2022, USD Million
- TABLE 234 Nigeria Flow Computer in Oil & Gas Market by Component, 2023 - 2029, USD Million
- TABLE 235 Rest of LAMEA Flow Computer in Oil & Gas Market, 2019 - 2022, USD Million
- TABLE 236 Rest of LAMEA Flow Computer in Oil & Gas Market, 2023 - 2029, USD Million
- TABLE 237 Rest of LAMEA Flow Computer in Oil & Gas Market by Operation, 2019 - 2022, USD Million
- TABLE 238 Rest of LAMEA Flow Computer in Oil & Gas Market by Operation, 2023 - 2029, USD Million
- TABLE 239 Rest of LAMEA Flow Computer in Oil & Gas Market by Component, 2019 - 2022, USD Million
- TABLE 240 Rest of LAMEA Flow Computer in Oil & Gas Market by Component, 2023 - 2029, USD Million
- TABLE 241 Key Information - Emerson Electric Co.
- TABLE 242 Key Information - Honeywell International, Inc.
- TABLE 243 Key Information - ABB Ltd.
- TABLE 244 Key Information - Thermo Fisher Scientific, Inc.
- TABLE 245 Key information - Schneider Electric SE
- TABLE 246 Key Information - TechnipFMC plc
- TABLE 247 Key Information - Sick AG
- TABLE 248 Key Information - Badger Meter, Inc.
- TABLE 249 Key Information - Hoffer Flow Controls, Inc.
- TABLE 250 Key information - Spirax Sarco Limited
List of Figures
- FIG 1 Methodology for the research
- FIG 2 Market Share Analysis, 2022
- FIG 3 Global Flow Computer in Oil & Gas Market Share by Operation, 2022
- FIG 4 Global Flow Computer in Oil & Gas Market Share by Operation, 2029
- FIG 5 Global Flow Computer in Oil & Gas Market by Operation, 2019 - 2029, USD Million
- FIG 6 Global Flow Computer in Oil & Gas Market Share by Component, 2022
- FIG 7 Global Flow Computer in Oil & Gas Market Share by Component, 2029
- FIG 8 Global Flow Computer in Oil & Gas Market by Component, 2019 - 2029, USD Million
- FIG 9 Global Flow Computer in Oil & Gas Market Share by Region, 2022
- FIG 10 Global Flow Computer in Oil & Gas Market Share by Region, 2029
- FIG 11 Global Flow Computer in Oil & Gas Market by Region, 2019 - 2029, USD Million
- FIG 12 Recent strategies and developments: Emerson Electric Co.
- FIG 13 Swot analysis: Honeywell international, inc.
- FIG 14 SWOT Analysis: ABB Ltd.
- FIG 15 Swot analysis: thermo fisher scientific, inc.
- FIG 16 Swot analysis: Schneider Electric SE
- FIG 17 SWOT Analysis: Sick AG
The Global Flow Computer in Oil & Gas Market size is expected to reach $1.1 billion by 2029, rising at a market growth of 5.9% CAGR during the forecast period.
In the oil and gas business, flow computer equipment is used to measure the supply of liquid and gas. Using data from temperature transmitters, flow meters, and pressure transmitters, flow computers determine the exact flow of liquid or gas going through the pipelines. It accurately calculates the flow rate and logs data, important events, and alarms with the help of interfaced devices. The data is subsequently sent to other computers or workstations for management and accounting purposes.
The need for exact measurement arises from the high oil and gas resources cost. This means that the oil and gas sectors require flow computers at numerous sites for precise flow computing as well as trustworthy monitoring, flow measurement, and control. There are a variety of different controls used in the oil & gas sector that are required to keep a close eye on fluid mass dynamics.
As a result, many types of supporting equipment are needed to monitor the flowing mass, such as pressure gauges, temperature probes, gas composition sensors, and density measurement tools. Sampling systems and meter provers are also required to validate the data being gathered from the various sensors in the system. In addition, when the pipe is turbulent, the employment of a flow conditioning unit can be extremely helpful in verifying the velocity profile of the flow dynamics.
Moreover, each of these sensors must be tailored to the environment in which it operates, but a flow computer can be configured to aggregate all of these data sources concurrently, according to the many priorities that are unique to the stage of the process wherein they operate. These requirements can range from those resulting from safety concerns and environmental circumstances to volume logging or composition data, all dependent on the fluid type being communicated.
COVID-19 Impact Analysis
The COVID-19 pandemic has profoundly impacted both market expansion and the state of the economy as a whole. Several businesses have temporarily stopped operating or substantially reduced their operations due to the outbreak, disrupting supply chains and creating economic instability. COVID-19 has impacted several aspects of the flow computer in the oil & gas market. For instance, the decline in consumer spending has resulted in a fall in the market's demand for goods and services. Also, many oil and gas companies had to temporarily reduce or stop their operations, which had a detrimental effect on the market's growth and profits. thereby aiding the flow computer in the oil & gas market to recover from the initial losses and grow in the post-pandemic period.
Market Growth Factors
Oil and gas sector's technological advancement
The oil and gas sector are rapidly going digital with better operations, fostering the emergence of the digital economy. New developments in this sector include digital transformation and automation. For example, digital transformation or automation makes deploying minimal personnel in remote onshore and offshore exploration sites possible. Due to the limited oil or fuel supply for the expanding number of vehicles and the resulting demand for operational digital oilfield solutions, the oil industry is forced to adopt new and enhanced technology. Thus, the technological advancement in the oil & gas industry is expected to increase the implementation of flow computers in the sector, thereby propelling market growth.
The constant growth of oil & gas industry
The industry's penetration will be fueled by the ongoing use of unconventional oil and gas assets, including shale and tight gas, and cutting-edge technical solutions for more effective oil and gas production rates. Increased investment to enhance crude oil output and increasing need for light distillates will positively impact the industry landscape. The segment statistics will be complemented by the high dependability of the power generation resources and the retirement of the coal-fired power substations. The increased oil & gas industry is expected to surge the adoption and utilization of flow computer due to its provided benefits during the operation and thus drive the market's growth.
Market Restraining Factors
The high cost associated with flow computer
Flow computers are renowned for offering precise and trustworthy flow measurements in the oil and gas sector. They need specialized parts and manufacturing procedures to produce flow measurements that are highly accurate and trustworthy. Modern components offer further functionality and features that give them an edge over conventional flow measurements devices, such as the simultaneous measurement of several fluid parameters and diagnostic and calibration features. Hence, operators wanting to reduce their cost of ownership are constrained by high product and maintenance costs, hindering market growth.
Operation Outlook
On the basis of operation, the flow computer in oil & gas market is divided into upstream and midstream & downstream. The midstream & downstream segment witnessed the largest revenue share in the flow computer in oil & gas market in 2022. This is because pipelines and tankers in the midstream transport crude oil and natural gas. Since these pipelines transport expensive and critical goods, they need to be constantly watched. The flow computers handle valve control, batching, product interface, metering, meter proving, ticketing, and metering. Positive displacement, ultrasonic, Coriolis, and turbine flow meters connected to flow computers are mostly employed in midstream applications.
Component Outlook
Based on component, the flow computer in oil & gas market is segmented into hardware, software and support services. The support services segment acquired a promising growth rate in the flow computer in oil & gas market in 2022. This is owing to the fact that these support services offer the whole spectrum of services necessary to maximize the return on investment. These services put the ideas into practice to support the business from plant concept to startup. Once the business is up and operating, they provide a wide range of maintenance, dependability, and performance services as required.
Regional Outlook
Region-wise, the flow computer in oil & gas market is analyzed across North America, Europe, Asia Pacific, and LAMEA. The Asia Pacific region garnered a considerable growth rate in the flow computer in oil & gas market in 2022. This is due to the region's quickest growth rates for emerging technologies compared to other regions. Companies are relocating to offer automation designed for the oil and gas sector. Oil and gas businesses in the region are installing flow-metering instruments that enable computational power.
The market research report covers the analysis of key stake holders of the market. Key companies profiled in the report include Emerson Electric Co., Honeywell International, Inc., ABB Ltd., Thermo Fisher Scientific, Inc., Schneider Electric SE, TechnipFMC plc, Sick AG, Badger Meter, Inc., Hoffer Flow Controls, Inc., and Spirax Sarco Limited.
Strategies deployed in Flow Computer in Oil & Gas Market
Jan-2023: Badger Meter, Inc. took over Syrinix, Ltd., a company focused on providing intelligent water monitoring solutions. The acquisition aids the company in expanding its digital solutions through utilizing BEACON® Software as a Service and ORION® Cellular endpoints, for operationalizing real-time data into actionable insights that enhance resiliency, efficiency, and sustainability.
Sep-2021: Thermo Fisher Scientific Inc. made an enhancement to its AutoSERIES Flow Computer product portfolio, by adding Thermo Scientific AutoFLEX EFM to it. AutoFLEX EFM offers a single hardware platform together with scalable capabilities which could be used in basic measurement sites to complex multiple-run delivery stations. AutoSERIES Flow Computer product suite has been used for flow measurement and process control in the oil and gas sector.
Jan-2021: Badger Meter acquired Analytical Technology, Inc., a water quality monitoring systems provider. The acquisition helped the company in expanding its geographical footprint and broadened its smart water offerings.
Oct-2020: Emerson Electric took over Open Systems International, a leading supplier of open automation solutions for real-time management and optimization of complex production. This acquisition aimed to deliver utility customers with the ability to improve energy efficiency from generation by customer delivery, allowing the broader industry goal of grid stability and renewables integration.
May-2020: Hoffer announced the launch of the HIT-4G, a new compact Gas Measurement Rate and Total Computer with pressure, temperature, and AGA-8 compressibility compensation. It is the second product in its HIT-4 series. It delivers pressure and temperature-compensated gas flow measurement and provides Modbus, dual totalizers, and data logging features. In addition, it features a 6-digit rate display and separate 8-digit resettable and non-resettable flow totalizers and is configurable for 4-20 mA loop power or DC power.
Oct-2019: Emerson Electric introduced Movicon.NExT™ 4.2, the advanced automation platform, is a flexible and modular platform that delivers supervision, local HMI, and analytics. This scales from WebHMI and small applications on embedded Linux devices to large Windows server systems, enabling users for achieving performance and sustainability improvements, one step easily, at a time, and in a cost-effective manner.
Feb-2019: Emerson took over Intelligent Platforms from General Electric to enhance its automation for industrial and process customers for increasing its capabilities in machine control.
Scope of the Study
Market Segments covered in the Report:
By Operation
- Midstream & Downstream
- Upstream
By Component
- Hardware
- Software
- Support Services
By Geography
- North America
- US
- Canada
- Mexico
- Rest of North America
- Europe
- Germany
- UK
- France
- Russia
- Spain
- Italy
- Rest of Europe
- Asia Pacific
- China
- Japan
- India
- South Korea
- Singapore
- Malaysia
- Rest of Asia Pacific
- LAMEA
- Brazil
- Argentina
- UAE
- Saudi Arabia
- South Africa
- Nigeria
- Rest of LAMEA
Companies Profiled
- Emerson Electric Co.
- Honeywell International, Inc.
- ABB Ltd.
- Thermo Fisher Scientific, Inc.
- Schneider Electric SE
- TechnipFMC plc
- Sick AG
- Badger Meter, Inc.
- Hoffer Flow Controls, Inc.
- Spirax Sarco Limited
Unique Offerings from KBV Research
- Exhaustive coverage
- Highest number of market tables and figures
- Subscription based model available
- Guaranteed best price
- Assured post sales research support with 10% customization free
Table of Contents
Chapter 1. Market Scope & Methodology
- 1.1 Market Definition
- 1.2 Objectives
- 1.3 Market Scope
- 1.4 Segmentation
- 1.4.1 Global Flow Computer in Oil & Gas Market, by Operation
- 1.4.2 Global Flow Computer in Oil & Gas Market, by Component
- 1.4.3 Global Flow Computer in Oil & Gas Market, by Geography
- 1.5 Methodology for the research
Chapter 2. Market Overview
- 2.1 Introduction
- 2.1.1 Overview
- 2.1.1.1 Market composition & scenario
- 2.1.1 Overview
- 2.2 Key Factors Impacting the Market
- 2.2.1 Market Drivers
- 2.2.2 Market Restraints
Chapter 3. Competition Analysis - Global
- 3.1 Market Share Analysis, 2022
- 3.2 Strategies deployed in Flow Computer in Oil & Gas Market
Chapter 4. Global Flow Computer in Oil & Gas Market by Operation
- 4.1 Global Midstream & Downstream Market by Region
- 4.2 Global Upstream Market by Region
Chapter 5. Global Flow Computer in Oil & Gas Market by Component
- 5.1 Global Hardware Market by Region
- 5.2 Global Software Market by Region
- 5.3 Global Support Services Market by Region
Chapter 6. Global Flow Computer in Oil & Gas Market by Region
- 6.1 North America Flow Computer in Oil & Gas Market
- 6.1.1 North America Flow Computer in Oil & Gas Market by Operation
- 6.1.1.1 North America Midstream & Downstream Market by Country
- 6.1.1.2 North America Upstream Market by Country
- 6.1.2 North America Flow Computer in Oil & Gas Market by Component
- 6.1.2.1 North America Hardware Market by Country
- 6.1.2.2 North America Software Market by Country
- 6.1.2.3 North America Support Services Market by Country
- 6.1.3 North America Flow Computer in Oil & Gas Market by Country
- 6.1.3.1 US Flow Computer in Oil & Gas Market
- 6.1.3.1.1 US Flow Computer in Oil & Gas Market by Operation
- 6.1.3.1.2 US Flow Computer in Oil & Gas Market by Component
- 6.1.3.2 Canada Flow Computer in Oil & Gas Market
- 6.1.3.2.1 Canada Flow Computer in Oil & Gas Market by Operation
- 6.1.3.2.2 Canada Flow Computer in Oil & Gas Market by Component
- 6.1.3.3 Mexico Flow Computer in Oil & Gas Market
- 6.1.3.3.1 Mexico Flow Computer in Oil & Gas Market by Operation
- 6.1.3.3.2 Mexico Flow Computer in Oil & Gas Market by Component
- 6.1.3.4 Rest of North America Flow Computer in Oil & Gas Market
- 6.1.3.4.1 Rest of North America Flow Computer in Oil & Gas Market by Operation
- 6.1.3.4.2 Rest of North America Flow Computer in Oil & Gas Market by Component
- 6.1.3.1 US Flow Computer in Oil & Gas Market
- 6.1.1 North America Flow Computer in Oil & Gas Market by Operation
- 6.2 Europe Flow Computer in Oil & Gas Market
- 6.2.1 Europe Flow Computer in Oil & Gas Market by Operation
- 6.2.1.1 Europe Midstream & Downstream Market by Country
- 6.2.1.2 Europe Upstream Market by Country
- 6.2.2 Europe Flow Computer in Oil & Gas Market by Component
- 6.2.2.1 Europe Hardware Market by Country
- 6.2.2.2 Europe Software Market by Country
- 6.2.2.3 Europe Support Services Market by Country
- 6.2.3 Europe Flow Computer in Oil & Gas Market by Country
- 6.2.3.1 Germany Flow Computer in Oil & Gas Market
- 6.2.3.1.1 Germany Flow Computer in Oil & Gas Market by Operation
- 6.2.3.1.2 Germany Flow Computer in Oil & Gas Market by Component
- 6.2.3.2 UK Flow Computer in Oil & Gas Market
- 6.2.3.2.1 UK Flow Computer in Oil & Gas Market by Operation
- 6.2.3.2.2 UK Flow Computer in Oil & Gas Market by Component
- 6.2.3.3 France Flow Computer in Oil & Gas Market
- 6.2.3.3.1 France Flow Computer in Oil & Gas Market by Operation
- 6.2.3.3.2 France Flow Computer in Oil & Gas Market by Component
- 6.2.3.4 Russia Flow Computer in Oil & Gas Market
- 6.2.3.4.1 Russia Flow Computer in Oil & Gas Market by Operation
- 6.2.3.4.2 Russia Flow Computer in Oil & Gas Market by Component
- 6.2.3.5 Spain Flow Computer in Oil & Gas Market
- 6.2.3.5.1 Spain Flow Computer in Oil & Gas Market by Operation
- 6.2.3.5.2 Spain Flow Computer in Oil & Gas Market by Component
- 6.2.3.6 Italy Flow Computer in Oil & Gas Market
- 6.2.3.6.1 Italy Flow Computer in Oil & Gas Market by Operation
- 6.2.3.6.2 Italy Flow Computer in Oil & Gas Market by Component
- 6.2.3.7 Rest of Europe Flow Computer in Oil & Gas Market
- 6.2.3.7.1 Rest of Europe Flow Computer in Oil & Gas Market by Operation
- 6.2.3.7.2 Rest of Europe Flow Computer in Oil & Gas Market by Component
- 6.2.3.1 Germany Flow Computer in Oil & Gas Market
- 6.2.1 Europe Flow Computer in Oil & Gas Market by Operation
- 6.3 Asia Pacific Flow Computer in Oil & Gas Market
- 6.3.1 Asia Pacific Flow Computer in Oil & Gas Market by Operation
- 6.3.1.1 Asia Pacific Midstream & Downstream Market by Country
- 6.3.1.2 Asia Pacific Upstream Market by Country
- 6.3.2 Asia Pacific Flow Computer in Oil & Gas Market by Component
- 6.3.2.1 Asia Pacific Hardware Market by Country
- 6.3.2.2 Asia Pacific Software Market by Country
- 6.3.2.3 Asia Pacific Support Services Market by Country
- 6.3.3 Asia Pacific Flow Computer in Oil & Gas Market by Country
- 6.3.3.1 China Flow Computer in Oil & Gas Market
- 6.3.3.1.1 China Flow Computer in Oil & Gas Market by Operation
- 6.3.3.1.2 China Flow Computer in Oil & Gas Market by Component
- 6.3.3.2 Japan Flow Computer in Oil & Gas Market
- 6.3.3.2.1 Japan Flow Computer in Oil & Gas Market by Operation
- 6.3.3.2.2 Japan Flow Computer in Oil & Gas Market by Component
- 6.3.3.3 India Flow Computer in Oil & Gas Market
- 6.3.3.3.1 India Flow Computer in Oil & Gas Market by Operation
- 6.3.3.3.2 India Flow Computer in Oil & Gas Market by Component
- 6.3.3.4 South Korea Flow Computer in Oil & Gas Market
- 6.3.3.4.1 South Korea Flow Computer in Oil & Gas Market by Operation
- 6.3.3.4.2 South Korea Flow Computer in Oil & Gas Market by Component
- 6.3.3.5 Singapore Flow Computer in Oil & Gas Market
- 6.3.3.5.1 Singapore Flow Computer in Oil & Gas Market by Operation
- 6.3.3.5.2 Singapore Flow Computer in Oil & Gas Market by Component
- 6.3.3.6 Malaysia Flow Computer in Oil & Gas Market
- 6.3.3.6.1 Malaysia Flow Computer in Oil & Gas Market by Operation
- 6.3.3.6.2 Malaysia Flow Computer in Oil & Gas Market by Component
- 6.3.3.7 Rest of Asia Pacific Flow Computer in Oil & Gas Market
- 6.3.3.7.1 Rest of Asia Pacific Flow Computer in Oil & Gas Market by Operation
- 6.3.3.7.2 Rest of Asia Pacific Flow Computer in Oil & Gas Market by Component
- 6.3.3.1 China Flow Computer in Oil & Gas Market
- 6.3.1 Asia Pacific Flow Computer in Oil & Gas Market by Operation
- 6.4 LAMEA Flow Computer in Oil & Gas Market
- 6.4.1 LAMEA Flow Computer in Oil & Gas Market by Operation
- 6.4.1.1 LAMEA Midstream & Downstream Market by Country
- 6.4.1.2 LAMEA Upstream Market by Country
- 6.4.2 LAMEA Flow Computer in Oil & Gas Market by Component
- 6.4.2.1 LAMEA Hardware Market by Country
- 6.4.2.2 LAMEA Software Market by Country
- 6.4.2.3 LAMEA Support Services Market by Country
- 6.4.3 LAMEA Flow Computer in Oil & Gas Market by Country
- 6.4.3.1 Brazil Flow Computer in Oil & Gas Market
- 6.4.3.1.1 Brazil Flow Computer in Oil & Gas Market by Operation
- 6.4.3.1.2 Brazil Flow Computer in Oil & Gas Market by Component
- 6.4.3.2 Argentina Flow Computer in Oil & Gas Market
- 6.4.3.2.1 Argentina Flow Computer in Oil & Gas Market by Operation
- 6.4.3.2.2 Argentina Flow Computer in Oil & Gas Market by Component
- 6.4.3.3 UAE Flow Computer in Oil & Gas Market
- 6.4.3.3.1 UAE Flow Computer in Oil & Gas Market by Operation
- 6.4.3.3.2 UAE Flow Computer in Oil & Gas Market by Component
- 6.4.3.4 Saudi Arabia Flow Computer in Oil & Gas Market
- 6.4.3.4.1 Saudi Arabia Flow Computer in Oil & Gas Market by Operation
- 6.4.3.4.2 Saudi Arabia Flow Computer in Oil & Gas Market by Component
- 6.4.3.5 South Africa Flow Computer in Oil & Gas Market
- 6.4.3.5.1 South Africa Flow Computer in Oil & Gas Market by Operation
- 6.4.3.5.2 South Africa Flow Computer in Oil & Gas Market by Component
- 6.4.3.6 Nigeria Flow Computer in Oil & Gas Market
- 6.4.3.6.1 Nigeria Flow Computer in Oil & Gas Market by Operation
- 6.4.3.6.2 Nigeria Flow Computer in Oil & Gas Market by Component
- 6.4.3.7 Rest of LAMEA Flow Computer in Oil & Gas Market
- 6.4.3.7.1 Rest of LAMEA Flow Computer in Oil & Gas Market by Operation
- 6.4.3.7.2 Rest of LAMEA Flow Computer in Oil & Gas Market by Component
- 6.4.3.1 Brazil Flow Computer in Oil & Gas Market
- 6.4.1 LAMEA Flow Computer in Oil & Gas Market by Operation
Chapter 7. Company Profiles
- 7.1 Emerson Electric Co.
- 7.1.1 Company Overview
- 7.1.2 Financial Analysis
- 7.1.3 Segmental and Regional Analysis
- 7.1.4 Research & Development Expense
- 7.1.5 Recent strategies and developments:
- 7.1.5.1 Product Launches and Product Expansions:
- 7.1.5.2 Acquisition and Mergers:
- 7.2 Honeywell International, Inc.
- 7.2.1 Company Overview
- 7.2.2 Financial Analysis
- 7.2.3 Segmental and Regional Analysis
- 7.2.4 Research & Development Expenses
- 7.2.5 SWOT Analysis
- 7.3 ABB Ltd.
- 7.3.1 Company Overview
- 7.3.2 Financial Analysis
- 7.3.3 Segmental and Regional Analysis
- 7.3.4 Research & Development Expense
- 7.3.5 SWOT Analysis
- 7.4 Thermo Fisher Scientific, Inc.
- 7.4.1 Company Overview
- 7.4.2 Financial Analysis
- 7.4.3 Segmental and Regional Analysis
- 7.4.4 Research & Development Expenses
- 7.4.5 Recent strategies and developments:
- 7.4.5.1 Product Launches and Product Expansions:
- 7.4.6 SWOT Analysis
- 7.5 Schneider Electric SE
- 7.5.1 Company Overview
- 7.5.2 Financial Analysis
- 7.5.3 Segmental and Regional Analysis
- 7.5.4 Research & Development Expense
- 7.5.5 SWOT Analysis
- 7.6 TechnipFMC plc
- 7.6.1 Company Overview
- 7.6.2 Financial Analysis
- 7.6.3 Segmental and Regional Analysis
- 7.6.4 Research & Development Expenses
- 7.7 Sick AG
- 7.7.1 Company Overview
- 7.7.2 Financial Analysis
- 7.7.3 Segmental and Regional Analysis
- 7.7.4 Research & Development Expense
- 7.7.5 SWOT Analysis
- 7.8 Badger Meter, Inc.
- 7.8.1 Company Overview
- 7.8.2 Financial Analysis
- 7.8.3 Regional Analysis
- 7.8.4 Research & Development Expenses
- 7.8.5 Recent strategies and developments:
- 7.8.5.1 Acquisition and Mergers:
- 7.9 Hoffer Flow Controls, Inc.
- 7.9.1 Company Overview
- 7.9.2 Recent strategies and developments:
- 7.9.2.1 Product Launches and Product Expansions:
- 7.10. Spirax Sarco Limited
- 7.10.1 Company Overview
- 7.10.2 Financial Analysis
- 7.10.3 Segmental and Regional Analysis
- 7.10.4 Research & Development Expenses