|
|
市場調査レポート
商品コード
1261582
セキュリティ保証の世界市場の規模、シェア、業界動向分析レポートタイプ別(ビジネスアプリケーション、システム&ネットワークインフラ、モビリティソリューション)、組織規模別、業種別、地域別展望と予測、2022~2028年Global Security Assurance Market Size, Share & Industry Trends Analysis Report By Type (Business Applications, System & Network Infrastructure, and Mobility Solutions), By Organization Size, By Vertical, By Regional Outlook and Forecast, 2022 - 2028 |
||||||
|
|
|||||||


| セキュリティ保証の世界市場の規模、シェア、業界動向分析レポートタイプ別(ビジネスアプリケーション、システム&ネットワークインフラ、モビリティソリューション)、組織規模別、業種別、地域別展望と予測、2022~2028年 |
|
出版日: 2023年03月31日
発行: KBV Research
ページ情報: 英文 240 Pages
納期: 即納可能
|
- 全表示
- 概要
- 図表
- 目次
セキュリティ保証市場規模は、2028年には97億米ドルに達すると予測され、予測期間中のCAGRは9.3%の市場成長率で上昇すると予想されています。
セキュリティ保証は、商品、プログラム、サービスに関連する隠れたリスクに対する防御策を概説するものです。基準やプロファイルとの比較により、商品やサービスが一定のセキュリティレベルを備えていることを証明するために使用されます。セキュリティ保証の技術、方法、測定方法は多種多様です。最も広く使われている規格の1つがコモンクライテリア(CC)です。
CCでは、評価保証レベルの段階的な尺度が使用されており、確実性のレベルと、その保証レベルを達成するためのコストや実用性とのバランスをとっています。例えば、脆弱性のテストでは、システムに欠陥がないことを確認することはできません。むしろ、システムをテストするために採用された攻撃からシステムが安全であるかどうか(またはそうでないか)を示すことができるだけです。同様に、セキュリティ保証は、製品を使用する際にリスクがないことを保証することはできませんが、うまくいけば、ある程度まで安全であるという強い信頼性の根拠を確立することができます。
COVID-19影響度分析
COVID-19の発生は、セキュリティ保証市場の開拓に大きな影響を与えました。スマートフォンの普及率の上昇、コネクテッドデバイスの普及、eコマースの活況は、いずれも市場拡大のための魅力的な可能性を秘めているからです。しかし、世界の景気後退の影響により、熟練労働者の不足が深刻化しています。ひいては、2020年のハードウェアウォレットの市場に影響を与えることになるでしょう。また、2020年の世界の危機は、社会、経済、エネルギー、そして医療におけるCOVIDによってもたらされています。
市場の成長要因
BYODの普及とIoT動向の高まり
BYOD(Bring Your Own Device)は非常に人気があり、BaaSプロバイダーはこの動向を促進するために相当額の資金を投入しています。このような文化により、世界に企業が収集するデータ量は増加しています。モノのインターネットと"BYOD"の動きという2つの新しいパラダイムは、政府、小売、ヘルスケア、IT・通信分野におけるスマートアプリケーションの採用を大きく変化させています。基礎技術の向上と次世代ネットワーク搭載ソリューションの幅広い採用が、セキュリティ保証アプリケーションの開発を刺激しています。このような背景から、セキュリティ保証の需要は今後数年間増加すると予想されます。
企業におけるフィッシングやマルウェアの脅威の増大
ウイルスやトロイの木馬などの悪意のあるソフトウェアが、電子情報ネットワーク全体に侵入し、制御し、危害を加えることができるようになってきています。マルウェアは、オンラインでデータを盗んだり、金銭的な利益を得たりするサイバー犯罪者が、コンピューターやその他のデバイスを制御するために広く利用されています。これは、詐欺やその他の違法行為などの不正な活動にデバイスをすぐに利用できるようにするためです。また、ヘルスケア、銀行、金融サービス、政府機関などの企業は、これらの分野で生成されるデータが重要であるため、特にこの種の攻撃の影響を受けやすいとされています。これらの要因が、市場の成長を促進しています。
市場の抑制要因
セキュリティ要求の検証、解明、モデル化
システム開発の初期段階において、いくつかの方法論は、システムのセキュリティニーズの抽出とモデリングに集中していました。しかし、残念ながら、これらの手法は、現在の開発プロセスとこれらの手法とのミスマッチの結果、産業界に適用することが困難であるため、広く受け入れられてはいないです。さらに、これらの手法は、理解が難しいだけでなく、ITシステムのセキュリティ面に関する文書化プロセスを提供するものではありません。このような懸念から、セキュリティ保証の採用が制限されることが予想され、ひいては市場の拡大が制限されることになるでしょう。
タイプの展望
タイプ別では、セキュリティアシュアランス市場は、ビジネスアプリケーション、システム&ネットワークインフラ、モビリティソリューションに区分されます。2021年のセキュリティアシュアランス市場では、モビリティソリューション部門が有望な成長率を調達しました。世界的にモバイルデバイスの数が急速に増加していることが、市場拡大の原動力の1つであると考えられています。また、モバイル機器や接続の需要の増加に伴い、ネットワークがサイバー攻撃を受けやすくなっています。その結果、モビリティソリューション事業の成長が加速しています。
組織規模の見通し
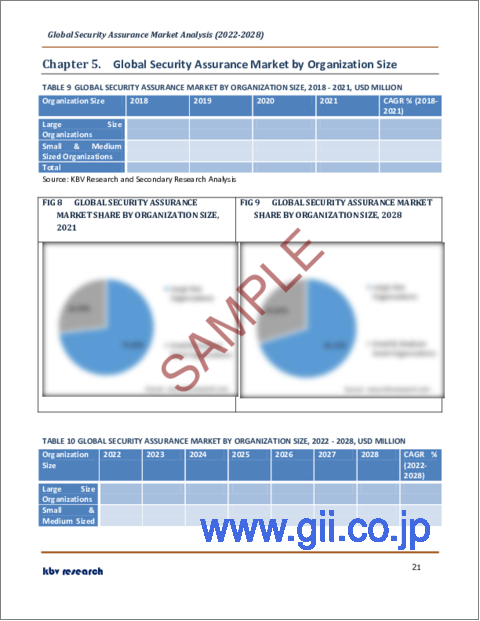
組織規模に基づき、セキュリティ保証市場は大規模組織と中小規模組織に分類されます。大規模組織セグメントは、2021年にセキュリティ保証市場で最大の収益シェアを示しました。これは、余剰の埋蔵金や収益があり、オペレーションのアップグレードに使用できるためです。また、セキュリティはほとんどの大企業にとって大きな関心事であり、その結果、セキュリティ保証のアプローチが広く採用されるようになっています。このような背景から、この分野の市場規模は拡大すると予想されます。
業界別展望
セキュリティアシュアランス市場は、業種別では、BFSI、IT&テレコム、官公庁&商業施設、ヘルスケア、小売、製造、その他に細分化されています。2021年のセキュリティアシュアランス市場では、IT&テレコム分野が顕著な収益シェアを記録しました。これは、インスタントコミュニケーションの需要により、市場が急速に成長・拡大したことに起因しています。システムは、事業継続性とデータセキュリティを保証するために、セキュリティ保証の枠組みを必要とします。また、セキュリティインテリジェンスには、幅広い革新的なソリューションが必要です。
地域別展望
地域別に見ると、セキュリティアシュアランス市場は、北米、欧州、アジア太平洋、LAMEAで分析されています。2021年、北米地域は最も高い収益シェアを獲得し、セキュリティアシュアランス市場をリードしました。企業は、生産性を高めるために、北米地域の開発技術に投資を行っています。北米のセキュリティ保証市場は、クラウドベースのプロバイダー事業者間の競争激化により拡大しており、主要な競合企業は、迅速なアクセスやより大きな顧客への働きかけを保証することにより、より優れた情報保護を提供しています。
市場参入企業がとる主な戦略は、パートナーシップです。カーディナルマトリックスに記載された分析によると、マイクロソフト社がセキュリティアシュアランス市場の先駆者です。Accenture PLC、Infosys Limited、Tenable Holdings, Inc.などの企業は、セキュリティ保証市場における主要な革新的企業の一部です。
目次
第1章 市場範囲と調査手法
- 市場の定義
- 目的
- 市場範囲
- セグメンテーション
- 世界セキュリティ保証市場:タイプ別
- 世界セキュリティ保証市場:組織規模別
- 世界セキュリティ保証市場:業界別
- 世界セキュリティ保証市場:地域別
- 調査手法
第2章 市場概要
- イントロダクション
- 概要
- 市場構成とシナリオ
- 概要
- 市場に影響を与える主な要因
- 市場促進要因
- 市場抑制要因
第3章 競合分析- 世界
- KBVカーディナルマトリックス
- 最近の業界全体の戦略的展開
- パートナーシップ、コラボレーション、および契約
- 製品の発売と製品の拡大
- 買収と合併
- 地理的拡大
- 主要成功戦略
- 主要なリーディングストラテジー
- 主要な戦略的動き
第4章 世界セキュリティ保証市場:タイプ別
- 世界ビジネスアプリケーション市場:地域別
- 世界システムおよびネットワークインフラストラクチャ市場:地域別
- 世界モビリティソリューション市場:地域別
第5章 世界セキュリティ保証市場:組織規模別
- 世界大規模組織市場:地域別
- 世界中小企業市場:地域別
第6章 世界セキュリティ保証市場:業界別
- 世界BFSI市場:地域別
- 世界ITおよび通信市場:地域別
- 世界ヘルスケア市場:地域別
- 世界の小売市場:地域別
- 世界政府市場:地域別
- 世界製造市場:地域別
- 世界のその他の市場:地域別
第7章 世界セキュリティ保証市場:地域別
- 北米
- 北米の市場:国別
- 米国
- カナダ
- メキシコ
- その他北米地域
- 北米の市場:国別
- 欧州
- 欧州の市場:国別
- ドイツ
- 英国
- フランス
- ロシア
- スペイン
- イタリア
- その他欧州地域
- 欧州の市場:国別
- アジア太平洋
- アジア太平洋の市場:国別
- 中国
- 日本
- インド
- 韓国
- シンガポール
- マレーシア
- その他アジア太平洋地域
- アジア太平洋の市場:国別
- ラテンアメリカ・中東・アフリカ
- ラテンアメリカ・中東・アフリカの市場:国別
- ブラジル
- アルゼンチン
- アラブ首長国連邦
- サウジアラビア
- 南アフリカ
- ナイジェリア
- その他ラテンアメリカ・中東・アフリカ地域
- ラテンアメリカ・中東・アフリカの市場:国別
第8章 企業プロファイル
- Accenture PLC
- Microsoft Corporation
- Infosys Limited
- IBM Corporation
- Capgemini SE
- Avaya Inc(Avaya Holdings Corp.)
- Spirent Communications plc
- Tenable Holdings, Inc
- Happiest Minds Technologies Limited
- SAS Institute, Inc
LIST OF TABLES
- TABLE 1 Global Security Assurance Market, 2018 - 2021, USD Million
- TABLE 2 Global Security Assurance Market, 2022 - 2028, USD Million
- TABLE 3 Partnerships, Collaborations and Agreements- Security Assurance Market
- TABLE 4 Product Launches And Product Expansions- Security Assurance Market
- TABLE 5 Acquisition and Mergers- Security Assurance Market
- TABLE 6 geographical Expansions- Security Assurance Market
- TABLE 7 Global Security Assurance Market by Type, 2018 - 2021, USD Million
- TABLE 8 Global Security Assurance Market by Type, 2022 - 2028, USD Million
- TABLE 9 Global Business Applications Market by Region, 2018 - 2021, USD Million
- TABLE 10 Global Business Applications Market by Region, 2022 - 2028, USD Million
- TABLE 11 Global System & Network Infrastructure Market by Region, 2018 - 2021, USD Million
- TABLE 12 Global System & Network Infrastructure Market by Region, 2022 - 2028, USD Million
- TABLE 13 Global Mobility Solutions Market by Region, 2018 - 2021, USD Million
- TABLE 14 Global Mobility Solutions Market by Region, 2022 - 2028, USD Million
- TABLE 15 Global Security Assurance Market by Organization Size, 2018 - 2021, USD Million
- TABLE 16 Global Security Assurance Market by Organization Size, 2022 - 2028, USD Million
- TABLE 17 Global Large Size Organizations Market by Region, 2018 - 2021, USD Million
- TABLE 18 Global Large Size Organizations Market by Region, 2022 - 2028, USD Million
- TABLE 19 Global Small & Medium Sized Organizations Market by Region, 2018 - 2021, USD Million
- TABLE 20 Global Small & Medium Sized Organizations Market by Region, 2022 - 2028, USD Million
- TABLE 21 Global Security Assurance Market by Vertical, 2018 - 2021, USD Million
- TABLE 22 Global Security Assurance Market by Vertical, 2022 - 2028, USD Million
- TABLE 23 Global BFSI Market by Region, 2018 - 2021, USD Million
- TABLE 24 Global BFSI Market by Region, 2022 - 2028, USD Million
- TABLE 25 Global IT & Telecom Market by Region, 2018 - 2021, USD Million
- TABLE 26 Global IT & Telecom Market by Region, 2022 - 2028, USD Million
- TABLE 27 Global Healthcare Market by Region, 2018 - 2021, USD Million
- TABLE 28 Global Healthcare Market by Region, 2022 - 2028, USD Million
- TABLE 29 Global Retail Market by Region, 2018 - 2021, USD Million
- TABLE 30 Global Retail Market by Region, 2022 - 2028, USD Million
- TABLE 31 Global Government Market by Region, 2018 - 2021, USD Million
- TABLE 32 Global Government Market by Region, 2022 - 2028, USD Million
- TABLE 33 Global Manufacturing Market by Region, 2018 - 2021, USD Million
- TABLE 34 Global Manufacturing Market by Region, 2022 - 2028, USD Million
- TABLE 35 Global Others Market by Region, 2018 - 2021, USD Million
- TABLE 36 Global Others Market by Region, 2022 - 2028, USD Million
- TABLE 37 Global Security Assurance Market by Region, 2018 - 2021, USD Million
- TABLE 38 Global Security Assurance Market by Region, 2022 - 2028, USD Million
- TABLE 39 North America Security Assurance Market, 2018 - 2021, USD Million
- TABLE 40 North America Security Assurance Market, 2022 - 2028, USD Million
- TABLE 41 North America Security Assurance Market by Type, 2018 - 2021, USD Million
- TABLE 42 North America Security Assurance Market by Type, 2022 - 2028, USD Million
- TABLE 43 North America Business Applications Market by Country, 2018 - 2021, USD Million
- TABLE 44 North America Business Applications Market by Country, 2022 - 2028, USD Million
- TABLE 45 North America System & Network Infrastructure Market by Country, 2018 - 2021, USD Million
- TABLE 46 North America System & Network Infrastructure Market by Country, 2022 - 2028, USD Million
- TABLE 47 North America Mobility Solutions Market by Country, 2018 - 2021, USD Million
- TABLE 48 North America Mobility Solutions Market by Country, 2022 - 2028, USD Million
- TABLE 49 North America Security Assurance Market by Organization Size, 2018 - 2021, USD Million
- TABLE 50 North America Security Assurance Market by Organization Size, 2022 - 2028, USD Million
- TABLE 51 North America Large Size Organizations Market by Country, 2018 - 2021, USD Million
- TABLE 52 North America Large Size Organizations Market by Country, 2022 - 2028, USD Million
- TABLE 53 North America Small & Medium Sized Organizations Market by Country, 2018 - 2021, USD Million
- TABLE 54 North America Small & Medium Sized Organizations Market by Country, 2022 - 2028, USD Million
- TABLE 55 North America Security Assurance Market by Vertical, 2018 - 2021, USD Million
- TABLE 56 North America Security Assurance Market by Vertical, 2022 - 2028, USD Million
- TABLE 57 North America BFSI Market by Country, 2018 - 2021, USD Million
- TABLE 58 North America BFSI Market by Country, 2022 - 2028, USD Million
- TABLE 59 North America IT & Telecom Market by Country, 2018 - 2021, USD Million
- TABLE 60 North America IT & Telecom Market by Country, 2022 - 2028, USD Million
- TABLE 61 North America Healthcare Market by Country, 2018 - 2021, USD Million
- TABLE 62 North America Healthcare Market by Country, 2022 - 2028, USD Million
- TABLE 63 North America Retail Market by Country, 2018 - 2021, USD Million
- TABLE 64 North America Retail Market by Country, 2022 - 2028, USD Million
- TABLE 65 North America Government Market by Country, 2018 - 2021, USD Million
- TABLE 66 North America Government Market by Country, 2022 - 2028, USD Million
- TABLE 67 North America Manufacturing Market by Country, 2018 - 2021, USD Million
- TABLE 68 North America Manufacturing Market by Country, 2022 - 2028, USD Million
- TABLE 69 North America Others Market by Country, 2018 - 2021, USD Million
- TABLE 70 North America Others Market by Country, 2022 - 2028, USD Million
- TABLE 71 North America Security Assurance Market by Country, 2018 - 2021, USD Million
- TABLE 72 North America Security Assurance Market by Country, 2022 - 2028, USD Million
- TABLE 73 US Security Assurance Market, 2018 - 2021, USD Million
- TABLE 74 US Security Assurance Market, 2022 - 2028, USD Million
- TABLE 75 US Security Assurance Market by Type, 2018 - 2021, USD Million
- TABLE 76 US Security Assurance Market by Type, 2022 - 2028, USD Million
- TABLE 77 US Security Assurance Market by Organization Size, 2018 - 2021, USD Million
- TABLE 78 US Security Assurance Market by Organization Size, 2022 - 2028, USD Million
- TABLE 79 US Security Assurance Market by Vertical, 2018 - 2021, USD Million
- TABLE 80 US Security Assurance Market by Vertical, 2022 - 2028, USD Million
- TABLE 81 Canada Security Assurance Market, 2018 - 2021, USD Million
- TABLE 82 Canada Security Assurance Market, 2022 - 2028, USD Million
- TABLE 83 Canada Security Assurance Market by Type, 2018 - 2021, USD Million
- TABLE 84 Canada Security Assurance Market by Type, 2022 - 2028, USD Million
- TABLE 85 Canada Security Assurance Market by Organization Size, 2018 - 2021, USD Million
- TABLE 86 Canada Security Assurance Market by Organization Size, 2022 - 2028, USD Million
- TABLE 87 Canada Security Assurance Market by Vertical, 2018 - 2021, USD Million
- TABLE 88 Canada Security Assurance Market by Vertical, 2022 - 2028, USD Million
- TABLE 89 Mexico Security Assurance Market, 2018 - 2021, USD Million
- TABLE 90 Mexico Security Assurance Market, 2022 - 2028, USD Million
- TABLE 91 Mexico Security Assurance Market by Type, 2018 - 2021, USD Million
- TABLE 92 Mexico Security Assurance Market by Type, 2022 - 2028, USD Million
- TABLE 93 Mexico Security Assurance Market by Organization Size, 2018 - 2021, USD Million
- TABLE 94 Mexico Security Assurance Market by Organization Size, 2022 - 2028, USD Million
- TABLE 95 Mexico Security Assurance Market by Vertical, 2018 - 2021, USD Million
- TABLE 96 Mexico Security Assurance Market by Vertical, 2022 - 2028, USD Million
- TABLE 97 Rest of North America Security Assurance Market, 2018 - 2021, USD Million
- TABLE 98 Rest of North America Security Assurance Market, 2022 - 2028, USD Million
- TABLE 99 Rest of North America Security Assurance Market by Type, 2018 - 2021, USD Million
- TABLE 100 Rest of North America Security Assurance Market by Type, 2022 - 2028, USD Million
- TABLE 101 Rest of North America Security Assurance Market by Organization Size, 2018 - 2021, USD Million
- TABLE 102 Rest of North America Security Assurance Market by Organization Size, 2022 - 2028, USD Million
- TABLE 103 Rest of North America Security Assurance Market by Vertical, 2018 - 2021, USD Million
- TABLE 104 Rest of North America Security Assurance Market by Vertical, 2022 - 2028, USD Million
- TABLE 105 Europe Security Assurance Market, 2018 - 2021, USD Million
- TABLE 106 Europe Security Assurance Market, 2022 - 2028, USD Million
- TABLE 107 Europe Security Assurance Market by Type, 2018 - 2021, USD Million
- TABLE 108 Europe Security Assurance Market by Type, 2022 - 2028, USD Million
- TABLE 109 Europe Business Applications Market by Country, 2018 - 2021, USD Million
- TABLE 110 Europe Business Applications Market by Country, 2022 - 2028, USD Million
- TABLE 111 Europe System & Network Infrastructure Market by Country, 2018 - 2021, USD Million
- TABLE 112 Europe System & Network Infrastructure Market by Country, 2022 - 2028, USD Million
- TABLE 113 Europe Mobility Solutions Market by Country, 2018 - 2021, USD Million
- TABLE 114 Europe Mobility Solutions Market by Country, 2022 - 2028, USD Million
- TABLE 115 Europe Security Assurance Market by Organization Size, 2018 - 2021, USD Million
- TABLE 116 Europe Security Assurance Market by Organization Size, 2022 - 2028, USD Million
- TABLE 117 Europe Large Size Organizations Market by Country, 2018 - 2021, USD Million
- TABLE 118 Europe Large Size Organizations Market by Country, 2022 - 2028, USD Million
- TABLE 119 Europe Small & Medium Sized Organizations Market by Country, 2018 - 2021, USD Million
- TABLE 120 Europe Small & Medium Sized Organizations Market by Country, 2022 - 2028, USD Million
- TABLE 121 Europe Security Assurance Market by Vertical, 2018 - 2021, USD Million
- TABLE 122 Europe Security Assurance Market by Vertical, 2022 - 2028, USD Million
- TABLE 123 Europe BFSI Market by Country, 2018 - 2021, USD Million
- TABLE 124 Europe BFSI Market by Country, 2022 - 2028, USD Million
- TABLE 125 Europe IT & Telecom Market by Country, 2018 - 2021, USD Million
- TABLE 126 Europe IT & Telecom Market by Country, 2022 - 2028, USD Million
- TABLE 127 Europe Healthcare Market by Country, 2018 - 2021, USD Million
- TABLE 128 Europe Healthcare Market by Country, 2022 - 2028, USD Million
- TABLE 129 Europe Retail Market by Country, 2018 - 2021, USD Million
- TABLE 130 Europe Retail Market by Country, 2022 - 2028, USD Million
- TABLE 131 Europe Government Market by Country, 2018 - 2021, USD Million
- TABLE 132 Europe Government Market by Country, 2022 - 2028, USD Million
- TABLE 133 Europe Manufacturing Market by Country, 2018 - 2021, USD Million
- TABLE 134 Europe Manufacturing Market by Country, 2022 - 2028, USD Million
- TABLE 135 Europe Others Market by Country, 2018 - 2021, USD Million
- TABLE 136 Europe Others Market by Country, 2022 - 2028, USD Million
- TABLE 137 Europe Security Assurance Market by Country, 2018 - 2021, USD Million
- TABLE 138 Europe Security Assurance Market by Country, 2022 - 2028, USD Million
- TABLE 139 Germany Security Assurance Market, 2018 - 2021, USD Million
- TABLE 140 Germany Security Assurance Market, 2022 - 2028, USD Million
- TABLE 141 Germany Security Assurance Market by Type, 2018 - 2021, USD Million
- TABLE 142 Germany Security Assurance Market by Type, 2022 - 2028, USD Million
- TABLE 143 Germany Security Assurance Market by Organization Size, 2018 - 2021, USD Million
- TABLE 144 Germany Security Assurance Market by Organization Size, 2022 - 2028, USD Million
- TABLE 145 Germany Security Assurance Market by Vertical, 2018 - 2021, USD Million
- TABLE 146 Germany Security Assurance Market by Vertical, 2022 - 2028, USD Million
- TABLE 147 UK Security Assurance Market, 2018 - 2021, USD Million
- TABLE 148 UK Security Assurance Market, 2022 - 2028, USD Million
- TABLE 149 UK Security Assurance Market by Type, 2018 - 2021, USD Million
- TABLE 150 UK Security Assurance Market by Type, 2022 - 2028, USD Million
- TABLE 151 UK Security Assurance Market by Organization Size, 2018 - 2021, USD Million
- TABLE 152 UK Security Assurance Market by Organization Size, 2022 - 2028, USD Million
- TABLE 153 UK Security Assurance Market by Vertical, 2018 - 2021, USD Million
- TABLE 154 UK Security Assurance Market by Vertical, 2022 - 2028, USD Million
- TABLE 155 France Security Assurance Market, 2018 - 2021, USD Million
- TABLE 156 France Security Assurance Market, 2022 - 2028, USD Million
- TABLE 157 France Security Assurance Market by Type, 2018 - 2021, USD Million
- TABLE 158 France Security Assurance Market by Type, 2022 - 2028, USD Million
- TABLE 159 France Security Assurance Market by Organization Size, 2018 - 2021, USD Million
- TABLE 160 France Security Assurance Market by Organization Size, 2022 - 2028, USD Million
- TABLE 161 France Security Assurance Market by Vertical, 2018 - 2021, USD Million
- TABLE 162 France Security Assurance Market by Vertical, 2022 - 2028, USD Million
- TABLE 163 Russia Security Assurance Market, 2018 - 2021, USD Million
- TABLE 164 Russia Security Assurance Market, 2022 - 2028, USD Million
- TABLE 165 Russia Security Assurance Market by Type, 2018 - 2021, USD Million
- TABLE 166 Russia Security Assurance Market by Type, 2022 - 2028, USD Million
- TABLE 167 Russia Security Assurance Market by Organization Size, 2018 - 2021, USD Million
- TABLE 168 Russia Security Assurance Market by Organization Size, 2022 - 2028, USD Million
- TABLE 169 Russia Security Assurance Market by Vertical, 2018 - 2021, USD Million
- TABLE 170 Russia Security Assurance Market by Vertical, 2022 - 2028, USD Million
- TABLE 171 Spain Security Assurance Market, 2018 - 2021, USD Million
- TABLE 172 Spain Security Assurance Market, 2022 - 2028, USD Million
- TABLE 173 Spain Security Assurance Market by Type, 2018 - 2021, USD Million
- TABLE 174 Spain Security Assurance Market by Type, 2022 - 2028, USD Million
- TABLE 175 Spain Security Assurance Market by Organization Size, 2018 - 2021, USD Million
- TABLE 176 Spain Security Assurance Market by Organization Size, 2022 - 2028, USD Million
- TABLE 177 Spain Security Assurance Market by Vertical, 2018 - 2021, USD Million
- TABLE 178 Spain Security Assurance Market by Vertical, 2022 - 2028, USD Million
- TABLE 179 Italy Security Assurance Market, 2018 - 2021, USD Million
- TABLE 180 Italy Security Assurance Market, 2022 - 2028, USD Million
- TABLE 181 Italy Security Assurance Market by Type, 2018 - 2021, USD Million
- TABLE 182 Italy Security Assurance Market by Type, 2022 - 2028, USD Million
- TABLE 183 Italy Security Assurance Market by Organization Size, 2018 - 2021, USD Million
- TABLE 184 Italy Security Assurance Market by Organization Size, 2022 - 2028, USD Million
- TABLE 185 Italy Security Assurance Market by Vertical, 2018 - 2021, USD Million
- TABLE 186 Italy Security Assurance Market by Vertical, 2022 - 2028, USD Million
- TABLE 187 Rest of Europe Security Assurance Market, 2018 - 2021, USD Million
- TABLE 188 Rest of Europe Security Assurance Market, 2022 - 2028, USD Million
- TABLE 189 Rest of Europe Security Assurance Market by Type, 2018 - 2021, USD Million
- TABLE 190 Rest of Europe Security Assurance Market by Type, 2022 - 2028, USD Million
- TABLE 191 Rest of Europe Security Assurance Market by Organization Size, 2018 - 2021, USD Million
- TABLE 192 Rest of Europe Security Assurance Market by Organization Size, 2022 - 2028, USD Million
- TABLE 193 Rest of Europe Security Assurance Market by Vertical, 2018 - 2021, USD Million
- TABLE 194 Rest of Europe Security Assurance Market by Vertical, 2022 - 2028, USD Million
- TABLE 195 Asia Pacific Security Assurance Market, 2018 - 2021, USD Million
- TABLE 196 Asia Pacific Security Assurance Market, 2022 - 2028, USD Million
- TABLE 197 Asia Pacific Security Assurance Market by Type, 2018 - 2021, USD Million
- TABLE 198 Asia Pacific Security Assurance Market by Type, 2022 - 2028, USD Million
- TABLE 199 Asia Pacific Business Applications Market by Country, 2018 - 2021, USD Million
- TABLE 200 Asia Pacific Business Applications Market by Country, 2022 - 2028, USD Million
- TABLE 201 Asia Pacific System & Network Infrastructure Market by Country, 2018 - 2021, USD Million
- TABLE 202 Asia Pacific System & Network Infrastructure Market by Country, 2022 - 2028, USD Million
- TABLE 203 Asia Pacific Mobility Solutions Market by Country, 2018 - 2021, USD Million
- TABLE 204 Asia Pacific Mobility Solutions Market by Country, 2022 - 2028, USD Million
- TABLE 205 Asia Pacific Security Assurance Market by Organization Size, 2018 - 2021, USD Million
- TABLE 206 Asia Pacific Security Assurance Market by Organization Size, 2022 - 2028, USD Million
- TABLE 207 Asia Pacific Large Size Organizations Market by Country, 2018 - 2021, USD Million
- TABLE 208 Asia Pacific Large Size Organizations Market by Country, 2022 - 2028, USD Million
- TABLE 209 Asia Pacific Small & Medium Sized Organizations Market by Country, 2018 - 2021, USD Million
- TABLE 210 Asia Pacific Small & Medium Sized Organizations Market by Country, 2022 - 2028, USD Million
- TABLE 211 Asia Pacific Security Assurance Market by Vertical, 2018 - 2021, USD Million
- TABLE 212 Asia Pacific Security Assurance Market by Vertical, 2022 - 2028, USD Million
- TABLE 213 Asia Pacific BFSI Market by Country, 2018 - 2021, USD Million
- TABLE 214 Asia Pacific BFSI Market by Country, 2022 - 2028, USD Million
- TABLE 215 Asia Pacific IT & Telecom Market by Country, 2018 - 2021, USD Million
- TABLE 216 Asia Pacific IT & Telecom Market by Country, 2022 - 2028, USD Million
- TABLE 217 Asia Pacific Healthcare Market by Country, 2018 - 2021, USD Million
- TABLE 218 Asia Pacific Healthcare Market by Country, 2022 - 2028, USD Million
- TABLE 219 Asia Pacific Retail Market by Country, 2018 - 2021, USD Million
- TABLE 220 Asia Pacific Retail Market by Country, 2022 - 2028, USD Million
- TABLE 221 Asia Pacific Government Market by Country, 2018 - 2021, USD Million
- TABLE 222 Asia Pacific Government Market by Country, 2022 - 2028, USD Million
- TABLE 223 Asia Pacific Manufacturing Market by Country, 2018 - 2021, USD Million
- TABLE 224 Asia Pacific Manufacturing Market by Country, 2022 - 2028, USD Million
- TABLE 225 Asia Pacific Others Market by Country, 2018 - 2021, USD Million
- TABLE 226 Asia Pacific Others Market by Country, 2022 - 2028, USD Million
- TABLE 227 Asia Pacific Security Assurance Market by Country, 2018 - 2021, USD Million
- TABLE 228 Asia Pacific Security Assurance Market by Country, 2022 - 2028, USD Million
- TABLE 229 China Security Assurance Market, 2018 - 2021, USD Million
- TABLE 230 China Security Assurance Market, 2022 - 2028, USD Million
- TABLE 231 China Security Assurance Market by Type, 2018 - 2021, USD Million
- TABLE 232 China Security Assurance Market by Type, 2022 - 2028, USD Million
- TABLE 233 China Security Assurance Market by Organization Size, 2018 - 2021, USD Million
- TABLE 234 China Security Assurance Market by Organization Size, 2022 - 2028, USD Million
- TABLE 235 China Security Assurance Market by Vertical, 2018 - 2021, USD Million
- TABLE 236 China Security Assurance Market by Vertical, 2022 - 2028, USD Million
- TABLE 237 Japan Security Assurance Market, 2018 - 2021, USD Million
- TABLE 238 Japan Security Assurance Market, 2022 - 2028, USD Million
- TABLE 239 Japan Security Assurance Market by Type, 2018 - 2021, USD Million
- TABLE 240 Japan Security Assurance Market by Type, 2022 - 2028, USD Million
- TABLE 241 Japan Security Assurance Market by Organization Size, 2018 - 2021, USD Million
- TABLE 242 Japan Security Assurance Market by Organization Size, 2022 - 2028, USD Million
- TABLE 243 Japan Security Assurance Market by Vertical, 2018 - 2021, USD Million
- TABLE 244 Japan Security Assurance Market by Vertical, 2022 - 2028, USD Million
- TABLE 245 India Security Assurance Market, 2018 - 2021, USD Million
- TABLE 246 India Security Assurance Market, 2022 - 2028, USD Million
- TABLE 247 India Security Assurance Market by Type, 2018 - 2021, USD Million
- TABLE 248 India Security Assurance Market by Type, 2022 - 2028, USD Million
- TABLE 249 India Security Assurance Market by Organization Size, 2018 - 2021, USD Million
- TABLE 250 India Security Assurance Market by Organization Size, 2022 - 2028, USD Million
- TABLE 251 India Security Assurance Market by Vertical, 2018 - 2021, USD Million
- TABLE 252 India Security Assurance Market by Vertical, 2022 - 2028, USD Million
- TABLE 253 South Korea Security Assurance Market, 2018 - 2021, USD Million
- TABLE 254 South Korea Security Assurance Market, 2022 - 2028, USD Million
- TABLE 255 South Korea Security Assurance Market by Type, 2018 - 2021, USD Million
- TABLE 256 South Korea Security Assurance Market by Type, 2022 - 2028, USD Million
- TABLE 257 South Korea Security Assurance Market by Organization Size, 2018 - 2021, USD Million
- TABLE 258 South Korea Security Assurance Market by Organization Size, 2022 - 2028, USD Million
- TABLE 259 South Korea Security Assurance Market by Vertical, 2018 - 2021, USD Million
- TABLE 260 South Korea Security Assurance Market by Vertical, 2022 - 2028, USD Million
- TABLE 261 Singapore Security Assurance Market, 2018 - 2021, USD Million
- TABLE 262 Singapore Security Assurance Market, 2022 - 2028, USD Million
- TABLE 263 Singapore Security Assurance Market by Type, 2018 - 2021, USD Million
- TABLE 264 Singapore Security Assurance Market by Type, 2022 - 2028, USD Million
- TABLE 265 Singapore Security Assurance Market by Organization Size, 2018 - 2021, USD Million
- TABLE 266 Singapore Security Assurance Market by Organization Size, 2022 - 2028, USD Million
- TABLE 267 Singapore Security Assurance Market by Vertical, 2018 - 2021, USD Million
- TABLE 268 Singapore Security Assurance Market by Vertical, 2022 - 2028, USD Million
- TABLE 269 Malaysia Security Assurance Market, 2018 - 2021, USD Million
- TABLE 270 Malaysia Security Assurance Market, 2022 - 2028, USD Million
- TABLE 271 Malaysia Security Assurance Market by Type, 2018 - 2021, USD Million
- TABLE 272 Malaysia Security Assurance Market by Type, 2022 - 2028, USD Million
- TABLE 273 Malaysia Security Assurance Market by Organization Size, 2018 - 2021, USD Million
- TABLE 274 Malaysia Security Assurance Market by Organization Size, 2022 - 2028, USD Million
- TABLE 275 Malaysia Security Assurance Market by Vertical, 2018 - 2021, USD Million
- TABLE 276 Malaysia Security Assurance Market by Vertical, 2022 - 2028, USD Million
- TABLE 277 Rest of Asia Pacific Security Assurance Market, 2018 - 2021, USD Million
- TABLE 278 Rest of Asia Pacific Security Assurance Market, 2022 - 2028, USD Million
- TABLE 279 Rest of Asia Pacific Security Assurance Market by Type, 2018 - 2021, USD Million
- TABLE 280 Rest of Asia Pacific Security Assurance Market by Type, 2022 - 2028, USD Million
- TABLE 281 Rest of Asia Pacific Security Assurance Market by Organization Size, 2018 - 2021, USD Million
- TABLE 282 Rest of Asia Pacific Security Assurance Market by Organization Size, 2022 - 2028, USD Million
- TABLE 283 Rest of Asia Pacific Security Assurance Market by Vertical, 2018 - 2021, USD Million
- TABLE 284 Rest of Asia Pacific Security Assurance Market by Vertical, 2022 - 2028, USD Million
- TABLE 285 LAMEA Security Assurance Market, 2018 - 2021, USD Million
- TABLE 286 LAMEA Security Assurance Market, 2022 - 2028, USD Million
- TABLE 287 LAMEA Security Assurance Market by Type, 2018 - 2021, USD Million
- TABLE 288 LAMEA Security Assurance Market by Type, 2022 - 2028, USD Million
- TABLE 289 LAMEA Business Applications Market by Country, 2018 - 2021, USD Million
- TABLE 290 LAMEA Business Applications Market by Country, 2022 - 2028, USD Million
- TABLE 291 LAMEA System & Network Infrastructure Market by Country, 2018 - 2021, USD Million
- TABLE 292 LAMEA System & Network Infrastructure Market by Country, 2022 - 2028, USD Million
- TABLE 293 LAMEA Mobility Solutions Market by Country, 2018 - 2021, USD Million
- TABLE 294 LAMEA Mobility Solutions Market by Country, 2022 - 2028, USD Million
- TABLE 295 LAMEA Security Assurance Market by Organization Size, 2018 - 2021, USD Million
- TABLE 296 LAMEA Security Assurance Market by Organization Size, 2022 - 2028, USD Million
- TABLE 297 LAMEA Large Size Organizations Market by Country, 2018 - 2021, USD Million
- TABLE 298 LAMEA Large Size Organizations Market by Country, 2022 - 2028, USD Million
- TABLE 299 LAMEA Small & Medium Sized Organizations Market by Country, 2018 - 2021, USD Million
- TABLE 300 LAMEA Small & Medium Sized Organizations Market by Country, 2022 - 2028, USD Million
- TABLE 301 LAMEA Security Assurance Market by Vertical, 2018 - 2021, USD Million
- TABLE 302 LAMEA Security Assurance Market by Vertical, 2022 - 2028, USD Million
- TABLE 303 LAMEA BFSI Market by Country, 2018 - 2021, USD Million
- TABLE 304 LAMEA BFSI Market by Country, 2022 - 2028, USD Million
- TABLE 305 LAMEA IT & Telecom Market by Country, 2018 - 2021, USD Million
- TABLE 306 LAMEA IT & Telecom Market by Country, 2022 - 2028, USD Million
- TABLE 307 LAMEA Healthcare Market by Country, 2018 - 2021, USD Million
- TABLE 308 LAMEA Healthcare Market by Country, 2022 - 2028, USD Million
- TABLE 309 LAMEA Retail Market by Country, 2018 - 2021, USD Million
- TABLE 310 LAMEA Retail Market by Country, 2022 - 2028, USD Million
- TABLE 311 LAMEA Government Market by Country, 2018 - 2021, USD Million
- TABLE 312 LAMEA Government Market by Country, 2022 - 2028, USD Million
- TABLE 313 LAMEA Manufacturing Market by Country, 2018 - 2021, USD Million
- TABLE 314 LAMEA Manufacturing Market by Country, 2022 - 2028, USD Million
- TABLE 315 LAMEA Others Market by Country, 2018 - 2021, USD Million
- TABLE 316 LAMEA Others Market by Country, 2022 - 2028, USD Million
- TABLE 317 LAMEA Security Assurance Market by Country, 2018 - 2021, USD Million
- TABLE 318 LAMEA Security Assurance Market by Country, 2022 - 2028, USD Million
- TABLE 319 Brazil Security Assurance Market, 2018 - 2021, USD Million
- TABLE 320 Brazil Security Assurance Market, 2022 - 2028, USD Million
- TABLE 321 Brazil Security Assurance Market by Type, 2018 - 2021, USD Million
- TABLE 322 Brazil Security Assurance Market by Type, 2022 - 2028, USD Million
- TABLE 323 Brazil Security Assurance Market by Organization Size, 2018 - 2021, USD Million
- TABLE 324 Brazil Security Assurance Market by Organization Size, 2022 - 2028, USD Million
- TABLE 325 Brazil Security Assurance Market by Vertical, 2018 - 2021, USD Million
- TABLE 326 Brazil Security Assurance Market by Vertical, 2022 - 2028, USD Million
- TABLE 327 Argentina Security Assurance Market, 2018 - 2021, USD Million
- TABLE 328 Argentina Security Assurance Market, 2022 - 2028, USD Million
- TABLE 329 Argentina Security Assurance Market by Type, 2018 - 2021, USD Million
- TABLE 330 Argentina Security Assurance Market by Type, 2022 - 2028, USD Million
- TABLE 331 Argentina Security Assurance Market by Organization Size, 2018 - 2021, USD Million
- TABLE 332 Argentina Security Assurance Market by Organization Size, 2022 - 2028, USD Million
- TABLE 333 Argentina Security Assurance Market by Vertical, 2018 - 2021, USD Million
- TABLE 334 Argentina Security Assurance Market by Vertical, 2022 - 2028, USD Million
- TABLE 335 UAE Security Assurance Market, 2018 - 2021, USD Million
- TABLE 336 UAE Security Assurance Market, 2022 - 2028, USD Million
- TABLE 337 UAE Security Assurance Market by Type, 2018 - 2021, USD Million
- TABLE 338 UAE Security Assurance Market by Type, 2022 - 2028, USD Million
- TABLE 339 UAE Security Assurance Market by Organization Size, 2018 - 2021, USD Million
- TABLE 340 UAE Security Assurance Market by Organization Size, 2022 - 2028, USD Million
- TABLE 341 UAE Security Assurance Market by Vertical, 2018 - 2021, USD Million
- TABLE 342 UAE Security Assurance Market by Vertical, 2022 - 2028, USD Million
- TABLE 343 Saudi Arabia Security Assurance Market, 2018 - 2021, USD Million
- TABLE 344 Saudi Arabia Security Assurance Market, 2022 - 2028, USD Million
- TABLE 345 Saudi Arabia Security Assurance Market by Type, 2018 - 2021, USD Million
- TABLE 346 Saudi Arabia Security Assurance Market by Type, 2022 - 2028, USD Million
- TABLE 347 Saudi Arabia Security Assurance Market by Organization Size, 2018 - 2021, USD Million
- TABLE 348 Saudi Arabia Security Assurance Market by Organization Size, 2022 - 2028, USD Million
- TABLE 349 Saudi Arabia Security Assurance Market by Vertical, 2018 - 2021, USD Million
- TABLE 350 Saudi Arabia Security Assurance Market by Vertical, 2022 - 2028, USD Million
- TABLE 351 South Africa Security Assurance Market, 2018 - 2021, USD Million
- TABLE 352 South Africa Security Assurance Market, 2022 - 2028, USD Million
- TABLE 353 South Africa Security Assurance Market by Type, 2018 - 2021, USD Million
- TABLE 354 South Africa Security Assurance Market by Type, 2022 - 2028, USD Million
- TABLE 355 South Africa Security Assurance Market by Organization Size, 2018 - 2021, USD Million
- TABLE 356 South Africa Security Assurance Market by Organization Size, 2022 - 2028, USD Million
- TABLE 357 South Africa Security Assurance Market by Vertical, 2018 - 2021, USD Million
- TABLE 358 South Africa Security Assurance Market by Vertical, 2022 - 2028, USD Million
- TABLE 359 Nigeria Security Assurance Market, 2018 - 2021, USD Million
- TABLE 360 Nigeria Security Assurance Market, 2022 - 2028, USD Million
- TABLE 361 Nigeria Security Assurance Market by Type, 2018 - 2021, USD Million
- TABLE 362 Nigeria Security Assurance Market by Type, 2022 - 2028, USD Million
- TABLE 363 Nigeria Security Assurance Market by Organization Size, 2018 - 2021, USD Million
- TABLE 364 Nigeria Security Assurance Market by Organization Size, 2022 - 2028, USD Million
- TABLE 365 Nigeria Security Assurance Market by Vertical, 2018 - 2021, USD Million
- TABLE 366 Nigeria Security Assurance Market by Vertical, 2022 - 2028, USD Million
- TABLE 367 Rest of LAMEA Security Assurance Market, 2018 - 2021, USD Million
- TABLE 368 Rest of LAMEA Security Assurance Market, 2022 - 2028, USD Million
- TABLE 369 Rest of LAMEA Security Assurance Market by Type, 2018 - 2021, USD Million
- TABLE 370 Rest of LAMEA Security Assurance Market by Type, 2022 - 2028, USD Million
- TABLE 371 Rest of LAMEA Security Assurance Market by Organization Size, 2018 - 2021, USD Million
- TABLE 372 Rest of LAMEA Security Assurance Market by Organization Size, 2022 - 2028, USD Million
- TABLE 373 Rest of LAMEA Security Assurance Market by Vertical, 2018 - 2021, USD Million
- TABLE 374 Rest of LAMEA Security Assurance Market by Vertical, 2022 - 2028, USD Million
- TABLE 375 Key information - Accenture PLC
- TABLE 376 key information - Microsoft Corporation
- TABLE 377 Key Information - Infosys Limited
- TABLE 378 Key information - IBM Corporation
- TABLE 379 Key Information - Capgemini SE
- TABLE 380 Key Information - Avaya, Inc.
- TABLE 381 Key Information - Spirent Communications plc
- TABLE 382 Key Information - Tenable Holdings, Inc.
- TABLE 383 Key Information - Happiest Minds Technologies Limited
- TABLE 384 Key information - SAS Institute, Inc.
List of Figures
- FIG 1 Methodology for the research
- FIG 2 KBV Cardinal Matrix
- FIG 3 Key Leading Strategies: Percentage Distribution (2018-2022)
- FIG 4 Key Strategic Move: (Partnerships, Collaborations & Agreements : 2019, Sep - 2022, Oct) Leading Players
- FIG 5 Global Security Assurance Market share by Type, 2021
- FIG 6 Global Security Assurance Market share by Type, 2028
- FIG 7 Global Security Assurance Market by Type, 2018 - 2028, USD Million
- FIG 8 Global Security Assurance Market share by Organization Size, 2021
- FIG 9 Global Security Assurance Market share by Organization Size, 2028
- FIG 10 Global Security Assurance Market by Organization Size, 2018 - 2028, USD Million
- FIG 11 Global Security Assurance Market share by Vertical, 2021
- FIG 12 Global Security Assurance Market share by Vertical, 2028
- FIG 13 Global Security Assurance Market by Vertical, 2018 - 2028, USD Million
- FIG 14 Global Security Assurance Market share by Region, 2021
- FIG 15 Global Security Assurance Market share by Region, 2028
- FIG 16 Global Security Assurance Market by Region, 2018 - 2028, USD Million
- FIG 17 Recent strategies and developments: Accenture PLC
- FIG 18 Swot analysis: Accenture plC
- FIG 19 Recent strategies and developments: Microsoft Corporation
- FIG 20 SWOT Analysis: Microsoft Corporation
- FIG 21 SWOT Analysis: Infosys Limited
- FIG 22 Swot analysis: IBM Corporation
- FIG 23 Recent strategies and developments: Capgemini SE
The Global Security Assurance Market size is expected to reach $9.7 billion by 2028, rising at a market growth of 9.3% CAGR during the forecast period.
Security assurance is a cutting-edge approach for establishing and controlling risks & threats to computer security. This group of technologies ensures that software is developed with a level of security that can resist the harm arising from the loss, incorrect use, disappearance, manipulation, or misuse of the data and resources it depends on. Services for security assurance aid companies in locating, assessing, and controlling security risks associated with mobile devices, business applications, and related technology environments.
Also, the market for security assurance is expanding due to enterprises' increased concerns about cyberattacks, the possibility of phishing, and malware. Moreover, IoT and BYOD are helping the market for security assurance develop. Global Security assurance services enable businesses to quickly identify, evaluate, and address security threats associated with mobile devices, enterprise applications, and related technological environments. But one of the primary obstacles facing the world's security assurance companies is the difficulty in providing hybrid cloud security.
Security assurance outlines defenses against hidden risks associated with goods, programs, or services. In accordance with a standard or comparison to a profile, it can be used to certify that a good or service has a given level of security. A wide variety of security assurance technologies, methods, and measurements are available. One of the most widely used standards is Common Criteria (CC).
A graduated scale of evaluation assurance levels is used by CC, which balances the level of certainty with the cost and practicalities of achieving that level of assurance. For example, testing for vulnerabilities cannot confirm that a system is fault-free; rather, it can only show whether the system is secure (or not) from the assaults employed to test it. Similarly, security assurance cannot guarantee that a product is risk-free to use, but when done well, it may establish a strong basis of confidence that it is secure to a certain extent.
COVID-19 Impact Analysis
The COVID-19 outbreak has had a significant effect on the development of the security assurance market, since rising smartphone adoption, connected device adoption, and the booming e-commerce industry all present attractive potential for the market's expansion. However, the global shutdown and economic downturn have ended the lack of skilled workers available everywhere. In turn, this will have an impact on the market for hardware wallets in 2020. In addition, worldwide crises in 2020 have been brought on by COVID in social, economic, and energy, as well as in medicine.
Market Growth Factors
Growing popularity of BYOD and IoT trends
Bring Your Own Device (BYOD) has become extremely popular, and BaaS providers have committed a substantial amount of money to promote this trend. The amount of data collected by businesses globally is increasing due to this culture. The Internet of Things and the "bring your own device" movement, two new paradigms, have significantly altered the employment of smart applications in the government, retail, healthcare, and IT & telecommunications sectors. Improvements in the underlying technology and the broad adoption of next-generation network-powered solutions stimulate the development of security assurance applications. In light of this, the demand for security assurance is anticipated to increase over the next few years.
The growing threat of phishing & malware to enterprises
There has been a considerable rise in the capability of malicious software, such as viruses or Trojan horses, to penetrate, take control of, or cause harm to entire electronic information networks. Malware is widely utilized by cybercriminals who steal data or make monetary gains online to gain control of computers or other devices. This is done so that the device can be utilized immediately in dishonest activities such as fraud or other illegal acts. In addition, companies operating in the healthcare, banking, financial services, and government sectors are especially susceptible to these kinds of attacks because of the significance of the data generated in these areas. These factors are increasing the market growth.
Market Restraining Factors
Validation, elucidation, and modelling of security requirements
Throughout the early stages of the system's development, several methodologies concentrated on eliciting and modeling the security needs of the system. Unfortunately, these approaches have not been extensively embraced since it is difficult to apply them to industries as a result of a mismatch between the current process of development and these methodologies. Furthermore, these techniques are not only challenging to understand but do not provide a documenting process for the security aspects of IT systems. It is anticipated that the adoption of security assurance will be limited due to these concerns, which would, in turn, limit the expansion of the market.
Type Outlook
By type, the security assurance market is segmented into business applications, system & network infrastructure, and mobility solutions. In 2021, the mobility solutions segment procured a promising growth rate in the security assurance market. It is believed that the rapidly rising number of mobile devices worldwide is one of the driving causes behind the market expansion. In addition, networks are becoming more susceptible to cyberattacks as the demand for mobile devices and connections increases. As a result, the growth of the mobility solutions business has been accelerated.
Organization Size Outlook
Based on organization size, the security assurance market is categorized into large sized organizations and small & medium sized organization. The large sized organizations segment witnessed the largest revenue share in the security assurance market in 2021. This is as a result of surplus reserves and revenues that can be used for upgrading operations. In addition, the security is the major concern of most of the large businesses as a result of which the security assurance approach is widely being adopted by them. It is predicted to support the market growth in this segment.
Vertical Outlook
On the basis of vertical, the security assurance market is fragmented into BFSI, IT & telecom, government & commercial offices, healthcare, retail, manufacturing and others. The IT & telecom segment recorded a remarkable revenue share in the security assurance market in 2021. This results from the market's quick growth and expansion due to the demand for instant communication. Systems need a security assurance framework to guarantee business continuity and data security. In addition, security intelligence necessitates a wide range of innovative solutions.
Regional Outlook
Region wise, the security assurance market is analyzed across North America, Europe, Asia Pacific and LAMEA. In 2021, the North America region led the security assurance market by generating the highest revenue share. Businesses are making investments in developing technologies in the North American region to increase productivity. The North America's security assurance market is expanding due to the increased competition amongst cloud-based provider businesses, where key competitors are providing better information protection by guaranteeing quick access and greater customer outreach.
The major strategies followed by the market participants are Partnerships. Based on the Analysis presented in the Cardinal matrix; Microsoft Corporation are the forerunners in the Security Assurance Market. Companies such as Accenture PLC, Infosys Limited, and Tenable Holdings, Inc. are some of the key innovators in Security Assurance Market.
The market research report covers the analysis of key stake holders of the market. Key companies profiled in the report include Accenture PLC, Microsoft Corporation, Infosys Limited, IBM Corporation, Capgemini SE, Avaya, Inc. (Avaya Holdings Corp.), Spirent Communications plc, Tenable Holdings, Inc., Happiest Minds Technologies Limited and SAS Institute, Inc.
Recent Strategies Deployed in Security Assurance Market
Partnerships, Collaborations & Agreements:
Oct-2022: IBM signed an agreement with BPER Banca Group, a banking group based in Italy. Through this agreement, companies would help boost the bank's evolution into a truly digital business. Furthermore, this agreement would broaden the bank's hybrid cloud strategy to advance its technology infrastructure and applications, integrating the security, reliability, and scalability of IBM Cloud for Financial Services to help address the compliance needs of the heavily regulated industry.
Sep-2022: Infosys collaborated with Belgium Post, a postal operator based in Europe. Through this collaboration, Infosys securely boosted Bpost's cloud transformation drive with its customized Cloud SecOps delivery model. The model enhances Bpost's Azure and AWS cloud security position by leveraging the Infosys Cyber Next platform.
Jun-2022: Infosys teamed up with TK Elevator, a global elevator company. Following this collaboration, Infosys would deliver AI-powered IT helpdesk services, digital workplace management, also network services supported by Infosys Cobalt-driven automation framework. Moreover, Infosys would accelerate Cybersecurity and improve the digital experience for TK Elevator's end users.
May-2022: Infosys joined hands with Palo Alto Networks, the global Cybersecurity company. This collaboration would enhance the security maturity of large enterprises with key digital landscapes and help protect against the threat of cyber-attacks on their key infrastructure. Additionally, both companies would bring their expertise to boost the creation of the latest network security solutions.
Apr-2022: Microsoft announced a partnership with HCL Technologies, a consulting and Information technology Company. This partnership is aimed to bring security capabilities to clients globally. Moreover, the partnership would aim to help enterprises through the current complex and interconnected landscape.
Mar-2022: Accenture collaborated with Vodafone Germany, a mobile telecommunication company. Under this collaboration, both companies would offer managed security services to small to medium-sized enterprises across Germany.
Dec-2021: Accenture came into collaboration with Generali, a global insurance and asset management provider, and Vodafone Business, a mobile telecommunication company. Following this Collaboration, Accenture would bring together the right talent and technology to fit particular industries to help clients from Cyber risks and threats. Additionally, in this collaboration, Accenture would show the capability to develop global solutions that would address local requirements.
Sep-2021: Microsoft partnered with At-Bay, a cyber-insurance company. This partnership brings key visibility and decision-making support to the market as businesses seek a complete way to empower hybrid workforces with stronger, centralized clarity and control over cloud applications accelerating productivity and security.
Apr-2021: Avaya partnered with Semafone, a data security and compliance solutions provider for contact and call centers. The partnership would aim to help contact center customers solve the complex security and compliance issues faced as they embrace work from anywhere model.
Product Launches and Product Expansions:
Feb-2023: Spirent Communications announced the launch of end-to-end, ODU, and RIC testing, completing its O-RAN test solution offering. This expansion would boost widespread O-RAN adoption. Moreover, Spirents comprehensive testing approach and 5G ecosystem specialization would make sure O-RAN functionality, interoperability, and field-ready performance.
May-2022: Spirent Communications plc released a new security automation package as part of the 5G Core Automation Platform for Spirent Landslide. The product delivers control plane testing with a complete library of expert-designed test cases for 3GPP Security Assurance Specification standards and security attack emulation.
May-2022: Microsoft unveiled Microsoft Defender, the stand-alone version for business. The product for business would bring enterprise-grade endpoint security to SMBs, consisting of endpoint detection and response capabilities to shield against ransom ware and other sophisticated cyber threats.
Acquisitions and Mergers:
Feb-2023: Accenture took over Morphus, a provider of risk management, cyber defense, and cyber threat intelligence services. With this acquisition, Morphus's specialization in deep Cybersecurity research, threat intelligence, and cyber defense services, Accenture would broaden its Cybersecurity reach across Latin America.
Oct-2022: IBM came into an agreement to acquire Spanugo, a cloud security posture management company. Following this acquisition, IBM would combine Spanugo's software into its public cloud to help meet the compliance and security requirements of its customers in regulated areas like healthcare and banking.
Jun-2022: Microsoft completed the acquisition of Miburo, a cyber-threat analysis and research company. Following this acquisition, companies would accelerate threat intelligence research into the latest foreign cyber threats. Additionally, Miburo would allow Microsoft to broaden its threat detection and analysis capabilities to address new cyber-attacks.
Jul-2021: Microsoft Corporation took over CloudKnox Security, a platform created to safeguard resources and identities over multi-cloud and hybrid cloud environments. This acquisition aimed for customers to be able to right-size permissions and enforce least-privilege principles, employing continuous analytics to aid prevent security breaches.
Jun-2021: Accenture completed the acquisition of Sentor, a provider of cyber defense and managed security services. This acquisition broadens Accenture's capability to help clients overcome the challenging cybersecurity environment, as well as to help businesses in Sweden become more flexible.
Apr-2022: Tenable Holdings acquired Bit Discovery, a leader in external attack surface management (EASM). This acquisition aimed to combine Tenable's Cyber Exposure solutions with Bit Discovery's EASM capabilities, which would offer customers a differentiated 360-degree view of the modern attack surface to detect and remove areas of known and unknown security risk.
Mar-2022: Tenable Holdings, Inc. completed the acquisition of Cymptom, the attack path software specialist. This acquisition would enhance the attack-level understanding of its platform for recognizing and addressing cyber vulnerabilities.
Geographical Expansions:
Mar-2022: Capgemini expanded its business to Malaga, Spain with its Cyber Defense Center and a Cloud services Center. The new facility would strengthen the Group's international network of Cyber Defense Centers, with a commitment to Cybersecurity services backed by artificial intelligence, Incident response, and ERP security.
Scope of the Study
Market Segments covered in the Report:
By Type
- Business Applications
- System & Network Infrastructure
- Mobility Solutions
By Organization Size
- Large Size Organizations
- Small & Medium Sized Organizations
By Vertical
- BFSI
- IT & Telecom
- Healthcare
- Retail
- Government
- Manufacturing
- Others
By Geography
- North America
- US
- Canada
- Mexico
- Rest of North America
- Europe
- Germany
- UK
- France
- Russia
- Spain
- Italy
- Rest of Europe
- Asia Pacific
- China
- Japan
- India
- South Korea
- Singapore
- Malaysia
- Rest of Asia Pacific
- LAMEA
- Brazil
- Argentina
- UAE
- Saudi Arabia
- South Africa
- Nigeria
- Rest of LAMEA
Companies Profiled
- Accenture PLC
- Microsoft Corporation
- Infosys Limited
- IBM Corporation
- Capgemini SE
- Avaya, Inc. (Avaya Holdings Corp.)
- Spirent Communications plc
- Tenable Holdings, Inc.
- Happiest Minds Technologies Limited
- SAS Institute, Inc.
Unique Offerings from KBV Research
- Exhaustive coverage
- Highest number of market tables and figures
- Subscription based model available
- Guaranteed best price
- Assured post sales research support with 10% customization free
Table of Contents
Chapter 1. Market Scope & Methodology
- 1.1 Market Definition
- 1.2 Objectives
- 1.3 Market Scope
- 1.4 Segmentation
- 1.4.1 Global Security Assurance Market, by Type
- 1.4.2 Global Security Assurance Market, by Organization Size
- 1.4.3 Global Security Assurance Market, by Vertical
- 1.4.4 Global Security Assurance Market, by Geography
- 1.5 Methodology for the research
Chapter 2. Market Overview
- 2.1 Introduction
- 2.1.1 Overview
- 2.1.1.1 Market Composition & Scenario
- 2.1.1 Overview
- 2.2 Key Factors Impacting the Market
- 2.2.1 Market Drivers
- 2.2.2 Market Restraints
Chapter 3. Competition Analysis - Global
- 3.1 KBV Cardinal Matrix
- 3.2 Recent Industry Wide Strategic Developments
- 3.2.1 Partnerships, Collaborations and Agreements
- 3.2.2 Product Launches and Product Expansions
- 3.2.3 Acquisition and Mergers
- 3.2.4 Geographical Expansions
- 3.3 Top Winning Strategies
- 3.3.1 Key Leading Strategies: Percentage Distribution (2018-2022)
- 3.3.2 Key Strategic Move: (Partnerships, Collaborations & Agreements : 2019, Sep - 2022, Oct) Leading Players
Chapter 4. Global Security Assurance Market by Type
- 4.1 Global Business Applications Market by Region
- 4.2 Global System & Network Infrastructure Market by Region
- 4.3 Global Mobility Solutions Market by Region
Chapter 5. Global Security Assurance Market by Organization Size
- 5.1 Global Large Size Organizations Market by Region
- 5.2 Global Small & Medium Sized Organizations Market by Region
Chapter 6. Global Security Assurance Market by Vertical
- 6.1 Global BFSI Market by Region
- 6.2 Global IT & Telecom Market by Region
- 6.3 Global Healthcare Market by Region
- 6.4 Global Retail Market by Region
- 6.5 Global Government Market by Region
- 6.6 Global Manufacturing Market by Region
- 6.7 Global Others Market by Region
Chapter 7. Global Security Assurance Market by Region
- 7.1 North America Security Assurance Market
- 7.1.1 North America Security Assurance Market by Type
- 7.1.1.1 North America Business Applications Market by Country
- 7.1.1.2 North America System & Network Infrastructure Market by Country
- 7.1.1.3 North America Mobility Solutions Market by Country
- 7.1.2 North America Security Assurance Market by Organization Size
- 7.1.2.1 North America Large Size Organizations Market by Country
- 7.1.2.2 North America Small & Medium Sized Organizations Market by Country
- 7.1.3 North America Security Assurance Market by Vertical
- 7.1.3.1 North America BFSI Market by Country
- 7.1.3.2 North America IT & Telecom Market by Country
- 7.1.3.3 North America Healthcare Market by Country
- 7.1.3.4 North America Retail Market by Country
- 7.1.3.5 North America Government Market by Country
- 7.1.3.6 North America Manufacturing Market by Country
- 7.1.3.7 North America Others Market by Country
- 7.1.4 North America Security Assurance Market by Country
- 7.1.4.1 US Security Assurance Market
- 7.1.4.1.1 US Security Assurance Market by Type
- 7.1.4.1.2 US Security Assurance Market by Organization Size
- 7.1.4.1.3 US Security Assurance Market by Vertical
- 7.1.4.2 Canada Security Assurance Market
- 7.1.4.2.1 Canada Security Assurance Market by Type
- 7.1.4.2.2 Canada Security Assurance Market by Organization Size
- 7.1.4.2.3 Canada Security Assurance Market by Vertical
- 7.1.4.3 Mexico Security Assurance Market
- 7.1.4.3.1 Mexico Security Assurance Market by Type
- 7.1.4.3.2 Mexico Security Assurance Market by Organization Size
- 7.1.4.3.3 Mexico Security Assurance Market by Vertical
- 7.1.4.4 Rest of North America Security Assurance Market
- 7.1.4.4.1 Rest of North America Security Assurance Market by Type
- 7.1.4.4.2 Rest of North America Security Assurance Market by Organization Size
- 7.1.4.4.3 Rest of North America Security Assurance Market by Vertical
- 7.1.4.1 US Security Assurance Market
- 7.1.1 North America Security Assurance Market by Type
- 7.2 Europe Security Assurance Market
- 7.2.1 Europe Security Assurance Market by Type
- 7.2.1.1 Europe Business Applications Market by Country
- 7.2.1.2 Europe System & Network Infrastructure Market by Country
- 7.2.1.3 Europe Mobility Solutions Market by Country
- 7.2.2 Europe Security Assurance Market by Organization Size
- 7.2.2.1 Europe Large Size Organizations Market by Country
- 7.2.2.2 Europe Small & Medium Sized Organizations Market by Country
- 7.2.3 Europe Security Assurance Market by Vertical
- 7.2.3.1 Europe BFSI Market by Country
- 7.2.3.2 Europe IT & Telecom Market by Country
- 7.2.3.3 Europe Healthcare Market by Country
- 7.2.3.4 Europe Retail Market by Country
- 7.2.3.5 Europe Government Market by Country
- 7.2.3.6 Europe Manufacturing Market by Country
- 7.2.3.7 Europe Others Market by Country
- 7.2.4 Europe Security Assurance Market by Country
- 7.2.4.1 Germany Security Assurance Market
- 7.2.4.1.1 Germany Security Assurance Market by Type
- 7.2.4.1.2 Germany Security Assurance Market by Organization Size
- 7.2.4.1.3 Germany Security Assurance Market by Vertical
- 7.2.4.2 UK Security Assurance Market
- 7.2.4.2.1 UK Security Assurance Market by Type
- 7.2.4.2.2 UK Security Assurance Market by Organization Size
- 7.2.4.2.3 UK Security Assurance Market by Vertical
- 7.2.4.3 France Security Assurance Market
- 7.2.4.3.1 France Security Assurance Market by Type
- 7.2.4.3.2 France Security Assurance Market by Organization Size
- 7.2.4.3.3 France Security Assurance Market by Vertical
- 7.2.4.4 Russia Security Assurance Market
- 7.2.4.4.1 Russia Security Assurance Market by Type
- 7.2.4.4.2 Russia Security Assurance Market by Organization Size
- 7.2.4.4.3 Russia Security Assurance Market by Vertical
- 7.2.4.5 Spain Security Assurance Market
- 7.2.4.5.1 Spain Security Assurance Market by Type
- 7.2.4.5.2 Spain Security Assurance Market by Organization Size
- 7.2.4.5.3 Spain Security Assurance Market by Vertical
- 7.2.4.6 Italy Security Assurance Market
- 7.2.4.6.1 Italy Security Assurance Market by Type
- 7.2.4.6.2 Italy Security Assurance Market by Organization Size
- 7.2.4.6.3 Italy Security Assurance Market by Vertical
- 7.2.4.7 Rest of Europe Security Assurance Market
- 7.2.4.7.1 Rest of Europe Security Assurance Market by Type
- 7.2.4.7.2 Rest of Europe Security Assurance Market by Organization Size
- 7.2.4.7.3 Rest of Europe Security Assurance Market by Vertical
- 7.2.4.1 Germany Security Assurance Market
- 7.2.1 Europe Security Assurance Market by Type
- 7.3 Asia Pacific Security Assurance Market
- 7.3.1 Asia Pacific Security Assurance Market by Type
- 7.3.1.1 Asia Pacific Business Applications Market by Country
- 7.3.1.2 Asia Pacific System & Network Infrastructure Market by Country
- 7.3.1.3 Asia Pacific Mobility Solutions Market by Country
- 7.3.2 Asia Pacific Security Assurance Market by Organization Size
- 7.3.2.1 Asia Pacific Large Size Organizations Market by Country
- 7.3.2.2 Asia Pacific Small & Medium Sized Organizations Market by Country
- 7.3.3 Asia Pacific Security Assurance Market by Vertical
- 7.3.3.1 Asia Pacific BFSI Market by Country
- 7.3.3.2 Asia Pacific IT & Telecom Market by Country
- 7.3.3.3 Asia Pacific Healthcare Market by Country
- 7.3.3.4 Asia Pacific Retail Market by Country
- 7.3.3.5 Asia Pacific Government Market by Country
- 7.3.3.6 Asia Pacific Manufacturing Market by Country
- 7.3.3.7 Asia Pacific Others Market by Country
- 7.3.4 Asia Pacific Security Assurance Market by Country
- 7.3.4.1 China Security Assurance Market
- 7.3.4.1.1 China Security Assurance Market by Type
- 7.3.4.1.2 China Security Assurance Market by Organization Size
- 7.3.4.1.3 China Security Assurance Market by Vertical
- 7.3.4.2 Japan Security Assurance Market
- 7.3.4.2.1 Japan Security Assurance Market by Type
- 7.3.4.2.2 Japan Security Assurance Market by Organization Size
- 7.3.4.2.3 Japan Security Assurance Market by Vertical
- 7.3.4.3 India Security Assurance Market
- 7.3.4.3.1 India Security Assurance Market by Type
- 7.3.4.3.2 India Security Assurance Market by Organization Size
- 7.3.4.3.3 India Security Assurance Market by Vertical
- 7.3.4.4 South Korea Security Assurance Market
- 7.3.4.4.1 South Korea Security Assurance Market by Type
- 7.3.4.4.2 South Korea Security Assurance Market by Organization Size
- 7.3.4.4.3 South Korea Security Assurance Market by Vertical
- 7.3.4.5 Singapore Security Assurance Market
- 7.3.4.5.1 Singapore Security Assurance Market by Type
- 7.3.4.5.2 Singapore Security Assurance Market by Organization Size
- 7.3.4.5.3 Singapore Security Assurance Market by Vertical
- 7.3.4.6 Malaysia Security Assurance Market
- 7.3.4.6.1 Malaysia Security Assurance Market by Type
- 7.3.4.6.2 Malaysia Security Assurance Market by Organization Size
- 7.3.4.6.3 Malaysia Security Assurance Market by Vertical
- 7.3.4.7 Rest of Asia Pacific Security Assurance Market
- 7.3.4.7.1 Rest of Asia Pacific Security Assurance Market by Type
- 7.3.4.7.2 Rest of Asia Pacific Security Assurance Market by Organization Size
- 7.3.4.7.3 Rest of Asia Pacific Security Assurance Market by Vertical
- 7.3.4.1 China Security Assurance Market
- 7.3.1 Asia Pacific Security Assurance Market by Type
- 7.4 LAMEA Security Assurance Market
- 7.4.1 LAMEA Security Assurance Market by Type
- 7.4.1.1 LAMEA Business Applications Market by Country
- 7.4.1.2 LAMEA System & Network Infrastructure Market by Country
- 7.4.1.3 LAMEA Mobility Solutions Market by Country
- 7.4.2 LAMEA Security Assurance Market by Organization Size
- 7.4.2.1 LAMEA Large Size Organizations Market by Country
- 7.4.2.2 LAMEA Small & Medium Sized Organizations Market by Country
- 7.4.3 LAMEA Security Assurance Market by Vertical
- 7.4.3.1 LAMEA BFSI Market by Country
- 7.4.3.2 LAMEA IT & Telecom Market by Country
- 7.4.3.3 LAMEA Healthcare Market by Country
- 7.4.3.4 LAMEA Retail Market by Country
- 7.4.3.5 LAMEA Government Market by Country
- 7.4.3.6 LAMEA Manufacturing Market by Country
- 7.4.3.7 LAMEA Others Market by Country
- 7.4.4 LAMEA Security Assurance Market by Country
- 7.4.4.1 Brazil Security Assurance Market
- 7.4.4.1.1 Brazil Security Assurance Market by Type
- 7.4.4.1.2 Brazil Security Assurance Market by Organization Size
- 7.4.4.1.3 Brazil Security Assurance Market by Vertical
- 7.4.4.2 Argentina Security Assurance Market
- 7.4.4.2.1 Argentina Security Assurance Market by Type
- 7.4.4.2.2 Argentina Security Assurance Market by Organization Size
- 7.4.4.2.3 Argentina Security Assurance Market by Vertical
- 7.4.4.3 UAE Security Assurance Market
- 7.4.4.3.1 UAE Security Assurance Market by Type
- 7.4.4.3.2 UAE Security Assurance Market by Organization Size
- 7.4.4.3.3 UAE Security Assurance Market by Vertical
- 7.4.4.4 Saudi Arabia Security Assurance Market
- 7.4.4.4.1 Saudi Arabia Security Assurance Market by Type
- 7.4.4.4.2 Saudi Arabia Security Assurance Market by Organization Size
- 7.4.4.4.3 Saudi Arabia Security Assurance Market by Vertical
- 7.4.4.5 South Africa Security Assurance Market
- 7.4.4.5.1 South Africa Security Assurance Market by Type
- 7.4.4.5.2 South Africa Security Assurance Market by Organization Size
- 7.4.4.5.3 South Africa Security Assurance Market by Vertical
- 7.4.4.6 Nigeria Security Assurance Market
- 7.4.4.6.1 Nigeria Security Assurance Market by Type
- 7.4.4.6.2 Nigeria Security Assurance Market by Organization Size
- 7.4.4.6.3 Nigeria Security Assurance Market by Vertical
- 7.4.4.7 Rest of LAMEA Security Assurance Market
- 7.4.4.7.1 Rest of LAMEA Security Assurance Market by Type
- 7.4.4.7.2 Rest of LAMEA Security Assurance Market by Organization Size
- 7.4.4.7.3 Rest of LAMEA Security Assurance Market by Vertical
- 7.4.4.1 Brazil Security Assurance Market
- 7.4.1 LAMEA Security Assurance Market by Type
Chapter 8. Company Profiles
- 8.1 Accenture PLC
- 8.1.1 Company Overview
- 8.1.2 Segmental and Regional Analysis
- 8.1.3 Research & Development Expenses
- 8.1.4 Recent strategies and developments:
- 8.1.4.1 Partnerships, Collaborations, and Agreements:
- 8.1.4.2 Acquisition and Mergers:
- 8.1.5 SWOT Analysis
- 8.2 Microsoft Corporation
- 8.2.1 Company Overview
- 8.2.2 Financial Analysis
- 8.2.3 Segmental and Regional Analysis
- 8.2.4 Research & Development Expenses
- 8.2.5 Recent strategies and developments:
- 8.2.5.1 Product Launches and Product Expansions:
- 8.2.5.2 Acquisition and Mergers:
- 8.2.5.3 Partnerships, Collaborations & Agreements
- 8.2.6 SWOT Analysis
- 8.3 Infosys Limited
- 8.3.1 Company Overview
- 8.3.2 Financial Analysis
- 8.3.3 Segmental and Regional Analysis
- 8.3.4 Research & Development Expense
- 8.3.5 Recent strategies and developments:
- 8.3.5.1 Partnerships, Collaborations, and Agreements:
- 8.3.6 SWOT Analysis
- 8.4 IBM Corporation
- 8.4.1 Company Overview
- 8.4.2 Financial Analysis
- 8.4.3 Regional & Segmental Analysis
- 8.4.4 Research & Development Expenses
- 8.4.5 Recent strategies and developments:
- 8.4.5.1 Partnerships, Collaborations, and Agreements:
- 8.4.5.2 Acquisition and Mergers:
- 8.4.6 SWOT Analysis
- 8.5 Capgemini SE
- 8.5.1 Company Overview
- 8.5.2 Financial Analysis
- 8.5.3 Regional Analysis
- 8.5.4 Recent strategies and developments:
- 8.5.4.1 Acquisition and Mergers:
- 8.5.4.2 Geographical Expansions:
- 8.6 Avaya Inc. (Avaya Holdings Corp.)
- 8.6.1 Company Overview
- 8.6.2 Financial Analysis
- 8.6.3 Segmental and Regional Analysis
- 8.6.4 Research & Development Expenses
- 8.6.5 Recent strategies and developments:
- 8.6.5.1 Partnerships, Collaborations, and Agreements:
- 8.7 Spirent Communications plc
- 8.7.1 Company Overview
- 8.7.2 Financial Analysis
- 8.7.3 Segmental and Regional Analysis
- 8.7.4 Research & Development Expenses
- 8.7.5 Recent strategies and developments:
- 8.7.5.1 Product Launches and Product Expansions:
- 8.8 Tenable Holdings, Inc.
- 8.8.1 Company Overview
- 8.8.2 Financial Analysis
- 8.8.3 Regional Analysis
- 8.8.4 Research & Development Expenses
- 8.8.5 Recent strategies and developments:
- 8.8.5.1 Acquisition and Mergers:
- 8.9 Happiest Minds Technologies Limited
- 8.9.1 Company Overview
- 8.10. SAS Institute, Inc.
- 8.10.1 Company Overview