|
|
市場調査レポート
商品コード
1245758
車載スキャナの世界市場規模、シェア、産業動向分析レポートスキャナタイプ別(固定式、ポータブル)、構造タイプ別、用途別(政府、民間)、コンポーネント別、地域別展望・予測、2022~2028年Global Vehicle Scanner Market Size, Share & Industry Trends Analysis Report By Scanner Type (Fixed and Portable), By Structure Type, By Application (Government and Private), By Component, By Regional Outlook and Forecast, 2022 - 2028 |
||||||
|
|
|||||||


| 車載スキャナの世界市場規模、シェア、産業動向分析レポートスキャナタイプ別(固定式、ポータブル)、構造タイプ別、用途別(政府、民間)、コンポーネント別、地域別展望・予測、2022~2028年 |
|
出版日: 2023年02月28日
発行: KBV Research
ページ情報: 英文 227 Pages
納期: 即納可能
|
- 全表示
- 概要
- 図表
- 目次
車両用スキャナーの世界市場規模は、予測期間中にCAGR6.2%で成長し、2028年には41億米ドルに達すると予測されます。
また、予測期間中、車体全体のスキャンに対する需要が高まり、新たなビジネスチャンスが生まれると考えられます。車両用スキャナーが提供するソリューションには、車両のスキャン、処理、センシング、イメージングが含まれます。この技術は車両全体の安全性に大きく影響するため、このようなスキャナーに対する需要が徐々に高まっている理由です。また、ハッキング事件やテロ活動などの増加により、セキュリティ機能を備えた自動車への需要が高まっています。
最近の料金所は、モノのインターネット(IoT)のような技術の助けを借りて統合ネットワークに相互接続され、人間の不正確さを最小限に抑えて正確なデータを収集・保存するために車のスキャンを採用しているので、車両スキャナーは料金所でも大いに役立っています。車両スキャンでloTを使用すると、運用コストとスキャン時間が削減されます。
COVID-19の影響度分析
車載用スキャナーの売上は、自動車、家電などの最終用途産業の需要に直結しています。しかし、COVID-19の流行による輸出入規制、国境制限、サプライチェーンの遅延は、自動車分野の需要に大きな影響を及ぼしました。また、景気低迷の影響により、圧倒的な国費がヘルスケア産業に向けられたため、新車スキャナ構想の確立が阻害され、市場に大きな悪影響を与えました。
市場成長要因
世界の自動車の需要増と生産量の増加
世界の先進国では、精密で改良されたスピーディーな診断装置を搭載した自動車の購入が盛んになっています。特にプレミアムカーの需要は、セダンからSUVへの顧客嗜好の変化や消費者の可処分所得の増加などの要因が重なり、世界的に大きく伸びています。また、新興経済諸国における購買力の向上も、自動車需要の増加に寄与しています。その結果、ドイツ、フランス、イタリア、スペインでは、より新しい最先端のスキャン技術が使用されるようになってきています。
環境の安全・安心に対する不安の高まり
車両用スキャナーは、国境侵入、人身売買、密輸などの違法行為を防止するために大きな需要があります。収益の増加を後押ししている重要な要素は、強化されたセキュリティ・ソリューションに対する需要の増加です。これらのソリューションは、乗客に不便を強いることなく、継続的に検査を行う必要があります。数年前より、自動車台数の増加に伴い、安全対策や操作性を向上させる機能性が求められています。また、自動車メーカーは、製品の安全性を高め、消費者の要求を満たすために、最先端技術の研究開発への投資を増やしています。
市場の抑制要因
高度なスキャンツールは、スタートコストが高い
自動車診断には、非常に高度な技術が使われており、その分コストも高くなっています。これは、自動車が厳しい安全規制を遵守する必要があるためです。そのため、新しい規制が導入されるたびに、機器も更新する必要があります。洗練された車両用スキャナーは価格が高く、オペレーティングシステムやソフトウェア、その他の技術革新のアップグレードが頻繁に必要となるため、機器全体のコストが上昇する可能性があります。したがって、予測期間中、市場開拓は車両用スキャナーの高い設置費用だけでなく、メンテナンス費用によっても制約を受けることになるでしょう。
スキャナタイプの展望
スキャナタイプに基づき、車両用スキャナ市場はポータブルと固定に二分されます。2021年の車両スキャナー市場では、固定型が最も高い収益シェアを獲得しています。固定式車両スキャナーは、スキャン速度が30~60km/h(キロメートル/時)の範囲にあり、継続的に動作する車両スキャナー検問所の設置に使用されます。また、固定式自動車診断スキャナーシステムは、その下に設置されます。写真を認識し、スキャンし、比較することで、警備員の業務をより簡単に、より安全に、より効率的に行うことができます。
構造タイプ別展望
構造タイプに基づいて、車両スキャナー市場はドライブスルーと車両下スキャンシステム(UVSS)に分けられます。ドライブスルーセグメントは、2021年に車両スキャナ市場で大きな収益シェアを記録しました。このセグメントは、道路、航空、海上で輸送される物品の動向の高まりにより成長しており、セキュリティへの懸念の高まりにより高い需要を生み出しています。頻繁に、フルボディスキャナーはドライブスルー車両スキャナーとも呼ばれます。ドライブスルースキャナーは、政府機関、軍事施設、その他の制限の多い場所に設置されます。
アプリケーションの展望
用途に基づき、車両スキャナー市場は政府と民間に区分されます。民間セグメントは、2021年の車両スキャナー市場で顕著な成長率を獲得しました。民間や商業部門では、車両や貨物検査用のセキュリティスキャナーが、人、貨物、車両、およびその内容物のスクリーニングに使用されます。さらに、プロのメカニックは、モジュールとスクリーンを備えたスキャン装置を採用しています。デバイスを接続すると、車の部品、アクセサリー、重要なエンジン部品の機械的状態を評価することができます。その結果、問題が悪化する前に、すぐに車を修理することができます。
コンポーネントのアウトルック
コンポーネントベースで、車両スキャナー市場は、カメラ、照明ユニット、バリア、ソフトウェア、その他に分類されます。カメラセグメントは、2021年の車両スキャナー市場で最も高い収益シェアを調達しました。車両下検査カメラを使用することで、車両下自動車コードリーダーシステムは、危険物や違法物を見つけるための物理的な器具が不要になります。その代わり、関係者が写真を見ながらそのようなものを発見し、周囲に注意を促すことで、自動車事故を未然に防ぐことができます。検査カメラの精度や効果は、撮影した3D画像に依存します。
地域の展望
地域別に見ると、車両スキャナー市場は、北米、欧州、アジア太平洋、LAMEAで分析されています。北米セグメントは、2021年に車両スキャナー市場で最大の収益シェアを記録しました。駐車場、軍港、空港、その他の専門的かつ政府的な環境では、車両スキャナーの需要が高いため、そのような場所でのこれらのツールの使用率の増加が、このセグメントの拡大を促進しています。この地域では、テロ攻撃の増加や地域社会の安全に対する懸念から、公共機関や民間施設の保護に対するニーズが高まっています。セキュリティと安全に対する懸念の高まりから、車両用スキャナーの需要は高く、予測期間を通じて市場拡大の原動力となることが期待されます。
目次
第1章 市場の範囲と調査手法
- 市場の定義
- 目的
- 市場の範囲
- セグメンテーション
- 車載スキャナの世界市場、スキャナタイプ別
- 車載スキャナーの世界市場、構造タイプ別
- 車載スキャナーの世界市場:用途別
- 車載スキャナーの世界市場:コンポーネント別
- 車載スキャナーの世界市場、地域別
- 調査手法
第2章 市場の概要
- イントロダクションです
- 概要
- 市場の構成とシナリオ
- 概要
- 市場に影響を与える主要因
- 市場促進要因
- 市場抑制要因
第3章 車載スキャナーの世界市場:スキャナタイプ別
- 固定型の世界市場:地域別
- ポータブルの世界市場:地域別
第4章 車載スキャナーの世界市場:構造タイプ別
- アンダービークル・スキャニングシステム(UVSS)の世界市場:地域別
- ドライブスルーの世界市場:地域別
第5章 車両用スキャナーの世界市場:アプリケーション別
- 官公庁の世界市場:地域別
- 民間の世界市場:地域別
第6章 車両用スキャナの世界市場:コンポーネント別
- カメラの世界市場:地域別
- ソフトウェアの世界市場:地域別
- バリアの世界市場:地域別
- 照明ユニットの世界市場:地域別
- 地域別その他市場の世界市場
第7章 車載スキャナーの世界市場:地域別市場
- 北米
- 北米の車載スキャナーの国別市場
- 米国
- カナダ
- メキシコ
- その他北米地域
- 北米の車載スキャナーの国別市場
- 欧州
- 欧州車載スキャナーの国別市場
- ドイツ
- 英国
- フランス
- ロシア
- スペイン
- イタリア
- その他欧州
- 欧州車載スキャナーの国別市場
- アジア太平洋地域
- アジア太平洋地域の車載スキャナーの国別市場について
- 中国
- 日本
- インド
- 韓国
- シンガポール
- マレーシア
- その他アジア太平洋地域
- アジア太平洋地域の車載スキャナーの国別市場について
- LAMEA
- LAMEA車載スキャナーの国別市場
- ブラジル
- アルゼンチン
- UAE
- サウジアラビア
- 南アフリカ
- ナイジェリア
- LAMEAの残りの地域
- LAMEA車載スキャナーの国別市場
第8章 企業プロファイル
- Leidos Holdings, Inc.
- Godrej & Boyce Mfg. Co. Ltd.(Godrej Security Solutions)
- International Road Dynamics, Inc.(WiLAN)(Quarterhill Inc.)
- Gatekeeper Security, Inc.(OSI Systems, Inc.)
- UVeye Ltd.
- Advanced Detection Technology, LLC(HWH Investments Ltd)
- Omnitec Group
- Tescon Sicherheitssysteme AG
- VMI Security(Prime Holding Group)
- SCANLAB GmbH(TecInvest Holding AG)
LIST OF TABLES
- TABLE 1 Global Vehicle Scanner Market, 2018 - 2021, USD Million
- TABLE 2 Global Vehicle Scanner Market, 2022 - 2028, USD Million
- TABLE 3 Global Vehicle Scanner Market by Scanner Type, 2018 - 2021, USD Million
- TABLE 4 Global Vehicle Scanner Market by Scanner Type, 2022 - 2028, USD Million
- TABLE 5 Global Fixed Market by Region, 2018 - 2021, USD Million
- TABLE 6 Global Fixed Market by Region, 2022 - 2028, USD Million
- TABLE 7 Global Portable Market by Region, 2018 - 2021, USD Million
- TABLE 8 Global Portable Market by Region, 2022 - 2028, USD Million
- TABLE 9 Global Vehicle Scanner Market by Structure Type, 2018 - 2021, USD Million
- TABLE 10 Global Vehicle Scanner Market by Structure Type, 2022 - 2028, USD Million
- TABLE 11 Global Under Vehicle Scanning Systems (UVSS) Market by Region, 2018 - 2021, USD Million
- TABLE 12 Global Under Vehicle Scanning Systems (UVSS) Market by Region, 2022 - 2028, USD Million
- TABLE 13 Global Drive-through Market by Region, 2018 - 2021, USD Million
- TABLE 14 Global Drive-through Market by Region, 2022 - 2028, USD Million
- TABLE 15 Global Vehicle Scanner Market by Application, 2018 - 2021, USD Million
- TABLE 16 Global Vehicle Scanner Market by Application, 2022 - 2028, USD Million
- TABLE 17 Global Government Market by Region, 2018 - 2021, USD Million
- TABLE 18 Global Government Market by Region, 2022 - 2028, USD Million
- TABLE 19 Global Private Market by Region, 2018 - 2021, USD Million
- TABLE 20 Global Private Market by Region, 2022 - 2028, USD Million
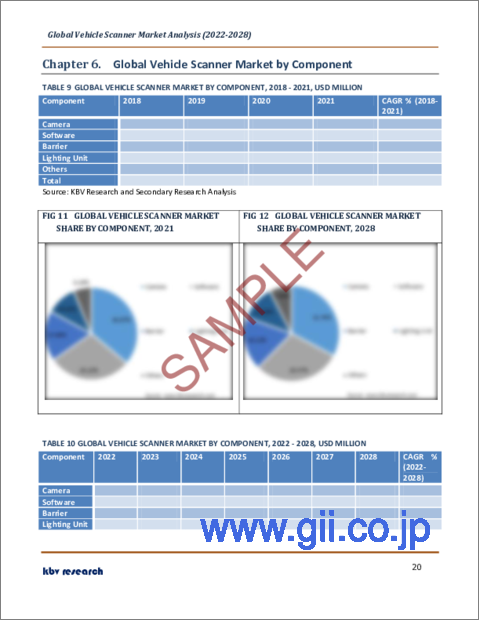
- TABLE 21 Global Vehicle Scanner Market by Component, 2018 - 2021, USD Million
- TABLE 22 Global Vehicle Scanner Market by Component, 2022 - 2028, USD Million
- TABLE 23 Global Camera Market by Region, 2018 - 2021, USD Million
- TABLE 24 Global Camera Market by Region, 2022 - 2028, USD Million
- TABLE 25 Global Software Market by Region, 2018 - 2021, USD Million
- TABLE 26 Global Software Market by Region, 2022 - 2028, USD Million
- TABLE 27 Global Barrier Market by Region, 2018 - 2021, USD Million
- TABLE 28 Global Barrier Market by Region, 2022 - 2028, USD Million
- TABLE 29 Global Lighting Unit Market by Region, 2018 - 2021, USD Million
- TABLE 30 Global Lighting Unit Market by Region, 2022 - 2028, USD Million
- TABLE 31 Global Others Market by Region, 2018 - 2021, USD Million
- TABLE 32 Global Others Market by Region, 2022 - 2028, USD Million
- TABLE 33 Global Vehicle Scanner Market by Region, 2018 - 2021, USD Million
- TABLE 34 Global Vehicle Scanner Market by Region, 2022 - 2028, USD Million
- TABLE 35 North America Vehicle Scanner Market, 2018 - 2021, USD Million
- TABLE 36 North America Vehicle Scanner Market, 2022 - 2028, USD Million
- TABLE 37 North America Vehicle Scanner Market by Scanner Type, 2018 - 2021, USD Million
- TABLE 38 North America Vehicle Scanner Market by Scanner Type, 2022 - 2028, USD Million
- TABLE 39 North America Fixed Market by Country, 2018 - 2021, USD Million
- TABLE 40 North America Fixed Market by Country, 2022 - 2028, USD Million
- TABLE 41 North America Portable Market by Country, 2018 - 2021, USD Million
- TABLE 42 North America Portable Market by Country, 2022 - 2028, USD Million
- TABLE 43 North America Vehicle Scanner Market by Structure Type, 2018 - 2021, USD Million
- TABLE 44 North America Vehicle Scanner Market by Structure Type, 2022 - 2028, USD Million
- TABLE 45 North America Under Vehicle Scanning Systems (UVSS) Market by Country, 2018 - 2021, USD Million
- TABLE 46 North America Under Vehicle Scanning Systems (UVSS) Market by Country, 2022 - 2028, USD Million
- TABLE 47 North America Drive-through Market by Country, 2018 - 2021, USD Million
- TABLE 48 North America Drive-through Market by Country, 2022 - 2028, USD Million
- TABLE 49 North America Vehicle Scanner Market by Application, 2018 - 2021, USD Million
- TABLE 50 North America Vehicle Scanner Market by Application, 2022 - 2028, USD Million
- TABLE 51 North America Government Market by Country, 2018 - 2021, USD Million
- TABLE 52 North America Government Market by Country, 2022 - 2028, USD Million
- TABLE 53 North America Private Market by Country, 2018 - 2021, USD Million
- TABLE 54 North America Private Market by Country, 2022 - 2028, USD Million
- TABLE 55 North America Vehicle Scanner Market by Component, 2018 - 2021, USD Million
- TABLE 56 North America Vehicle Scanner Market by Component, 2022 - 2028, USD Million
- TABLE 57 North America Camera Market by Country, 2018 - 2021, USD Million
- TABLE 58 North America Camera Market by Country, 2022 - 2028, USD Million
- TABLE 59 North America Software Market by Country, 2018 - 2021, USD Million
- TABLE 60 North America Software Market by Country, 2022 - 2028, USD Million
- TABLE 61 North America Barrier Market by Country, 2018 - 2021, USD Million
- TABLE 62 North America Barrier Market by Country, 2022 - 2028, USD Million
- TABLE 63 North America Lighting Unit Market by Country, 2018 - 2021, USD Million
- TABLE 64 North America Lighting Unit Market by Country, 2022 - 2028, USD Million
- TABLE 65 North America Others Market by Country, 2018 - 2021, USD Million
- TABLE 66 North America Others Market by Country, 2022 - 2028, USD Million
- TABLE 67 North America Vehicle Scanner Market by Country, 2018 - 2021, USD Million
- TABLE 68 North America Vehicle Scanner Market by Country, 2022 - 2028, USD Million
- TABLE 69 US Vehicle Scanner Market, 2018 - 2021, USD Million
- TABLE 70 US Vehicle Scanner Market, 2022 - 2028, USD Million
- TABLE 71 US Vehicle Scanner Market by Scanner Type, 2018 - 2021, USD Million
- TABLE 72 US Vehicle Scanner Market by Scanner Type, 2022 - 2028, USD Million
- TABLE 73 US Vehicle Scanner Market by Structure Type, 2018 - 2021, USD Million
- TABLE 74 US Vehicle Scanner Market by Structure Type, 2022 - 2028, USD Million
- TABLE 75 US Vehicle Scanner Market by Application, 2018 - 2021, USD Million
- TABLE 76 US Vehicle Scanner Market by Application, 2022 - 2028, USD Million
- TABLE 77 US Vehicle Scanner Market by Component, 2018 - 2021, USD Million
- TABLE 78 US Vehicle Scanner Market by Component, 2022 - 2028, USD Million
- TABLE 79 Canada Vehicle Scanner Market, 2018 - 2021, USD Million
- TABLE 80 Canada Vehicle Scanner Market, 2022 - 2028, USD Million
- TABLE 81 Canada Vehicle Scanner Market by Scanner Type, 2018 - 2021, USD Million
- TABLE 82 Canada Vehicle Scanner Market by Scanner Type, 2022 - 2028, USD Million
- TABLE 83 Canada Vehicle Scanner Market by Structure Type, 2018 - 2021, USD Million
- TABLE 84 Canada Vehicle Scanner Market by Structure Type, 2022 - 2028, USD Million
- TABLE 85 Canada Vehicle Scanner Market by Application, 2018 - 2021, USD Million
- TABLE 86 Canada Vehicle Scanner Market by Application, 2022 - 2028, USD Million
- TABLE 87 Canada Vehicle Scanner Market by Component, 2018 - 2021, USD Million
- TABLE 88 Canada Vehicle Scanner Market by Component, 2022 - 2028, USD Million
- TABLE 89 Mexico Vehicle Scanner Market, 2018 - 2021, USD Million
- TABLE 90 Mexico Vehicle Scanner Market, 2022 - 2028, USD Million
- TABLE 91 Mexico Vehicle Scanner Market by Scanner Type, 2018 - 2021, USD Million
- TABLE 92 Mexico Vehicle Scanner Market by Scanner Type, 2022 - 2028, USD Million
- TABLE 93 Mexico Vehicle Scanner Market by Structure Type, 2018 - 2021, USD Million
- TABLE 94 Mexico Vehicle Scanner Market by Structure Type, 2022 - 2028, USD Million
- TABLE 95 Mexico Vehicle Scanner Market by Application, 2018 - 2021, USD Million
- TABLE 96 Mexico Vehicle Scanner Market by Application, 2022 - 2028, USD Million
- TABLE 97 Mexico Vehicle Scanner Market by Component, 2018 - 2021, USD Million
- TABLE 98 Mexico Vehicle Scanner Market by Component, 2022 - 2028, USD Million
- TABLE 99 Rest of North America Vehicle Scanner Market, 2018 - 2021, USD Million
- TABLE 100 Rest of North America Vehicle Scanner Market, 2022 - 2028, USD Million
- TABLE 101 Rest of North America Vehicle Scanner Market by Scanner Type, 2018 - 2021, USD Million
- TABLE 102 Rest of North America Vehicle Scanner Market by Scanner Type, 2022 - 2028, USD Million
- TABLE 103 Rest of North America Vehicle Scanner Market by Structure Type, 2018 - 2021, USD Million
- TABLE 104 Rest of North America Vehicle Scanner Market by Structure Type, 2022 - 2028, USD Million
- TABLE 105 Rest of North America Vehicle Scanner Market by Application, 2018 - 2021, USD Million
- TABLE 106 Rest of North America Vehicle Scanner Market by Application, 2022 - 2028, USD Million
- TABLE 107 Rest of North America Vehicle Scanner Market by Component, 2018 - 2021, USD Million
- TABLE 108 Rest of North America Vehicle Scanner Market by Component, 2022 - 2028, USD Million
- TABLE 109 Europe Vehicle Scanner Market, 2018 - 2021, USD Million
- TABLE 110 Europe Vehicle Scanner Market, 2022 - 2028, USD Million
- TABLE 111 Europe Vehicle Scanner Market by Scanner Type, 2018 - 2021, USD Million
- TABLE 112 Europe Vehicle Scanner Market by Scanner Type, 2022 - 2028, USD Million
- TABLE 113 Europe Fixed Market by Country, 2018 - 2021, USD Million
- TABLE 114 Europe Fixed Market by Country, 2022 - 2028, USD Million
- TABLE 115 Europe Portable Market by Country, 2018 - 2021, USD Million
- TABLE 116 Europe Portable Market by Country, 2022 - 2028, USD Million
- TABLE 117 Europe Vehicle Scanner Market by Structure Type, 2018 - 2021, USD Million
- TABLE 118 Europe Vehicle Scanner Market by Structure Type, 2022 - 2028, USD Million
- TABLE 119 Europe Under Vehicle Scanning Systems (UVSS) Market by Country, 2018 - 2021, USD Million
- TABLE 120 Europe Under Vehicle Scanning Systems (UVSS) Market by Country, 2022 - 2028, USD Million
- TABLE 121 Europe Drive-through Market by Country, 2018 - 2021, USD Million
- TABLE 122 Europe Drive-through Market by Country, 2022 - 2028, USD Million
- TABLE 123 Europe Vehicle Scanner Market by Application, 2018 - 2021, USD Million
- TABLE 124 Europe Vehicle Scanner Market by Application, 2022 - 2028, USD Million
- TABLE 125 Europe Government Market by Country, 2018 - 2021, USD Million
- TABLE 126 Europe Government Market by Country, 2022 - 2028, USD Million
- TABLE 127 Europe Private Market by Country, 2018 - 2021, USD Million
- TABLE 128 Europe Private Market by Country, 2022 - 2028, USD Million
- TABLE 129 Europe Vehicle Scanner Market by Component, 2018 - 2021, USD Million
- TABLE 130 Europe Vehicle Scanner Market by Component, 2022 - 2028, USD Million
- TABLE 131 Europe Camera Market by Country, 2018 - 2021, USD Million
- TABLE 132 Europe Camera Market by Country, 2022 - 2028, USD Million
- TABLE 133 Europe Software Market by Country, 2018 - 2021, USD Million
- TABLE 134 Europe Software Market by Country, 2022 - 2028, USD Million
- TABLE 135 Europe Barrier Market by Country, 2018 - 2021, USD Million
- TABLE 136 Europe Barrier Market by Country, 2022 - 2028, USD Million
- TABLE 137 Europe Lighting Unit Market by Country, 2018 - 2021, USD Million
- TABLE 138 Europe Lighting Unit Market by Country, 2022 - 2028, USD Million
- TABLE 139 Europe Others Market by Country, 2018 - 2021, USD Million
- TABLE 140 Europe Others Market by Country, 2022 - 2028, USD Million
- TABLE 141 Europe Vehicle Scanner Market by Country, 2018 - 2021, USD Million
- TABLE 142 Europe Vehicle Scanner Market by Country, 2022 - 2028, USD Million
- TABLE 143 Germany Vehicle Scanner Market, 2018 - 2021, USD Million
- TABLE 144 Germany Vehicle Scanner Market, 2022 - 2028, USD Million
- TABLE 145 Germany Vehicle Scanner Market by Scanner Type, 2018 - 2021, USD Million
- TABLE 146 Germany Vehicle Scanner Market by Scanner Type, 2022 - 2028, USD Million
- TABLE 147 Germany Vehicle Scanner Market by Structure Type, 2018 - 2021, USD Million
- TABLE 148 Germany Vehicle Scanner Market by Structure Type, 2022 - 2028, USD Million
- TABLE 149 Germany Vehicle Scanner Market by Application, 2018 - 2021, USD Million
- TABLE 150 Germany Vehicle Scanner Market by Application, 2022 - 2028, USD Million
- TABLE 151 Germany Vehicle Scanner Market by Component, 2018 - 2021, USD Million
- TABLE 152 Germany Vehicle Scanner Market by Component, 2022 - 2028, USD Million
- TABLE 153 UK Vehicle Scanner Market, 2018 - 2021, USD Million
- TABLE 154 UK Vehicle Scanner Market, 2022 - 2028, USD Million
- TABLE 155 UK Vehicle Scanner Market by Scanner Type, 2018 - 2021, USD Million
- TABLE 156 UK Vehicle Scanner Market by Scanner Type, 2022 - 2028, USD Million
- TABLE 157 UK Vehicle Scanner Market by Structure Type, 2018 - 2021, USD Million
- TABLE 158 UK Vehicle Scanner Market by Structure Type, 2022 - 2028, USD Million
- TABLE 159 UK Vehicle Scanner Market by Application, 2018 - 2021, USD Million
- TABLE 160 UK Vehicle Scanner Market by Application, 2022 - 2028, USD Million
- TABLE 161 UK Vehicle Scanner Market by Component, 2018 - 2021, USD Million
- TABLE 162 UK Vehicle Scanner Market by Component, 2022 - 2028, USD Million
- TABLE 163 France Vehicle Scanner Market, 2018 - 2021, USD Million
- TABLE 164 France Vehicle Scanner Market, 2022 - 2028, USD Million
- TABLE 165 France Vehicle Scanner Market by Scanner Type, 2018 - 2021, USD Million
- TABLE 166 France Vehicle Scanner Market by Scanner Type, 2022 - 2028, USD Million
- TABLE 167 France Vehicle Scanner Market by Structure Type, 2018 - 2021, USD Million
- TABLE 168 France Vehicle Scanner Market by Structure Type, 2022 - 2028, USD Million
- TABLE 169 France Vehicle Scanner Market by Application, 2018 - 2021, USD Million
- TABLE 170 France Vehicle Scanner Market by Application, 2022 - 2028, USD Million
- TABLE 171 France Vehicle Scanner Market by Component, 2018 - 2021, USD Million
- TABLE 172 France Vehicle Scanner Market by Component, 2022 - 2028, USD Million
- TABLE 173 Russia Vehicle Scanner Market, 2018 - 2021, USD Million
- TABLE 174 Russia Vehicle Scanner Market, 2022 - 2028, USD Million
- TABLE 175 Russia Vehicle Scanner Market by Scanner Type, 2018 - 2021, USD Million
- TABLE 176 Russia Vehicle Scanner Market by Scanner Type, 2022 - 2028, USD Million
- TABLE 177 Russia Vehicle Scanner Market by Structure Type, 2018 - 2021, USD Million
- TABLE 178 Russia Vehicle Scanner Market by Structure Type, 2022 - 2028, USD Million
- TABLE 179 Russia Vehicle Scanner Market by Application, 2018 - 2021, USD Million
- TABLE 180 Russia Vehicle Scanner Market by Application, 2022 - 2028, USD Million
- TABLE 181 Russia Vehicle Scanner Market by Component, 2018 - 2021, USD Million
- TABLE 182 Russia Vehicle Scanner Market by Component, 2022 - 2028, USD Million
- TABLE 183 Spain Vehicle Scanner Market, 2018 - 2021, USD Million
- TABLE 184 Spain Vehicle Scanner Market, 2022 - 2028, USD Million
- TABLE 185 Spain Vehicle Scanner Market by Scanner Type, 2018 - 2021, USD Million
- TABLE 186 Spain Vehicle Scanner Market by Scanner Type, 2022 - 2028, USD Million
- TABLE 187 Spain Vehicle Scanner Market by Structure Type, 2018 - 2021, USD Million
- TABLE 188 Spain Vehicle Scanner Market by Structure Type, 2022 - 2028, USD Million
- TABLE 189 Spain Vehicle Scanner Market by Application, 2018 - 2021, USD Million
- TABLE 190 Spain Vehicle Scanner Market by Application, 2022 - 2028, USD Million
- TABLE 191 Spain Vehicle Scanner Market by Component, 2018 - 2021, USD Million
- TABLE 192 Spain Vehicle Scanner Market by Component, 2022 - 2028, USD Million
- TABLE 193 Italy Vehicle Scanner Market, 2018 - 2021, USD Million
- TABLE 194 Italy Vehicle Scanner Market, 2022 - 2028, USD Million
- TABLE 195 Italy Vehicle Scanner Market by Scanner Type, 2018 - 2021, USD Million
- TABLE 196 Italy Vehicle Scanner Market by Scanner Type, 2022 - 2028, USD Million
- TABLE 197 Italy Vehicle Scanner Market by Structure Type, 2018 - 2021, USD Million
- TABLE 198 Italy Vehicle Scanner Market by Structure Type, 2022 - 2028, USD Million
- TABLE 199 Italy Vehicle Scanner Market by Application, 2018 - 2021, USD Million
- TABLE 200 Italy Vehicle Scanner Market by Application, 2022 - 2028, USD Million
- TABLE 201 Italy Vehicle Scanner Market by Component, 2018 - 2021, USD Million
- TABLE 202 Italy Vehicle Scanner Market by Component, 2022 - 2028, USD Million
- TABLE 203 Rest of Europe Vehicle Scanner Market, 2018 - 2021, USD Million
- TABLE 204 Rest of Europe Vehicle Scanner Market, 2022 - 2028, USD Million
- TABLE 205 Rest of Europe Vehicle Scanner Market by Scanner Type, 2018 - 2021, USD Million
- TABLE 206 Rest of Europe Vehicle Scanner Market by Scanner Type, 2022 - 2028, USD Million
- TABLE 207 Rest of Europe Vehicle Scanner Market by Structure Type, 2018 - 2021, USD Million
- TABLE 208 Rest of Europe Vehicle Scanner Market by Structure Type, 2022 - 2028, USD Million
- TABLE 209 Rest of Europe Vehicle Scanner Market by Application, 2018 - 2021, USD Million
- TABLE 210 Rest of Europe Vehicle Scanner Market by Application, 2022 - 2028, USD Million
- TABLE 211 Rest of Europe Vehicle Scanner Market by Component, 2018 - 2021, USD Million
- TABLE 212 Rest of Europe Vehicle Scanner Market by Component, 2022 - 2028, USD Million
- TABLE 213 Asia Pacific Vehicle Scanner Market, 2018 - 2021, USD Million
- TABLE 214 Asia Pacific Vehicle Scanner Market, 2022 - 2028, USD Million
- TABLE 215 Asia Pacific Vehicle Scanner Market by Scanner Type, 2018 - 2021, USD Million
- TABLE 216 Asia Pacific Vehicle Scanner Market by Scanner Type, 2022 - 2028, USD Million
- TABLE 217 Asia Pacific Fixed Market by Country, 2018 - 2021, USD Million
- TABLE 218 Asia Pacific Fixed Market by Country, 2022 - 2028, USD Million
- TABLE 219 Asia Pacific Portable Market by Country, 2018 - 2021, USD Million
- TABLE 220 Asia Pacific Portable Market by Country, 2022 - 2028, USD Million
- TABLE 221 Asia Pacific Vehicle Scanner Market by Structure Type, 2018 - 2021, USD Million
- TABLE 222 Asia Pacific Vehicle Scanner Market by Structure Type, 2022 - 2028, USD Million
- TABLE 223 Asia Pacific Under Vehicle Scanning Systems (UVSS) Market by Country, 2018 - 2021, USD Million
- TABLE 224 Asia Pacific Under Vehicle Scanning Systems (UVSS) Market by Country, 2022 - 2028, USD Million
- TABLE 225 Asia Pacific Drive-through Market by Country, 2018 - 2021, USD Million
- TABLE 226 Asia Pacific Drive-through Market by Country, 2022 - 2028, USD Million
- TABLE 227 Asia Pacific Vehicle Scanner Market by Application, 2018 - 2021, USD Million
- TABLE 228 Asia Pacific Vehicle Scanner Market by Application, 2022 - 2028, USD Million
- TABLE 229 Asia Pacific Government Market by Country, 2018 - 2021, USD Million
- TABLE 230 Asia Pacific Government Market by Country, 2022 - 2028, USD Million
- TABLE 231 Asia Pacific Private Market by Country, 2018 - 2021, USD Million
- TABLE 232 Asia Pacific Private Market by Country, 2022 - 2028, USD Million
- TABLE 233 Asia Pacific Vehicle Scanner Market by Component, 2018 - 2021, USD Million
- TABLE 234 Asia Pacific Vehicle Scanner Market by Component, 2022 - 2028, USD Million
- TABLE 235 Asia Pacific Camera Market by Country, 2018 - 2021, USD Million
- TABLE 236 Asia Pacific Camera Market by Country, 2022 - 2028, USD Million
- TABLE 237 Asia Pacific Software Market by Country, 2018 - 2021, USD Million
- TABLE 238 Asia Pacific Software Market by Country, 2022 - 2028, USD Million
- TABLE 239 Asia Pacific Barrier Market by Country, 2018 - 2021, USD Million
- TABLE 240 Asia Pacific Barrier Market by Country, 2022 - 2028, USD Million
- TABLE 241 Asia Pacific Lighting Unit Market by Country, 2018 - 2021, USD Million
- TABLE 242 Asia Pacific Lighting Unit Market by Country, 2022 - 2028, USD Million
- TABLE 243 Asia Pacific Others Market by Country, 2018 - 2021, USD Million
- TABLE 244 Asia Pacific Others Market by Country, 2022 - 2028, USD Million
- TABLE 245 Asia Pacific Vehicle Scanner Market by Country, 2018 - 2021, USD Million
- TABLE 246 Asia Pacific Vehicle Scanner Market by Country, 2022 - 2028, USD Million
- TABLE 247 China Vehicle Scanner Market, 2018 - 2021, USD Million
- TABLE 248 China Vehicle Scanner Market, 2022 - 2028, USD Million
- TABLE 249 China Vehicle Scanner Market by Scanner Type, 2018 - 2021, USD Million
- TABLE 250 China Vehicle Scanner Market by Scanner Type, 2022 - 2028, USD Million
- TABLE 251 China Vehicle Scanner Market by Structure Type, 2018 - 2021, USD Million
- TABLE 252 China Vehicle Scanner Market by Structure Type, 2022 - 2028, USD Million
- TABLE 253 China Vehicle Scanner Market by Application, 2018 - 2021, USD Million
- TABLE 254 China Vehicle Scanner Market by Application, 2022 - 2028, USD Million
- TABLE 255 China Vehicle Scanner Market by Component, 2018 - 2021, USD Million
- TABLE 256 China Vehicle Scanner Market by Component, 2022 - 2028, USD Million
- TABLE 257 Japan Vehicle Scanner Market, 2018 - 2021, USD Million
- TABLE 258 Japan Vehicle Scanner Market, 2022 - 2028, USD Million
- TABLE 259 Japan Vehicle Scanner Market by Scanner Type, 2018 - 2021, USD Million
- TABLE 260 Japan Vehicle Scanner Market by Scanner Type, 2022 - 2028, USD Million
- TABLE 261 Japan Vehicle Scanner Market by Structure Type, 2018 - 2021, USD Million
- TABLE 262 Japan Vehicle Scanner Market by Structure Type, 2022 - 2028, USD Million
- TABLE 263 Japan Vehicle Scanner Market by Application, 2018 - 2021, USD Million
- TABLE 264 Japan Vehicle Scanner Market by Application, 2022 - 2028, USD Million
- TABLE 265 Japan Vehicle Scanner Market by Component, 2018 - 2021, USD Million
- TABLE 266 Japan Vehicle Scanner Market by Component, 2022 - 2028, USD Million
- TABLE 267 India Vehicle Scanner Market, 2018 - 2021, USD Million
- TABLE 268 India Vehicle Scanner Market, 2022 - 2028, USD Million
- TABLE 269 India Vehicle Scanner Market by Scanner Type, 2018 - 2021, USD Million
- TABLE 270 India Vehicle Scanner Market by Scanner Type, 2022 - 2028, USD Million
- TABLE 271 India Vehicle Scanner Market by Structure Type, 2018 - 2021, USD Million
- TABLE 272 India Vehicle Scanner Market by Structure Type, 2022 - 2028, USD Million
- TABLE 273 India Vehicle Scanner Market by Application, 2018 - 2021, USD Million
- TABLE 274 India Vehicle Scanner Market by Application, 2022 - 2028, USD Million
- TABLE 275 India Vehicle Scanner Market by Component, 2018 - 2021, USD Million
- TABLE 276 India Vehicle Scanner Market by Component, 2022 - 2028, USD Million
- TABLE 277 South Korea Vehicle Scanner Market, 2018 - 2021, USD Million
- TABLE 278 South Korea Vehicle Scanner Market, 2022 - 2028, USD Million
- TABLE 279 South Korea Vehicle Scanner Market by Scanner Type, 2018 - 2021, USD Million
- TABLE 280 South Korea Vehicle Scanner Market by Scanner Type, 2022 - 2028, USD Million
- TABLE 281 South Korea Vehicle Scanner Market by Structure Type, 2018 - 2021, USD Million
- TABLE 282 South Korea Vehicle Scanner Market by Structure Type, 2022 - 2028, USD Million
- TABLE 283 South Korea Vehicle Scanner Market by Application, 2018 - 2021, USD Million
- TABLE 284 South Korea Vehicle Scanner Market by Application, 2022 - 2028, USD Million
- TABLE 285 South Korea Vehicle Scanner Market by Component, 2018 - 2021, USD Million
- TABLE 286 South Korea Vehicle Scanner Market by Component, 2022 - 2028, USD Million
- TABLE 287 Singapore Vehicle Scanner Market, 2018 - 2021, USD Million
- TABLE 288 Singapore Vehicle Scanner Market, 2022 - 2028, USD Million
- TABLE 289 Singapore Vehicle Scanner Market by Scanner Type, 2018 - 2021, USD Million
- TABLE 290 Singapore Vehicle Scanner Market by Scanner Type, 2022 - 2028, USD Million
- TABLE 291 Singapore Vehicle Scanner Market by Structure Type, 2018 - 2021, USD Million
- TABLE 292 Singapore Vehicle Scanner Market by Structure Type, 2022 - 2028, USD Million
- TABLE 293 Singapore Vehicle Scanner Market by Application, 2018 - 2021, USD Million
- TABLE 294 Singapore Vehicle Scanner Market by Application, 2022 - 2028, USD Million
- TABLE 295 Singapore Vehicle Scanner Market by Component, 2018 - 2021, USD Million
- TABLE 296 Singapore Vehicle Scanner Market by Component, 2022 - 2028, USD Million
- TABLE 297 Malaysia Vehicle Scanner Market, 2018 - 2021, USD Million
- TABLE 298 Malaysia Vehicle Scanner Market, 2022 - 2028, USD Million
- TABLE 299 Malaysia Vehicle Scanner Market by Scanner Type, 2018 - 2021, USD Million
- TABLE 300 Malaysia Vehicle Scanner Market by Scanner Type, 2022 - 2028, USD Million
- TABLE 301 Malaysia Vehicle Scanner Market by Structure Type, 2018 - 2021, USD Million
- TABLE 302 Malaysia Vehicle Scanner Market by Structure Type, 2022 - 2028, USD Million
- TABLE 303 Malaysia Vehicle Scanner Market by Application, 2018 - 2021, USD Million
- TABLE 304 Malaysia Vehicle Scanner Market by Application, 2022 - 2028, USD Million
- TABLE 305 Malaysia Vehicle Scanner Market by Component, 2018 - 2021, USD Million
- TABLE 306 Malaysia Vehicle Scanner Market by Component, 2022 - 2028, USD Million
- TABLE 307 Rest of Asia Pacific Vehicle Scanner Market, 2018 - 2021, USD Million
- TABLE 308 Rest of Asia Pacific Vehicle Scanner Market, 2022 - 2028, USD Million
- TABLE 309 Rest of Asia Pacific Vehicle Scanner Market by Scanner Type, 2018 - 2021, USD Million
- TABLE 310 Rest of Asia Pacific Vehicle Scanner Market by Scanner Type, 2022 - 2028, USD Million
- TABLE 311 Rest of Asia Pacific Vehicle Scanner Market by Structure Type, 2018 - 2021, USD Million
- TABLE 312 Rest of Asia Pacific Vehicle Scanner Market by Structure Type, 2022 - 2028, USD Million
- TABLE 313 Rest of Asia Pacific Vehicle Scanner Market by Application, 2018 - 2021, USD Million
- TABLE 314 Rest of Asia Pacific Vehicle Scanner Market by Application, 2022 - 2028, USD Million
- TABLE 315 Rest of Asia Pacific Vehicle Scanner Market by Component, 2018 - 2021, USD Million
- TABLE 316 Rest of Asia Pacific Vehicle Scanner Market by Component, 2022 - 2028, USD Million
- TABLE 317 LAMEA Vehicle Scanner Market, 2018 - 2021, USD Million
- TABLE 318 LAMEA Vehicle Scanner Market, 2022 - 2028, USD Million
- TABLE 319 LAMEA Vehicle Scanner Market by Scanner Type, 2018 - 2021, USD Million
- TABLE 320 LAMEA Vehicle Scanner Market by Scanner Type, 2022 - 2028, USD Million
- TABLE 321 LAMEA Fixed Market by Country, 2018 - 2021, USD Million
- TABLE 322 LAMEA Fixed Market by Country, 2022 - 2028, USD Million
- TABLE 323 LAMEA Portable Market by Country, 2018 - 2021, USD Million
- TABLE 324 LAMEA Portable Market by Country, 2022 - 2028, USD Million
- TABLE 325 LAMEA Vehicle Scanner Market by Structure Type, 2018 - 2021, USD Million
- TABLE 326 LAMEA Vehicle Scanner Market by Structure Type, 2022 - 2028, USD Million
- TABLE 327 LAMEA Under Vehicle Scanning Systems (UVSS) Market by Country, 2018 - 2021, USD Million
- TABLE 328 LAMEA Under Vehicle Scanning Systems (UVSS) Market by Country, 2022 - 2028, USD Million
- TABLE 329 LAMEA Drive-through Market by Country, 2018 - 2021, USD Million
- TABLE 330 LAMEA Drive-through Market by Country, 2022 - 2028, USD Million
- TABLE 331 LAMEA Vehicle Scanner Market by Application, 2018 - 2021, USD Million
- TABLE 332 LAMEA Vehicle Scanner Market by Application, 2022 - 2028, USD Million
- TABLE 333 LAMEA Government Market by Country, 2018 - 2021, USD Million
- TABLE 334 LAMEA Government Market by Country, 2022 - 2028, USD Million
- TABLE 335 LAMEA Private Market by Country, 2018 - 2021, USD Million
- TABLE 336 LAMEA Private Market by Country, 2022 - 2028, USD Million
- TABLE 337 LAMEA Vehicle Scanner Market by Component, 2018 - 2021, USD Million
- TABLE 338 LAMEA Vehicle Scanner Market by Component, 2022 - 2028, USD Million
- TABLE 339 LAMEA Camera Market by Country, 2018 - 2021, USD Million
- TABLE 340 LAMEA Camera Market by Country, 2022 - 2028, USD Million
- TABLE 341 LAMEA Software Market by Country, 2018 - 2021, USD Million
- TABLE 342 LAMEA Software Market by Country, 2022 - 2028, USD Million
- TABLE 343 LAMEA Barrier Market by Country, 2018 - 2021, USD Million
- TABLE 344 LAMEA Barrier Market by Country, 2022 - 2028, USD Million
- TABLE 345 LAMEA Lighting Unit Market by Country, 2018 - 2021, USD Million
- TABLE 346 LAMEA Lighting Unit Market by Country, 2022 - 2028, USD Million
- TABLE 347 LAMEA Others Market by Country, 2018 - 2021, USD Million
- TABLE 348 LAMEA Others Market by Country, 2022 - 2028, USD Million
- TABLE 349 LAMEA Vehicle Scanner Market by Country, 2018 - 2021, USD Million
- TABLE 350 LAMEA Vehicle Scanner Market by Country, 2022 - 2028, USD Million
- TABLE 351 Brazil Vehicle Scanner Market, 2018 - 2021, USD Million
- TABLE 352 Brazil Vehicle Scanner Market, 2022 - 2028, USD Million
- TABLE 353 Brazil Vehicle Scanner Market by Scanner Type, 2018 - 2021, USD Million
- TABLE 354 Brazil Vehicle Scanner Market by Scanner Type, 2022 - 2028, USD Million
- TABLE 355 Brazil Vehicle Scanner Market by Structure Type, 2018 - 2021, USD Million
- TABLE 356 Brazil Vehicle Scanner Market by Structure Type, 2022 - 2028, USD Million
- TABLE 357 Brazil Vehicle Scanner Market by Application, 2018 - 2021, USD Million
- TABLE 358 Brazil Vehicle Scanner Market by Application, 2022 - 2028, USD Million
- TABLE 359 Brazil Vehicle Scanner Market by Component, 2018 - 2021, USD Million
- TABLE 360 Brazil Vehicle Scanner Market by Component, 2022 - 2028, USD Million
- TABLE 361 Argentina Vehicle Scanner Market, 2018 - 2021, USD Million
- TABLE 362 Argentina Vehicle Scanner Market, 2022 - 2028, USD Million
- TABLE 363 Argentina Vehicle Scanner Market by Scanner Type, 2018 - 2021, USD Million
- TABLE 364 Argentina Vehicle Scanner Market by Scanner Type, 2022 - 2028, USD Million
- TABLE 365 Argentina Vehicle Scanner Market by Structure Type, 2018 - 2021, USD Million
- TABLE 366 Argentina Vehicle Scanner Market by Structure Type, 2022 - 2028, USD Million
- TABLE 367 Argentina Vehicle Scanner Market by Application, 2018 - 2021, USD Million
- TABLE 368 Argentina Vehicle Scanner Market by Application, 2022 - 2028, USD Million
- TABLE 369 Argentina Vehicle Scanner Market by Component, 2018 - 2021, USD Million
- TABLE 370 Argentina Vehicle Scanner Market by Component, 2022 - 2028, USD Million
- TABLE 371 UAE Vehicle Scanner Market, 2018 - 2021, USD Million
- TABLE 372 UAE Vehicle Scanner Market, 2022 - 2028, USD Million
- TABLE 373 UAE Vehicle Scanner Market by Scanner Type, 2018 - 2021, USD Million
- TABLE 374 UAE Vehicle Scanner Market by Scanner Type, 2022 - 2028, USD Million
- TABLE 375 UAE Vehicle Scanner Market by Structure Type, 2018 - 2021, USD Million
- TABLE 376 UAE Vehicle Scanner Market by Structure Type, 2022 - 2028, USD Million
- TABLE 377 UAE Vehicle Scanner Market by Application, 2018 - 2021, USD Million
- TABLE 378 UAE Vehicle Scanner Market by Application, 2022 - 2028, USD Million
- TABLE 379 UAE Vehicle Scanner Market by Component, 2018 - 2021, USD Million
- TABLE 380 UAE Vehicle Scanner Market by Component, 2022 - 2028, USD Million
- TABLE 381 Saudi Arabia Vehicle Scanner Market, 2018 - 2021, USD Million
- TABLE 382 Saudi Arabia Vehicle Scanner Market, 2022 - 2028, USD Million
- TABLE 383 Saudi Arabia Vehicle Scanner Market by Scanner Type, 2018 - 2021, USD Million
- TABLE 384 Saudi Arabia Vehicle Scanner Market by Scanner Type, 2022 - 2028, USD Million
- TABLE 385 Saudi Arabia Vehicle Scanner Market by Structure Type, 2018 - 2021, USD Million
- TABLE 386 Saudi Arabia Vehicle Scanner Market by Structure Type, 2022 - 2028, USD Million
- TABLE 387 Saudi Arabia Vehicle Scanner Market by Application, 2018 - 2021, USD Million
- TABLE 388 Saudi Arabia Vehicle Scanner Market by Application, 2022 - 2028, USD Million
- TABLE 389 Saudi Arabia Vehicle Scanner Market by Component, 2018 - 2021, USD Million
- TABLE 390 Saudi Arabia Vehicle Scanner Market by Component, 2022 - 2028, USD Million
- TABLE 391 South Africa Vehicle Scanner Market, 2018 - 2021, USD Million
- TABLE 392 South Africa Vehicle Scanner Market, 2022 - 2028, USD Million
- TABLE 393 South Africa Vehicle Scanner Market by Scanner Type, 2018 - 2021, USD Million
- TABLE 394 South Africa Vehicle Scanner Market by Scanner Type, 2022 - 2028, USD Million
- TABLE 395 South Africa Vehicle Scanner Market by Structure Type, 2018 - 2021, USD Million
- TABLE 396 South Africa Vehicle Scanner Market by Structure Type, 2022 - 2028, USD Million
- TABLE 397 South Africa Vehicle Scanner Market by Application, 2018 - 2021, USD Million
- TABLE 398 South Africa Vehicle Scanner Market by Application, 2022 - 2028, USD Million
- TABLE 399 South Africa Vehicle Scanner Market by Component, 2018 - 2021, USD Million
- TABLE 400 South Africa Vehicle Scanner Market by Component, 2022 - 2028, USD Million
- TABLE 401 Nigeria Vehicle Scanner Market, 2018 - 2021, USD Million
- TABLE 402 Nigeria Vehicle Scanner Market, 2022 - 2028, USD Million
- TABLE 403 Nigeria Vehicle Scanner Market by Scanner Type, 2018 - 2021, USD Million
- TABLE 404 Nigeria Vehicle Scanner Market by Scanner Type, 2022 - 2028, USD Million
- TABLE 405 Nigeria Vehicle Scanner Market by Structure Type, 2018 - 2021, USD Million
- TABLE 406 Nigeria Vehicle Scanner Market by Structure Type, 2022 - 2028, USD Million
- TABLE 407 Nigeria Vehicle Scanner Market by Application, 2018 - 2021, USD Million
- TABLE 408 Nigeria Vehicle Scanner Market by Application, 2022 - 2028, USD Million
- TABLE 409 Nigeria Vehicle Scanner Market by Component, 2018 - 2021, USD Million
- TABLE 410 Nigeria Vehicle Scanner Market by Component, 2022 - 2028, USD Million
- TABLE 411 Rest of LAMEA Vehicle Scanner Market, 2018 - 2021, USD Million
- TABLE 412 Rest of LAMEA Vehicle Scanner Market, 2022 - 2028, USD Million
- TABLE 413 Rest of LAMEA Vehicle Scanner Market by Scanner Type, 2018 - 2021, USD Million
- TABLE 414 Rest of LAMEA Vehicle Scanner Market by Scanner Type, 2022 - 2028, USD Million
- TABLE 415 Rest of LAMEA Vehicle Scanner Market by Structure Type, 2018 - 2021, USD Million
- TABLE 416 Rest of LAMEA Vehicle Scanner Market by Structure Type, 2022 - 2028, USD Million
- TABLE 417 Rest of LAMEA Vehicle Scanner Market by Application, 2018 - 2021, USD Million
- TABLE 418 Rest of LAMEA Vehicle Scanner Market by Application, 2022 - 2028, USD Million
- TABLE 419 Rest of LAMEA Vehicle Scanner Market by Component, 2018 - 2021, USD Million
- TABLE 420 Rest of LAMEA Vehicle Scanner Market by Component, 2022 - 2028, USD Million
- TABLE 421 key information - Leidos Holdings, Inc.
- TABLE 422 key information - Godrej & Boyce Mfg. Co. Ltd.
- TABLE 423 Key Information - International Road Dynamics Inc.
- TABLE 424 Key Information - Gatekeeper Security, Inc.
- TABLE 425 Key Information - UVeye Ltd.
- TABLE 426 Key Information - Advanced Detection Technology, LLC
- TABLE 427 Key Information - Omnitec Group
- TABLE 428 Key Information - Tescon Sicherheitssysteme AG
- TABLE 429 Key Information - VMI Security
- TABLE 430 Key Information - SCANLAB GmbH
List of Figures
- FIG 1 Methodology for the research
- FIG 2 Global Vehicle Scanner Market share by Scanner Type, 2021
- FIG 3 Global Vehicle Scanner Market share by Scanner Type, 2028
- FIG 4 Global Vehicle Scanner Market by Scanner Type, 2018 - 2028, USD Million
- FIG 5 Global Vehicle Scanner Market share by Structure Type, 2021
- FIG 6 Global Vehicle Scanner Market share by Structure Type, 2028
- FIG 7 Global Vehicle Scanner Market by Structure Type, 2018 - 2028, USD Million
- FIG 8 Global Vehicle Scanner Market share by Application, 2021
- FIG 9 Global Vehicle Scanner Market share by Application, 2028
- FIG 10 Global Vehicle Scanner Market by Application, 2018 - 2028, USD Million
- FIG 11 Global Vehicle Scanner Market share by Component, 2021
- FIG 12 Global Vehicle Scanner Market share by Component, 2028
- FIG 13 Global Vehicle Scanner Market by Component, 2018 - 2028, USD Million
- FIG 14 Global Vehicle Scanner Market share by Region, 2021
- FIG 15 Global Vehicle Scanner Market share by Region, 2028
- FIG 16 Global Vehicle Scanner Market by Region, 2018 - 2028, USD Million
The Global Vehicle Scanner Market size is expected to reach $4.1 billion by 2028, rising at a market growth of 6.2% CAGR during the forecast period.
A computer system fitted inside a vehicle that monitors and controls the operation of the vehicle is known as a vehicle scanner. As the network of sensors in the car can sense and transmit data from the vehicle, it is known as a smart vehicle. A key factor driving this market's revenue expansion is the growing demand for sophisticated security systems that can conduct continuous inspections without irritating passengers. In addition, the demand for vehicles with improved safety systems and user-friendly functionality has grown in recent years.
As a result, manufacturers of vehicle scanners are also investing in developing new technology to enhance vehicle security and meet consumer needs. The availability of advanced security options that can offer continuous inspection without disturbing passengers, as well as expanding services for car diagnostic tools to stop activities like human trafficking and border breaking & entering, are all significant aspects accelerating demand.
In addition, there will be increasing demand for entire car body scanning throughout the forecasted period, creating new opportunities. The solutions provided by vehicle scanners include scanning, processing, sensing, and imaging of a vehicle. The technology significantly impacts a vehicle's overall safety, which explains why the demand for such scanners is gradually increasing. In addition, due to the rising number of hacking incidents as well as terrorist activities, among several other things, there is a significant demand for cars with extra security features.
Since toll booths nowadays are interconnected to integrated networks with the help of technologies like the Internet of Things (IoT) and employ car scanning to gather and store accurate data with minimal human inaccuracy, vehicle scanners are also highly helpful in toll booths. The cost of operation and scanning time are reduced when loT is used with vehicle scanning.
COVID-19 Impact Analysis
Vehicle scanner sales are directly correlated with demand from end-use industries, including the automotive, appliance, and other industries. The COVID-19 pandemic's import-export restrictions, restricted borders, as well as supply chain delays, however, had a significant impact on the demand in the automotive sector. The establishment of new vehicle scanner initiatives has been hampered by the economic slump as the overwhelming amount of government money was directed toward the healthcare industry, which had a significant negative influence on the market.
Market Growth Factors
Increasing demand for and production of automobiles worldwide
The purchase of vehicles with precise, improved, and speedy diagnosis equipment is increasingly popular in industrialized nations all over the world. Particularly, the demand for premium cars has been growing significantly worldwide due to a combination of factors, including a shift in customer preferences from sedans to SUVs and rising disposable incomes of consumers. In addition, the increasing demand for vehicles is attributable to the rising purchasing power of developing economies. As a result, Germany, France, Italy, and Spain are leading the use of more recent and cutting-edge scan techniques.
Growing worries about the safety and security of the environment
Vehicle scanners are in significant demand to prevent illegal operations such as border trespassing, trafficking, smuggling, and others. A crucial element that is boosting the rise of revenue is the increasing demand for enhanced security solutions. These solutions must give continuous inspection without inflicting any inconvenience on the passengers. Since a few years ago, the rise in the number of automobiles has necessitated an increased number of safety measures and functionalities that are easier to operate. Also, car manufacturers are increasing their investments in the research and development of cutting-edge technology to improve their products' safety and fulfill their consumers' requirements.
Market Restraining Factors
Advanced scanning tools have a high starting cost
Automotive diagnostics incorporates extremely advanced technologies, which raises the overall cost. This is needed as autos need to comply with strict safety regulations. Therefore, every time new modifications to the regulations are introduced, the equipment also needs to be updated. Sophisticated vehicle scanners are pricey, and they frequently need an operating system, software, and other technological innovation upgrades, which could increase the overall cost of the equipment. Therefore, throughout the forecast period, development in the market will be constrained by the high installation as well as maintenance costs of the vehicle scanner.
Scanner Type Outlook
Based on scanner type, the vehicle scanner market is bifurcated into portable and fixed. The fixed segment garnered the highest revenue share in the vehicle scanner market in 2021. The fixed vehicle scanners have a range of scanning speeds from 30 to 60 kmph (kilometers per hour) and are used to install continuously working vehicle scanner checkpoints. Also, fixed automobile diagnostic scanner systems are set up underneath. These systems' ability to recognize, scan, and compare photos makes security guard work easier, safer, and more efficient.
Structure Type Outlook
On the basis of structure type, the vehicle scanner market is divided into drive-through and under vehicle scanning systems (UVSS). The drive-through segment acquired recorded a significant revenue share in the vehicle scanner market in 2021. This segment is growing due to the rising trend of goods transported by road, air, and sea, creating a high demand due to growing security concerns. Frequently, full body scanners are also referred to as drive-through vehicle scanners. Drive-through scanners are installed in government buildings, military installations, and other highly restricted areas.
Application Outlook
Based on application, the vehicle scanner market is segmented into government and private. The private segment garnered a remarkable growth rate in the vehicle scanner market in 2021. In the private or commercial sector, security scanner for vehicle and cargo inspection is used to screen persons, cargo, vehicles, as well as their contents. Additionally, professional mechanics employ scanning devices with a module and screen. Once the device is plugged in, they may evaluate the mechanical state of the car's parts, accessories, and critical engine components. As a result, repairs will be made to the car right away before the issue gets worse.
Component Outlook
On the basis of component, the vehicle scanner market is categorized into camera, lighting unit, barrier, software, and others. The camera segment procured the highest revenue share in the vehicle scanner market in 2021. Using an under-vehicle examination camera, the under-vehicle automobile code reader system eliminates the need for physical instruments to locate hazardous and illegal objects. Instead, the relevant staff can examine the photographs to spot such items and alert others, preventing auto accidents. The inspection camera's accuracy and efficacy depend on the 3D images it captures.
Regional Outlook
Region wise, the vehicle scanner market is analyzed across North America, Europe, Asia Pacific, and LAMEA. The North America segment recorded the largest revenue share in the vehicle scanner market in 2021. Since parking lots, naval ports, airports, and other professional and governmental environments have a strong demand for vehicle scanners, increasing usage of these tools in such places is propelling the segment's expansion. Due to the rise in terrorist attacks and concerns about community security in the region, there is a growing need for protection in both public and private institutions. Due to rising security & safety concerns, there is a high demand for vehicle scanners, expected to drive market expansion throughout the projection period.
The market research report covers the analysis of key stake holders of the market. Key companies profiled in the report include Godrej & Boyce Mfg. Co. Ltd. (Godrej Security Solutions), International Road Dynamics, Inc. (WiLAN) (Quarterhill Inc.), Leidos Holdings, Inc., Gatekeeper Security, Inc. (OSI Systems, Inc.), Omnitec Group, Tescon Sicherheitssysteme AG, UVeye Ltd., Advanced Detection Technology, LLC (HWH Investments Ltd), VMI Security (Prime Holding Group), and SCANLAB GmbH (TecInvest Holding AG).
Scope of the Study
Market Segments covered in the Report:
By Scanner Type
- Fixed
- Portable
By Structure Type
- Under Vehicle Scanning Systems (UVSS)
- Drive-through
By Application
- Government
- Private
By Component
- Camera
- Software
- Barrier
- Lighting Unit
- Others
By Geography
- North America
- US
- Canada
- Mexico
- Rest of North America
- Europe
- Germany
- UK
- France
- Russia
- Spain
- Italy
- Rest of Europe
- Asia Pacific
- China
- Japan
- India
- South Korea
- Singapore
- Malaysia
- Rest of Asia Pacific
- LAMEA
- Brazil
- Argentina
- UAE
- Saudi Arabia
- South Africa
- Nigeria
- Rest of LAMEA
Companies Profiled
- Godrej & Boyce Mfg. Co. Ltd. (Godrej Security Solutions)
- International Road Dynamics, Inc. (WiLAN) (Quarterhill Inc.)
- Leidos Holdings, Inc.
- Gatekeeper Security, Inc. (OSI Systems, Inc.)
- Omnitec Group
- Tescon Sicherheitssysteme AG
- UVeye Ltd.
- Advanced Detection Technology, LLC (HWH Investments Ltd)
- VMI Security (Prime Holding Group)
- SCANLAB GmbH (TecInvest Holding AG)
Unique Offerings from KBV Research
- Exhaustive coverage
- Highest number of market tables and figures
- Subscription based model available
- Guaranteed best price
- Assured post sales research support with 10% customization free
Table of Contents
Chapter 1. Market Scope & Methodology
- 1.1 Market Definition
- 1.2 Objectives
- 1.3 Market Scope
- 1.4 Segmentation
- 1.4.1 Global Vehicle Scanner Market, by Scanner Type
- 1.4.2 Global Vehicle Scanner Market, by Structure Type
- 1.4.3 Global Vehicle Scanner Market, by Application
- 1.4.4 Global Vehicle Scanner Market, by Component
- 1.4.5 Global Vehicle Scanner Market, by Geography
- 1.5 Methodology for the research
Chapter 2. Market Overview
- 2.1 Introduction
- 2.1.1 Overview
- 2.1.1.1 Market Composition & Scenario
- 2.1.1 Overview
- 2.2 Key Factors Impacting the Market
- 2.2.1 Market Drivers
- 2.2.2 Market Restraints
Chapter 3. Global Vehicle Scanner Market by Scanner Type
- 3.1 Global Fixed Market by Region
- 3.2 Global Portable Market by Region
Chapter 4. Global Vehicle Scanner Market by Structure Type
- 4.1 Global Under Vehicle Scanning Systems (UVSS) Market by Region
- 4.2 Global Drive-through Market by Region
Chapter 5. Global Vehicle Scanner Market by Application
- 5.1 Global Government Market by Region
- 5.2 Global Private Market by Region
Chapter 6. Global Vehicle Scanner Market by Component
- 6.1 Global Camera Market by Region
- 6.2 Global Software Market by Region
- 6.3 Global Barrier Market by Region
- 6.4 Global Lighting Unit Market by Region
- 6.5 Global Others Market by Region
Chapter 7. Global Vehicle Scanner Market by Region
- 7.1 North America Vehicle Scanner Market
- 7.1.1 North America Vehicle Scanner Market by Scanner Type
- 7.1.1.1 North America Fixed Market by Country
- 7.1.1.2 North America Portable Market by Country
- 7.1.2 North America Vehicle Scanner Market by Structure Type
- 7.1.2.1 North America Under Vehicle Scanning Systems (UVSS) Market by Country
- 7.1.2.2 North America Drive-through Market by Country
- 7.1.3 North America Vehicle Scanner Market by Application
- 7.1.3.1 North America Government Market by Country
- 7.1.3.2 North America Private Market by Country
- 7.1.4 North America Vehicle Scanner Market by Component
- 7.1.4.1 North America Camera Market by Country
- 7.1.4.2 North America Software Market by Country
- 7.1.4.3 North America Barrier Market by Country
- 7.1.4.4 North America Lighting Unit Market by Country
- 7.1.4.5 North America Others Market by Country
- 7.1.5 North America Vehicle Scanner Market by Country
- 7.1.5.1 US Vehicle Scanner Market
- 7.1.5.1.1 US Vehicle Scanner Market by Scanner Type
- 7.1.5.1.2 US Vehicle Scanner Market by Structure Type
- 7.1.5.1.3 US Vehicle Scanner Market by Application
- 7.1.5.1.4 US Vehicle Scanner Market by Component
- 7.1.5.2 Canada Vehicle Scanner Market
- 7.1.5.2.1 Canada Vehicle Scanner Market by Scanner Type
- 7.1.5.2.2 Canada Vehicle Scanner Market by Structure Type
- 7.1.5.2.3 Canada Vehicle Scanner Market by Application
- 7.1.5.2.4 Canada Vehicle Scanner Market by Component
- 7.1.5.3 Mexico Vehicle Scanner Market
- 7.1.5.3.1 Mexico Vehicle Scanner Market by Scanner Type
- 7.1.5.3.2 Mexico Vehicle Scanner Market by Structure Type
- 7.1.5.3.3 Mexico Vehicle Scanner Market by Application
- 7.1.5.3.4 Mexico Vehicle Scanner Market by Component
- 7.1.5.4 Rest of North America Vehicle Scanner Market
- 7.1.5.4.1 Rest of North America Vehicle Scanner Market by Scanner Type
- 7.1.5.4.2 Rest of North America Vehicle Scanner Market by Structure Type
- 7.1.5.4.3 Rest of North America Vehicle Scanner Market by Application
- 7.1.5.4.4 Rest of North America Vehicle Scanner Market by Component
- 7.1.5.1 US Vehicle Scanner Market
- 7.1.1 North America Vehicle Scanner Market by Scanner Type
- 7.2 Europe Vehicle Scanner Market
- 7.2.1 Europe Vehicle Scanner Market by Scanner Type
- 7.2.1.1 Europe Fixed Market by Country
- 7.2.1.2 Europe Portable Market by Country
- 7.2.2 Europe Vehicle Scanner Market by Structure Type
- 7.2.2.1 Europe Under Vehicle Scanning Systems (UVSS) Market by Country
- 7.2.2.2 Europe Drive-through Market by Country
- 7.2.3 Europe Vehicle Scanner Market by Application
- 7.2.3.1 Europe Government Market by Country
- 7.2.3.2 Europe Private Market by Country
- 7.2.4 Europe Vehicle Scanner Market by Component
- 7.2.4.1 Europe Camera Market by Country
- 7.2.4.2 Europe Software Market by Country
- 7.2.4.3 Europe Barrier Market by Country
- 7.2.4.4 Europe Lighting Unit Market by Country
- 7.2.4.5 Europe Others Market by Country
- 7.2.5 Europe Vehicle Scanner Market by Country
- 7.2.5.1 Germany Vehicle Scanner Market
- 7.2.5.1.1 Germany Vehicle Scanner Market by Scanner Type
- 7.2.5.1.2 Germany Vehicle Scanner Market by Structure Type
- 7.2.5.1.3 Germany Vehicle Scanner Market by Application
- 7.2.5.1.4 Germany Vehicle Scanner Market by Component
- 7.2.5.2 UK Vehicle Scanner Market
- 7.2.5.2.1 UK Vehicle Scanner Market by Scanner Type
- 7.2.5.2.2 UK Vehicle Scanner Market by Structure Type
- 7.2.5.2.3 UK Vehicle Scanner Market by Application
- 7.2.5.2.4 UK Vehicle Scanner Market by Component
- 7.2.5.3 France Vehicle Scanner Market
- 7.2.5.3.1 France Vehicle Scanner Market by Scanner Type
- 7.2.5.3.2 France Vehicle Scanner Market by Structure Type
- 7.2.5.3.3 France Vehicle Scanner Market by Application
- 7.2.5.3.4 France Vehicle Scanner Market by Component
- 7.2.5.4 Russia Vehicle Scanner Market
- 7.2.5.4.1 Russia Vehicle Scanner Market by Scanner Type
- 7.2.5.4.2 Russia Vehicle Scanner Market by Structure Type
- 7.2.5.4.3 Russia Vehicle Scanner Market by Application
- 7.2.5.4.4 Russia Vehicle Scanner Market by Component
- 7.2.5.5 Spain Vehicle Scanner Market
- 7.2.5.5.1 Spain Vehicle Scanner Market by Scanner Type
- 7.2.5.5.2 Spain Vehicle Scanner Market by Structure Type
- 7.2.5.5.3 Spain Vehicle Scanner Market by Application
- 7.2.5.5.4 Spain Vehicle Scanner Market by Component
- 7.2.5.6 Italy Vehicle Scanner Market
- 7.2.5.6.1 Italy Vehicle Scanner Market by Scanner Type
- 7.2.5.6.2 Italy Vehicle Scanner Market by Structure Type
- 7.2.5.6.3 Italy Vehicle Scanner Market by Application
- 7.2.5.6.4 Italy Vehicle Scanner Market by Component
- 7.2.5.7 Rest of Europe Vehicle Scanner Market
- 7.2.5.7.1 Rest of Europe Vehicle Scanner Market by Scanner Type
- 7.2.5.7.2 Rest of Europe Vehicle Scanner Market by Structure Type
- 7.2.5.7.3 Rest of Europe Vehicle Scanner Market by Application
- 7.2.5.7.4 Rest of Europe Vehicle Scanner Market by Component
- 7.2.5.1 Germany Vehicle Scanner Market
- 7.2.1 Europe Vehicle Scanner Market by Scanner Type
- 7.3 Asia Pacific Vehicle Scanner Market
- 7.3.1 Asia Pacific Vehicle Scanner Market by Scanner Type
- 7.3.1.1 Asia Pacific Fixed Market by Country
- 7.3.1.2 Asia Pacific Portable Market by Country
- 7.3.2 Asia Pacific Vehicle Scanner Market by Structure Type
- 7.3.2.1 Asia Pacific Under Vehicle Scanning Systems (UVSS) Market by Country
- 7.3.2.2 Asia Pacific Drive-through Market by Country
- 7.3.3 Asia Pacific Vehicle Scanner Market by Application
- 7.3.3.1 Asia Pacific Government Market by Country
- 7.3.3.2 Asia Pacific Private Market by Country
- 7.3.4 Asia Pacific Vehicle Scanner Market by Component
- 7.3.4.1 Asia Pacific Camera Market by Country
- 7.3.4.2 Asia Pacific Software Market by Country
- 7.3.4.3 Asia Pacific Barrier Market by Country
- 7.3.4.4 Asia Pacific Lighting Unit Market by Country
- 7.3.4.5 Asia Pacific Others Market by Country
- 7.3.5 Asia Pacific Vehicle Scanner Market by Country
- 7.3.5.1 China Vehicle Scanner Market
- 7.3.5.1.1 China Vehicle Scanner Market by Scanner Type
- 7.3.5.1.2 China Vehicle Scanner Market by Structure Type
- 7.3.5.1.3 China Vehicle Scanner Market by Application
- 7.3.5.1.4 China Vehicle Scanner Market by Component
- 7.3.5.2 Japan Vehicle Scanner Market
- 7.3.5.2.1 Japan Vehicle Scanner Market by Scanner Type
- 7.3.5.2.2 Japan Vehicle Scanner Market by Structure Type
- 7.3.5.2.3 Japan Vehicle Scanner Market by Application
- 7.3.5.2.4 Japan Vehicle Scanner Market by Component
- 7.3.5.3 India Vehicle Scanner Market
- 7.3.5.3.1 India Vehicle Scanner Market by Scanner Type
- 7.3.5.3.2 India Vehicle Scanner Market by Structure Type
- 7.3.5.3.3 India Vehicle Scanner Market by Application
- 7.3.5.3.4 India Vehicle Scanner Market by Component
- 7.3.5.4 South Korea Vehicle Scanner Market
- 7.3.5.4.1 South Korea Vehicle Scanner Market by Scanner Type
- 7.3.5.4.2 South Korea Vehicle Scanner Market by Structure Type
- 7.3.5.4.3 South Korea Vehicle Scanner Market by Application
- 7.3.5.4.4 South Korea Vehicle Scanner Market by Component
- 7.3.5.5 Singapore Vehicle Scanner Market
- 7.3.5.5.1 Singapore Vehicle Scanner Market by Scanner Type
- 7.3.5.5.2 Singapore Vehicle Scanner Market by Structure Type
- 7.3.5.5.3 Singapore Vehicle Scanner Market by Application
- 7.3.5.5.4 Singapore Vehicle Scanner Market by Component
- 7.3.5.6 Malaysia Vehicle Scanner Market
- 7.3.5.6.1 Malaysia Vehicle Scanner Market by Scanner Type
- 7.3.5.6.2 Malaysia Vehicle Scanner Market by Structure Type
- 7.3.5.6.3 Malaysia Vehicle Scanner Market by Application
- 7.3.5.6.4 Malaysia Vehicle Scanner Market by Component
- 7.3.5.7 Rest of Asia Pacific Vehicle Scanner Market
- 7.3.5.7.1 Rest of Asia Pacific Vehicle Scanner Market by Scanner Type
- 7.3.5.7.2 Rest of Asia Pacific Vehicle Scanner Market by Structure Type
- 7.3.5.7.3 Rest of Asia Pacific Vehicle Scanner Market by Application
- 7.3.5.7.4 Rest of Asia Pacific Vehicle Scanner Market by Component
- 7.3.5.1 China Vehicle Scanner Market
- 7.3.1 Asia Pacific Vehicle Scanner Market by Scanner Type
- 7.4 LAMEA Vehicle Scanner Market
- 7.4.1 LAMEA Vehicle Scanner Market by Scanner Type
- 7.4.1.1 LAMEA Fixed Market by Country
- 7.4.1.2 LAMEA Portable Market by Country
- 7.4.2 LAMEA Vehicle Scanner Market by Structure Type
- 7.4.2.1 LAMEA Under Vehicle Scanning Systems (UVSS) Market by Country
- 7.4.2.2 LAMEA Drive-through Market by Country
- 7.4.3 LAMEA Vehicle Scanner Market by Application
- 7.4.3.1 LAMEA Government Market by Country
- 7.4.3.2 LAMEA Private Market by Country
- 7.4.4 LAMEA Vehicle Scanner Market by Component
- 7.4.4.1 LAMEA Camera Market by Country
- 7.4.4.2 LAMEA Software Market by Country
- 7.4.4.3 LAMEA Barrier Market by Country
- 7.4.4.4 LAMEA Lighting Unit Market by Country
- 7.4.4.5 LAMEA Others Market by Country
- 7.4.5 LAMEA Vehicle Scanner Market by Country
- 7.4.5.1 Brazil Vehicle Scanner Market
- 7.4.5.1.1 Brazil Vehicle Scanner Market by Scanner Type
- 7.4.5.1.2 Brazil Vehicle Scanner Market by Structure Type
- 7.4.5.1.3 Brazil Vehicle Scanner Market by Application
- 7.4.5.1.4 Brazil Vehicle Scanner Market by Component
- 7.4.5.2 Argentina Vehicle Scanner Market
- 7.4.5.2.1 Argentina Vehicle Scanner Market by Scanner Type
- 7.4.5.2.2 Argentina Vehicle Scanner Market by Structure Type
- 7.4.5.2.3 Argentina Vehicle Scanner Market by Application
- 7.4.5.2.4 Argentina Vehicle Scanner Market by Component
- 7.4.5.3 UAE Vehicle Scanner Market
- 7.4.5.3.1 UAE Vehicle Scanner Market by Scanner Type
- 7.4.5.3.2 UAE Vehicle Scanner Market by Structure Type
- 7.4.5.3.3 UAE Vehicle Scanner Market by Application
- 7.4.5.3.4 UAE Vehicle Scanner Market by Component
- 7.4.5.4 Saudi Arabia Vehicle Scanner Market
- 7.4.5.4.1 Saudi Arabia Vehicle Scanner Market by Scanner Type
- 7.4.5.4.2 Saudi Arabia Vehicle Scanner Market by Structure Type
- 7.4.5.4.3 Saudi Arabia Vehicle Scanner Market by Application
- 7.4.5.4.4 Saudi Arabia Vehicle Scanner Market by Component
- 7.4.5.5 South Africa Vehicle Scanner Market
- 7.4.5.5.1 South Africa Vehicle Scanner Market by Scanner Type
- 7.4.5.5.2 South Africa Vehicle Scanner Market by Structure Type
- 7.4.5.5.3 South Africa Vehicle Scanner Market by Application
- 7.4.5.5.4 South Africa Vehicle Scanner Market by Component
- 7.4.5.6 Nigeria Vehicle Scanner Market
- 7.4.5.6.1 Nigeria Vehicle Scanner Market by Scanner Type
- 7.4.5.6.2 Nigeria Vehicle Scanner Market by Structure Type
- 7.4.5.6.3 Nigeria Vehicle Scanner Market by Application
- 7.4.5.6.4 Nigeria Vehicle Scanner Market by Component
- 7.4.5.7 Rest of LAMEA Vehicle Scanner Market
- 7.4.5.7.1 Rest of LAMEA Vehicle Scanner Market by Scanner Type
- 7.4.5.7.2 Rest of LAMEA Vehicle Scanner Market by Structure Type
- 7.4.5.7.3 Rest of LAMEA Vehicle Scanner Market by Application
- 7.4.5.7.4 Rest of LAMEA Vehicle Scanner Market by Component
- 7.4.5.1 Brazil Vehicle Scanner Market
- 7.4.1 LAMEA Vehicle Scanner Market by Scanner Type
Chapter 8. Company Profiles
- 8.1 Leidos Holdings, Inc.
- 8.1.1 Company Overview
- 8.1.2 Financial Analysis
- 8.1.3 Segmental and Regional Analysis
- 8.1.4 Research & Development Expense
- 8.1.5 Recent strategies and developments:
- 8.1.5.1 Acquisition and Mergers:
- 8.2 Godrej & Boyce Mfg. Co. Ltd. (Godrej Security Solutions)
- 8.2.1 Company Overview
- 8.2.2 Financial Analysis
- 8.2.3 Segmental and Regional Analysis
- 8.2.4 Research & Development Expense
- 8.3 International Road Dynamics, Inc. (WiLAN) (Quarterhill Inc.)
- 8.3.1 Company Overview
- 8.3.2 Financial Analysis
- 8.3.3 Segmental Analysis
- 8.3.4 Research & Development Expenses
- 8.4 Gatekeeper Security, Inc. (OSI Systems, Inc.)
- 8.4.1 Company Overview
- 8.4.2 Financial Analysis
- 8.4.3 Segmental and Regional Analysis
- 8.4.4 Research & Development Expenses
- 8.5 UVeye Ltd.
- 8.5.1 Company Overview
- 8.5.2 Recent strategies and developments:
- 8.5.2.1 Partnerships, Collaborations, and Agreements:
- 8.5.2.2 Product Launches and Product Expansions:
- 8.6 Advanced Detection Technology, LLC (HWH Investments Ltd)
- 8.6.1 Company Overview
- 8.6.2 Recent strategies and developments:
- 8.6.2.1 Product Launches and Product Expansions:
- 8.7 Omnitec Group
- 8.7.1 Company Overview
- 8.8 Tescon Sicherheitssysteme AG
- 8.8.1 Company Overview
- 8.9 VMI Security (Prime Holding Group)
- 8.9.1 Company Overview
- 8.10. SCANLAB GmbH (TecInvest Holding AG)
- 8.10.1 Company Overview