|
|
市場調査レポート
商品コード
1502653
ココナッツシュガーの世界市場、2024~2028年Global coconut sugar market 2024-2028 |
||||||
|
|||||||
カスタマイズ可能
|
|||||||


| ココナッツシュガーの世界市場、2024~2028年 |
|
出版日: 2024年05月20日
発行: TechNavio
ページ情報: 英文 157 Pages
納期: 即納可能
|

全表示
- 概要
- 図表
- 目次
ココナッツシュガー市場は2023~2028年に2億600万米ドル、予測期間中のCAGRは5.84%で成長すると予測されています。
この調査レポートは、ココナッツシュガー市場の全体分析、市場規模・予測、動向、成長促進要因、課題、約25のベンダーを網羅したベンダー分析などを掲載しています。
現在の市場シナリオ、最新動向と促進要因、市場環境全体に関する最新分析を提供しています。ココナッツシュガーの健康効果、有機ココナッツシュガーの需要、消費者の肥満や糖尿病の増加などが市場を牽引しています。
| 市場範囲 | |
|---|---|
| 基準年 | 2024年 |
| 終了年 | 2028年 |
| 予測期間 | 2024~2028年 |
| 成長モメンタム | 加速 |
| 前年比[2024年] | 5.43% |
| CAGR | 5.84% |
| 増分額 | 2億600万米ドル |
本調査では、飲食品業界におけるココナッツシュガー使用の増加が、今後数年間のココナッツシュガー市場成長を牽引する主要因の1つであるとしています。また、プライベートブランド(PB)ブランドの台頭や、植物性食生活の人気の高まりも、市場の大きな需要につながると考えられます。
目次
第1章 エグゼクティブ概要
- 市場概要
第2章 市場情勢
- 市場エコシステム
- 市場の特徴
- バリューチェーン分析
第3章 市場規模の評価
- 市場の定義
- 市場セグメント分析
- 市場規模 2023年
- 市場の展望 2023~2028年
第4章 市場規模実績
- 世界のココナッツシュガー市場 2018~2022年
- 製品別セグメント分析 2018~2022年
- エンドユーザー別セグメント分析 2018~2022年
- 地域別セグメント分析 2018~2022年
- 国別セグメント分析 2018~2022年
第5章 ファイブフォース分析
- ファイブフォースの要約
- 買い手の交渉力
- 供給企業の交渉力
- 新規参入業者の脅威
- 代替品の脅威
- 競争の脅威
- 市況
第6章 市場セグメンテーション:製品別
- 市場セグメンテーション
- 比較:製品別
- 有機ココナッツシュガー:市場規模と予測 2023~2028年
- 無機ココナッツシュガー:市場規模と予測 2023~2028年
- 市場機会:製品別
第7章 市場セグメンテーション:エンドユーザー別
- 市場セグメンテーション
- 比較:エンドユーザー別
- 商業用:市場規模と予測 2023~2028年
- 住宅用:市場規模と予測 2023~2028年
- 市場機会:エンドユーザー別
第8章 顧客情勢
- 顧客情勢概要
第9章 地域別情勢
- 地域別セグメンテーション
- 比較:地域別
- アジア太平洋:市場規模と予測 2023~2028年
- 欧州:市場規模と予測 2023~2028年
- 北米:市場規模と予測 2023~2028年
- 南米:市場規模と予測 2023~2028年
- 中東・アフリカ:市場規模と予測 2023~2028年
- 中国:市場規模と予測 2023~2028年
- フィリピン:市場規模と予測 2023~2028年
- 米国:市場規模と予測 2023~2028年
- インド:市場規模と予測 2023~2028年
- ドイツ:市場規模と予測 2023~2028年
- 市場機会:地域情勢別
第10章 促進要因・課題・機会・抑制要因
- 市場促進要因
- 市場課題
- 促進要因と課題の影響
- 市場の機会・抑制要因
第11章 競合情勢
- 概要
- 競合情勢
- 混乱の状況
- 業界のリスク
第12章 競合分析
- 企業プロファイル
- 企業の市場ポジショニング
- BetterBody Foods
- Big Tree Farms Inc.
- Celebes Coconut Corp.
- NOW Health Group Inc.
- Nutiva Inc.
- PT Mega Inovasi Organik
- PT. COCO SUGAR INDONESIA
- Saudi Food Ingredients Factory
- Slurrp Farm
- The Coconut Co. UK Ltd.
- The Groovy Food Co.
- Tradin Organic Agriculture B.V.
- Tree Grab
- Treelife
- Yana Industries LLP
第13章 付録
Exhibits:
- Exhibits1: Executive Summary - Chart on Market Overview
- Exhibits2: Executive Summary - Data Table on Market Overview
- Exhibits3: Executive Summary - Chart on Global Market Characteristics
- Exhibits4: Executive Summary - Chart on Market By Geographical Landscape
- Exhibits5: Executive Summary - Chart on Market Segmentation by Product
- Exhibits6: Executive Summary - Chart on Market Segmentation by End-user
- Exhibits7: Executive Summary - Chart on Incremental Growth
- Exhibits8: Executive Summary - Data Table on Incremental Growth
- Exhibits9: Executive Summary - Chart on Company Market Positioning
- Exhibits10: Parent Market
- Exhibits11: Data Table on - Parent Market
- Exhibits12: Market characteristics analysis
- Exhibits13: Value Chain Analysis
- Exhibits14: Offerings of companies included in the market definition
- Exhibits15: Market segments
- Exhibits16: Chart on Global - Market size and forecast 2023-2028 ($ million)
- Exhibits17: Data Table on Global - Market size and forecast 2023-2028 ($ million)
- Exhibits18: Chart on Global Market: Year-over-year growth 2023-2028 (%)
- Exhibits19: Data Table on Global Market: Year-over-year growth 2023-2028 (%)
- Exhibits20: Historic Market Size - Data Table on Global Coconut Sugar Market 2018 - 2022 ($ million)
- Exhibits21: Historic Market Size - Product Segment 2018 - 2022 ($ million)
- Exhibits22: Historic Market Size - End-user Segment 2018 - 2022 ($ million)
- Exhibits23: Historic Market Size - Geography Segment 2018 - 2022 ($ million)
- Exhibits24: Historic Market Size - Country Segment 2018 - 2022 ($ million)
- Exhibits25: Five forces analysis - Comparison between 2023 and 2028
- Exhibits26: Bargaining power of buyers - Impact of key factors 2023 and 2028
- Exhibits27: Bargaining power of suppliers - Impact of key factors in 2023 and 2028
- Exhibits28: Threat of new entrants - Impact of key factors in 2023 and 2028
- Exhibits29: Threat of substitutes - Impact of key factors in 2023 and 2028
- Exhibits30: Threat of rivalry - Impact of key factors in 2023 and 2028
- Exhibits31: Chart on Market condition - Five forces 2023 and 2028
- Exhibits32: Chart on Product - Market share 2023-2028 (%)
- Exhibits33: Data Table on Product - Market share 2023-2028 (%)
- Exhibits34: Chart on Comparison by Product
- Exhibits35: Data Table on Comparison by Product
- Exhibits36: Chart on Organic coconut sugar - Market size and forecast 2023-2028 ($ million)
- Exhibits37: Data Table on Organic coconut sugar - Market size and forecast 2023-2028 ($ million)
- Exhibits38: Chart on Organic coconut sugar - Year-over-year growth 2023-2028 (%)
- Exhibits39: Data Table on Organic coconut sugar - Year-over-year growth 2023-2028 (%)
- Exhibits40: Chart on Inorganic coconut sugar - Market size and forecast 2023-2028 ($ million)
- Exhibits41: Data Table on Inorganic coconut sugar - Market size and forecast 2023-2028 ($ million)
- Exhibits42: Chart on Inorganic coconut sugar - Year-over-year growth 2023-2028 (%)
- Exhibits43: Data Table on Inorganic coconut sugar - Year-over-year growth 2023-2028 (%)
- Exhibits44: Market opportunity by Product ($ million)
- Exhibits45: Data Table on Market opportunity by Product ($ million)
- Exhibits46: Chart on End-user - Market share 2023-2028 (%)
- Exhibits47: Data Table on End-user - Market share 2023-2028 (%)
- Exhibits48: Chart on Comparison by End-user
- Exhibits49: Data Table on Comparison by End-user
- Exhibits50: Chart on Commercial - Market size and forecast 2023-2028 ($ million)
- Exhibits51: Data Table on Commercial - Market size and forecast 2023-2028 ($ million)
- Exhibits52: Chart on Commercial - Year-over-year growth 2023-2028 (%)
- Exhibits53: Data Table on Commercial - Year-over-year growth 2023-2028 (%)
- Exhibits54: Chart on Residential - Market size and forecast 2023-2028 ($ million)
- Exhibits55: Data Table on Residential - Market size and forecast 2023-2028 ($ million)
- Exhibits56: Chart on Residential - Year-over-year growth 2023-2028 (%)
- Exhibits57: Data Table on Residential - Year-over-year growth 2023-2028 (%)
- Exhibits58: Market opportunity by End-user ($ million)
- Exhibits59: Data Table on Market opportunity by End-user ($ million)
- Exhibits60: Analysis of price sensitivity, lifecycle, customer purchase basket, adoption rates, and purchase criteria
- Exhibits61: Chart on Market share By Geographical Landscape 2023-2028 (%)
- Exhibits62: Data Table on Market share By Geographical Landscape 2023-2028 (%)
- Exhibits63: Chart on Geographic comparison
- Exhibits64: Data Table on Geographic comparison
- Exhibits65: Chart on APAC - Market size and forecast 2023-2028 ($ million)
- Exhibits66: Data Table on APAC - Market size and forecast 2023-2028 ($ million)
- Exhibits67: Chart on APAC - Year-over-year growth 2023-2028 (%)
- Exhibits68: Data Table on APAC - Year-over-year growth 2023-2028 (%)
- Exhibits69: Chart on Europe - Market size and forecast 2023-2028 ($ million)
- Exhibits70: Data Table on Europe - Market size and forecast 2023-2028 ($ million)
- Exhibits71: Chart on Europe - Year-over-year growth 2023-2028 (%)
- Exhibits72: Data Table on Europe - Year-over-year growth 2023-2028 (%)
- Exhibits73: Chart on North America - Market size and forecast 2023-2028 ($ million)
- Exhibits74: Data Table on North America - Market size and forecast 2023-2028 ($ million)
- Exhibits75: Chart on North America - Year-over-year growth 2023-2028 (%)
- Exhibits76: Data Table on North America - Year-over-year growth 2023-2028 (%)
- Exhibits77: Chart on South America - Market size and forecast 2023-2028 ($ million)
- Exhibits78: Data Table on South America - Market size and forecast 2023-2028 ($ million)
- Exhibits79: Chart on South America - Year-over-year growth 2023-2028 (%)
- Exhibits80: Data Table on South America - Year-over-year growth 2023-2028 (%)
- Exhibits81: Chart on Middle East and Africa - Market size and forecast 2023-2028 ($ million)
- Exhibits82: Data Table on Middle East and Africa - Market size and forecast 2023-2028 ($ million)
- Exhibits83: Chart on Middle East and Africa - Year-over-year growth 2023-2028 (%)
- Exhibits84: Data Table on Middle East and Africa - Year-over-year growth 2023-2028 (%)
- Exhibits85: Chart on China - Market size and forecast 2023-2028 ($ million)
- Exhibits86: Data Table on China - Market size and forecast 2023-2028 ($ million)
- Exhibits87: Chart on China - Year-over-year growth 2023-2028 (%)
- Exhibits88: Data Table on China - Year-over-year growth 2023-2028 (%)
- Exhibits89: Chart on Philippines - Market size and forecast 2023-2028 ($ million)
- Exhibits90: Data Table on Philippines - Market size and forecast 2023-2028 ($ million)
- Exhibits91: Chart on Philippines - Year-over-year growth 2023-2028 (%)
- Exhibits92: Data Table on Philippines - Year-over-year growth 2023-2028 (%)
- Exhibits93: Chart on US - Market size and forecast 2023-2028 ($ million)
- Exhibits94: Data Table on US - Market size and forecast 2023-2028 ($ million)
- Exhibits95: Chart on US - Year-over-year growth 2023-2028 (%)
- Exhibits96: Data Table on US - Year-over-year growth 2023-2028 (%)
- Exhibits97: Chart on India - Market size and forecast 2023-2028 ($ million)
- Exhibits98: Data Table on India - Market size and forecast 2023-2028 ($ million)
- Exhibits99: Chart on India - Year-over-year growth 2023-2028 (%)
- Exhibits100: Data Table on India - Year-over-year growth 2023-2028 (%)
- Exhibits101: Chart on Germany - Market size and forecast 2023-2028 ($ million)
- Exhibits102: Data Table on Germany - Market size and forecast 2023-2028 ($ million)
- Exhibits103: Chart on Germany - Year-over-year growth 2023-2028 (%)
- Exhibits104: Data Table on Germany - Year-over-year growth 2023-2028 (%)
- Exhibits105: Market opportunity By Geographical Landscape ($ million)
- Exhibits106: Data Tables on Market opportunity By Geographical Landscape ($ million)
- Exhibits107: Impact of drivers and challenges in 2023 and 2028
- Exhibits108: Overview on criticality of inputs and factors of differentiation
- Exhibits109: Overview on factors of disruption
- Exhibits110: Impact of key risks on business
- Exhibits111: Companies covered
- Exhibits112: Matrix on companies position and classification
- Exhibits113: BetterBody Foods - Overview
- Exhibits114: BetterBody Foods - Product / Service
- Exhibits115: BetterBody Foods - Key offerings
- Exhibits116: Big Tree Farms Inc. - Overview
- Exhibits117: Big Tree Farms Inc. - Product / Service
- Exhibits118: Big Tree Farms Inc. - Key offerings
- Exhibits119: Celebes Coconut Corp. - Overview
- Exhibits120: Celebes Coconut Corp. - Product / Service
- Exhibits121: Celebes Coconut Corp. - Key offerings
- Exhibits122: NOW Health Group Inc. - Overview
- Exhibits123: NOW Health Group Inc. - Product / Service
- Exhibits124: NOW Health Group Inc. - Key offerings
- Exhibits125: Nutiva Inc. - Overview
- Exhibits126: Nutiva Inc. - Product / Service
- Exhibits127: Nutiva Inc. - Key offerings
- Exhibits128: PT Mega Inovasi Organik - Overview
- Exhibits129: PT Mega Inovasi Organik - Product / Service
- Exhibits130: PT Mega Inovasi Organik - Key offerings
- Exhibits131: PT. COCO SUGAR INDONESIA - Overview
- Exhibits132: PT. COCO SUGAR INDONESIA - Product / Service
- Exhibits133: PT. COCO SUGAR INDONESIA - Key offerings
- Exhibits134: Saudi Food Ingredients Factory - Overview
- Exhibits135: Saudi Food Ingredients Factory - Product / Service
- Exhibits136: Saudi Food Ingredients Factory - Key offerings
- Exhibits137: Slurrp Farm - Overview
- Exhibits138: Slurrp Farm - Product / Service
- Exhibits139: Slurrp Farm - Key offerings
- Exhibits140: The Coconut Co. UK Ltd. - Overview
- Exhibits141: The Coconut Co. UK Ltd. - Product / Service
- Exhibits142: The Coconut Co. UK Ltd. - Key offerings
- Exhibits143: The Groovy Food Co. - Overview
- Exhibits144: The Groovy Food Co. - Product / Service
- Exhibits145: The Groovy Food Co. - Key offerings
- Exhibits146: Tradin Organic Agriculture B.V. - Overview
- Exhibits147: Tradin Organic Agriculture B.V. - Product / Service
- Exhibits148: Tradin Organic Agriculture B.V. - Key offerings
- Exhibits149: Tree Grab - Overview
- Exhibits150: Tree Grab - Product / Service
- Exhibits151: Tree Grab - Key offerings
- Exhibits152: Treelife - Overview
- Exhibits153: Treelife - Product / Service
- Exhibits154: Treelife - Key offerings
- Exhibits155: Yana Industries LLP - Overview
- Exhibits156: Yana Industries LLP - Product / Service
- Exhibits157: Yana Industries LLP - Key offerings
- Exhibits158: Inclusions checklist
- Exhibits159: Exclusions checklist
- Exhibits160: Currency conversion rates for US$
- Exhibits161: Research methodology
- Exhibits162: Information sources
- Exhibits163: Data validation
- Exhibits164: Validation techniques employed for market sizing
- Exhibits165: Data synthesis
- Exhibits166: 360 degree market analysis
- Exhibits167: List of abbreviations
The coconut sugar market is forecasted to grow by $ 206 mn during 2023-2028, accelerating at a CAGR of 5.84% during the forecast period. The report on the coconut sugar market provides a holistic analysis, market size and forecast, trends, growth drivers, and challenges, as well as vendor analysis covering around 25 vendors.
The report offers an up-to-date analysis regarding the current market scenario, the latest trends and drivers, and the overall market environment. The market is driven by health benefits of coconut sugar, demand for organic coconut sugar, and increasing instances of obesity and diabetes among consumers.
Technavio's coconut sugar market is segmented as below:
| Market Scope | |
|---|---|
| Base Year | 2024 |
| End Year | 2028 |
| Series Year | 2024-2028 |
| Growth Momentum | Accelerate |
| YOY 2024 | 5.43% |
| CAGR | 5.84% |
| Incremental Value | $206mn |
By Product
- Organic coconut sugar
- Inorganic coconut sugar
By End-user
- Commercial
- Residential
By Geographical Landscape
- APAC
- Europe
- North America
- South America
- Middle East and Africa
This study identifies the increasing use of coconut sugar in food and beverage industry as one of the prime reasons driving the coconut sugar market growth during the next few years. Also, emergence of private label brands and growing popularity of plant-based diets will lead to sizable demand in the market.
The report on the coconut sugar market covers the following areas:
- Coconut sugar market sizing
- Coconut sugar market forecast
- Coconut sugar market industry analysis
The robust vendor analysis is designed to help clients improve their market position, and in line with this, this report provides a detailed analysis of several leading coconut sugar market vendors that include BetterBody Foods, Big Tree Farms Inc., Celebes Coconut Corp., Connecticut Coconut Co., Franklin Baker Co., Madhava Ltd., NOW Health Group Inc., Nutiva Inc., PT Mega Inovasi Organik, PT. COCO SUGAR INDONESIA, Saudi Food Ingredients Factory, SINGABERA, Slurrp Farm, The Coconut Co. UK Ltd., The Divine Foods, The Groovy Food Co., Tradin Organic Agriculture B.V., Tree Grab, Treelife, and Yana Industries LLP. Also, the coconut sugar market analysis report includes information on upcoming trends and challenges that will influence market growth. This is to help companies strategize and leverage all forthcoming growth opportunities.
The study was conducted using an objective combination of primary and secondary information including inputs from key participants in the industry. The report contains a comprehensive market and vendor landscape in addition to an analysis of the key vendors.
The publisher presents a detailed picture of the market by the way of study, synthesis, and summation of data from multiple sources by an analysis of key parameters such as profit, pricing, competition, and promotions. It presents various market facets by identifying the key industry influencers. The data presented is comprehensive, reliable, and a result of extensive research - both primary and secondary. The market research reports provide a complete competitive landscape and an in-depth vendor selection methodology and analysis using qualitative and quantitative research to forecast the accurate market growth.
Table of Contents
1 Executive Summary
- 1.1 Market overview
- Executive Summary - Chart on Market Overview
- Executive Summary - Data Table on Market Overview
- Executive Summary - Chart on Global Market Characteristics
- Executive Summary - Chart on Market By Geographical Landscape
- Executive Summary - Chart on Market Segmentation by Product
- Executive Summary - Chart on Market Segmentation by End-user
- Executive Summary - Chart on Incremental Growth
- Executive Summary - Data Table on Incremental Growth
- Executive Summary - Chart on Company Market Positioning
2 Market Landscape
- 2.1 Market ecosystem
- Parent Market
- Data Table on - Parent Market
- 2.2 Market characteristics
- Market characteristics analysis
- 2.3 Value chain analysis
- Value Chain Analysis
3 Market Sizing
- 3.1 Market definition
- Offerings of companies included in the market definition
- 3.2 Market segment analysis
- Market segments
- 3.3 Market size 2023
- 3.4 Market outlook: Forecast for 2023-2028
- Chart on Global - Market size and forecast 2023-2028 ($ million)
- Data Table on Global - Market size and forecast 2023-2028 ($ million)
- Chart on Global Market: Year-over-year growth 2023-2028 (%)
- Data Table on Global Market: Year-over-year growth 2023-2028 (%)
4 Historic Market Size
- 4.1 Global Coconut Sugar Market 2018 - 2022
- Historic Market Size - Data Table on Global Coconut Sugar Market 2018 - 2022 ($ million)
- 4.2 Product segment analysis 2018 - 2022
- Historic Market Size - Product Segment 2018 - 2022 ($ million)
- 4.3 End-user segment analysis 2018 - 2022
- Historic Market Size - End-user Segment 2018 - 2022 ($ million)
- 4.4 Geography segment analysis 2018 - 2022
- Historic Market Size - Geography Segment 2018 - 2022 ($ million)
- 4.5 Country segment analysis 2018 - 2022
- Historic Market Size - Country Segment 2018 - 2022 ($ million)
5 Five Forces Analysis
- 5.1 Five forces summary
- Five forces analysis - Comparison between 2023 and 2028
- 5.2 Bargaining power of buyers
- Bargaining power of buyers - Impact of key factors 2023 and 2028
- 5.3 Bargaining power of suppliers
- Bargaining power of suppliers - Impact of key factors in 2023 and 2028
- 5.4 Threat of new entrants
- Threat of new entrants - Impact of key factors in 2023 and 2028
- 5.5 Threat of substitutes
- Threat of substitutes - Impact of key factors in 2023 and 2028
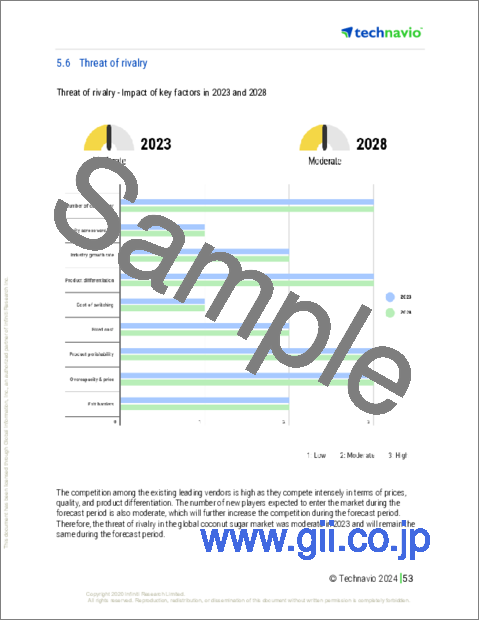
- 5.6 Threat of rivalry
- Threat of rivalry - Impact of key factors in 2023 and 2028
- 5.7 Market condition
- Chart on Market condition - Five forces 2023 and 2028
6 Market Segmentation by Product
- 6.1 Market segments
- Chart on Product - Market share 2023-2028 (%)
- Data Table on Product - Market share 2023-2028 (%)
- 6.2 Comparison by Product
- Chart on Comparison by Product
- Data Table on Comparison by Product
- 6.3 Organic coconut sugar - Market size and forecast 2023-2028
- Chart on Organic coconut sugar - Market size and forecast 2023-2028 ($ million)
- Data Table on Organic coconut sugar - Market size and forecast 2023-2028 ($ million)
- Chart on Organic coconut sugar - Year-over-year growth 2023-2028 (%)
- Data Table on Organic coconut sugar - Year-over-year growth 2023-2028 (%)
- 6.4 Inorganic coconut sugar - Market size and forecast 2023-2028
- Chart on Inorganic coconut sugar - Market size and forecast 2023-2028 ($ million)
- Data Table on Inorganic coconut sugar - Market size and forecast 2023-2028 ($ million)
- Chart on Inorganic coconut sugar - Year-over-year growth 2023-2028 (%)
- Data Table on Inorganic coconut sugar - Year-over-year growth 2023-2028 (%)
- 6.5 Market opportunity by Product
- Market opportunity by Product ($ million)
- Data Table on Market opportunity by Product ($ million)
7 Market Segmentation by End-user
- 7.1 Market segments
- Chart on End-user - Market share 2023-2028 (%)
- Data Table on End-user - Market share 2023-2028 (%)
- 7.2 Comparison by End-user
- Chart on Comparison by End-user
- Data Table on Comparison by End-user
- 7.3 Commercial - Market size and forecast 2023-2028
- Chart on Commercial - Market size and forecast 2023-2028 ($ million)
- Data Table on Commercial - Market size and forecast 2023-2028 ($ million)
- Chart on Commercial - Year-over-year growth 2023-2028 (%)
- Data Table on Commercial - Year-over-year growth 2023-2028 (%)
- 7.4 Residential - Market size and forecast 2023-2028
- Chart on Residential - Market size and forecast 2023-2028 ($ million)
- Data Table on Residential - Market size and forecast 2023-2028 ($ million)
- Chart on Residential - Year-over-year growth 2023-2028 (%)
- Data Table on Residential - Year-over-year growth 2023-2028 (%)
- 7.5 Market opportunity by End-user
- Market opportunity by End-user ($ million)
- Data Table on Market opportunity by End-user ($ million)
8 Customer Landscape
- 8.1 Customer landscape overview
- Analysis of price sensitivity, lifecycle, customer purchase basket, adoption rates, and purchase criteria
9 Geographic Landscape
- 9.1 Geographic segmentation
- Chart on Market share By Geographical Landscape 2023-2028 (%)
- Data Table on Market share By Geographical Landscape 2023-2028 (%)
- 9.2 Geographic comparison
- Chart on Geographic comparison
- Data Table on Geographic comparison
- 9.3 APAC - Market size and forecast 2023-2028
- Chart on APAC - Market size and forecast 2023-2028 ($ million)
- Data Table on APAC - Market size and forecast 2023-2028 ($ million)
- Chart on APAC - Year-over-year growth 2023-2028 (%)
- Data Table on APAC - Year-over-year growth 2023-2028 (%)
- 9.4 Europe - Market size and forecast 2023-2028
- Chart on Europe - Market size and forecast 2023-2028 ($ million)
- Data Table on Europe - Market size and forecast 2023-2028 ($ million)
- Chart on Europe - Year-over-year growth 2023-2028 (%)
- Data Table on Europe - Year-over-year growth 2023-2028 (%)
- 9.5 North America - Market size and forecast 2023-2028
- Chart on North America - Market size and forecast 2023-2028 ($ million)
- Data Table on North America - Market size and forecast 2023-2028 ($ million)
- Chart on North America - Year-over-year growth 2023-2028 (%)
- Data Table on North America - Year-over-year growth 2023-2028 (%)
- 9.6 South America - Market size and forecast 2023-2028
- Chart on South America - Market size and forecast 2023-2028 ($ million)
- Data Table on South America - Market size and forecast 2023-2028 ($ million)
- Chart on South America - Year-over-year growth 2023-2028 (%)
- Data Table on South America - Year-over-year growth 2023-2028 (%)
- 9.7 Middle East and Africa - Market size and forecast 2023-2028
- Chart on Middle East and Africa - Market size and forecast 2023-2028 ($ million)
- Data Table on Middle East and Africa - Market size and forecast 2023-2028 ($ million)
- Chart on Middle East and Africa - Year-over-year growth 2023-2028 (%)
- Data Table on Middle East and Africa - Year-over-year growth 2023-2028 (%)
- 9.8 China - Market size and forecast 2023-2028
- Chart on China - Market size and forecast 2023-2028 ($ million)
- Data Table on China - Market size and forecast 2023-2028 ($ million)
- Chart on China - Year-over-year growth 2023-2028 (%)
- Data Table on China - Year-over-year growth 2023-2028 (%)
- 9.9 Philippines - Market size and forecast 2023-2028
- Chart on Philippines - Market size and forecast 2023-2028 ($ million)
- Data Table on Philippines - Market size and forecast 2023-2028 ($ million)
- Chart on Philippines - Year-over-year growth 2023-2028 (%)
- Data Table on Philippines - Year-over-year growth 2023-2028 (%)
- 9.10 US - Market size and forecast 2023-2028
- Chart on US - Market size and forecast 2023-2028 ($ million)
- Data Table on US - Market size and forecast 2023-2028 ($ million)
- Chart on US - Year-over-year growth 2023-2028 (%)
- Data Table on US - Year-over-year growth 2023-2028 (%)
- 9.11 India - Market size and forecast 2023-2028
- Chart on India - Market size and forecast 2023-2028 ($ million)
- Data Table on India - Market size and forecast 2023-2028 ($ million)
- Chart on India - Year-over-year growth 2023-2028 (%)
- Data Table on India - Year-over-year growth 2023-2028 (%)
- 9.12 Germany - Market size and forecast 2023-2028
- Chart on Germany - Market size and forecast 2023-2028 ($ million)
- Data Table on Germany - Market size and forecast 2023-2028 ($ million)
- Chart on Germany - Year-over-year growth 2023-2028 (%)
- Data Table on Germany - Year-over-year growth 2023-2028 (%)
- 9.13 Market opportunity By Geographical Landscape
- Market opportunity By Geographical Landscape ($ million)
- Data Tables on Market opportunity By Geographical Landscape ($ million)
10 Drivers, Challenges, and Opportunity/Restraints
- 10.1 Market drivers
- 10.2 Market challenges
- 10.3 Impact of drivers and challenges
- Impact of drivers and challenges in 2023 and 2028
- 10.4 Market opportunities/restraints
11 Competitive Landscape
- 11.1 Overview
- 11.2 Competitive Landscape
- Overview on criticality of inputs and factors of differentiation
- 11.3 Landscape disruption
- Overview on factors of disruption
- 11.4 Industry risks
- Impact of key risks on business
12 Competitive Analysis
- 12.1 Companies profiled
- Companies covered
- 12.2 Market positioning of companies
- Matrix on companies position and classification
- 12.3 BetterBody Foods
- BetterBody Foods - Overview
- BetterBody Foods - Product / Service
- BetterBody Foods - Key offerings
- 12.4 Big Tree Farms Inc.
- Big Tree Farms Inc. - Overview
- Big Tree Farms Inc. - Product / Service
- Big Tree Farms Inc. - Key offerings
- 12.5 Celebes Coconut Corp.
- Celebes Coconut Corp. - Overview
- Celebes Coconut Corp. - Product / Service
- Celebes Coconut Corp. - Key offerings
- 12.6 NOW Health Group Inc.
- NOW Health Group Inc. - Overview
- NOW Health Group Inc. - Product / Service
- NOW Health Group Inc. - Key offerings
- 12.7 Nutiva Inc.
- Nutiva Inc. - Overview
- Nutiva Inc. - Product / Service
- Nutiva Inc. - Key offerings
- 12.8 PT Mega Inovasi Organik
- PT Mega Inovasi Organik - Overview
- PT Mega Inovasi Organik - Product / Service
- PT Mega Inovasi Organik - Key offerings
- 12.9 PT. COCO SUGAR INDONESIA
- PT. COCO SUGAR INDONESIA - Overview
- PT. COCO SUGAR INDONESIA - Product / Service
- PT. COCO SUGAR INDONESIA - Key offerings
- 12.10 Saudi Food Ingredients Factory
- Saudi Food Ingredients Factory - Overview
- Saudi Food Ingredients Factory - Product / Service
- Saudi Food Ingredients Factory - Key offerings
- 12.11 Slurrp Farm
- Slurrp Farm - Overview
- Slurrp Farm - Product / Service
- Slurrp Farm - Key offerings
- 12.12 The Coconut Co. UK Ltd.
- The Coconut Co. UK Ltd. - Overview
- The Coconut Co. UK Ltd. - Product / Service
- The Coconut Co. UK Ltd. - Key offerings
- 12.13 The Groovy Food Co.
- The Groovy Food Co. - Overview
- The Groovy Food Co. - Product / Service
- The Groovy Food Co. - Key offerings
- 12.14 Tradin Organic Agriculture B.V.
- Tradin Organic Agriculture B.V. - Overview
- Tradin Organic Agriculture B.V. - Product / Service
- Tradin Organic Agriculture B.V. - Key offerings
- 12.15 Tree Grab
- Tree Grab - Overview
- Tree Grab - Product / Service
- Tree Grab - Key offerings
- 12.16 Treelife
- Treelife - Overview
- Treelife - Product / Service
- Treelife - Key offerings
- 12.17 Yana Industries LLP
- Yana Industries LLP - Overview
- Yana Industries LLP - Product / Service
- Yana Industries LLP - Key offerings
13 Appendix
- 13.1 Scope of the report
- 13.2 Inclusions and exclusions checklist
- Inclusions checklist
- Exclusions checklist
- 13.3 Currency conversion rates for US$
- Currency conversion rates for US$
- 13.4 Research methodology
- Research methodology
- 13.5 Data procurement
- Information sources
- 13.6 Data validation
- Data validation
- 13.7 Validation techniques employed for market sizing
- Validation techniques employed for market sizing
- 13.8 Data synthesis
- Data synthesis
- 13.9 360 degree market analysis
- 360 degree market analysis
- 13.10 List of abbreviations
- List of abbreviations

