|
|
市場調査レポート
商品コード
1245676
3Dアイトラッキングソフトウェアの世界市場規模、シェア、産業動向分析レポート:タイプ別、用途別(科学研究、マーケティング・ユーザー調査、産業・ヒューマンパフォーマンス)、産業別、地域別展望と予測、2022~2028年Global 3D Eye Tracking Software Market Size, Share & Industry Trends Analysis Report By Type, By Application (Scientific Research, Marketing & User Research, and Industry & Human Performance), By Industry, By Regional Outlook and Forecast, 2022 - 2028 |
||||||
|
|
|||||||


| 3Dアイトラッキングソフトウェアの世界市場規模、シェア、産業動向分析レポート:タイプ別、用途別(科学研究、マーケティング・ユーザー調査、産業・ヒューマンパフォーマンス)、産業別、地域別展望と予測、2022~2028年 |
|
出版日: 2023年02月28日
発行: KBV Research
ページ情報: 英文 224 Pages
納期: 即納可能
|
- 全表示
- 概要
- 図表
- 目次
3Dアイトラッキングソフトウェアの世界市場規模は、2028年には6億6,550万米ドルに達し、予測期間中に25.7%のCAGRで市場成長すると予測されています。
近年、アイトラッカーは市場調査において不可欠なものとなっています。一般的に、これらのデバイスのデータは、企業のオフラインおよびオンラインのビジネス組織を改善することができます。3Dアイトラッキングソフトウェアの技術革新により、特定のブランドや商品、重要なメッセージへの集中度を評価できるようになりました。さらに、お店のナビゲーションのしやすさを判断するのにも活用されています。
このように、アイトラッキングは組織に重要な情報を提供するのです。3Dアイトラッキングソフトウェアの市場予測は、キャリブレーションなしで、閲覧数やフォーカススポットをカウントするシェルフ・アテンション分析が可能です。小売業やその他のマーケティング組織は、これらのデータを活用して、小売業のクライアントのために革新的な販売手法やショッパーアプローチを開発することができます。
COVID-19インパクト分析
3Dアイトラッキングソフトウェアの売上は、自動車、小売、調査などの最終用途産業からの需要に比例します。COVID-19の流行による輸出入規制、国境封鎖、サプライチェーンの中断により、小売業における3Dアイトラッキングソフトウェアの市場はマイナスの影響を受けた。COVID-19のパンデミックにより、アイトラッキング産業の拡大速度が停止しました。重要な家電、小売、自動車、製造業の操業停止は、製品需要に影響を与えました。しかし、COVID-19に基づく規制が緩和されれば、主要な最終使用産業での利用が急増し、市場の回復を助けることになるため、市場は成長を示すと予想されます。
市場の成長要因
小売業における3Dアイトラッキング
3Dアイトラッキングによって、視覚的注意のデータは最も容易に入手できます。小売業調査の文脈では、視覚的注意は顧客の固有の興味を示しています。アイトラッキングでは、買い手が1つの商品に集中するのにかかった時間、ちらっと見た回数、1つの商品を見つめるのに費やした平均時間などがわかります。一般的に、最も長く、最も頻繁に吟味した商品を購入することが多いようです。アイトラッキングでは、興味、知覚、意図の流れも調べることができます。消費者の行動を分析し、より良い商品とサービスを提供するために、小売業で3Dアイトラッキングが使用されており、市場の成長を後押しすると期待されています。
車載用アイトラッキング
自動車分野での3Dアイトラッキング技術は、道路の安全性を高めるために使用されます。視線認識は、人と車の相互作用に関する2つの大きな問題を解決することになります。半自律走行車における協調的な引き継ぎを監視し可能にすることと同様に、自動車安全当局の安全に対する懸念の高まりから、促進要因の注意を検出することが必要になります。今後は、深度センサー付きカメラを使って、促進要因の集中力を継続的にチェックすることが可能になります。トラッキングプログラムでは、カメラからのデータを使って促進要因の集中力を評価します。その結果、3Dアイトラッキングソフトウェアなどの最新技術を使用して、自動車の性能と安全性を最適化することが、市場拡大の推進力となるでしょう。
市場抑制要因
3Dアイトラッキングにまつわる問題点
アイトラッキング技術が目の動きを記録するだけであるという事実は、3つ目の課題です。記録された内容を効果的に解釈するためには、アイトラッキング技術と追加のデータ収集方法を組み合わせる必要があります。例えば、消費者の購買意欲を評価するリッカート尺度を使えば、消費者が商品を購入するかどうかを選択する際に、どのような情報を視覚的に確認し、検討するかを知ることができます。しかし、視覚的な注意は顧客行動に影響を与える唯一の要素ではないため、これらのデータを解釈するのは困難な場合があります。したがって、3Dアイトラッキングデバイスに関連する欠点は、市場成長の妨げになると予想されます。
タイプ別展望
タイプ別に、3Dアイトラッキングソフトウェア市場は、モバイルシステム、リモートアイトラッキング、タワーマウント型アイトラッキングに区分されます。モバイルシステム部門は、2021年に3Dアイトラッキングソフトウェア市場を独占し、最大の収益シェアを獲得しました。これは、ウェアラブルデバイス、多くの場合アイトラッキンググラスやヘッドバンドへの関与によるものです。シーンやユーザーの視野を記録するカメラやミラーが、片目または両目の前に設置されます。最近のモバイルデバイスはテザリングができないため、スポーツ、自動車やシミュレーターの使用、運動制御や歩行の評価、陸上競技など、日常生活にはるかに関連した文脈での調査が可能です。
用途の展望
用途別では、3Dアイトラッキングソフトウェア市場は、科学調査、マーケティング・ユーザー調査、産業・ヒューマンパフォーマンスに分けられます。2021年の3Dアイトラッキングソフトウェア市場では、産業&ヒューマンパフォーマンスセグメントが有望な成長率を調達しました。これは、アイトラッキングによって、ユーザーは組織のオペレーションをさらに細かく見ることができ、手順を強化し、エラーを減らし、無駄をなくすための方法を発見することができるためです。アイトラッキングを利用することで、組織内の業務をより細かく把握することができ、手順の改善やミスの減少、無駄の排除などの効果が期待されます。
業界の展望
産業別では、3Dアイトラッキングソフトウェア市場は、コンシューマー機器、支援技術ソリューション、自動車、小売、ロボティクス、その他に分類されます。2021年の3Dアイトラッキングソフトウェア市場では、ロボティクス分野が有望な成長率を記録しました。これは、手術用ロボットが、医療技術の進歩によってデジタル変革が促進され、治療が強化されたことを示す典型例であるためです。非常に小さな切開を非常に正確な操作で実行することにより、遠隔操作の手術ロボットは、迅速な回復を促す様々な低侵襲手術を可能にし、患者、病院、診療所、そして行列を待つ人々にとって有益です。
地域の展望
地域別に、3Dアイトラッキングソフトウェア市場は、北米、欧州、アジア太平洋、LAMEAで分析されています。北米地域は、2021年に3Dアイトラッキングソフトウェア市場で最も高い収益シェアを記録しました。この成長は、技術的に高度な追跡方法に対する政府投資の増加に起因しています。仮想運転支援を提供するため、増加する電気自動車への3Dアイトラッキングソフトウェアの組み込みが増加しています。また、自動車産業、ヘルスケア産業という多数の産業において、ロボティクスで構成された3D視線追跡装置の販売が増加していることが、予測期間における3Dアイトラッキングソフトウェア市場の成長を後押ししています。
目次
第1章 市場の範囲と調査手法
- 市場の定義
- 目的
- 市場の範囲
- セグメンテーション
- 3Dアイトラッキングソフトウェアの世界市場、タイプ別
- 3Dアイトラッキングソフトウェアの世界市場、用途別
- 3Dアイトラッキングソフトウェアの世界市場、産業別
- 3Dアイトラッキングソフトウェアの世界市場、地域別
- 調査手法
第2章 市場の概要
- イントロダクション
- 概要
- 市場の構成とシナリオ
- 概要
- 市場に影響を与える主要因
- 市場促進要因
- 市場抑制要因
第3章 3Dアイトラッキングソフトウェアの世界市場:タイプ別
- モバイルシステムの世界市場:地域別
- リモートアイトラッキングの世界市場:地域別
- タワーマウント型アイトラッキングの世界市場:地域別
第4章 3Dアイトラッキングソフトウェアの世界市場:用途別
- 科学調査の世界市場:地域別
- マーケティング・ユーザー調査の世界市場:地域別
- 産業・ヒューマンパフォーマンスの世界市場:地域別
第5章 3Dアイトラッキングソフトウェアの世界市場:産業別
- コンシューマーデバイスの世界市場:地域別
- ロボティクスの世界市場:地域別
- 自動車の世界市場:地域別
- 小売業の世界市場:地域別
- 支援技術ソリューションの世界市場:地域別
- 地域別その他市場の世界市場
第6章 3Dアイトラッキングソフトウェアの世界市場:地域別
- 北米
- 北米の3Dアイトラッキングソフトウェアの国別市場推移
- 米国
- カナダ
- メキシコ
- その他北米地域
- 北米の3Dアイトラッキングソフトウェアの国別市場推移
- 欧州
- 欧州の3Dアイトラッキングソフトウェア市場:国別
- ドイツ
- 英国
- フランス
- ロシア
- スペイン
- イタリア
- その他欧州
- 欧州の3Dアイトラッキングソフトウェア市場:国別
- アジア太平洋地域
- アジア太平洋地域の3Dアイトラッキングソフトウェア市場:国別
- 中国
- 日本
- インド
- 韓国
- シンガポール
- マレーシア
- その他アジア太平洋地域
- アジア太平洋地域の3Dアイトラッキングソフトウェア市場:国別
- LAMEA
- LAMEAの3Dアイトラッキングソフトウェアの市場:国別
- ブラジル
- アルゼンチン
- UAE
- サウジアラビア
- 南アフリカ
- ナイジェリア
- LAMEAの残りの地域
- LAMEAの3Dアイトラッキングソフトウェアの市場:国別
第7章 企業プロファイル
- Tobii AB
- iMotions A/S(Smart Eye A/S)
- EyeTech Digital Systems, Inc.
- Gaze Intelligence
- ParallelDots, Inc.
- Eyegaze, Inc.
- Pupil Labs GmbH
- Gazepoint
- alea technologies gmbh(IntelliGaze)
- Converus, Inc.
LIST OF TABLES
- TABLE 1 Global 3D Eye Tracking Software Market, 2018 - 2021, USD Thousands
- TABLE 2 Global 3D Eye Tracking Software Market, 2022 - 2028, USD Thousands
- TABLE 3 Global 3D Eye Tracking Software Market by Type, 2018 - 2021, USD Thousands
- TABLE 4 Global 3D Eye Tracking Software Market by Type, 2022 - 2028, USD Thousands
- TABLE 5 Global Mobile Systems Market by Region, 2018 - 2021, USD Thousands
- TABLE 6 Global Mobile Systems Market by Region, 2022 - 2028, USD Thousands
- TABLE 7 Global Remote Eye Tracking Market by Region, 2018 - 2021, USD Thousands
- TABLE 8 Global Remote Eye Tracking Market by Region, 2022 - 2028, USD Thousands
- TABLE 9 Global Tower-Mounted Eye Tracking Market by Region, 2018 - 2021, USD Thousands
- TABLE 10 Global Tower-Mounted Eye Tracking Market by Region, 2022 - 2028, USD Thousands
- TABLE 11 Global 3D Eye Tracking Software Market by Application, 2018 - 2021, USD Thousands
- TABLE 12 Global 3D Eye Tracking Software Market by Application, 2022 - 2028, USD Thousands
- TABLE 13 Global Scientific Research Market by Region, 2018 - 2021, USD Thousands
- TABLE 14 Global Scientific Research Market by Region, 2022 - 2028, USD Thousands
- TABLE 15 Global Marketing & User Research Market by Region, 2018 - 2021, USD Thousands
- TABLE 16 Global Marketing & User Research Market by Region, 2022 - 2028, USD Thousands
- TABLE 17 Global Industry & Human Performance Market by Region, 2018 - 2021, USD Thousands
- TABLE 18 Global Industry & Human Performance Market by Region, 2022 - 2028, USD Thousands
- TABLE 19 Global 3D Eye Tracking Software Market by Industry, 2018 - 2021, USD Thousands
- TABLE 20 Global 3D Eye Tracking Software Market by Industry, 2022 - 2028, USD Thousands
- TABLE 21 Global Consumer Devices Market by Region, 2018 - 2021, USD Thousands
- TABLE 22 Global Consumer Devices Market by Region, 2022 - 2028, USD Thousands
- TABLE 23 Global Robotics Market by Region, 2018 - 2021, USD Thousands
- TABLE 24 Global Robotics Market by Region, 2022 - 2028, USD Thousands
- TABLE 25 Global Automotive Market by Region, 2018 - 2021, USD Thousands
- TABLE 26 Global Automotive Market by Region, 2022 - 2028, USD Thousands
- TABLE 27 Global Retail Market by Region, 2018 - 2021, USD Thousands
- TABLE 28 Global Retail Market by Region, 2022 - 2028, USD Thousands
- TABLE 29 Global Assistive Technology Solutions Market by Region, 2018 - 2021, USD Thousands
- TABLE 30 Global Assistive Technology Solutions Market by Region, 2022 - 2028, USD Thousands
- TABLE 31 Global Others Market by Region, 2018 - 2021, USD Thousands
- TABLE 32 Global Others Market by Region, 2022 - 2028, USD Thousands
- TABLE 33 Global 3D Eye Tracking Software Market by Region, 2018 - 2021, USD Thousands
- TABLE 34 Global 3D Eye Tracking Software Market by Region, 2022 - 2028, USD Thousands
- TABLE 35 North America 3D Eye Tracking Software Market, 2018 - 2021, USD Thousands
- TABLE 36 North America 3D Eye Tracking Software Market, 2022 - 2028, USD Thousands
- TABLE 37 North America 3D Eye Tracking Software Market by Type, 2018 - 2021, USD Thousands
- TABLE 38 North America 3D Eye Tracking Software Market by Type, 2022 - 2028, USD Thousands
- TABLE 39 North America Mobile Systems Market by Country, 2018 - 2021, USD Thousands
- TABLE 40 North America Mobile Systems Market by Country, 2022 - 2028, USD Thousands
- TABLE 41 North America Remote Eye Tracking Market by Country, 2018 - 2021, USD Thousands
- TABLE 42 North America Remote Eye Tracking Market by Country, 2022 - 2028, USD Thousands
- TABLE 43 North America Tower-Mounted Eye Tracking Market by Country, 2018 - 2021, USD Thousands
- TABLE 44 North America Tower-Mounted Eye Tracking Market by Country, 2022 - 2028, USD Thousands
- TABLE 45 North America 3D Eye Tracking Software Market by Application, 2018 - 2021, USD Thousands
- TABLE 46 North America 3D Eye Tracking Software Market by Application, 2022 - 2028, USD Thousands
- TABLE 47 North America Scientific Research Market by Country, 2018 - 2021, USD Thousands
- TABLE 48 North America Scientific Research Market by Country, 2022 - 2028, USD Thousands
- TABLE 49 North America Marketing & User Research Market by Country, 2018 - 2021, USD Thousands
- TABLE 50 North America Marketing & User Research Market by Country, 2022 - 2028, USD Thousands
- TABLE 51 North America Industry & Human Performance Market by Country, 2018 - 2021, USD Thousands
- TABLE 52 North America Industry & Human Performance Market by Country, 2022 - 2028, USD Thousands
- TABLE 53 North America 3D Eye Tracking Software Market by Industry, 2018 - 2021, USD Thousands
- TABLE 54 North America 3D Eye Tracking Software Market by Industry, 2022 - 2028, USD Thousands
- TABLE 55 North America Consumer Devices Market by Country, 2018 - 2021, USD Thousands
- TABLE 56 North America Consumer Devices Market by Country, 2022 - 2028, USD Thousands
- TABLE 57 North America Robotics Market by Country, 2018 - 2021, USD Thousands
- TABLE 58 North America Robotics Market by Country, 2022 - 2028, USD Thousands
- TABLE 59 North America Automotive Market by Country, 2018 - 2021, USD Thousands
- TABLE 60 North America Automotive Market by Country, 2022 - 2028, USD Thousands
- TABLE 61 North America Retail Market by Country, 2018 - 2021, USD Thousands
- TABLE 62 North America Retail Market by Country, 2022 - 2028, USD Thousands
- TABLE 63 North America Assistive Technology Solutions Market by Country, 2018 - 2021, USD Thousands
- TABLE 64 North America Assistive Technology Solutions Market by Country, 2022 - 2028, USD Thousands
- TABLE 65 North America Others Market by Country, 2018 - 2021, USD Thousands
- TABLE 66 North America Others Market by Country, 2022 - 2028, USD Thousands
- TABLE 67 North America 3D Eye Tracking Software Market by Country, 2018 - 2021, USD Thousands
- TABLE 68 North America 3D Eye Tracking Software Market by Country, 2022 - 2028, USD Thousands
- TABLE 69 US 3D Eye Tracking Software Market, 2018 - 2021, USD Thousands
- TABLE 70 US 3D Eye Tracking Software Market, 2022 - 2028, USD Thousands
- TABLE 71 US 3D Eye Tracking Software Market by Type, 2018 - 2021, USD Thousands
- TABLE 72 US 3D Eye Tracking Software Market by Type, 2022 - 2028, USD Thousands
- TABLE 73 US 3D Eye Tracking Software Market by Application, 2018 - 2021, USD Thousands
- TABLE 74 US 3D Eye Tracking Software Market by Application, 2022 - 2028, USD Thousands
- TABLE 75 US 3D Eye Tracking Software Market by Industry, 2018 - 2021, USD Thousands
- TABLE 76 US 3D Eye Tracking Software Market by Industry, 2022 - 2028, USD Thousands
- TABLE 77 Canada 3D Eye Tracking Software Market, 2018 - 2021, USD Thousands
- TABLE 78 Canada 3D Eye Tracking Software Market, 2022 - 2028, USD Thousands
- TABLE 79 Canada 3D Eye Tracking Software Market by Type, 2018 - 2021, USD Thousands
- TABLE 80 Canada 3D Eye Tracking Software Market by Type, 2022 - 2028, USD Thousands
- TABLE 81 Canada 3D Eye Tracking Software Market by Application, 2018 - 2021, USD Thousands
- TABLE 82 Canada 3D Eye Tracking Software Market by Application, 2022 - 2028, USD Thousands
- TABLE 83 Canada 3D Eye Tracking Software Market by Industry, 2018 - 2021, USD Thousands
- TABLE 84 Canada 3D Eye Tracking Software Market by Industry, 2022 - 2028, USD Thousands
- TABLE 85 Mexico 3D Eye Tracking Software Market, 2018 - 2021, USD Thousands
- TABLE 86 Mexico 3D Eye Tracking Software Market, 2022 - 2028, USD Thousands
- TABLE 87 Mexico 3D Eye Tracking Software Market by Type, 2018 - 2021, USD Thousands
- TABLE 88 Mexico 3D Eye Tracking Software Market by Type, 2022 - 2028, USD Thousands
- TABLE 89 Mexico 3D Eye Tracking Software Market by Application, 2018 - 2021, USD Thousands
- TABLE 90 Mexico 3D Eye Tracking Software Market by Application, 2022 - 2028, USD Thousands
- TABLE 91 Mexico 3D Eye Tracking Software Market by Industry, 2018 - 2021, USD Thousands
- TABLE 92 Mexico 3D Eye Tracking Software Market by Industry, 2022 - 2028, USD Thousands
- TABLE 93 Rest of North America 3D Eye Tracking Software Market, 2018 - 2021, USD Thousands
- TABLE 94 Rest of North America 3D Eye Tracking Software Market, 2022 - 2028, USD Thousands
- TABLE 95 Rest of North America 3D Eye Tracking Software Market by Type, 2018 - 2021, USD Thousands
- TABLE 96 Rest of North America 3D Eye Tracking Software Market by Type, 2022 - 2028, USD Thousands
- TABLE 97 Rest of North America 3D Eye Tracking Software Market by Application, 2018 - 2021, USD Thousands
- TABLE 98 Rest of North America 3D Eye Tracking Software Market by Application, 2022 - 2028, USD Thousands
- TABLE 99 Rest of North America 3D Eye Tracking Software Market by Industry, 2018 - 2021, USD Thousands
- TABLE 100 Rest of North America 3D Eye Tracking Software Market by Industry, 2022 - 2028, USD Thousands
- TABLE 101 Europe 3D Eye Tracking Software Market, 2018 - 2021, USD Thousands
- TABLE 102 Europe 3D Eye Tracking Software Market, 2022 - 2028, USD Thousands
- TABLE 103 Europe 3D Eye Tracking Software Market by Type, 2018 - 2021, USD Thousands
- TABLE 104 Europe 3D Eye Tracking Software Market by Type, 2022 - 2028, USD Thousands
- TABLE 105 Europe Mobile Systems Market by Country, 2018 - 2021, USD Thousands
- TABLE 106 Europe Mobile Systems Market by Country, 2022 - 2028, USD Thousands
- TABLE 107 Europe Remote Eye Tracking Market by Country, 2018 - 2021, USD Thousands
- TABLE 108 Europe Remote Eye Tracking Market by Country, 2022 - 2028, USD Thousands
- TABLE 109 Europe Tower-Mounted Eye Tracking Market by Country, 2018 - 2021, USD Thousands
- TABLE 110 Europe Tower-Mounted Eye Tracking Market by Country, 2022 - 2028, USD Thousands
- TABLE 111 Europe 3D Eye Tracking Software Market by Application, 2018 - 2021, USD Thousands
- TABLE 112 Europe 3D Eye Tracking Software Market by Application, 2022 - 2028, USD Thousands
- TABLE 113 Europe Scientific Research Market by Country, 2018 - 2021, USD Thousands
- TABLE 114 Europe Scientific Research Market by Country, 2022 - 2028, USD Thousands
- TABLE 115 Europe Marketing & User Research Market by Country, 2018 - 2021, USD Thousands
- TABLE 116 Europe Marketing & User Research Market by Country, 2022 - 2028, USD Thousands
- TABLE 117 Europe Industry & Human Performance Market by Country, 2018 - 2021, USD Thousands
- TABLE 118 Europe Industry & Human Performance Market by Country, 2022 - 2028, USD Thousands
- TABLE 119 Europe 3D Eye Tracking Software Market by Industry, 2018 - 2021, USD Thousands
- TABLE 120 Europe 3D Eye Tracking Software Market by Industry, 2022 - 2028, USD Thousands
- TABLE 121 Europe Consumer Devices Market by Country, 2018 - 2021, USD Thousands
- TABLE 122 Europe Consumer Devices Market by Country, 2022 - 2028, USD Thousands
- TABLE 123 Europe Robotics Market by Country, 2018 - 2021, USD Thousands
- TABLE 124 Europe Robotics Market by Country, 2022 - 2028, USD Thousands
- TABLE 125 Europe Automotive Market by Country, 2018 - 2021, USD Thousands
- TABLE 126 Europe Automotive Market by Country, 2022 - 2028, USD Thousands
- TABLE 127 Europe Retail Market by Country, 2018 - 2021, USD Thousands
- TABLE 128 Europe Retail Market by Country, 2022 - 2028, USD Thousands
- TABLE 129 Europe Assistive Technology Solutions Market by Country, 2018 - 2021, USD Thousands
- TABLE 130 Europe Assistive Technology Solutions Market by Country, 2022 - 2028, USD Thousands
- TABLE 131 Europe Others Market by Country, 2018 - 2021, USD Thousands
- TABLE 132 Europe Others Market by Country, 2022 - 2028, USD Thousands
- TABLE 133 Europe 3D Eye Tracking Software Market by Country, 2018 - 2021, USD Thousands
- TABLE 134 Europe 3D Eye Tracking Software Market by Country, 2022 - 2028, USD Thousands
- TABLE 135 Germany 3D Eye Tracking Software Market, 2018 - 2021, USD Thousands
- TABLE 136 Germany 3D Eye Tracking Software Market, 2022 - 2028, USD Thousands
- TABLE 137 Germany 3D Eye Tracking Software Market by Type, 2018 - 2021, USD Thousands
- TABLE 138 Germany 3D Eye Tracking Software Market by Type, 2022 - 2028, USD Thousands
- TABLE 139 Germany 3D Eye Tracking Software Market by Application, 2018 - 2021, USD Thousands
- TABLE 140 Germany 3D Eye Tracking Software Market by Application, 2022 - 2028, USD Thousands
- TABLE 141 Germany 3D Eye Tracking Software Market by Industry, 2018 - 2021, USD Thousands
- TABLE 142 Germany 3D Eye Tracking Software Market by Industry, 2022 - 2028, USD Thousands
- TABLE 143 UK 3D Eye Tracking Software Market, 2018 - 2021, USD Thousands
- TABLE 144 UK 3D Eye Tracking Software Market, 2022 - 2028, USD Thousands
- TABLE 145 UK 3D Eye Tracking Software Market by Type, 2018 - 2021, USD Thousands
- TABLE 146 UK 3D Eye Tracking Software Market by Type, 2022 - 2028, USD Thousands
- TABLE 147 UK 3D Eye Tracking Software Market by Application, 2018 - 2021, USD Thousands
- TABLE 148 UK 3D Eye Tracking Software Market by Application, 2022 - 2028, USD Thousands
- TABLE 149 UK 3D Eye Tracking Software Market by Industry, 2018 - 2021, USD Thousands
- TABLE 150 UK 3D Eye Tracking Software Market by Industry, 2022 - 2028, USD Thousands
- TABLE 151 France 3D Eye Tracking Software Market, 2018 - 2021, USD Thousands
- TABLE 152 France 3D Eye Tracking Software Market, 2022 - 2028, USD Thousands
- TABLE 153 France 3D Eye Tracking Software Market by Type, 2018 - 2021, USD Thousands
- TABLE 154 France 3D Eye Tracking Software Market by Type, 2022 - 2028, USD Thousands
- TABLE 155 France 3D Eye Tracking Software Market by Application, 2018 - 2021, USD Thousands
- TABLE 156 France 3D Eye Tracking Software Market by Application, 2022 - 2028, USD Thousands
- TABLE 157 France 3D Eye Tracking Software Market by Industry, 2018 - 2021, USD Thousands
- TABLE 158 France 3D Eye Tracking Software Market by Industry, 2022 - 2028, USD Thousands
- TABLE 159 Russia 3D Eye Tracking Software Market, 2018 - 2021, USD Thousands
- TABLE 160 Russia 3D Eye Tracking Software Market, 2022 - 2028, USD Thousands
- TABLE 161 Russia 3D Eye Tracking Software Market by Type, 2018 - 2021, USD Thousands
- TABLE 162 Russia 3D Eye Tracking Software Market by Type, 2022 - 2028, USD Thousands
- TABLE 163 Russia 3D Eye Tracking Software Market by Application, 2018 - 2021, USD Thousands
- TABLE 164 Russia 3D Eye Tracking Software Market by Application, 2022 - 2028, USD Thousands
- TABLE 165 Russia 3D Eye Tracking Software Market by Industry, 2018 - 2021, USD Thousands
- TABLE 166 Russia 3D Eye Tracking Software Market by Industry, 2022 - 2028, USD Thousands
- TABLE 167 Spain 3D Eye Tracking Software Market, 2018 - 2021, USD Thousands
- TABLE 168 Spain 3D Eye Tracking Software Market, 2022 - 2028, USD Thousands
- TABLE 169 Spain 3D Eye Tracking Software Market by Type, 2018 - 2021, USD Thousands
- TABLE 170 Spain 3D Eye Tracking Software Market by Type, 2022 - 2028, USD Thousands
- TABLE 171 Spain 3D Eye Tracking Software Market by Application, 2018 - 2021, USD Thousands
- TABLE 172 Spain 3D Eye Tracking Software Market by Application, 2022 - 2028, USD Thousands
- TABLE 173 Spain 3D Eye Tracking Software Market by Industry, 2018 - 2021, USD Thousands
- TABLE 174 Spain 3D Eye Tracking Software Market by Industry, 2022 - 2028, USD Thousands
- TABLE 175 Italy 3D Eye Tracking Software Market, 2018 - 2021, USD Thousands
- TABLE 176 Italy 3D Eye Tracking Software Market, 2022 - 2028, USD Thousands
- TABLE 177 Italy 3D Eye Tracking Software Market by Type, 2018 - 2021, USD Thousands
- TABLE 178 Italy 3D Eye Tracking Software Market by Type, 2022 - 2028, USD Thousands
- TABLE 179 Italy 3D Eye Tracking Software Market by Application, 2018 - 2021, USD Thousands
- TABLE 180 Italy 3D Eye Tracking Software Market by Application, 2022 - 2028, USD Thousands
- TABLE 181 Italy 3D Eye Tracking Software Market by Industry, 2018 - 2021, USD Thousands
- TABLE 182 Italy 3D Eye Tracking Software Market by Industry, 2022 - 2028, USD Thousands
- TABLE 183 Rest of Europe 3D Eye Tracking Software Market, 2018 - 2021, USD Thousands
- TABLE 184 Rest of Europe 3D Eye Tracking Software Market, 2022 - 2028, USD Thousands
- TABLE 185 Rest of Europe 3D Eye Tracking Software Market by Type, 2018 - 2021, USD Thousands
- TABLE 186 Rest of Europe 3D Eye Tracking Software Market by Type, 2022 - 2028, USD Thousands
- TABLE 187 Rest of Europe 3D Eye Tracking Software Market by Application, 2018 - 2021, USD Thousands
- TABLE 188 Rest of Europe 3D Eye Tracking Software Market by Application, 2022 - 2028, USD Thousands
- TABLE 189 Rest of Europe 3D Eye Tracking Software Market by Industry, 2018 - 2021, USD Thousands
- TABLE 190 Rest of Europe 3D Eye Tracking Software Market by Industry, 2022 - 2028, USD Thousands
- TABLE 191 Asia Pacific 3D Eye Tracking Software Market, 2018 - 2021, USD Thousands
- TABLE 192 Asia Pacific 3D Eye Tracking Software Market, 2022 - 2028, USD Thousands
- TABLE 193 Asia Pacific 3D Eye Tracking Software Market by Type, 2018 - 2021, USD Thousands
- TABLE 194 Asia Pacific 3D Eye Tracking Software Market by Type, 2022 - 2028, USD Thousands
- TABLE 195 Asia Pacific Mobile Systems Market by Country, 2018 - 2021, USD Thousands
- TABLE 196 Asia Pacific Mobile Systems Market by Country, 2022 - 2028, USD Thousands
- TABLE 197 Asia Pacific Remote Eye Tracking Market by Country, 2018 - 2021, USD Thousands
- TABLE 198 Asia Pacific Remote Eye Tracking Market by Country, 2022 - 2028, USD Thousands
- TABLE 199 Asia Pacific Tower-Mounted Eye Tracking Market by Country, 2018 - 2021, USD Thousands
- TABLE 200 Asia Pacific Tower-Mounted Eye Tracking Market by Country, 2022 - 2028, USD Thousands
- TABLE 201 Asia Pacific 3D Eye Tracking Software Market by Application, 2018 - 2021, USD Thousands
- TABLE 202 Asia Pacific 3D Eye Tracking Software Market by Application, 2022 - 2028, USD Thousands
- TABLE 203 Asia Pacific Scientific Research Market by Country, 2018 - 2021, USD Thousands
- TABLE 204 Asia Pacific Scientific Research Market by Country, 2022 - 2028, USD Thousands
- TABLE 205 Asia Pacific Marketing & User Research Market by Country, 2018 - 2021, USD Thousands
- TABLE 206 Asia Pacific Marketing & User Research Market by Country, 2022 - 2028, USD Thousands
- TABLE 207 Asia Pacific Industry & Human Performance Market by Country, 2018 - 2021, USD Thousands
- TABLE 208 Asia Pacific Industry & Human Performance Market by Country, 2022 - 2028, USD Thousands
- TABLE 209 Asia Pacific 3D Eye Tracking Software Market by Industry, 2018 - 2021, USD Thousands
- TABLE 210 Asia Pacific 3D Eye Tracking Software Market by Industry, 2022 - 2028, USD Thousands
- TABLE 211 Asia Pacific Consumer Devices Market by Country, 2018 - 2021, USD Thousands
- TABLE 212 Asia Pacific Consumer Devices Market by Country, 2022 - 2028, USD Thousands
- TABLE 213 Asia Pacific Robotics Market by Country, 2018 - 2021, USD Thousands
- TABLE 214 Asia Pacific Robotics Market by Country, 2022 - 2028, USD Thousands
- TABLE 215 Asia Pacific Automotive Market by Country, 2018 - 2021, USD Thousands
- TABLE 216 Asia Pacific Automotive Market by Country, 2022 - 2028, USD Thousands
- TABLE 217 Asia Pacific Retail Market by Country, 2018 - 2021, USD Thousands
- TABLE 218 Asia Pacific Retail Market by Country, 2022 - 2028, USD Thousands
- TABLE 219 Asia Pacific Assistive Technology Solutions Market by Country, 2018 - 2021, USD Thousands
- TABLE 220 Asia Pacific Assistive Technology Solutions Market by Country, 2022 - 2028, USD Thousands
- TABLE 221 Asia Pacific Others Market by Country, 2018 - 2021, USD Thousands
- TABLE 222 Asia Pacific Others Market by Country, 2022 - 2028, USD Thousands
- TABLE 223 Asia Pacific 3D Eye Tracking Software Market by Country, 2018 - 2021, USD Thousands
- TABLE 224 Asia Pacific 3D Eye Tracking Software Market by Country, 2022 - 2028, USD Thousands
- TABLE 225 China 3D Eye Tracking Software Market, 2018 - 2021, USD Thousands
- TABLE 226 China 3D Eye Tracking Software Market, 2022 - 2028, USD Thousands
- TABLE 227 China 3D Eye Tracking Software Market by Type, 2018 - 2021, USD Thousands
- TABLE 228 China 3D Eye Tracking Software Market by Type, 2022 - 2028, USD Thousands
- TABLE 229 China 3D Eye Tracking Software Market by Application, 2018 - 2021, USD Thousands
- TABLE 230 China 3D Eye Tracking Software Market by Application, 2022 - 2028, USD Thousands
- TABLE 231 China 3D Eye Tracking Software Market by Industry, 2018 - 2021, USD Thousands
- TABLE 232 China 3D Eye Tracking Software Market by Industry, 2022 - 2028, USD Thousands
- TABLE 233 Japan 3D Eye Tracking Software Market, 2018 - 2021, USD Thousands
- TABLE 234 Japan 3D Eye Tracking Software Market, 2022 - 2028, USD Thousands
- TABLE 235 Japan 3D Eye Tracking Software Market by Type, 2018 - 2021, USD Thousands
- TABLE 236 Japan 3D Eye Tracking Software Market by Type, 2022 - 2028, USD Thousands
- TABLE 237 Japan 3D Eye Tracking Software Market by Application, 2018 - 2021, USD Thousands
- TABLE 238 Japan 3D Eye Tracking Software Market by Application, 2022 - 2028, USD Thousands
- TABLE 239 Japan 3D Eye Tracking Software Market by Industry, 2018 - 2021, USD Thousands
- TABLE 240 Japan 3D Eye Tracking Software Market by Industry, 2022 - 2028, USD Thousands
- TABLE 241 India 3D Eye Tracking Software Market, 2018 - 2021, USD Thousands
- TABLE 242 India 3D Eye Tracking Software Market, 2022 - 2028, USD Thousands
- TABLE 243 India 3D Eye Tracking Software Market by Type, 2018 - 2021, USD Thousands
- TABLE 244 India 3D Eye Tracking Software Market by Type, 2022 - 2028, USD Thousands
- TABLE 245 India 3D Eye Tracking Software Market by Application, 2018 - 2021, USD Thousands
- TABLE 246 India 3D Eye Tracking Software Market by Application, 2022 - 2028, USD Thousands
- TABLE 247 India 3D Eye Tracking Software Market by Industry, 2018 - 2021, USD Thousands
- TABLE 248 India 3D Eye Tracking Software Market by Industry, 2022 - 2028, USD Thousands
- TABLE 249 South Korea 3D Eye Tracking Software Market, 2018 - 2021, USD Thousands
- TABLE 250 South Korea 3D Eye Tracking Software Market, 2022 - 2028, USD Thousands
- TABLE 251 South Korea 3D Eye Tracking Software Market by Type, 2018 - 2021, USD Thousands
- TABLE 252 South Korea 3D Eye Tracking Software Market by Type, 2022 - 2028, USD Thousands
- TABLE 253 South Korea 3D Eye Tracking Software Market by Application, 2018 - 2021, USD Thousands
- TABLE 254 South Korea 3D Eye Tracking Software Market by Application, 2022 - 2028, USD Thousands
- TABLE 255 South Korea 3D Eye Tracking Software Market by Industry, 2018 - 2021, USD Thousands
- TABLE 256 South Korea 3D Eye Tracking Software Market by Industry, 2022 - 2028, USD Thousands
- TABLE 257 Singapore 3D Eye Tracking Software Market, 2018 - 2021, USD Thousands
- TABLE 258 Singapore 3D Eye Tracking Software Market, 2022 - 2028, USD Thousands
- TABLE 259 Singapore 3D Eye Tracking Software Market by Type, 2018 - 2021, USD Thousands
- TABLE 260 Singapore 3D Eye Tracking Software Market by Type, 2022 - 2028, USD Thousands
- TABLE 261 Singapore 3D Eye Tracking Software Market by Application, 2018 - 2021, USD Thousands
- TABLE 262 Singapore 3D Eye Tracking Software Market by Application, 2022 - 2028, USD Thousands
- TABLE 263 Singapore 3D Eye Tracking Software Market by Industry, 2018 - 2021, USD Thousands
- TABLE 264 Singapore 3D Eye Tracking Software Market by Industry, 2022 - 2028, USD Thousands
- TABLE 265 Malaysia 3D Eye Tracking Software Market, 2018 - 2021, USD Thousands
- TABLE 266 Malaysia 3D Eye Tracking Software Market, 2022 - 2028, USD Thousands
- TABLE 267 Malaysia 3D Eye Tracking Software Market by Type, 2018 - 2021, USD Thousands
- TABLE 268 Malaysia 3D Eye Tracking Software Market by Type, 2022 - 2028, USD Thousands
- TABLE 269 Malaysia 3D Eye Tracking Software Market by Application, 2018 - 2021, USD Thousands
- TABLE 270 Malaysia 3D Eye Tracking Software Market by Application, 2022 - 2028, USD Thousands
- TABLE 271 Malaysia 3D Eye Tracking Software Market by Industry, 2018 - 2021, USD Thousands
- TABLE 272 Malaysia 3D Eye Tracking Software Market by Industry, 2022 - 2028, USD Thousands
- TABLE 273 Rest of Asia Pacific 3D Eye Tracking Software Market, 2018 - 2021, USD Thousands
- TABLE 274 Rest of Asia Pacific 3D Eye Tracking Software Market, 2022 - 2028, USD Thousands
- TABLE 275 Rest of Asia Pacific 3D Eye Tracking Software Market by Type, 2018 - 2021, USD Thousands
- TABLE 276 Rest of Asia Pacific 3D Eye Tracking Software Market by Type, 2022 - 2028, USD Thousands
- TABLE 277 Rest of Asia Pacific 3D Eye Tracking Software Market by Application, 2018 - 2021, USD Thousands
- TABLE 278 Rest of Asia Pacific 3D Eye Tracking Software Market by Application, 2022 - 2028, USD Thousands
- TABLE 279 Rest of Asia Pacific 3D Eye Tracking Software Market by Industry, 2018 - 2021, USD Thousands
- TABLE 280 Rest of Asia Pacific 3D Eye Tracking Software Market by Industry, 2022 - 2028, USD Thousands
- TABLE 281 LAMEA 3D Eye Tracking Software Market, 2018 - 2021, USD Thousands
- TABLE 282 LAMEA 3D Eye Tracking Software Market, 2022 - 2028, USD Thousands
- TABLE 283 LAMEA 3D Eye Tracking Software Market by Type, 2018 - 2021, USD Thousands
- TABLE 284 LAMEA 3D Eye Tracking Software Market by Type, 2022 - 2028, USD Thousands
- TABLE 285 LAMEA Mobile Systems Market by Country, 2018 - 2021, USD Thousands
- TABLE 286 LAMEA Mobile Systems Market by Country, 2022 - 2028, USD Thousands
- TABLE 287 LAMEA Remote Eye Tracking Market by Country, 2018 - 2021, USD Thousands
- TABLE 288 LAMEA Remote Eye Tracking Market by Country, 2022 - 2028, USD Thousands
- TABLE 289 LAMEA Tower-Mounted Eye Tracking Market by Country, 2018 - 2021, USD Thousands
- TABLE 290 LAMEA Tower-Mounted Eye Tracking Market by Country, 2022 - 2028, USD Thousands
- TABLE 291 LAMEA 3D Eye Tracking Software Market by Application, 2018 - 2021, USD Thousands
- TABLE 292 LAMEA 3D Eye Tracking Software Market by Application, 2022 - 2028, USD Thousands
- TABLE 293 LAMEA Scientific Research Market by Country, 2018 - 2021, USD Thousands
- TABLE 294 LAMEA Scientific Research Market by Country, 2022 - 2028, USD Thousands
- TABLE 295 LAMEA Marketing & User Research Market by Country, 2018 - 2021, USD Thousands
- TABLE 296 LAMEA Marketing & User Research Market by Country, 2022 - 2028, USD Thousands
- TABLE 297 LAMEA Industry & Human Performance Market by Country, 2018 - 2021, USD Thousands
- TABLE 298 LAMEA Industry & Human Performance Market by Country, 2022 - 2028, USD Thousands
- TABLE 299 LAMEA 3D Eye Tracking Software Market by Industry, 2018 - 2021, USD Thousands
- TABLE 300 LAMEA 3D Eye Tracking Software Market by Industry, 2022 - 2028, USD Thousands
- TABLE 301 LAMEA Consumer Devices Market by Country, 2018 - 2021, USD Thousands
- TABLE 302 LAMEA Consumer Devices Market by Country, 2022 - 2028, USD Thousands
- TABLE 303 LAMEA Robotics Market by Country, 2018 - 2021, USD Thousands
- TABLE 304 LAMEA Robotics Market by Country, 2022 - 2028, USD Thousands
- TABLE 305 LAMEA Automotive Market by Country, 2018 - 2021, USD Thousands
- TABLE 306 LAMEA Automotive Market by Country, 2022 - 2028, USD Thousands
- TABLE 307 LAMEA Retail Market by Country, 2018 - 2021, USD Thousands
- TABLE 308 LAMEA Retail Market by Country, 2022 - 2028, USD Thousands
- TABLE 309 LAMEA Assistive Technology Solutions Market by Country, 2018 - 2021, USD Thousands
- TABLE 310 LAMEA Assistive Technology Solutions Market by Country, 2022 - 2028, USD Thousands
- TABLE 311 LAMEA Others Market by Country, 2018 - 2021, USD Thousands
- TABLE 312 LAMEA Others Market by Country, 2022 - 2028, USD Thousands
- TABLE 313 LAMEA 3D Eye Tracking Software Market by Country, 2018 - 2021, USD Thousands
- TABLE 314 LAMEA 3D Eye Tracking Software Market by Country, 2022 - 2028, USD Thousands
- TABLE 315 Brazil 3D Eye Tracking Software Market, 2018 - 2021, USD Thousands
- TABLE 316 Brazil 3D Eye Tracking Software Market, 2022 - 2028, USD Thousands
- TABLE 317 Brazil 3D Eye Tracking Software Market by Type, 2018 - 2021, USD Thousands
- TABLE 318 Brazil 3D Eye Tracking Software Market by Type, 2022 - 2028, USD Thousands
- TABLE 319 Brazil 3D Eye Tracking Software Market by Application, 2018 - 2021, USD Thousands
- TABLE 320 Brazil 3D Eye Tracking Software Market by Application, 2022 - 2028, USD Thousands
- TABLE 321 Brazil 3D Eye Tracking Software Market by Industry, 2018 - 2021, USD Thousands
- TABLE 322 Brazil 3D Eye Tracking Software Market by Industry, 2022 - 2028, USD Thousands
- TABLE 323 Argentina 3D Eye Tracking Software Market, 2018 - 2021, USD Thousands
- TABLE 324 Argentina 3D Eye Tracking Software Market, 2022 - 2028, USD Thousands
- TABLE 325 Argentina 3D Eye Tracking Software Market by Type, 2018 - 2021, USD Thousands
- TABLE 326 Argentina 3D Eye Tracking Software Market by Type, 2022 - 2028, USD Thousands
- TABLE 327 Argentina 3D Eye Tracking Software Market by Application, 2018 - 2021, USD Thousands
- TABLE 328 Argentina 3D Eye Tracking Software Market by Application, 2022 - 2028, USD Thousands
- TABLE 329 Argentina 3D Eye Tracking Software Market by Industry, 2018 - 2021, USD Thousands
- TABLE 330 Argentina 3D Eye Tracking Software Market by Industry, 2022 - 2028, USD Thousands
- TABLE 331 UAE 3D Eye Tracking Software Market, 2018 - 2021, USD Thousands
- TABLE 332 UAE 3D Eye Tracking Software Market, 2022 - 2028, USD Thousands
- TABLE 333 UAE 3D Eye Tracking Software Market by Type, 2018 - 2021, USD Thousands
- TABLE 334 UAE 3D Eye Tracking Software Market by Type, 2022 - 2028, USD Thousands
- TABLE 335 UAE 3D Eye Tracking Software Market by Application, 2018 - 2021, USD Thousands
- TABLE 336 UAE 3D Eye Tracking Software Market by Application, 2022 - 2028, USD Thousands
- TABLE 337 UAE 3D Eye Tracking Software Market by Industry, 2018 - 2021, USD Thousands
- TABLE 338 UAE 3D Eye Tracking Software Market by Industry, 2022 - 2028, USD Thousands
- TABLE 339 Saudi Arabia 3D Eye Tracking Software Market, 2018 - 2021, USD Thousands
- TABLE 340 Saudi Arabia 3D Eye Tracking Software Market, 2022 - 2028, USD Thousands
- TABLE 341 Saudi Arabia 3D Eye Tracking Software Market by Type, 2018 - 2021, USD Thousands
- TABLE 342 Saudi Arabia 3D Eye Tracking Software Market by Type, 2022 - 2028, USD Thousands
- TABLE 343 Saudi Arabia 3D Eye Tracking Software Market by Application, 2018 - 2021, USD Thousands
- TABLE 344 Saudi Arabia 3D Eye Tracking Software Market by Application, 2022 - 2028, USD Thousands
- TABLE 345 Saudi Arabia 3D Eye Tracking Software Market by Industry, 2018 - 2021, USD Thousands
- TABLE 346 Saudi Arabia 3D Eye Tracking Software Market by Industry, 2022 - 2028, USD Thousands
- TABLE 347 South Africa 3D Eye Tracking Software Market, 2018 - 2021, USD Thousands
- TABLE 348 South Africa 3D Eye Tracking Software Market, 2022 - 2028, USD Thousands
- TABLE 349 South Africa 3D Eye Tracking Software Market by Type, 2018 - 2021, USD Thousands
- TABLE 350 South Africa 3D Eye Tracking Software Market by Type, 2022 - 2028, USD Thousands
- TABLE 351 South Africa 3D Eye Tracking Software Market by Application, 2018 - 2021, USD Thousands
- TABLE 352 South Africa 3D Eye Tracking Software Market by Application, 2022 - 2028, USD Thousands
- TABLE 353 South Africa 3D Eye Tracking Software Market by Industry, 2018 - 2021, USD Thousands
- TABLE 354 South Africa 3D Eye Tracking Software Market by Industry, 2022 - 2028, USD Thousands
- TABLE 355 Nigeria 3D Eye Tracking Software Market, 2018 - 2021, USD Thousands
- TABLE 356 Nigeria 3D Eye Tracking Software Market, 2022 - 2028, USD Thousands
- TABLE 357 Nigeria 3D Eye Tracking Software Market by Type, 2018 - 2021, USD Thousands
- TABLE 358 Nigeria 3D Eye Tracking Software Market by Type, 2022 - 2028, USD Thousands
- TABLE 359 Nigeria 3D Eye Tracking Software Market by Application, 2018 - 2021, USD Thousands
- TABLE 360 Nigeria 3D Eye Tracking Software Market by Application, 2022 - 2028, USD Thousands
- TABLE 361 Nigeria 3D Eye Tracking Software Market by Industry, 2018 - 2021, USD Thousands
- TABLE 362 Nigeria 3D Eye Tracking Software Market by Industry, 2022 - 2028, USD Thousands
- TABLE 363 Rest of LAMEA 3D Eye Tracking Software Market, 2018 - 2021, USD Thousands
- TABLE 364 Rest of LAMEA 3D Eye Tracking Software Market, 2022 - 2028, USD Thousands
- TABLE 365 Rest of LAMEA 3D Eye Tracking Software Market by Type, 2018 - 2021, USD Thousands
- TABLE 366 Rest of LAMEA 3D Eye Tracking Software Market by Type, 2022 - 2028, USD Thousands
- TABLE 367 Rest of LAMEA 3D Eye Tracking Software Market by Application, 2018 - 2021, USD Thousands
- TABLE 368 Rest of LAMEA 3D Eye Tracking Software Market by Application, 2022 - 2028, USD Thousands
- TABLE 369 Rest of LAMEA 3D Eye Tracking Software Market by Industry, 2018 - 2021, USD Thousands
- TABLE 370 Rest of LAMEA 3D Eye Tracking Software Market by Industry, 2022 - 2028, USD Thousands
- TABLE 371 Key Information -Tobii AB
- TABLE 372 Key Information - iMotions A/S
- TABLE 373 Key Information - EyeTech Digital Systems, Inc.
- TABLE 374 Key Information - Gaze Intelligence
- TABLE 375 Key Information - ParallelDots, Inc.
- TABLE 376 Key Information - Eyegaze, Inc.
- TABLE 377 Key Information - Pupil Labs GmbH
- TABLE 378 Key Information - Gazepoint
- TABLE 379 Key Information - alea technologies gmbh
- TABLE 380 Key Information - Converus, Inc.
List of Figures
- FIG 1 Methodology for the research
- FIG 2 Global 3D Eye Tracking Software Market share by Type, 2021
- FIG 3 Global 3D Eye Tracking Software Market share by Type, 2028
- FIG 4 Global 3D Eye Tracking Software Market by Type, 2018 - 2028, USD Thousands
- FIG 5 Global 3D Eye Tracking Software Market share by Application, 2021
- FIG 6 Global 3D Eye Tracking Software Market share by Application, 2028
- FIG 7 Global 3D Eye Tracking Software Market by Application, 2018 - 2028, USD Thousands
- FIG 8 Global 3D Eye Tracking Software Market share by Industry, 2021
- FIG 9 Global 3D Eye Tracking Software Market share by Industry, 2028
- FIG 10 Global 3D Eye Tracking Software Market by Industry, 2018 - 2028, USD Thousands
- FIG 11 Global 3D Eye Tracking Software Market share by Region, 2021
- FIG 12 Global 3D Eye Tracking Software Market share by Region, 2028
- FIG 13 Global 3D Eye Tracking Software Market by Region, 2018 - 2028, USD Thousands
- FIG 14 Recent strategies and developments: Tobii AB
The Global 3D Eye Tracking Software Market size is expected to reach $665.5 Million by 2028, rising at a market growth of 25.7% CAGR during the forecast period.
3D eye tracking software is used to quantify eye gazing, which provides new opportunities and applications for human-machine interaction. Using 3D eye-tracking technology, researchers may assess the attention of customers and retailers without concern of bias. Eye tracking can examine the movement of interest, perception, and purpose. When consumers become interested in a product, they evaluate it in a particular manner. Their opinion then determines whether they intend to purchase the item.
Customers are more likely to perceive a better value if the price comes first. Retailers require visual signals along the way to make an informed purchase decision. Using 3D eye tracking software, retailers can track visual attention in this process and determine the most effective optical techniques and positioning cues for products. Despite technological advancements, 3D eye-tracking software needs significant hardware and peripherals to measure correct data, resulting in expensive development and manufacturing costs for 3D eye-tracking software devices.
In recent years, eye-trackers have become an integral part of market research. Typically, these devices' data can improve a company's offline and online business organization. Using 3D eye tracking software technology breakthroughs, it can now evaluate focus on particular brands, goods, or critical messages. In addition, it is utilized to determine the store's ease of navigation.
This is why attention tracking provides organizations with vital information. 3D eye tracking software market forecast without calibration can give shelf-attention analytics that counts the number of views and focal spots. Retail and other marketing organizations utilize these data to develop innovative sales techniques and shopper approaches for their retail clients.
COVID-19 Impact Analysis
3D eye-tracking software sales are proportionate to demand from end-use industries, such as automotive, retail, and research. Due to import-export restrictions, blocked borders, and supply chain interruptions caused by the COVID-19 pandemic, the market for 3D eye-tracking software in retail was negatively impacted. The COVID-19 pandemic has halted the eye-tracking industry's rate of expansion. The shutdown of important consumer electronics, retail, automotive, and manufacturing industries affected product demand. However, the market is expected to show growth with the ease of the COVID-19-based restrictions, which will surge its usage by the primary end-use industries and aid the market in recovery.
Market Growth Factors
3D eye tracking in retail
Through 3D eye-tracking, visual attention data is the most readily available. In the context of retail research, visual attention shows customers' inherent interests. Eye-tracking reveals the amount of time it took a buyer to focus on a single product, the number of times they glanced at it, and the average amount of time they spent staring at an item. Typically, they purchase the products they examine the longest and most frequently. With eye-tracking, one can also examine the flow of interest, perception, and intent: if a product attracts a shopper's attention, they will view it in a particular way. he usage of 3D eye tracking in the retail sector to analyze consumer behavior and offer better products and services to them is expected to boost the market growth.
Eye tracking for automotive applications
3D eye-tracking technology for the automotive sector is used to increase safety on roads. Gaze recognition will resolve two major problems with human-vehicle interaction. Like to monitor and enable coordinated handovers in semi-autonomous vehicles, it will be necessary to detect the driver's attention due to rising safety concerns by automotive safety authorities. The driver's concentration will be checked continuously in the future by using depth-sensing cameras. The tracking program uses data from the cameras to evaluate the driver's focus. Consequently, using the most recent technology, such as 3D eye tracking software, to optimize the performance and safety of the cars will propel market expansion.
Market Restraining Factors
Issues associated with 3D eye tracking
The fact that eye-tracking technology only records eye movements is a third challenge. To effectively interpret the recordings, eye-tracking technology must be combined with an additional data collection method. For instance, Likert scales assessing consumers' willingness to buy can be used to discover what information consumers visually check and consider when selecting whether to purchase a product. However, it can be challenging to interpret these data because visual attention is not the only element influencing customer behavior. Hence, the drawbacks associated with 3D eye-tracking devices are expected to hinder the market growth.
Type Outlook
Based on type, the 3D eye tracking software market is segmented into mobile systems, remote eye tracking and tower-mounted eye tracking. The mobile systems segment dominated the 3D eye tracking software market with maximum revenue share in 2021. This is due to its involvement in wearable devices, often eye-tracking glasses or headbands. A camera or mirror that records the scene or the user's field of vision is placed in front of one or both eyes. Modern mobile devices are untethered, enabling research in contexts far more relevant to daily life, such as sports, automotive and simulator use, motor-control and gait assessments, and athletics.
Application Outlook
On the basis of application, the 3D eye tracking software market is divided into scientific research, marketing & user research and industry & human performance. The industry & human performance segment procured a promising growth rate in the 3D eye tracking software market in 2021. This is due to the fact that eye tracking lets the user view an additional granularity in their organization's operations, allowing the user to discover methods to enhance procedures, decrease errors, and eliminate waste. Each person's approach to accomplishing a task is unique, and these variations might result in diverse outcomes.
Industry Outlook
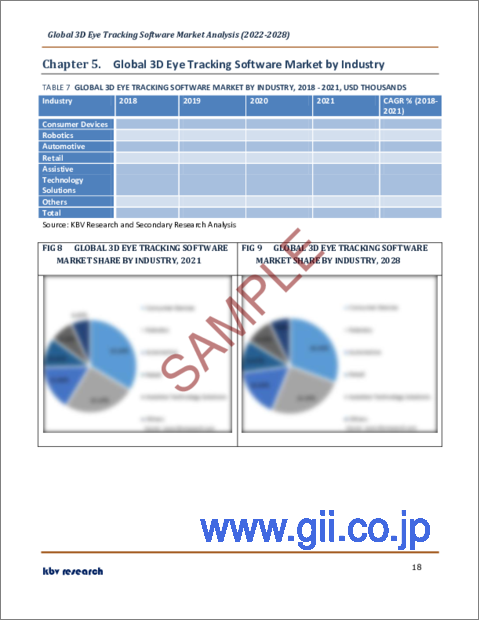
By industry, the 3D eye tracking software market is classified into consumer devices, assistive technology solutions, automotive, retail, robotics and others. The robotics segment recorded a promising growth rate in the 3D eye tracking software market in 2021. This is because surgical robots are a classic illustration of how advances in medical technology have facilitated digital transformation and enhanced treatment. By executing very small incisions with highly exact maneuvers, remote-controlled surgical robots have enabled a variety of minimally invasive operations that encourage quick recovery, which is beneficial for patients, hospitals, and clinics, as well as those waiting in line.
Regional Outlook
Region-wise, the3D eye tracking software market is analyzed across North America, Europe, Asia Pacific, and LAMEA. The North America region registered the highest revenue share in the 3D eye tracking software market in 2021. The growth is attributable to increased government investment in technologically advanced tracking methods. To provide virtual driver assistance, the incorporation of 3D eye-tracking software into an increasing number of electric vehicles is rising. In addition, the increase in sales of robotics-configured 3D eye-tracking devices in numerous industries, namely the automotive, and healthcare industries, is driving the growth of the 3D eye-tracking software market in the forecast period.
The market research report covers the analysis of key stake holders of the market. Key companies profiled in the report include Tobii AB, iMotions A/S (Smart Eye A/S), Gaze Intelligence, ParallelDots, Inc., EyeTech Digital Systems, Inc., Eyegaze, Inc., Pupil Labs GmbH, Gazepoint, alea technologies gmbh (IntelliGaze), and Converus, Inc.
Scope of the Study
Market Segments covered in the Report:
By Type
- Mobile Systems
- Remote Eye Tracking
- Tower-Mounted Eye Tracking
By Application
- Scientific Research
- Marketing & User Research
- Industry & Human Performance
By Industry
- Consumer Devices
- Robotics
- Automotive
- Retail
- Assistive Technology Solutions
- Others
By Geography
- North America
- US
- Canada
- Mexico
- Rest of North America
- Europe
- Germany
- UK
- France
- Russia
- Spain
- Italy
- Rest of Europe
- Asia Pacific
- China
- Japan
- India
- South Korea
- Singapore
- Malaysia
- Rest of Asia Pacific
- LAMEA
- Brazil
- Argentina
- UAE
- Saudi Arabia
- South Africa
- Nigeria
- Rest of LAMEA
Companies Profiled
- Tobii AB
- iMotions A/S (Smart Eye A/S)
- Gaze Intelligence
- ParallelDots, Inc.
- EyeTech Digital Systems, Inc.
- Eyegaze, Inc.
- Pupil Labs GmbH
- Gazepoint
- alea technologies gmbh (IntelliGaze)
- Converus, Inc.
Unique Offerings from KBV Research
- Exhaustive coverage
- Highest number of market tables and figures
- Subscription based model available
- Guaranteed best price
- Assured post sales research support with 10% customization free
Table of Contents
Chapter 1. Market Scope & Methodology
- 1.1 Market Definition
- 1.2 Objectives
- 1.3 Market Scope
- 1.4 Segmentation
- 1.4.1 Global 3D Eye Tracking Software Market, by Type
- 1.4.2 Global 3D Eye Tracking Software Market, by Application
- 1.4.3 Global 3D Eye Tracking Software Market, by Industry
- 1.4.4 Global 3D Eye Tracking Software Market, by Geography
- 1.5 Methodology for the research
Chapter 2. Market Overview
- 2.1 Introduction
- 2.1.1 Overview
- 2.1.1.1 Market composition & scenario
- 2.1.1 Overview
- 2.2 Key Factors Impacting the Market
- 2.2.1 Market Drivers
- 2.2.2 Market Restraints
Chapter 3. Global 3D Eye Tracking Software Market by Type
- 3.1 Global Mobile Systems Market by Region
- 3.2 Global Remote Eye Tracking Market by Region
- 3.3 Global Tower-Mounted Eye Tracking Market by Region
Chapter 4. Global 3D Eye Tracking Software Market by Application
- 4.1 Global Scientific Research Market by Region
- 4.2 Global Marketing & User Research Market by Region
- 4.3 Global Industry & Human Performance Market by Region
Chapter 5. Global 3D Eye Tracking Software Market by Industry
- 5.1 Global Consumer Devices Market by Region
- 5.2 Global Robotics Market by Region
- 5.3 Global Automotive Market by Region
- 5.4 Global Retail Market by Region
- 5.5 Global Assistive Technology Solutions Market by Region
- 5.6 Global Others Market by Region
Chapter 6. Global 3D Eye Tracking Software Market by Region
- 6.1 North America 3D Eye Tracking Software Market
- 6.1.1 North America 3D Eye Tracking Software Market by Type
- 6.1.1.1 North America Mobile Systems Market by Country
- 6.1.1.2 North America Remote Eye Tracking Market by Country
- 6.1.1.3 North America Tower-Mounted Eye Tracking Market by Country
- 6.1.2 North America 3D Eye Tracking Software Market by Application
- 6.1.2.1 North America Scientific Research Market by Country
- 6.1.2.2 North America Marketing & User Research Market by Country
- 6.1.2.3 North America Industry & Human Performance Market by Country
- 6.1.3 North America 3D Eye Tracking Software Market by Industry
- 6.1.3.1 North America Consumer Devices Market by Country
- 6.1.3.2 North America Robotics Market by Country
- 6.1.3.3 North America Automotive Market by Country
- 6.1.3.4 North America Retail Market by Country
- 6.1.3.5 North America Assistive Technology Solutions Market by Country
- 6.1.3.6 North America Others Market by Country
- 6.1.4 North America 3D Eye Tracking Software Market by Country
- 6.1.4.1 US 3D Eye Tracking Software Market
- 6.1.4.1.1 US 3D Eye Tracking Software Market by Type
- 6.1.4.1.2 US 3D Eye Tracking Software Market by Application
- 6.1.4.1.3 US 3D Eye Tracking Software Market by Industry
- 6.1.4.2 Canada 3D Eye Tracking Software Market
- 6.1.4.2.1 Canada 3D Eye Tracking Software Market by Type
- 6.1.4.2.2 Canada 3D Eye Tracking Software Market by Application
- 6.1.4.2.3 Canada 3D Eye Tracking Software Market by Industry
- 6.1.4.3 Mexico 3D Eye Tracking Software Market
- 6.1.4.3.1 Mexico 3D Eye Tracking Software Market by Type
- 6.1.4.3.2 Mexico 3D Eye Tracking Software Market by Application
- 6.1.4.3.3 Mexico 3D Eye Tracking Software Market by Industry
- 6.1.4.4 Rest of North America 3D Eye Tracking Software Market
- 6.1.4.4.1 Rest of North America 3D Eye Tracking Software Market by Type
- 6.1.4.4.2 Rest of North America 3D Eye Tracking Software Market by Application
- 6.1.4.4.3 Rest of North America 3D Eye Tracking Software Market by Industry
- 6.1.4.1 US 3D Eye Tracking Software Market
- 6.1.1 North America 3D Eye Tracking Software Market by Type
- 6.2 Europe 3D Eye Tracking Software Market
- 6.2.1 Europe 3D Eye Tracking Software Market by Type
- 6.2.1.1 Europe Mobile Systems Market by Country
- 6.2.1.2 Europe Remote Eye Tracking Market by Country
- 6.2.1.3 Europe Tower-Mounted Eye Tracking Market by Country
- 6.2.2 Europe 3D Eye Tracking Software Market by Application
- 6.2.2.1 Europe Scientific Research Market by Country
- 6.2.2.2 Europe Marketing & User Research Market by Country
- 6.2.2.3 Europe Industry & Human Performance Market by Country
- 6.2.3 Europe 3D Eye Tracking Software Market by Industry
- 6.2.3.1 Europe Consumer Devices Market by Country
- 6.2.3.2 Europe Robotics Market by Country
- 6.2.3.3 Europe Automotive Market by Country
- 6.2.3.4 Europe Retail Market by Country
- 6.2.3.5 Europe Assistive Technology Solutions Market by Country
- 6.2.3.6 Europe Others Market by Country
- 6.2.4 Europe 3D Eye Tracking Software Market by Country
- 6.2.4.1 Germany 3D Eye Tracking Software Market
- 6.2.4.1.1 Germany 3D Eye Tracking Software Market by Type
- 6.2.4.1.2 Germany 3D Eye Tracking Software Market by Application
- 6.2.4.1.3 Germany 3D Eye Tracking Software Market by Industry
- 6.2.4.2 UK 3D Eye Tracking Software Market
- 6.2.4.2.1 UK 3D Eye Tracking Software Market by Type
- 6.2.4.2.2 UK 3D Eye Tracking Software Market by Application
- 6.2.4.2.3 UK 3D Eye Tracking Software Market by Industry
- 6.2.4.3 France 3D Eye Tracking Software Market
- 6.2.4.3.1 France 3D Eye Tracking Software Market by Type
- 6.2.4.3.2 France 3D Eye Tracking Software Market by Application
- 6.2.4.3.3 France 3D Eye Tracking Software Market by Industry
- 6.2.4.4 Russia 3D Eye Tracking Software Market
- 6.2.4.4.1 Russia 3D Eye Tracking Software Market by Type
- 6.2.4.4.2 Russia 3D Eye Tracking Software Market by Application
- 6.2.4.4.3 Russia 3D Eye Tracking Software Market by Industry
- 6.2.4.5 Spain 3D Eye Tracking Software Market
- 6.2.4.5.1 Spain 3D Eye Tracking Software Market by Type
- 6.2.4.5.2 Spain 3D Eye Tracking Software Market by Application
- 6.2.4.5.3 Spain 3D Eye Tracking Software Market by Industry
- 6.2.4.6 Italy 3D Eye Tracking Software Market
- 6.2.4.6.1 Italy 3D Eye Tracking Software Market by Type
- 6.2.4.6.2 Italy 3D Eye Tracking Software Market by Application
- 6.2.4.6.3 Italy 3D Eye Tracking Software Market by Industry
- 6.2.4.7 Rest of Europe 3D Eye Tracking Software Market
- 6.2.4.7.1 Rest of Europe 3D Eye Tracking Software Market by Type
- 6.2.4.7.2 Rest of Europe 3D Eye Tracking Software Market by Application
- 6.2.4.7.3 Rest of Europe 3D Eye Tracking Software Market by Industry
- 6.2.4.1 Germany 3D Eye Tracking Software Market
- 6.2.1 Europe 3D Eye Tracking Software Market by Type
- 6.3 Asia Pacific 3D Eye Tracking Software Market
- 6.3.1 Asia Pacific 3D Eye Tracking Software Market by Type
- 6.3.1.1 Asia Pacific Mobile Systems Market by Country
- 6.3.1.2 Asia Pacific Remote Eye Tracking Market by Country
- 6.3.1.3 Asia Pacific Tower-Mounted Eye Tracking Market by Country
- 6.3.2 Asia Pacific 3D Eye Tracking Software Market by Application
- 6.3.2.1 Asia Pacific Scientific Research Market by Country
- 6.3.2.2 Asia Pacific Marketing & User Research Market by Country
- 6.3.2.3 Asia Pacific Industry & Human Performance Market by Country
- 6.3.3 Asia Pacific 3D Eye Tracking Software Market by Industry
- 6.3.3.1 Asia Pacific Consumer Devices Market by Country
- 6.3.3.2 Asia Pacific Robotics Market by Country
- 6.3.3.3 Asia Pacific Automotive Market by Country
- 6.3.3.4 Asia Pacific Retail Market by Country
- 6.3.3.5 Asia Pacific Assistive Technology Solutions Market by Country
- 6.3.3.6 Asia Pacific Others Market by Country
- 6.3.4 Asia Pacific 3D Eye Tracking Software Market by Country
- 6.3.4.1 China 3D Eye Tracking Software Market
- 6.3.4.1.1 China 3D Eye Tracking Software Market by Type
- 6.3.4.1.2 China 3D Eye Tracking Software Market by Application
- 6.3.4.1.3 China 3D Eye Tracking Software Market by Industry
- 6.3.4.2 Japan 3D Eye Tracking Software Market
- 6.3.4.2.1 Japan 3D Eye Tracking Software Market by Type
- 6.3.4.2.2 Japan 3D Eye Tracking Software Market by Application
- 6.3.4.2.3 Japan 3D Eye Tracking Software Market by Industry
- 6.3.4.3 India 3D Eye Tracking Software Market
- 6.3.4.3.1 India 3D Eye Tracking Software Market by Type
- 6.3.4.3.2 India 3D Eye Tracking Software Market by Application
- 6.3.4.3.3 India 3D Eye Tracking Software Market by Industry
- 6.3.4.4 South Korea 3D Eye Tracking Software Market
- 6.3.4.4.1 South Korea 3D Eye Tracking Software Market by Type
- 6.3.4.4.2 South Korea 3D Eye Tracking Software Market by Application
- 6.3.4.4.3 South Korea 3D Eye Tracking Software Market by Industry
- 6.3.4.5 Singapore 3D Eye Tracking Software Market
- 6.3.4.5.1 Singapore 3D Eye Tracking Software Market by Type
- 6.3.4.5.2 Singapore 3D Eye Tracking Software Market by Application
- 6.3.4.5.3 Singapore 3D Eye Tracking Software Market by Industry
- 6.3.4.6 Malaysia 3D Eye Tracking Software Market
- 6.3.4.6.1 Malaysia 3D Eye Tracking Software Market by Type
- 6.3.4.6.2 Malaysia 3D Eye Tracking Software Market by Application
- 6.3.4.6.3 Malaysia 3D Eye Tracking Software Market by Industry
- 6.3.4.7 Rest of Asia Pacific 3D Eye Tracking Software Market
- 6.3.4.7.1 Rest of Asia Pacific 3D Eye Tracking Software Market by Type
- 6.3.4.7.2 Rest of Asia Pacific 3D Eye Tracking Software Market by Application
- 6.3.4.7.3 Rest of Asia Pacific 3D Eye Tracking Software Market by Industry
- 6.3.4.1 China 3D Eye Tracking Software Market
- 6.3.1 Asia Pacific 3D Eye Tracking Software Market by Type
- 6.4 LAMEA 3D Eye Tracking Software Market
- 6.4.1 LAMEA 3D Eye Tracking Software Market by Type
- 6.4.1.1 LAMEA Mobile Systems Market by Country
- 6.4.1.2 LAMEA Remote Eye Tracking Market by Country
- 6.4.1.3 LAMEA Tower-Mounted Eye Tracking Market by Country
- 6.4.2 LAMEA 3D Eye Tracking Software Market by Application
- 6.4.2.1 LAMEA Scientific Research Market by Country
- 6.4.2.2 LAMEA Marketing & User Research Market by Country
- 6.4.2.3 LAMEA Industry & Human Performance Market by Country
- 6.4.3 LAMEA 3D Eye Tracking Software Market by Industry
- 6.4.3.1 LAMEA Consumer Devices Market by Country
- 6.4.3.2 LAMEA Robotics Market by Country
- 6.4.3.3 LAMEA Automotive Market by Country
- 6.4.3.4 LAMEA Retail Market by Country
- 6.4.3.5 LAMEA Assistive Technology Solutions Market by Country
- 6.4.3.6 LAMEA Others Market by Country
- 6.4.4 LAMEA 3D Eye Tracking Software Market by Country
- 6.4.4.1 Brazil 3D Eye Tracking Software Market
- 6.4.4.1.1 Brazil 3D Eye Tracking Software Market by Type
- 6.4.4.1.2 Brazil 3D Eye Tracking Software Market by Application
- 6.4.4.1.3 Brazil 3D Eye Tracking Software Market by Industry
- 6.4.4.2 Argentina 3D Eye Tracking Software Market
- 6.4.4.2.1 Argentina 3D Eye Tracking Software Market by Type
- 6.4.4.2.2 Argentina 3D Eye Tracking Software Market by Application
- 6.4.4.2.3 Argentina 3D Eye Tracking Software Market by Industry
- 6.4.4.3 UAE 3D Eye Tracking Software Market
- 6.4.4.3.1 UAE 3D Eye Tracking Software Market by Type
- 6.4.4.3.2 UAE 3D Eye Tracking Software Market by Application
- 6.4.4.3.3 UAE 3D Eye Tracking Software Market by Industry
- 6.4.4.4 Saudi Arabia 3D Eye Tracking Software Market
- 6.4.4.4.1 Saudi Arabia 3D Eye Tracking Software Market by Type
- 6.4.4.4.2 Saudi Arabia 3D Eye Tracking Software Market by Application
- 6.4.4.4.3 Saudi Arabia 3D Eye Tracking Software Market by Industry
- 6.4.4.5 South Africa 3D Eye Tracking Software Market
- 6.4.4.5.1 South Africa 3D Eye Tracking Software Market by Type
- 6.4.4.5.2 South Africa 3D Eye Tracking Software Market by Application
- 6.4.4.5.3 South Africa 3D Eye Tracking Software Market by Industry
- 6.4.4.6 Nigeria 3D Eye Tracking Software Market
- 6.4.4.6.1 Nigeria 3D Eye Tracking Software Market by Type
- 6.4.4.6.2 Nigeria 3D Eye Tracking Software Market by Application
- 6.4.4.6.3 Nigeria 3D Eye Tracking Software Market by Industry
- 6.4.4.7 Rest of LAMEA 3D Eye Tracking Software Market
- 6.4.4.7.1 Rest of LAMEA 3D Eye Tracking Software Market by Type
- 6.4.4.7.2 Rest of LAMEA 3D Eye Tracking Software Market by Application
- 6.4.4.7.3 Rest of LAMEA 3D Eye Tracking Software Market by Industry
- 6.4.4.1 Brazil 3D Eye Tracking Software Market
- 6.4.1 LAMEA 3D Eye Tracking Software Market by Type
Chapter 7. Company Profiles
- 7.1 Tobii AB
- 7.1.1 Company Overview
- 7.1.2 Financial Analysis
- 7.1.3 Segmental and Regional Analysis
- 7.1.4 Research & Development Expenses
- 7.1.5 Recent strategies and developments:
- 7.1.5.1 Partnerships, Collaborations, and Agreements:
- 7.1.5.2 Product Launches and Product Expansions:
- 7.2 iMotions A/S (Smart Eye A/S)
- 7.2.1 Company Overview
- 7.2.2 Financial Analysis
- 7.2.3 Segmental and Regional Analysis
- 7.2.4 Research & Development Expenses
- 7.3 EyeTech Digital Systems, Inc.
- 7.3.1 Company Overview
- 7.3.2 Recent strategies and developments:
- 7.3.2.1 Product Launches and Expansions:
- 7.4 Gaze Intelligence
- 7.4.1 Company Overview
- 7.5 ParallelDots, Inc.
- 7.5.1 Company Overview
- 7.6 Eyegaze, Inc.
- 7.6.1 Company Overview
- 7.7 Pupil Labs GmbH
- 7.7.1 Company Overview
- 7.8 Gazepoint
- 7.8.1 Company Overview
- 7.9 alea technologies gmbh (IntelliGaze)
- 7.9.1 Company Overview
- 7.10. Converus, Inc.
- 7.10.1 Company Overview