|
|
市場調査レポート
商品コード
1219703
AI搭載ストレージの世界市場規模、シェア、産業動向分析レポート:コンポーネント別、ストレージアーキテクチャ別、ストレージシステム別、ストレージ媒体別、エンドユーザー別、地域別展望・予測、2022年~2028年Global AI Powered Storage Market Size, Share & Industry Trends Analysis Report By Component, By Storage Architecture, By Storage System, By Storage Medium, By End User, By Regional Outlook and Forecast, 2022 - 2028 |
||||||
|
|
|||||||


| AI搭載ストレージの世界市場規模、シェア、産業動向分析レポート:コンポーネント別、ストレージアーキテクチャ別、ストレージシステム別、ストレージ媒体別、エンドユーザー別、地域別展望・予測、2022年~2028年 |
|
出版日: 2023年01月31日
発行: KBV Research
ページ情報: 英文 386 Pages
納期: 即納可能
|
- 全表示
- 概要
- 図表
- 目次
AI搭載ストレージの世界市場規模は、2028年までに665億米ドルに達し、予測期間中にCAGR24.5%の市場成長率で上昇すると予測されています。
組織は、効果的に分類し最適化する必要がある膨大な量のデータを生成しています。このニーズが、主にAI搭載ストレージの需要を世界的に押し上げています。これに加えて、世界中のさまざまなビジネス分野で人工知能の利用が拡大していることや、クラウドベースのサービスの採用が増加していることも、今後数年間、AI搭載ストレージの世界市場の拡大にプラスに働くと思われる追加要因として作用しています。
AIは、プロセスの最適化や自動化、データ管理、システムの効率化などに頻繁に利用されるため、情報技術(IT)、ソフトウェア、医療科学、旅行、病院、小売などの分野で大きな期待が寄せられています。さらに、BFSI、通信、エンターテインメント、政府、クラウドサービスプロバイダーなどの分野でも、暗号化および潜在的なセキュリティリスクからのデータ保護を提供するため、広く利用されています。さらに、潜在的なセキュリティ脅威からも保護されます。
COVID-19インパクト分析
COVID-19の発生により、AI搭載ストレージ市場に大きなインパクトがもたらされました。COVID-19が発生してから、COVIDに最も関連するAI主導の企業や組織への投資は、非常に健全なレベルで継続されています。COVID-19の公開後、産業分野、法人企業、政府機関の技術的成長が大きく加速することが予想されました。複数の企業が、ビジネスモデルの強化やターンアラウンド率の向上を目的に、AIを搭載したストレージシステムのリアルタイムデータ保存への活用を開始しました。また、このような拡大により、AI搭載ストレージ市場には、世界中で大規模な新規投資が行われています。
市場の成長要因
クラウド上でホストされるアプリケーションやサービスの利用が増加
クラウドベースのアプリケーションやサービスの利用が増加していることは、AI搭載ストレージソリューションの市場を牽引する主要な要因の1つです。クラウド上で動作するアプリケーションは、特にCOVID-19のパンデミックの中で、商業界に大きな変化をもたらしています。AI搭載ストレージシステムを高性能コンピューティングに使用することで、企業がデータを統合し、大量の非構造化データに対処することを支援します。AI搭載ストレージの市場は、予測期間を通じて大きな成長を遂げると予想されます。
BFSI企業による人工知能と機械学習への投資の増加
BFSI企業は、顧客により良いサービスを提供し、フィンテックの管理を効率化するために、人工知能や機械学習ソフトウェアへの支出額を増やしています。さらに、BFSI業界は複雑化し競争が激しくなっているため、業界の要件に特化してカスタマイズされたソリューションのニーズが高まっています。この結果、多くの金融機関やフィンテック事業者が、顧客のニーズを満たすために人工知能ソリューションへの投資を行っています。
市場の抑制要因
パブリッククラウドにおけるネットワーク利用率やレイテンシーの問題
パブリッククラウドでは、データの保存や取り出しの際にレイテンシーが問題となる場合があります。パブリッククラウドにデータを集めると、最初から最後までネットワークを制御することができなくなり、さらに遅延も大きくなるため、アプリケーションの動作に支障をきたす可能性があります。さらに、クラウドベースのストレージのサプライヤーが同様のネットワーク問題を起こした場合、ストレージソリューションが中断される可能性があり、最終的には活動が停止して、組織に大きな財務的損失をもたらすことになります。インターネット帯域の不足、データセンターの遠距離、ネットワークトラフィックの多さも、遅延の懸念につながる3つの要因のひとつです。
コンポーネントの展望
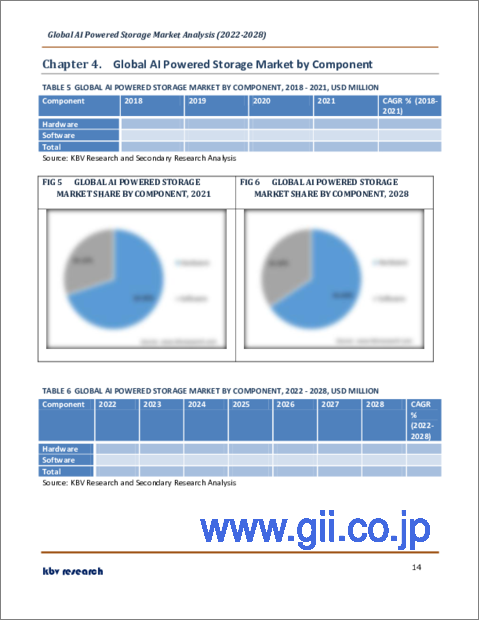
AI搭載ストレージ市場は、コンポーネントに基づいて、ハードウェアとソフトウェアに分類されます。2021年、ソフトウェア部門はAI搭載ストレージ市場で大きな収益シェアを獲得しました。これは、コストと時間を節約しながら、リスクも低減できるためで、いずれも今後数年間、業界に有利な成長と展望をもたらすと予測されます。
ストレージアーキテクチャの展望
ストレージアーキテクチャに基づき、AI搭載ストレージ市場は、ファイル&オブジェクトベースストレージおよびオブジェクトストレージに分類されます。2021年、オブジェクトストレージのセグメントは、AI搭載ストレージの市場で発生した総収入のうち、かなりの部分を占めています。オブジェクトストレージは、最も拡張性の高いストレージアーキテクチャを提供し、人工知能や機械学習に必要な膨大な量のデータを収容するのに適しています。
ストレージシステムの展望
AI搭載ストレージ市場は、ストレージシステムに基づき、直接接続型ストレージ、ネットワーク接続型ストレージ、ストレージエリアネットワークに分類されます。AI搭載ストレージ市場のストレージエリアセグメントは、2021年に実質的な収益シェアを獲得し、世界的に優位に立つに至っています。中小企業におけるストレージエリアネットワークの普及が、市場の拡大を後押ししています。これは、データストレージ機器のネットワークで、データセンターがストレージに関する共同作業をより簡単に行えるようにするものです。
ストレージ媒体の展望
ストレージ媒体に基づき、AI搭載ストレージ市場はハードディスクドライブとソリッドステートドライブに分類されます。2021年のAI搭載ストレージ市場の中で、ソリッドステートドライブセグメントはかなりの収益シェアを獲得しています。ソリッドステートフラッシュメモリに永久データを保存する不揮発性記憶媒体は、ソリッドステートドライブ(SSD)として知られています。従来のハードディスクドライブと比較して、ソリッドステートドライブ(SSD)は、より速い読み取り/書き込み速度、低い動作音レベル、および全体的に優れた性能(HDD)により、顕著な優位性を持っています。
エンドユーザーの展望
AI搭載ストレージ市場は、エンドユーザーに基づき、エンタープライズ、政府機関、クラウドサービスプロバイダー、通信事業者に分類されます。2021年のAI搭載ストレージ市場では、企業向けが最大の収益シェアを占めています。企業は、自社が生成するデータ、その価値、不要なデータの処分方法、そのデータにアクセスできる期間などを総合的に理解する必要があります。AI搭載ストレージは、さまざまなビジネスデータソースから継続的なリアルタイム更新を行い、データを最適化し、人間の入力を必要とせずにそのデータに対して他のインテリジェントな自動操作を行うことができます。
地域別の展望
地域別に、AI搭載ストレージ市場は、北米、欧州、アジア太平洋、LAMEAに分類されます。2021年、北米地域は最高の収益シェアを生み出し、AI搭載ストレージ市場を独占しました。これにより、同地域はリーダーという立場になっています。これは、この地域における技術進歩の割合の増加と市場のデジタル化により、企業が重要なデータを保存するためにAI搭載ストレージを使用するようになったことに起因すると考えられます。さらに、データストレージ市場におけるプレイヤーの実質的な存在感、認知度の向上、訓練を受けた人材の確保に加え、この地域の拡大する金融セクターでAIストレージの利用が拡大していることも拡大の要因であると思われます。
市場参入企業がとる主な戦略は、買収です。カーディナルマトリックスで提示された分析に基づき、アルファベット(Google LLC)とマイクロソフト株式会社は、AI搭載ストレージ市場の先駆者です。Amazon Web Services, Inc.(Amazon.com, Inc.), Intel Corporation, Hewlett-Packard Enterprise Companyなどの企業は、AI Powered Storage Marketの主要な革新者の一部です。
目次
第1章 市場の範囲と調査手法
- 市場の定義
- 目的
- 市場規模
- セグメンテーション
- AI搭載ストレージの世界市場、コンポーネント別
- AI搭載ストレージの世界市場、ストレージアーキテクチャ別
- AI搭載ストレージの世界市場、ストレージシステム別
- AI Powered Storageの世界市場、ストレージ媒体別
- AI搭載ストレージの世界市場:エンドユーザー別
- AI搭載ストレージの世界市場、地域別
- 調査手法
第2章 市場概要
- イントロダクション
- 概要の説明
- 市場の構成とシナリオ
- 概要の説明
- 市場に影響を与える主な要因
- 市場促進要因
- 市場の抑制要因
第3章 競合分析-世界
- KBVカーディナルマトリックス
- 最近の業界全体の戦略的展開
- パートナーシップ、コラボレーション、契約
- 製品上市と製品拡張
- 買収と合併
- 主要成功戦略
- 主要なリーディング戦略:割合の分布(2018-2022)
- 主要な戦略的動き:(買収・合併:2019年、8月~2023年、1月)主要なプレーヤーたち
第4章 AI搭載ストレージの世界市場:コンポーネント別
- 世界の地域別ハードウェア市場
- 世界のソフトウェア市場:地域別
第5章 AI搭載ストレージの世界市場:ストレージアーキテクチャ別
- ファイル&オブジェクトベースストレージの世界市場:地域別
- オブジェクトストレージの世界市場:地域別
第6章 AI搭載ストレージの世界市場:ストレージシステム別
- ダイレクトアタッチドストレージの世界市場:地域別
- ネットワークアタッチドストレージの世界市場:地域別
- ストレージエリアネットワークの世界市場:地域別
第7章 AI搭載ストレージの世界市場:ストレージ媒体別
- ハードディスクドライブの世界市場:地域別
- ソリッドステートドライブの世界市場:地域別
第8章 AI搭載ストレージの世界市場:エンドユーザー別
- 世界の地域別企業市場
- 企業タイプ別AI搭載ストレージの世界市場
- BFSIの世界市場:地域別
- 製造業の世界市場:地域別
- メディア&エンターテインメントの世界市場:地域別
- 世界のヘルスケア市場:地域別
- 消費財・小売の世界市場:地域別
- 世界のその他の市場:地域別
- クラウドサービスプロバイダーの世界市場:地域別
- 通信事業者の世界市場:地域別
- 世界のその他地域別市場
第9章 AI搭載ストレージの世界市場:地域別
- 北米
- 北米のAI搭載ストレージの国別市場
- 米国
- カナダ
- メキシコ
- その他北米地域
- 北米のAI搭載ストレージの国別市場
- 欧州
- 欧州のAI搭載ストレージ市場:国別
- ドイツ
- 英国
- フランス
- ロシア
- スペイン
- イタリア
- その他欧州
- 欧州のAI搭載ストレージ市場:国別
- アジア太平洋地域
- アジア太平洋地域のAI搭載ストレージ市場:国別
- 中国
- 日本
- インド
- 韓国
- シンガポール
- マレーシア
- その他アジア太平洋地域
- アジア太平洋地域のAI搭載ストレージ市場:国別
- LAMEA
- LAMEAのAI搭載ストレージ市場:国別
- ブラジル
- アルゼンチン
- UAE
- サウジアラビア
- 南アフリカ共和国
- ナイジェリア
- LAMEAの他の地域
- LAMEAのAI搭載ストレージ市場:国別
第10章 企業プロファイル
- IBM Corporation
- Microsoft Corporation
- Amazon Web Services, Inc.(Amazon.com, Inc.)
- Google LLC(Alphabet Inc.)
- Cisco Systems, Inc.
- Dell Technologies, Inc.
- Hewlett Packard Enterprise Company
- Intel Corporation
- NetApp, Inc.
- Lenovo Group Limited
LIST OF TABLES
- TABLE 1 Global AI Powered Storage Market, 2018 - 2021, USD Million
- TABLE 2 Global AI Powered Storage Market, 2022 - 2028, USD Million
- TABLE 3 Partnerships, Collaborations and Agreements- AI Powered Storage Market
- TABLE 4 Product Launches And Product Expansions- AI Powered Storage Market
- TABLE 5 Acquisition and Mergers- AI Powered Storage Market
- TABLE 6 Global AI Powered Storage Market by Component, 2018 - 2021, USD Million
- TABLE 7 Global AI Powered Storage Market by Component, 2022 - 2028, USD Million
- TABLE 8 Global Hardware Market by Region, 2018 - 2021, USD Million
- TABLE 9 Global Hardware Market by Region, 2022 - 2028, USD Million
- TABLE 10 Global Software Market by Region, 2018 - 2021, USD Million
- TABLE 11 Global Software Market by Region, 2022 - 2028, USD Million
- TABLE 12 Global AI Powered Storage Market by Storage Architecture, 2018 - 2021, USD Million
- TABLE 13 Global AI Powered Storage Market by Storage Architecture, 2022 - 2028, USD Million
- TABLE 14 Global File & Object Based Storage Market by Region, 2018 - 2021, USD Million
- TABLE 15 Global File & Object Based Storage Market by Region, 2022 - 2028, USD Million
- TABLE 16 Global Object Storage Market by Region, 2018 - 2021, USD Million
- TABLE 17 Global Object Storage Market by Region, 2022 - 2028, USD Million
- TABLE 18 Global AI Powered Storage Market by Storage System, 2018 - 2021, USD Million
- TABLE 19 Global AI Powered Storage Market by Storage System, 2022 - 2028, USD Million
- TABLE 20 Global Direct Attached Storage Market by Region, 2018 - 2021, USD Million
- TABLE 21 Global Direct Attached Storage Market by Region, 2022 - 2028, USD Million
- TABLE 22 Global Network Attached Storage Market by Region, 2018 - 2021, USD Million
- TABLE 23 Global Network Attached Storage Market by Region, 2022 - 2028, USD Million
- TABLE 24 Global Storage Area Network Market by Region, 2018 - 2021, USD Million
- TABLE 25 Global Storage Area Network Market by Region, 2022 - 2028, USD Million
- TABLE 26 Global AI Powered Storage Market by Storage Medium, 2018 - 2021, USD Million
- TABLE 27 Global AI Powered Storage Market by Storage Medium, 2022 - 2028, USD Million
- TABLE 28 Global Hard Disk Drive Market by Region, 2018 - 2021, USD Million
- TABLE 29 Global Hard Disk Drive Market by Region, 2022 - 2028, USD Million
- TABLE 30 Global Solid State Drive Market by Region, 2018 - 2021, USD Million
- TABLE 31 Global Solid State Drive Market by Region, 2022 - 2028, USD Million
- TABLE 32 Global AI Powered Storage Market by End User, 2018 - 2021, USD Million
- TABLE 33 Global AI Powered Storage Market by End User, 2022 - 2028, USD Million
- TABLE 34 Global Enterprises Market by Region, 2018 - 2021, USD Million
- TABLE 35 Global Enterprises Market by Region, 2022 - 2028, USD Million
- TABLE 36 Global AI Powered Storage Market by Enterprises Type, 2018 - 2021, USD Million
- TABLE 37 Global AI Powered Storage Market by Enterprises Type, 2022 - 2028, USD Million
- TABLE 38 Global BFSI Market by Region, 2018 - 2021, USD Million
- TABLE 39 Global BFSI Market by Region, 2022 - 2028, USD Million
- TABLE 40 Global Manufacturing Market by Region, 2018 - 2021, USD Million
- TABLE 41 Global Manufacturing Market by Region, 2022 - 2028, USD Million
- TABLE 42 Global Media & Entertainment Market by Region, 2018 - 2021, USD Million
- TABLE 43 Global Media & Entertainment Market by Region, 2022 - 2028, USD Million
- TABLE 44 Global Healthcare Market by Region, 2018 - 2021, USD Million
- TABLE 45 Global Healthcare Market by Region, 2022 - 2028, USD Million
- TABLE 46 Global Consumer Goods & Retail Market by Region, 2018 - 2021, USD Million
- TABLE 47 Global Consumer Goods & Retail Market by Region, 2022 - 2028, USD Million
- TABLE 48 Global Others Market by Region, 2018 - 2021, USD Million
- TABLE 49 Global Others Market by Region, 2022 - 2028, USD Million
- TABLE 50 Global Cloud Service Providers Market by Region, 2018 - 2021, USD Million
- TABLE 51 Global Cloud Service Providers Market by Region, 2022 - 2028, USD Million
- TABLE 52 Global Telecom Companies Market by Region, 2018 - 2021, USD Million
- TABLE 53 Global Telecom Companies Market by Region, 2022 - 2028, USD Million
- TABLE 54 Global Others Market by Region, 2018 - 2021, USD Million
- TABLE 55 Global Others Market by Region, 2022 - 2028, USD Million
- TABLE 56 Global AI Powered Storage Market by Region, 2018 - 2021, USD Million
- TABLE 57 Global AI Powered Storage Market by Region, 2022 - 2028, USD Million
- TABLE 58 North America AI Powered Storage Market, 2018 - 2021, USD Million
- TABLE 59 North America AI Powered Storage Market, 2022 - 2028, USD Million
- TABLE 60 North America AI Powered Storage Market by Component, 2018 - 2021, USD Million
- TABLE 61 North America AI Powered Storage Market by Component, 2022 - 2028, USD Million
- TABLE 62 North America Hardware Market by Country, 2018 - 2021, USD Million
- TABLE 63 North America Hardware Market by Country, 2022 - 2028, USD Million
- TABLE 64 North America Software Market by Country, 2018 - 2021, USD Million
- TABLE 65 North America Software Market by Country, 2022 - 2028, USD Million
- TABLE 66 North America AI Powered Storage Market by Storage Architecture, 2018 - 2021, USD Million
- TABLE 67 North America AI Powered Storage Market by Storage Architecture, 2022 - 2028, USD Million
- TABLE 68 North America File & Object Based Storage Market by Country, 2018 - 2021, USD Million
- TABLE 69 North America File & Object Based Storage Market by Country, 2022 - 2028, USD Million
- TABLE 70 North America Object Storage Market by Country, 2018 - 2021, USD Million
- TABLE 71 North America Object Storage Market by Country, 2022 - 2028, USD Million
- TABLE 72 North America AI Powered Storage Market by Storage System, 2018 - 2021, USD Million
- TABLE 73 North America AI Powered Storage Market by Storage System, 2022 - 2028, USD Million
- TABLE 74 North America Direct Attached Storage Market by Country, 2018 - 2021, USD Million
- TABLE 75 North America Direct Attached Storage Market by Country, 2022 - 2028, USD Million
- TABLE 76 North America Network Attached Storage Market by Country, 2018 - 2021, USD Million
- TABLE 77 North America Network Attached Storage Market by Country, 2022 - 2028, USD Million
- TABLE 78 North America Storage Area Network Market by Country, 2018 - 2021, USD Million
- TABLE 79 North America Storage Area Network Market by Country, 2022 - 2028, USD Million
- TABLE 80 North America AI Powered Storage Market by Storage Medium, 2018 - 2021, USD Million
- TABLE 81 North America AI Powered Storage Market by Storage Medium, 2022 - 2028, USD Million
- TABLE 82 North America Hard Disk Drive Market by Country, 2018 - 2021, USD Million
- TABLE 83 North America Hard Disk Drive Market by Country, 2022 - 2028, USD Million
- TABLE 84 North America Solid State Drive Market by Country, 2018 - 2021, USD Million
- TABLE 85 North America Solid State Drive Market by Country, 2022 - 2028, USD Million
- TABLE 86 North America AI Powered Storage Market by End User, 2018 - 2021, USD Million
- TABLE 87 North America AI Powered Storage Market by End User, 2022 - 2028, USD Million
- TABLE 88 North America Enterprises Market by Country, 2018 - 2021, USD Million
- TABLE 89 North America Enterprises Market by Country, 2022 - 2028, USD Million
- TABLE 90 North America AI Powered Storage Market by Enterprises Type, 2018 - 2021, USD Million
- TABLE 91 North America AI Powered Storage Market by Enterprises Type, 2022 - 2028, USD Million
- TABLE 92 North America BFSI Market by Country, 2018 - 2021, USD Million
- TABLE 93 North America BFSI Market by Country, 2022 - 2028, USD Million
- TABLE 94 North America Manufacturing Market by Country, 2018 - 2021, USD Million
- TABLE 95 North America Manufacturing Market by Country, 2022 - 2028, USD Million
- TABLE 96 North America Media & Entertainment Market by Country, 2018 - 2021, USD Million
- TABLE 97 North America Media & Entertainment Market by Country, 2022 - 2028, USD Million
- TABLE 98 North America Healthcare Market by Country, 2018 - 2021, USD Million
- TABLE 99 North America Healthcare Market by Country, 2022 - 2028, USD Million
- TABLE 100 North America Consumer Goods & Retail Market by Country, 2018 - 2021, USD Million
- TABLE 101 North America Consumer Goods & Retail Market by Country, 2022 - 2028, USD Million
- TABLE 102 North America Others Market by Country, 2018 - 2021, USD Million
- TABLE 103 North America Others Market by Country, 2022 - 2028, USD Million
- TABLE 104 North America Cloud Service Providers Market by Country, 2018 - 2021, USD Million
- TABLE 105 North America Cloud Service Providers Market by Country, 2022 - 2028, USD Million
- TABLE 106 North America Telecom Companies Market by Country, 2018 - 2021, USD Million
- TABLE 107 North America Telecom Companies Market by Country, 2022 - 2028, USD Million
- TABLE 108 North America Others Market by Country, 2018 - 2021, USD Million
- TABLE 109 North America Others Market by Country, 2022 - 2028, USD Million
- TABLE 110 North America AI Powered Storage Market by Country, 2018 - 2021, USD Million
- TABLE 111 North America AI Powered Storage Market by Country, 2022 - 2028, USD Million
- TABLE 112 US AI Powered Storage Market, 2018 - 2021, USD Million
- TABLE 113 US AI Powered Storage Market, 2022 - 2028, USD Million
- TABLE 114 US AI Powered Storage Market by Component, 2018 - 2021, USD Million
- TABLE 115 US AI Powered Storage Market by Component, 2022 - 2028, USD Million
- TABLE 116 US AI Powered Storage Market by Storage Architecture, 2018 - 2021, USD Million
- TABLE 117 US AI Powered Storage Market by Storage Architecture, 2022 - 2028, USD Million
- TABLE 118 US AI Powered Storage Market by Storage System, 2018 - 2021, USD Million
- TABLE 119 US AI Powered Storage Market by Storage System, 2022 - 2028, USD Million
- TABLE 120 US AI Powered Storage Market by Storage Medium, 2018 - 2021, USD Million
- TABLE 121 US AI Powered Storage Market by Storage Medium, 2022 - 2028, USD Million
- TABLE 122 US AI Powered Storage Market by End User, 2018 - 2021, USD Million
- TABLE 123 US AI Powered Storage Market by End User, 2022 - 2028, USD Million
- TABLE 124 US AI Powered Storage Market by Enterprises Type, 2018 - 2021, USD Million
- TABLE 125 US AI Powered Storage Market by Enterprises Type, 2022 - 2028, USD Million
- TABLE 126 Canada AI Powered Storage Market, 2018 - 2021, USD Million
- TABLE 127 Canada AI Powered Storage Market, 2022 - 2028, USD Million
- TABLE 128 Canada AI Powered Storage Market by Component, 2018 - 2021, USD Million
- TABLE 129 Canada AI Powered Storage Market by Component, 2022 - 2028, USD Million
- TABLE 130 Canada AI Powered Storage Market by Storage Architecture, 2018 - 2021, USD Million
- TABLE 131 Canada AI Powered Storage Market by Storage Architecture, 2022 - 2028, USD Million
- TABLE 132 Canada AI Powered Storage Market by Storage System, 2018 - 2021, USD Million
- TABLE 133 Canada AI Powered Storage Market by Storage System, 2022 - 2028, USD Million
- TABLE 134 Canada AI Powered Storage Market by Storage Medium, 2018 - 2021, USD Million
- TABLE 135 Canada AI Powered Storage Market by Storage Medium, 2022 - 2028, USD Million
- TABLE 136 Canada AI Powered Storage Market by End User, 2018 - 2021, USD Million
- TABLE 137 Canada AI Powered Storage Market by End User, 2022 - 2028, USD Million
- TABLE 138 Canada AI Powered Storage Market by Enterprises Type, 2018 - 2021, USD Million
- TABLE 139 Canada AI Powered Storage Market by Enterprises Type, 2022 - 2028, USD Million
- TABLE 140 Mexico AI Powered Storage Market, 2018 - 2021, USD Million
- TABLE 141 Mexico AI Powered Storage Market, 2022 - 2028, USD Million
- TABLE 142 Mexico AI Powered Storage Market by Component, 2018 - 2021, USD Million
- TABLE 143 Mexico AI Powered Storage Market by Component, 2022 - 2028, USD Million
- TABLE 144 Mexico AI Powered Storage Market by Storage Architecture, 2018 - 2021, USD Million
- TABLE 145 Mexico AI Powered Storage Market by Storage Architecture, 2022 - 2028, USD Million
- TABLE 146 Mexico AI Powered Storage Market by Storage System, 2018 - 2021, USD Million
- TABLE 147 Mexico AI Powered Storage Market by Storage System, 2022 - 2028, USD Million
- TABLE 148 Mexico AI Powered Storage Market by Storage Medium, 2018 - 2021, USD Million
- TABLE 149 Mexico AI Powered Storage Market by Storage Medium, 2022 - 2028, USD Million
- TABLE 150 Mexico AI Powered Storage Market by End User, 2018 - 2021, USD Million
- TABLE 151 Mexico AI Powered Storage Market by End User, 2022 - 2028, USD Million
- TABLE 152 Mexico AI Powered Storage Market by Enterprises Type, 2018 - 2021, USD Million
- TABLE 153 Mexico AI Powered Storage Market by Enterprises Type, 2022 - 2028, USD Million
- TABLE 154 Rest of North America AI Powered Storage Market, 2018 - 2021, USD Million
- TABLE 155 Rest of North America AI Powered Storage Market, 2022 - 2028, USD Million
- TABLE 156 Rest of North America AI Powered Storage Market by Component, 2018 - 2021, USD Million
- TABLE 157 Rest of North America AI Powered Storage Market by Component, 2022 - 2028, USD Million
- TABLE 158 Rest of North America AI Powered Storage Market by Storage Architecture, 2018 - 2021, USD Million
- TABLE 159 Rest of North America AI Powered Storage Market by Storage Architecture, 2022 - 2028, USD Million
- TABLE 160 Rest of North America AI Powered Storage Market by Storage System, 2018 - 2021, USD Million
- TABLE 161 Rest of North America AI Powered Storage Market by Storage System, 2022 - 2028, USD Million
- TABLE 162 Rest of North America AI Powered Storage Market by Storage Medium, 2018 - 2021, USD Million
- TABLE 163 Rest of North America AI Powered Storage Market by Storage Medium, 2022 - 2028, USD Million
- TABLE 164 Rest of North America AI Powered Storage Market by End User, 2018 - 2021, USD Million
- TABLE 165 Rest of North America AI Powered Storage Market by End User, 2022 - 2028, USD Million
- TABLE 166 Rest of North America AI Powered Storage Market by Enterprises Type, 2018 - 2021, USD Million
- TABLE 167 Rest of North America AI Powered Storage Market by Enterprises Type, 2022 - 2028, USD Million
- TABLE 168 Europe AI Powered Storage Market, 2018 - 2021, USD Million
- TABLE 169 Europe AI Powered Storage Market, 2022 - 2028, USD Million
- TABLE 170 Europe AI Powered Storage Market by Component, 2018 - 2021, USD Million
- TABLE 171 Europe AI Powered Storage Market by Component, 2022 - 2028, USD Million
- TABLE 172 Europe Hardware Market by Country, 2018 - 2021, USD Million
- TABLE 173 Europe Hardware Market by Country, 2022 - 2028, USD Million
- TABLE 174 Europe Software Market by Country, 2018 - 2021, USD Million
- TABLE 175 Europe Software Market by Country, 2022 - 2028, USD Million
- TABLE 176 Europe AI Powered Storage Market by Storage Architecture, 2018 - 2021, USD Million
- TABLE 177 Europe AI Powered Storage Market by Storage Architecture, 2022 - 2028, USD Million
- TABLE 178 Europe File & Object Based Storage Market by Country, 2018 - 2021, USD Million
- TABLE 179 Europe File & Object Based Storage Market by Country, 2022 - 2028, USD Million
- TABLE 180 Europe Object Storage Market by Country, 2018 - 2021, USD Million
- TABLE 181 Europe Object Storage Market by Country, 2022 - 2028, USD Million
- TABLE 182 Europe AI Powered Storage Market by Storage System, 2018 - 2021, USD Million
- TABLE 183 Europe AI Powered Storage Market by Storage System, 2022 - 2028, USD Million
- TABLE 184 Europe Direct Attached Storage Market by Country, 2018 - 2021, USD Million
- TABLE 185 Europe Direct Attached Storage Market by Country, 2022 - 2028, USD Million
- TABLE 186 Europe Network Attached Storage Market by Country, 2018 - 2021, USD Million
- TABLE 187 Europe Network Attached Storage Market by Country, 2022 - 2028, USD Million
- TABLE 188 Europe Storage Area Network Market by Country, 2018 - 2021, USD Million
- TABLE 189 Europe Storage Area Network Market by Country, 2022 - 2028, USD Million
- TABLE 190 Europe AI Powered Storage Market by Storage Medium, 2018 - 2021, USD Million
- TABLE 191 Europe AI Powered Storage Market by Storage Medium, 2022 - 2028, USD Million
- TABLE 192 Europe Hard Disk Drive Market by Country, 2018 - 2021, USD Million
- TABLE 193 Europe Hard Disk Drive Market by Country, 2022 - 2028, USD Million
- TABLE 194 Europe Solid State Drive Market by Country, 2018 - 2021, USD Million
- TABLE 195 Europe Solid State Drive Market by Country, 2022 - 2028, USD Million
- TABLE 196 Europe AI Powered Storage Market by End User, 2018 - 2021, USD Million
- TABLE 197 Europe AI Powered Storage Market by End User, 2022 - 2028, USD Million
- TABLE 198 Europe Enterprises Market by Country, 2018 - 2021, USD Million
- TABLE 199 Europe Enterprises Market by Country, 2022 - 2028, USD Million
- TABLE 200 Europe AI Powered Storage Market by Enterprises Type, 2018 - 2021, USD Million
- TABLE 201 Europe AI Powered Storage Market by Enterprises Type, 2022 - 2028, USD Million
- TABLE 202 Europe BFSI Market by Country, 2018 - 2021, USD Million
- TABLE 203 Europe BFSI Market by Country, 2022 - 2028, USD Million
- TABLE 204 Europe Manufacturing Market by Country, 2018 - 2021, USD Million
- TABLE 205 Europe Manufacturing Market by Country, 2022 - 2028, USD Million
- TABLE 206 Europe Media & Entertainment Market by Country, 2018 - 2021, USD Million
- TABLE 207 Europe Media & Entertainment Market by Country, 2022 - 2028, USD Million
- TABLE 208 Europe Healthcare Market by Country, 2018 - 2021, USD Million
- TABLE 209 Europe Healthcare Market by Country, 2022 - 2028, USD Million
- TABLE 210 Europe Consumer Goods & Retail Market by Country, 2018 - 2021, USD Million
- TABLE 211 Europe Consumer Goods & Retail Market by Country, 2022 - 2028, USD Million
- TABLE 212 Europe Others Market by Country, 2018 - 2021, USD Million
- TABLE 213 Europe Others Market by Country, 2022 - 2028, USD Million
- TABLE 214 Europe Cloud Service Providers Market by Country, 2018 - 2021, USD Million
- TABLE 215 Europe Cloud Service Providers Market by Country, 2022 - 2028, USD Million
- TABLE 216 Europe Telecom Companies Market by Country, 2018 - 2021, USD Million
- TABLE 217 Europe Telecom Companies Market by Country, 2022 - 2028, USD Million
- TABLE 218 Europe Others Market by Country, 2018 - 2021, USD Million
- TABLE 219 Europe Others Market by Country, 2022 - 2028, USD Million
- TABLE 220 Europe AI Powered Storage Market by Country, 2018 - 2021, USD Million
- TABLE 221 Europe AI Powered Storage Market by Country, 2022 - 2028, USD Million
- TABLE 222 Germany AI Powered Storage Market, 2018 - 2021, USD Million
- TABLE 223 Germany AI Powered Storage Market, 2022 - 2028, USD Million
- TABLE 224 Germany AI Powered Storage Market by Component, 2018 - 2021, USD Million
- TABLE 225 Germany AI Powered Storage Market by Component, 2022 - 2028, USD Million
- TABLE 226 Germany AI Powered Storage Market by Storage Architecture, 2018 - 2021, USD Million
- TABLE 227 Germany AI Powered Storage Market by Storage Architecture, 2022 - 2028, USD Million
- TABLE 228 Germany AI Powered Storage Market by Storage System, 2018 - 2021, USD Million
- TABLE 229 Germany AI Powered Storage Market by Storage System, 2022 - 2028, USD Million
- TABLE 230 Germany AI Powered Storage Market by Storage Medium, 2018 - 2021, USD Million
- TABLE 231 Germany AI Powered Storage Market by Storage Medium, 2022 - 2028, USD Million
- TABLE 232 Germany AI Powered Storage Market by End User, 2018 - 2021, USD Million
- TABLE 233 Germany AI Powered Storage Market by End User, 2022 - 2028, USD Million
- TABLE 234 Germany AI Powered Storage Market by Enterprises Type, 2018 - 2021, USD Million
- TABLE 235 Germany AI Powered Storage Market by Enterprises Type, 2022 - 2028, USD Million
- TABLE 236 UK AI Powered Storage Market, 2018 - 2021, USD Million
- TABLE 237 UK AI Powered Storage Market, 2022 - 2028, USD Million
- TABLE 238 UK AI Powered Storage Market by Component, 2018 - 2021, USD Million
- TABLE 239 UK AI Powered Storage Market by Component, 2022 - 2028, USD Million
- TABLE 240 UK AI Powered Storage Market by Storage Architecture, 2018 - 2021, USD Million
- TABLE 241 UK AI Powered Storage Market by Storage Architecture, 2022 - 2028, USD Million
- TABLE 242 UK AI Powered Storage Market by Storage System, 2018 - 2021, USD Million
- TABLE 243 UK AI Powered Storage Market by Storage System, 2022 - 2028, USD Million
- TABLE 244 UK AI Powered Storage Market by Storage Medium, 2018 - 2021, USD Million
- TABLE 245 UK AI Powered Storage Market by Storage Medium, 2022 - 2028, USD Million
- TABLE 246 UK AI Powered Storage Market by End User, 2018 - 2021, USD Million
- TABLE 247 UK AI Powered Storage Market by End User, 2022 - 2028, USD Million
- TABLE 248 UK AI Powered Storage Market by Enterprises Type, 2018 - 2021, USD Million
- TABLE 249 UK AI Powered Storage Market by Enterprises Type, 2022 - 2028, USD Million
- TABLE 250 France AI Powered Storage Market, 2018 - 2021, USD Million
- TABLE 251 France AI Powered Storage Market, 2022 - 2028, USD Million
- TABLE 252 France AI Powered Storage Market by Component, 2018 - 2021, USD Million
- TABLE 253 France AI Powered Storage Market by Component, 2022 - 2028, USD Million
- TABLE 254 France AI Powered Storage Market by Storage Architecture, 2018 - 2021, USD Million
- TABLE 255 France AI Powered Storage Market by Storage Architecture, 2022 - 2028, USD Million
- TABLE 256 France AI Powered Storage Market by Storage System, 2018 - 2021, USD Million
- TABLE 257 France AI Powered Storage Market by Storage System, 2022 - 2028, USD Million
- TABLE 258 France AI Powered Storage Market by Storage Medium, 2018 - 2021, USD Million
- TABLE 259 France AI Powered Storage Market by Storage Medium, 2022 - 2028, USD Million
- TABLE 260 France AI Powered Storage Market by End User, 2018 - 2021, USD Million
- TABLE 261 France AI Powered Storage Market by End User, 2022 - 2028, USD Million
- TABLE 262 France AI Powered Storage Market by Enterprises Type, 2018 - 2021, USD Million
- TABLE 263 France AI Powered Storage Market by Enterprises Type, 2022 - 2028, USD Million
- TABLE 264 Russia AI Powered Storage Market, 2018 - 2021, USD Million
- TABLE 265 Russia AI Powered Storage Market, 2022 - 2028, USD Million
- TABLE 266 Russia AI Powered Storage Market by Component, 2018 - 2021, USD Million
- TABLE 267 Russia AI Powered Storage Market by Component, 2022 - 2028, USD Million
- TABLE 268 Russia AI Powered Storage Market by Storage Architecture, 2018 - 2021, USD Million
- TABLE 269 Russia AI Powered Storage Market by Storage Architecture, 2022 - 2028, USD Million
- TABLE 270 Russia AI Powered Storage Market by Storage System, 2018 - 2021, USD Million
- TABLE 271 Russia AI Powered Storage Market by Storage System, 2022 - 2028, USD Million
- TABLE 272 Russia AI Powered Storage Market by Storage Medium, 2018 - 2021, USD Million
- TABLE 273 Russia AI Powered Storage Market by Storage Medium, 2022 - 2028, USD Million
- TABLE 274 Russia AI Powered Storage Market by End User, 2018 - 2021, USD Million
- TABLE 275 Russia AI Powered Storage Market by End User, 2022 - 2028, USD Million
- TABLE 276 Russia AI Powered Storage Market by Enterprises Type, 2018 - 2021, USD Million
- TABLE 277 Russia AI Powered Storage Market by Enterprises Type, 2022 - 2028, USD Million
- TABLE 278 Spain AI Powered Storage Market, 2018 - 2021, USD Million
- TABLE 279 Spain AI Powered Storage Market, 2022 - 2028, USD Million
- TABLE 280 Spain AI Powered Storage Market by Component, 2018 - 2021, USD Million
- TABLE 281 Spain AI Powered Storage Market by Component, 2022 - 2028, USD Million
- TABLE 282 Spain AI Powered Storage Market by Storage Architecture, 2018 - 2021, USD Million
- TABLE 283 Spain AI Powered Storage Market by Storage Architecture, 2022 - 2028, USD Million
- TABLE 284 Spain AI Powered Storage Market by Storage System, 2018 - 2021, USD Million
- TABLE 285 Spain AI Powered Storage Market by Storage System, 2022 - 2028, USD Million
- TABLE 286 Spain AI Powered Storage Market by Storage Medium, 2018 - 2021, USD Million
- TABLE 287 Spain AI Powered Storage Market by Storage Medium, 2022 - 2028, USD Million
- TABLE 288 Spain AI Powered Storage Market by End User, 2018 - 2021, USD Million
- TABLE 289 Spain AI Powered Storage Market by End User, 2022 - 2028, USD Million
- TABLE 290 Spain AI Powered Storage Market by Enterprises Type, 2018 - 2021, USD Million
- TABLE 291 Spain AI Powered Storage Market by Enterprises Type, 2022 - 2028, USD Million
- TABLE 292 Italy AI Powered Storage Market, 2018 - 2021, USD Million
- TABLE 293 Italy AI Powered Storage Market, 2022 - 2028, USD Million
- TABLE 294 Italy AI Powered Storage Market by Component, 2018 - 2021, USD Million
- TABLE 295 Italy AI Powered Storage Market by Component, 2022 - 2028, USD Million
- TABLE 296 Italy AI Powered Storage Market by Storage Architecture, 2018 - 2021, USD Million
- TABLE 297 Italy AI Powered Storage Market by Storage Architecture, 2022 - 2028, USD Million
- TABLE 298 Italy AI Powered Storage Market by Storage System, 2018 - 2021, USD Million
- TABLE 299 Italy AI Powered Storage Market by Storage System, 2022 - 2028, USD Million
- TABLE 300 Italy AI Powered Storage Market by Storage Medium, 2018 - 2021, USD Million
- TABLE 301 Italy AI Powered Storage Market by Storage Medium, 2022 - 2028, USD Million
- TABLE 302 Italy AI Powered Storage Market by End User, 2018 - 2021, USD Million
- TABLE 303 Italy AI Powered Storage Market by End User, 2022 - 2028, USD Million
- TABLE 304 Italy AI Powered Storage Market by Enterprises Type, 2018 - 2021, USD Million
- TABLE 305 Italy AI Powered Storage Market by Enterprises Type, 2022 - 2028, USD Million
- TABLE 306 Rest of Europe AI Powered Storage Market, 2018 - 2021, USD Million
- TABLE 307 Rest of Europe AI Powered Storage Market, 2022 - 2028, USD Million
- TABLE 308 Rest of Europe AI Powered Storage Market by Component, 2018 - 2021, USD Million
- TABLE 309 Rest of Europe AI Powered Storage Market by Component, 2022 - 2028, USD Million
- TABLE 310 Rest of Europe AI Powered Storage Market by Storage Architecture, 2018 - 2021, USD Million
- TABLE 311 Rest of Europe AI Powered Storage Market by Storage Architecture, 2022 - 2028, USD Million
- TABLE 312 Rest of Europe AI Powered Storage Market by Storage System, 2018 - 2021, USD Million
- TABLE 313 Rest of Europe AI Powered Storage Market by Storage System, 2022 - 2028, USD Million
- TABLE 314 Rest of Europe AI Powered Storage Market by Storage Medium, 2018 - 2021, USD Million
- TABLE 315 Rest of Europe AI Powered Storage Market by Storage Medium, 2022 - 2028, USD Million
- TABLE 316 Rest of Europe AI Powered Storage Market by End User, 2018 - 2021, USD Million
- TABLE 317 Rest of Europe AI Powered Storage Market by End User, 2022 - 2028, USD Million
- TABLE 318 Rest of Europe AI Powered Storage Market by Enterprises Type, 2018 - 2021, USD Million
- TABLE 319 Rest of Europe AI Powered Storage Market by Enterprises Type, 2022 - 2028, USD Million
- TABLE 320 Asia Pacific AI Powered Storage Market, 2018 - 2021, USD Million
- TABLE 321 Asia Pacific AI Powered Storage Market, 2022 - 2028, USD Million
- TABLE 322 Asia Pacific AI Powered Storage Market by Component, 2018 - 2021, USD Million
- TABLE 323 Asia Pacific AI Powered Storage Market by Component, 2022 - 2028, USD Million
- TABLE 324 Asia Pacific Hardware Market by Country, 2018 - 2021, USD Million
- TABLE 325 Asia Pacific Hardware Market by Country, 2022 - 2028, USD Million
- TABLE 326 Asia Pacific Software Market by Country, 2018 - 2021, USD Million
- TABLE 327 Asia Pacific Software Market by Country, 2022 - 2028, USD Million
- TABLE 328 Asia Pacific AI Powered Storage Market by Storage Architecture, 2018 - 2021, USD Million
- TABLE 329 Asia Pacific AI Powered Storage Market by Storage Architecture, 2022 - 2028, USD Million
- TABLE 330 Asia Pacific File & Object Based Storage Market by Country, 2018 - 2021, USD Million
- TABLE 331 Asia Pacific File & Object Based Storage Market by Country, 2022 - 2028, USD Million
- TABLE 332 Asia Pacific Object Storage Market by Country, 2018 - 2021, USD Million
- TABLE 333 Asia Pacific Object Storage Market by Country, 2022 - 2028, USD Million
- TABLE 334 Asia Pacific AI Powered Storage Market by Storage System, 2018 - 2021, USD Million
- TABLE 335 Asia Pacific AI Powered Storage Market by Storage System, 2022 - 2028, USD Million
- TABLE 336 Asia Pacific Direct Attached Storage Market by Country, 2018 - 2021, USD Million
- TABLE 337 Asia Pacific Direct Attached Storage Market by Country, 2022 - 2028, USD Million
- TABLE 338 Asia Pacific Network Attached Storage Market by Country, 2018 - 2021, USD Million
- TABLE 339 Asia Pacific Network Attached Storage Market by Country, 2022 - 2028, USD Million
- TABLE 340 Asia Pacific Storage Area Network Market by Country, 2018 - 2021, USD Million
- TABLE 341 Asia Pacific Storage Area Network Market by Country, 2022 - 2028, USD Million
- TABLE 342 Asia Pacific AI Powered Storage Market by Storage Medium, 2018 - 2021, USD Million
- TABLE 343 Asia Pacific AI Powered Storage Market by Storage Medium, 2022 - 2028, USD Million
- TABLE 344 Asia Pacific Hard Disk Drive Market by Country, 2018 - 2021, USD Million
- TABLE 345 Asia Pacific Hard Disk Drive Market by Country, 2022 - 2028, USD Million
- TABLE 346 Asia Pacific Solid State Drive Market by Country, 2018 - 2021, USD Million
- TABLE 347 Asia Pacific Solid State Drive Market by Country, 2022 - 2028, USD Million
- TABLE 348 Asia Pacific AI Powered Storage Market by End User, 2018 - 2021, USD Million
- TABLE 349 Asia Pacific AI Powered Storage Market by End User, 2022 - 2028, USD Million
- TABLE 350 Asia Pacific Enterprises Market by Country, 2018 - 2021, USD Million
- TABLE 351 Asia Pacific Enterprises Market by Country, 2022 - 2028, USD Million
- TABLE 352 Asia Pacific AI Powered Storage Market by Enterprises Type, 2018 - 2021, USD Million
- TABLE 353 Asia Pacific AI Powered Storage Market by Enterprises Type, 2022 - 2028, USD Million
- TABLE 354 Asia Pacific BFSI Market by Country, 2018 - 2021, USD Million
- TABLE 355 Asia Pacific BFSI Market by Country, 2022 - 2028, USD Million
- TABLE 356 Asia Pacific Manufacturing Market by Country, 2018 - 2021, USD Million
- TABLE 357 Asia Pacific Manufacturing Market by Country, 2022 - 2028, USD Million
- TABLE 358 Asia Pacific Media & Entertainment Market by Country, 2018 - 2021, USD Million
- TABLE 359 Asia Pacific Media & Entertainment Market by Country, 2022 - 2028, USD Million
- TABLE 360 Asia Pacific Healthcare Market by Country, 2018 - 2021, USD Million
- TABLE 361 Asia Pacific Healthcare Market by Country, 2022 - 2028, USD Million
- TABLE 362 Asia Pacific Consumer Goods & Retail Market by Country, 2018 - 2021, USD Million
- TABLE 363 Asia Pacific Consumer Goods & Retail Market by Country, 2022 - 2028, USD Million
- TABLE 364 Asia Pacific Others Market by Country, 2018 - 2021, USD Million
- TABLE 365 Asia Pacific Others Market by Country, 2022 - 2028, USD Million
- TABLE 366 Asia Pacific Cloud Service Providers Market by Country, 2018 - 2021, USD Million
- TABLE 367 Asia Pacific Cloud Service Providers Market by Country, 2022 - 2028, USD Million
- TABLE 368 Asia Pacific Telecom Companies Market by Country, 2018 - 2021, USD Million
- TABLE 369 Asia Pacific Telecom Companies Market by Country, 2022 - 2028, USD Million
- TABLE 370 Asia Pacific Others Market by Country, 2018 - 2021, USD Million
- TABLE 371 Asia Pacific Others Market by Country, 2022 - 2028, USD Million
- TABLE 372 Asia Pacific AI Powered Storage Market by Country, 2018 - 2021, USD Million
- TABLE 373 Asia Pacific AI Powered Storage Market by Country, 2022 - 2028, USD Million
- TABLE 374 China AI Powered Storage Market, 2018 - 2021, USD Million
- TABLE 375 China AI Powered Storage Market, 2022 - 2028, USD Million
- TABLE 376 China AI Powered Storage Market by Component, 2018 - 2021, USD Million
- TABLE 377 China AI Powered Storage Market by Component, 2022 - 2028, USD Million
- TABLE 378 China AI Powered Storage Market by Storage Architecture, 2018 - 2021, USD Million
- TABLE 379 China AI Powered Storage Market by Storage Architecture, 2022 - 2028, USD Million
- TABLE 380 China AI Powered Storage Market by Storage System, 2018 - 2021, USD Million
- TABLE 381 China AI Powered Storage Market by Storage System, 2022 - 2028, USD Million
- TABLE 382 China AI Powered Storage Market by Storage Medium, 2018 - 2021, USD Million
- TABLE 383 China AI Powered Storage Market by Storage Medium, 2022 - 2028, USD Million
- TABLE 384 China AI Powered Storage Market by End User, 2018 - 2021, USD Million
- TABLE 385 China AI Powered Storage Market by End User, 2022 - 2028, USD Million
- TABLE 386 China AI Powered Storage Market by Enterprises Type, 2018 - 2021, USD Million
- TABLE 387 China AI Powered Storage Market by Enterprises Type, 2022 - 2028, USD Million
- TABLE 388 Japan AI Powered Storage Market, 2018 - 2021, USD Million
- TABLE 389 Japan AI Powered Storage Market, 2022 - 2028, USD Million
- TABLE 390 Japan AI Powered Storage Market by Component, 2018 - 2021, USD Million
- TABLE 391 Japan AI Powered Storage Market by Component, 2022 - 2028, USD Million
- TABLE 392 Japan AI Powered Storage Market by Storage Architecture, 2018 - 2021, USD Million
- TABLE 393 Japan AI Powered Storage Market by Storage Architecture, 2022 - 2028, USD Million
- TABLE 394 Japan AI Powered Storage Market by Storage System, 2018 - 2021, USD Million
- TABLE 395 Japan AI Powered Storage Market by Storage System, 2022 - 2028, USD Million
- TABLE 396 Japan AI Powered Storage Market by Storage Medium, 2018 - 2021, USD Million
- TABLE 397 Japan AI Powered Storage Market by Storage Medium, 2022 - 2028, USD Million
- TABLE 398 Japan AI Powered Storage Market by End User, 2018 - 2021, USD Million
- TABLE 399 Japan AI Powered Storage Market by End User, 2022 - 2028, USD Million
- TABLE 400 Japan AI Powered Storage Market by Enterprises Type, 2018 - 2021, USD Million
- TABLE 401 Japan AI Powered Storage Market by Enterprises Type, 2022 - 2028, USD Million
- TABLE 402 India AI Powered Storage Market, 2018 - 2021, USD Million
- TABLE 403 India AI Powered Storage Market, 2022 - 2028, USD Million
- TABLE 404 India AI Powered Storage Market by Component, 2018 - 2021, USD Million
- TABLE 405 India AI Powered Storage Market by Component, 2022 - 2028, USD Million
- TABLE 406 India AI Powered Storage Market by Storage Architecture, 2018 - 2021, USD Million
- TABLE 407 India AI Powered Storage Market by Storage Architecture, 2022 - 2028, USD Million
- TABLE 408 India AI Powered Storage Market by Storage System, 2018 - 2021, USD Million
- TABLE 409 India AI Powered Storage Market by Storage System, 2022 - 2028, USD Million
- TABLE 410 India AI Powered Storage Market by Storage Medium, 2018 - 2021, USD Million
- TABLE 411 India AI Powered Storage Market by Storage Medium, 2022 - 2028, USD Million
- TABLE 412 India AI Powered Storage Market by End User, 2018 - 2021, USD Million
- TABLE 413 India AI Powered Storage Market by End User, 2022 - 2028, USD Million
- TABLE 414 India AI Powered Storage Market by Enterprises Type, 2018 - 2021, USD Million
- TABLE 415 India AI Powered Storage Market by Enterprises Type, 2022 - 2028, USD Million
- TABLE 416 South Korea AI Powered Storage Market, 2018 - 2021, USD Million
- TABLE 417 South Korea AI Powered Storage Market, 2022 - 2028, USD Million
- TABLE 418 South Korea AI Powered Storage Market by Component, 2018 - 2021, USD Million
- TABLE 419 South Korea AI Powered Storage Market by Component, 2022 - 2028, USD Million
- TABLE 420 South Korea AI Powered Storage Market by Storage Architecture, 2018 - 2021, USD Million
- TABLE 421 South Korea AI Powered Storage Market by Storage Architecture, 2022 - 2028, USD Million
- TABLE 422 South Korea AI Powered Storage Market by Storage System, 2018 - 2021, USD Million
- TABLE 423 South Korea AI Powered Storage Market by Storage System, 2022 - 2028, USD Million
- TABLE 424 South Korea AI Powered Storage Market by Storage Medium, 2018 - 2021, USD Million
- TABLE 425 South Korea AI Powered Storage Market by Storage Medium, 2022 - 2028, USD Million
- TABLE 426 South Korea AI Powered Storage Market by End User, 2018 - 2021, USD Million
- TABLE 427 South Korea AI Powered Storage Market by End User, 2022 - 2028, USD Million
- TABLE 428 South Korea AI Powered Storage Market by Enterprises Type, 2018 - 2021, USD Million
- TABLE 429 South Korea AI Powered Storage Market by Enterprises Type, 2022 - 2028, USD Million
- TABLE 430 Singapore AI Powered Storage Market, 2018 - 2021, USD Million
- TABLE 431 Singapore AI Powered Storage Market, 2022 - 2028, USD Million
- TABLE 432 Singapore AI Powered Storage Market by Component, 2018 - 2021, USD Million
- TABLE 433 Singapore AI Powered Storage Market by Component, 2022 - 2028, USD Million
- TABLE 434 Singapore AI Powered Storage Market by Storage Architecture, 2018 - 2021, USD Million
- TABLE 435 Singapore AI Powered Storage Market by Storage Architecture, 2022 - 2028, USD Million
- TABLE 436 Singapore AI Powered Storage Market by Storage System, 2018 - 2021, USD Million
- TABLE 437 Singapore AI Powered Storage Market by Storage System, 2022 - 2028, USD Million
- TABLE 438 Singapore AI Powered Storage Market by Storage Medium, 2018 - 2021, USD Million
- TABLE 439 Singapore AI Powered Storage Market by Storage Medium, 2022 - 2028, USD Million
- TABLE 440 Singapore AI Powered Storage Market by End User, 2018 - 2021, USD Million
- TABLE 441 Singapore AI Powered Storage Market by End User, 2022 - 2028, USD Million
- TABLE 442 Singapore AI Powered Storage Market by Enterprises Type, 2018 - 2021, USD Million
- TABLE 443 Singapore AI Powered Storage Market by Enterprises Type, 2022 - 2028, USD Million
- TABLE 444 Malaysia AI Powered Storage Market, 2018 - 2021, USD Million
- TABLE 445 Malaysia AI Powered Storage Market, 2022 - 2028, USD Million
- TABLE 446 Malaysia AI Powered Storage Market by Component, 2018 - 2021, USD Million
- TABLE 447 Malaysia AI Powered Storage Market by Component, 2022 - 2028, USD Million
- TABLE 448 Malaysia AI Powered Storage Market by Storage Architecture, 2018 - 2021, USD Million
- TABLE 449 Malaysia AI Powered Storage Market by Storage Architecture, 2022 - 2028, USD Million
- TABLE 450 Malaysia AI Powered Storage Market by Storage System, 2018 - 2021, USD Million
- TABLE 451 Malaysia AI Powered Storage Market by Storage System, 2022 - 2028, USD Million
- TABLE 452 Malaysia AI Powered Storage Market by Storage Medium, 2018 - 2021, USD Million
- TABLE 453 Malaysia AI Powered Storage Market by Storage Medium, 2022 - 2028, USD Million
- TABLE 454 Malaysia AI Powered Storage Market by End User, 2018 - 2021, USD Million
- TABLE 455 Malaysia AI Powered Storage Market by End User, 2022 - 2028, USD Million
- TABLE 456 Malaysia AI Powered Storage Market by Enterprises Type, 2018 - 2021, USD Million
- TABLE 457 Malaysia AI Powered Storage Market by Enterprises Type, 2022 - 2028, USD Million
- TABLE 458 Rest of Asia Pacific AI Powered Storage Market, 2018 - 2021, USD Million
- TABLE 459 Rest of Asia Pacific AI Powered Storage Market, 2022 - 2028, USD Million
- TABLE 460 Rest of Asia Pacific AI Powered Storage Market by Component, 2018 - 2021, USD Million
- TABLE 461 Rest of Asia Pacific AI Powered Storage Market by Component, 2022 - 2028, USD Million
- TABLE 462 Rest of Asia Pacific AI Powered Storage Market by Storage Architecture, 2018 - 2021, USD Million
- TABLE 463 Rest of Asia Pacific AI Powered Storage Market by Storage Architecture, 2022 - 2028, USD Million
- TABLE 464 Rest of Asia Pacific AI Powered Storage Market by Storage System, 2018 - 2021, USD Million
- TABLE 465 Rest of Asia Pacific AI Powered Storage Market by Storage System, 2022 - 2028, USD Million
- TABLE 466 Rest of Asia Pacific AI Powered Storage Market by Storage Medium, 2018 - 2021, USD Million
- TABLE 467 Rest of Asia Pacific AI Powered Storage Market by Storage Medium, 2022 - 2028, USD Million
- TABLE 468 Rest of Asia Pacific AI Powered Storage Market by End User, 2018 - 2021, USD Million
- TABLE 469 Rest of Asia Pacific AI Powered Storage Market by End User, 2022 - 2028, USD Million
- TABLE 470 Rest of Asia Pacific AI Powered Storage Market by Enterprises Type, 2018 - 2021, USD Million
- TABLE 471 Rest of Asia Pacific AI Powered Storage Market by Enterprises Type, 2022 - 2028, USD Million
- TABLE 472 LAMEA AI Powered Storage Market, 2018 - 2021, USD Million
- TABLE 473 LAMEA AI Powered Storage Market, 2022 - 2028, USD Million
- TABLE 474 LAMEA AI Powered Storage Market by Component, 2018 - 2021, USD Million
- TABLE 475 LAMEA AI Powered Storage Market by Component, 2022 - 2028, USD Million
- TABLE 476 LAMEA Hardware Market by Country, 2018 - 2021, USD Million
- TABLE 477 LAMEA Hardware Market by Country, 2022 - 2028, USD Million
- TABLE 478 LAMEA Software Market by Country, 2018 - 2021, USD Million
- TABLE 479 LAMEA Software Market by Country, 2022 - 2028, USD Million
- TABLE 480 LAMEA AI Powered Storage Market by Storage Architecture, 2018 - 2021, USD Million
- TABLE 481 LAMEA AI Powered Storage Market by Storage Architecture, 2022 - 2028, USD Million
- TABLE 482 LAMEA File & Object Based Storage Market by Country, 2018 - 2021, USD Million
- TABLE 483 LAMEA File & Object Based Storage Market by Country, 2022 - 2028, USD Million
- TABLE 484 LAMEA Object Storage Market by Country, 2018 - 2021, USD Million
- TABLE 485 LAMEA Object Storage Market by Country, 2022 - 2028, USD Million
- TABLE 486 LAMEA AI Powered Storage Market by Storage System, 2018 - 2021, USD Million
- TABLE 487 LAMEA AI Powered Storage Market by Storage System, 2022 - 2028, USD Million
- TABLE 488 LAMEA Direct Attached Storage Market by Country, 2018 - 2021, USD Million
- TABLE 489 LAMEA Direct Attached Storage Market by Country, 2022 - 2028, USD Million
- TABLE 490 LAMEA Network Attached Storage Market by Country, 2018 - 2021, USD Million
- TABLE 491 LAMEA Network Attached Storage Market by Country, 2022 - 2028, USD Million
- TABLE 492 LAMEA Storage Area Network Market by Country, 2018 - 2021, USD Million
- TABLE 493 LAMEA Storage Area Network Market by Country, 2022 - 2028, USD Million
- TABLE 494 LAMEA AI Powered Storage Market by Storage Medium, 2018 - 2021, USD Million
- TABLE 495 LAMEA AI Powered Storage Market by Storage Medium, 2022 - 2028, USD Million
- TABLE 496 LAMEA Hard Disk Drive Market by Country, 2018 - 2021, USD Million
- TABLE 497 LAMEA Hard Disk Drive Market by Country, 2022 - 2028, USD Million
- TABLE 498 LAMEA Solid State Drive Market by Country, 2018 - 2021, USD Million
- TABLE 499 LAMEA Solid State Drive Market by Country, 2022 - 2028, USD Million
- TABLE 500 LAMEA AI Powered Storage Market by End User, 2018 - 2021, USD Million
- TABLE 501 LAMEA AI Powered Storage Market by End User, 2022 - 2028, USD Million
- TABLE 502 LAMEA Enterprises Market by Country, 2018 - 2021, USD Million
- TABLE 503 LAMEA Enterprises Market by Country, 2022 - 2028, USD Million
- TABLE 504 LAMEA AI Powered Storage Market by Enterprises Type, 2018 - 2021, USD Million
- TABLE 505 LAMEA AI Powered Storage Market by Enterprises Type, 2022 - 2028, USD Million
- TABLE 506 LAMEA BFSI Market by Country, 2018 - 2021, USD Million
- TABLE 507 LAMEA BFSI Market by Country, 2022 - 2028, USD Million
- TABLE 508 LAMEA Manufacturing Market by Country, 2018 - 2021, USD Million
- TABLE 509 LAMEA Manufacturing Market by Country, 2022 - 2028, USD Million
- TABLE 510 LAMEA Media & Entertainment Market by Country, 2018 - 2021, USD Million
- TABLE 511 LAMEA Media & Entertainment Market by Country, 2022 - 2028, USD Million
- TABLE 512 LAMEA Healthcare Market by Country, 2018 - 2021, USD Million
- TABLE 513 LAMEA Healthcare Market by Country, 2022 - 2028, USD Million
- TABLE 514 LAMEA Consumer Goods & Retail Market by Country, 2018 - 2021, USD Million
- TABLE 515 LAMEA Consumer Goods & Retail Market by Country, 2022 - 2028, USD Million
- TABLE 516 LAMEA Others Market by Country, 2018 - 2021, USD Million
- TABLE 517 LAMEA Others Market by Country, 2022 - 2028, USD Million
- TABLE 518 LAMEA Cloud Service Providers Market by Country, 2018 - 2021, USD Million
- TABLE 519 LAMEA Cloud Service Providers Market by Country, 2022 - 2028, USD Million
- TABLE 520 LAMEA Telecom Companies Market by Country, 2018 - 2021, USD Million
- TABLE 521 LAMEA Telecom Companies Market by Country, 2022 - 2028, USD Million
- TABLE 522 LAMEA Others Market by Country, 2018 - 2021, USD Million
- TABLE 523 LAMEA Others Market by Country, 2022 - 2028, USD Million
- TABLE 524 LAMEA AI Powered Storage Market by Country, 2018 - 2021, USD Million
- TABLE 525 LAMEA AI Powered Storage Market by Country, 2022 - 2028, USD Million
- TABLE 526 Brazil AI Powered Storage Market, 2018 - 2021, USD Million
- TABLE 527 Brazil AI Powered Storage Market, 2022 - 2028, USD Million
- TABLE 528 Brazil AI Powered Storage Market by Component, 2018 - 2021, USD Million
- TABLE 529 Brazil AI Powered Storage Market by Component, 2022 - 2028, USD Million
- TABLE 530 Brazil AI Powered Storage Market by Storage Architecture, 2018 - 2021, USD Million
- TABLE 531 Brazil AI Powered Storage Market by Storage Architecture, 2022 - 2028, USD Million
- TABLE 532 Brazil AI Powered Storage Market by Storage System, 2018 - 2021, USD Million
- TABLE 533 Brazil AI Powered Storage Market by Storage System, 2022 - 2028, USD Million
- TABLE 534 Brazil AI Powered Storage Market by Storage Medium, 2018 - 2021, USD Million
- TABLE 535 Brazil AI Powered Storage Market by Storage Medium, 2022 - 2028, USD Million
- TABLE 536 Brazil AI Powered Storage Market by End User, 2018 - 2021, USD Million
- TABLE 537 Brazil AI Powered Storage Market by End User, 2022 - 2028, USD Million
- TABLE 538 Brazil AI Powered Storage Market by Enterprises Type, 2018 - 2021, USD Million
- TABLE 539 Brazil AI Powered Storage Market by Enterprises Type, 2022 - 2028, USD Million
- TABLE 540 Argentina AI Powered Storage Market, 2018 - 2021, USD Million
- TABLE 541 Argentina AI Powered Storage Market, 2022 - 2028, USD Million
- TABLE 542 Argentina AI Powered Storage Market by Component, 2018 - 2021, USD Million
- TABLE 543 Argentina AI Powered Storage Market by Component, 2022 - 2028, USD Million
- TABLE 544 Argentina AI Powered Storage Market by Storage Architecture, 2018 - 2021, USD Million
- TABLE 545 Argentina AI Powered Storage Market by Storage Architecture, 2022 - 2028, USD Million
- TABLE 546 Argentina AI Powered Storage Market by Storage System, 2018 - 2021, USD Million
- TABLE 547 Argentina AI Powered Storage Market by Storage System, 2022 - 2028, USD Million
- TABLE 548 Argentina AI Powered Storage Market by Storage Medium, 2018 - 2021, USD Million
- TABLE 549 Argentina AI Powered Storage Market by Storage Medium, 2022 - 2028, USD Million
- TABLE 550 Argentina AI Powered Storage Market by End User, 2018 - 2021, USD Million
- TABLE 551 Argentina AI Powered Storage Market by End User, 2022 - 2028, USD Million
- TABLE 552 Argentina AI Powered Storage Market by Enterprises Type, 2018 - 2021, USD Million
- TABLE 553 Argentina AI Powered Storage Market by Enterprises Type, 2022 - 2028, USD Million
- TABLE 554 UAE AI Powered Storage Market, 2018 - 2021, USD Million
- TABLE 555 UAE AI Powered Storage Market, 2022 - 2028, USD Million
- TABLE 556 UAE AI Powered Storage Market by Component, 2018 - 2021, USD Million
- TABLE 557 UAE AI Powered Storage Market by Component, 2022 - 2028, USD Million
- TABLE 558 UAE AI Powered Storage Market by Storage Architecture, 2018 - 2021, USD Million
- TABLE 559 UAE AI Powered Storage Market by Storage Architecture, 2022 - 2028, USD Million
- TABLE 560 UAE AI Powered Storage Market by Storage System, 2018 - 2021, USD Million
- TABLE 561 UAE AI Powered Storage Market by Storage System, 2022 - 2028, USD Million
- TABLE 562 UAE AI Powered Storage Market by Storage Medium, 2018 - 2021, USD Million
- TABLE 563 UAE AI Powered Storage Market by Storage Medium, 2022 - 2028, USD Million
- TABLE 564 UAE AI Powered Storage Market by End User, 2018 - 2021, USD Million
- TABLE 565 UAE AI Powered Storage Market by End User, 2022 - 2028, USD Million
- TABLE 566 UAE AI Powered Storage Market by Enterprises Type, 2018 - 2021, USD Million
- TABLE 567 UAE AI Powered Storage Market by Enterprises Type, 2022 - 2028, USD Million
- TABLE 568 Saudi Arabia AI Powered Storage Market, 2018 - 2021, USD Million
- TABLE 569 Saudi Arabia AI Powered Storage Market, 2022 - 2028, USD Million
- TABLE 570 Saudi Arabia AI Powered Storage Market by Component, 2018 - 2021, USD Million
- TABLE 571 Saudi Arabia AI Powered Storage Market by Component, 2022 - 2028, USD Million
- TABLE 572 Saudi Arabia AI Powered Storage Market by Storage Architecture, 2018 - 2021, USD Million
- TABLE 573 Saudi Arabia AI Powered Storage Market by Storage Architecture, 2022 - 2028, USD Million
- TABLE 574 Saudi Arabia AI Powered Storage Market by Storage System, 2018 - 2021, USD Million
- TABLE 575 Saudi Arabia AI Powered Storage Market by Storage System, 2022 - 2028, USD Million
- TABLE 576 Saudi Arabia AI Powered Storage Market by Storage Medium, 2018 - 2021, USD Million
- TABLE 577 Saudi Arabia AI Powered Storage Market by Storage Medium, 2022 - 2028, USD Million
- TABLE 578 Saudi Arabia AI Powered Storage Market by End User, 2018 - 2021, USD Million
- TABLE 579 Saudi Arabia AI Powered Storage Market by End User, 2022 - 2028, USD Million
- TABLE 580 Saudi Arabia AI Powered Storage Market by Enterprises Type, 2018 - 2021, USD Million
- TABLE 581 Saudi Arabia AI Powered Storage Market by Enterprises Type, 2022 - 2028, USD Million
- TABLE 582 South Africa AI Powered Storage Market, 2018 - 2021, USD Million
- TABLE 583 South Africa AI Powered Storage Market, 2022 - 2028, USD Million
- TABLE 584 South Africa AI Powered Storage Market by Component, 2018 - 2021, USD Million
- TABLE 585 South Africa AI Powered Storage Market by Component, 2022 - 2028, USD Million
- TABLE 586 South Africa AI Powered Storage Market by Storage Architecture, 2018 - 2021, USD Million
- TABLE 587 South Africa AI Powered Storage Market by Storage Architecture, 2022 - 2028, USD Million
- TABLE 588 South Africa AI Powered Storage Market by Storage System, 2018 - 2021, USD Million
- TABLE 589 South Africa AI Powered Storage Market by Storage System, 2022 - 2028, USD Million
- TABLE 590 South Africa AI Powered Storage Market by Storage Medium, 2018 - 2021, USD Million
- TABLE 591 South Africa AI Powered Storage Market by Storage Medium, 2022 - 2028, USD Million
- TABLE 592 South Africa AI Powered Storage Market by End User, 2018 - 2021, USD Million
- TABLE 593 South Africa AI Powered Storage Market by End User, 2022 - 2028, USD Million
- TABLE 594 South Africa AI Powered Storage Market by Enterprises Type, 2018 - 2021, USD Million
- TABLE 595 South Africa AI Powered Storage Market by Enterprises Type, 2022 - 2028, USD Million
- TABLE 596 Nigeria AI Powered Storage Market, 2018 - 2021, USD Million
- TABLE 597 Nigeria AI Powered Storage Market, 2022 - 2028, USD Million
- TABLE 598 Nigeria AI Powered Storage Market by Component, 2018 - 2021, USD Million
- TABLE 599 Nigeria AI Powered Storage Market by Component, 2022 - 2028, USD Million
- TABLE 600 Nigeria AI Powered Storage Market by Storage Architecture, 2018 - 2021, USD Million
- TABLE 601 Nigeria AI Powered Storage Market by Storage Architecture, 2022 - 2028, USD Million
- TABLE 602 Nigeria AI Powered Storage Market by Storage System, 2018 - 2021, USD Million
- TABLE 603 Nigeria AI Powered Storage Market by Storage System, 2022 - 2028, USD Million
- TABLE 604 Nigeria AI Powered Storage Market by Storage Medium, 2018 - 2021, USD Million
- TABLE 605 Nigeria AI Powered Storage Market by Storage Medium, 2022 - 2028, USD Million
- TABLE 606 Nigeria AI Powered Storage Market by End User, 2018 - 2021, USD Million
- TABLE 607 Nigeria AI Powered Storage Market by End User, 2022 - 2028, USD Million
- TABLE 608 Nigeria AI Powered Storage Market by Enterprises Type, 2018 - 2021, USD Million
- TABLE 609 Nigeria AI Powered Storage Market by Enterprises Type, 2022 - 2028, USD Million
- TABLE 610 Rest of LAMEA AI Powered Storage Market, 2018 - 2021, USD Million
- TABLE 611 Rest of LAMEA AI Powered Storage Market, 2022 - 2028, USD Million
- TABLE 612 Rest of LAMEA AI Powered Storage Market by Component, 2018 - 2021, USD Million
- TABLE 613 Rest of LAMEA AI Powered Storage Market by Component, 2022 - 2028, USD Million
- TABLE 614 Rest of LAMEA AI Powered Storage Market by Storage Architecture, 2018 - 2021, USD Million
- TABLE 615 Rest of LAMEA AI Powered Storage Market by Storage Architecture, 2022 - 2028, USD Million
- TABLE 616 Rest of LAMEA AI Powered Storage Market by Storage System, 2018 - 2021, USD Million
- TABLE 617 Rest of LAMEA AI Powered Storage Market by Storage System, 2022 - 2028, USD Million
- TABLE 618 Rest of LAMEA AI Powered Storage Market by Storage Medium, 2018 - 2021, USD Million
- TABLE 619 Rest of LAMEA AI Powered Storage Market by Storage Medium, 2022 - 2028, USD Million
- TABLE 620 Rest of LAMEA AI Powered Storage Market by End User, 2018 - 2021, USD Million
- TABLE 621 Rest of LAMEA AI Powered Storage Market by End User, 2022 - 2028, USD Million
- TABLE 622 Rest of LAMEA AI Powered Storage Market by Enterprises Type, 2018 - 2021, USD Million
- TABLE 623 Rest of LAMEA AI Powered Storage Market by Enterprises Type, 2022 - 2028, USD Million
- TABLE 624 Key information - IBM Corporation
- TABLE 625 key information - Microsoft Corporation
- TABLE 626 Key Information - Amazon Web Services, Inc.
- TABLE 627 Key Information - Google LLC
- TABLE 628 Key Information - Cisco Systems, Inc.
- TABLE 629 Key Information - Dell Technologies, Inc.
- TABLE 630 key information - Hewlett Packard Enterprise Company
- TABLE 631 Key Information - Intel Corporation
- TABLE 632 Key Information - NetApp, Inc.
- TABLE 633 Key Information - Lenovo Group Limited
List of Figures
- FIG 1 Methodology for the research
- FIG 2 KBV Cardinal Matrix
- FIG 3 Key Leading Strategies: Percentage Distribution (2018-2022)
- FIG 4 Key Strategic Move: (Acquisition and Mergers: 2019, Aug - 2023, Jan) Leading Players
- FIG 5 Global AI Powered Storage Market Share by Component, 2021
- FIG 6 Global AI Powered Storage Market Share by Component, 2028
- FIG 7 Global AI Powered Storage Market by Component, 2018 - 2028, USD Million
- FIG 8 Global AI Powered Storage Market Share by Storage Architecture, 2021
- FIG 9 Global AI Powered Storage Market Share by Storage Architecture, 2028
- FIG 10 Global AI Powered Storage Market by Storage Architecture, 2018 - 2028, USD Million
- FIG 11 Global AI Powered Storage Market Share by Storage System, 2021
- FIG 12 Global AI Powered Storage Market Share by Storage System, 2028
- FIG 13 Global AI Powered Storage Market by Storage System, 2018 - 2028, USD Million
- FIG 14 Global AI Powered Storage Market Share by Storage Medium, 2021
- FIG 15 Global AI Powered Storage Market Share by Storage Medium, 2028
- FIG 16 Global AI Powered Storage Market by Storage Medium, 2018 - 2028, USD Million
- FIG 17 Global AI Powered Storage Market Share by End User, 2021
- FIG 18 Global AI Powered Storage Market Share by End User, 2028
- FIG 19 Global AI Powered Storage Market by End User, 2018 - 2028, USD Million
- FIG 20 Global AI Powered Storage Market Share by Region, 2021
- FIG 21 Global AI Powered Storage Market Share by Region, 2028
- FIG 22 Global AI Powered Storage Market by Region, 2018 - 2028, USD Million
- FIG 23 Recent strategies and developments: IBM Corporation
- FIG 24 Swot analysis: IBM Corporation
- FIG 25 SWOT Analysis: Microsoft Corporation
- FIG 26 SWOT analysis: Amazon.com, Inc.
- FIG 27 SWOT Analysis: Alphabet Inc. (Google LLC)
- FIG 28 SWOT Analysis: Cisco Systems, Inc.
- FIG 29 SWOT Analysis: Dell Technologies, Inc.
- FIG 30 SWOT analysis: Hewlett-Packard enterprise Company
- FIG 31 SWOT analysis: Intel corporation
- FIG 32 SWOT Analysis: NetApp, INC.
The Global AI Powered Storage Market size is expected to reach $66.5 billion by 2028, rising at a market growth of 24.5% CAGR during the forecast period.
AI-enabled or AI-powered storage uses AI workloads and contemporary analytics to provide scale-out storage systems for data-driven organizations. Most companies in the modern world depend on data; nevertheless, businesses are well aware of the amount of data they create, the value of the data, the elimination of undesired data, and the lifetime of that data. As a result, companies are always looking for new ways to manage their data, including checkpoints for compliance, optimizing their data, registering their data, and conditioning them. AI-powered storage enters the scene at this juncture since it helps businesses to analyze data sensibly and speedily by delivering immediate insights.
The AI-powered storage process can be broken down into three distinct phases: the first is data intake, followed by training using machine learning, and finally, inference, which is the phase of providing insights.
Organizations produce enormous amounts of data that must be categorized and optimized effectively. This need is primarily driving the demand for AI-powered storage worldwide. In addition to this, the expanding use of artificial intelligence across a wide variety of business sectors all over the world, as well as the rising adoption of cloud-based services, are both acting as additional factors that are likely to contribute positively to the expansion of the global market for AI-powered storage in the years to come.
It is frequently utilized for process optimization and automation, data management, and boosting the system's efficiency; as a result, it is greatly desired in the information technology (IT), software, medical sciences, travel, hospitality, and retail sectors. Furthermore, it is widely desired in sectors like BFSI, telecom, entertainment, government, and cloud service providers because it provides encryption and data protection against possible security risks. In addition, it protects against potential security threats.
COVID-19 Impact Analysis
A significant impact was made on the AI Powered Storage Market as a result of the COVID-19 outbreak. Since COVID-19 took place, investment in AI-led enterprises and organizations, most affiliated with COVID, has continued at a very healthy level. Following the release of COVID-19, it was anticipated that there would be a significant acceleration in the technical growth of the industrial sector, corporate enterprises, and government agencies. Several companies have begun using AI-powered storage systems for their real-time data storage to enhance their business models and increase their turnaround rate. In addition, this expansion has resulted in significant new investments being made in the AI-Powered Storage Market worldwide.
Market Growth Factors
An increase in the use of applications and services hosted on the cloud
The increasing use of cloud-based apps and services is one of the primary factors driving the market for AI-powered storage solutions. Applications that run on the cloud have brought about a significant shift in the commercial world, particularly amid the COVID-19 pandemic. Using AI-powered storage systems for high-performance computing assists businesses in integrating their data and dealing with large amounts of unstructured data. It is anticipated that the market for AI-powered storage would see significant growth throughout the forecast duration.
An increase in investments in artificial intelligence and machine learning by BFSI companies
BFSI companies are increasing the amount of money they spend in artificial intelligence and machine learning software to provide better service to their customers and streamline the administration of fintech. Furthermore, because the BFSI industry is becoming more complex and competitive, there is a growing need for solutions specifically customized to the industry's requirements. As a consequence of this, a large number of financial institutions and fintech businesses are making investments in artificial intelligence solutions to fulfill the needs of their customers.
Market Restraining Factors
Issues with network utilization and latency in the public cloud
The public cloud might be problematic in terms of latency when it comes to storing and retrieving data. Loss of control over the network from beginning to end, which may occur when data is gathered in the public cloud, in conjunction with significant latency, can disorient how applications function. In addition, storage solutions might be disrupted if the supplier of cloud-based storage has similar network issues, which would ultimately halt activity and cause significant financial losses for organizations. Inadequate Internet bandwidth, distant data center locations, and heavy network traffic are three more factors that might contribute to concerns with latency.
Component Outlook
Based on the component, the AI-powered Storage Market is classified into hardware and software. In 2021, the software segment obtained a significant revenue share of the AI-powered storage market. This is because it saves money and time while also reducing risk, all of which are projected to provide lucrative growth and prospects for the industry in the coming years.
Storage Architecture Outlook
Based on storage architecture, the AI-powered storage market is classified into file & object-based storage and object storage. In 2021, the object storage segment contributed a sizeable portion of the total revenue generated in the market for AI-powered storage. Object storage provides the most scalable storage architecture, making it well-suited to accommodate the enormous amounts of data required for artificial intelligence and machine learning.
Storage System Outlook
Based on the storage system, the AI-powered storage market is divided into direct attached storage, network attached storage, and storage area network. The storage area segment of the AI-powered storage market had the substantial revenue share in 2021, leading to its dominance globally. The widespread usage of storage area networks in small and medium-sized organizations is driving the expansion of the market. It is a network of data storage devices that makes it simpler for data centers to collaborate on storage matters.
Storage Medium Outlook
Based on the storage medium, the AI-powered storage market is categorized into hard disk drive and solid-state drive. Within the AI-powered storage market in 2021, the solid-state drive segment obtained the considerable revenue share. A nonvolatile storage medium that saves permanent data on solid-state flash memory is known as a solid-state drive (SSD). Compared to conventional hard disc drives, solid-state drives (SSD) are noticeably more advantageous due to their quicker read/write speeds, lower operating noise levels, and overall superior performance (HDD).
End User Outlook
Based on end user, the AI-powered storage market is classified into enterprise, government bodies, cloud service providers, and telecom companies. The enterprise segment accounted for the largest revenue share in the AI-powered storage market in 2021. Companies must comprehensively understand the data they generate, its worth, how to get rid of data that is not wanted, and how long that data will be accessible. AI-enabled storage offers continuous real-time updates from a range of business data sources, optimizes the data, and conducts other intelligent automated operations on it without the need for human input.
Regional Outlook
Based on region, the AI-powered storage market is classified into North America, Europe, Asia Pacific, and LAMEA. In 2021, the North America region dominated the AI-powered storage market by producing the highest revenue share. This put the region in the position of being the leader. This may be ascribed to the increasing rate of technological advancement and the digitization of the market in this area, which has led to the use of AI-powered storage by enterprises to preserve their vital data. Additionally, the expansion may be attributed to the substantial presence of players in the data storage market, increased awareness, and the availability of trained talents, as well as the growing use of AI storage in the region's expanding financial sector.
The major strategies followed by the market participants are Acquisitions. Based on the Analysis presented in the Cardinal matrix; Alphabet (Google LLC) and Microsoft Corporation are the forerunners in the AI Powered Storage Market. Companies such as Amazon Web Services, Inc. (Amazon.com, Inc.), Intel Corporation, Hewlett-Packard Enterprise Company are some of the key innovators in AI Powered Storage Market.
The market research report covers the analysis of key stake holders of the market. Key companies profiled in the report include IBM Corporation, Microsoft Corporation, Amazon Web Services, Inc. (Amazon.com, Inc.), Google LLC (Alphabet Inc.), Cisco Systems, Inc., Hewlett-Packard Enterprise Company, Intel Corporation, Dell Technologies, Inc., Lenovo Group Limited, NetApp, Inc.
Recent Strategies Deployed in AI Powered Storage Market
Partnership, Collaboration and Agreements:
Oct-2022: Google Cloud expanded its partnership with Accenture, specializing in information technology (IT) services and consulting. Through this partnership, both companies aimed at jointly develop new solutions using data and AI. Furthermore, it would enable the clients to build a strong core and reinvent their enterprises on the cloud.
Oct-2022: Lenovo signed an agreement with VMware, a cloud computing and virtualization technology company, to accelerate the transformation of businesses from edge to the cloud. Both companies would develop plans to deliver AI and multi-cloud solutions to enable seamless management across today's changing IT landscape and help customers leverage data intelligence across a wide range of industry-specific applications.
May-2022: IBM Corporation signed an agreement with Amazon Web Services (AWS), a subsidiary of Amazon that provides on-demand cloud computing platforms and APIs to individuals, companies, and governments. This agreement would deliver IBM's clients easy and rapid access to IBM Software that covers Data and AI, Security, Sustainability, and Automation abilities.
Product Launch and Product Expansions:
Jul-2022: Dell Technologies unveiled Dell PowerFlex, a modern storage solution. By deploying a software-defined infrastructure with new file services, Dell PowerFlex enables unified block and file capabilities on a single platform that consolidates traditional and modern workloads. Businesses can derive critical insights to grow in the digital era using these advancements.
Apr-2021: IBM released IBM Spectrum Fusion Hyper-Converged Infrastructure, advanced storage solutions. The company aimed at simplifying data accessibility & availability across hybrid clouds along with planning to ship new container-native software-defined storage solutions designed to help companies expand data availability across complex hybrid clouds for greater business performance and resilience.
Acquisition and Mergers:
Jan-2023: Microsoft Corporation completed the acquisition of Fungible, a developer of composable infrastructure for accelerating the company's data center network and storage performance. The acquisition would enable the company to enhance its broad range of technologies and offerings in offloading, improving latency, increasing system density in data centers, and reducing expenses.
Sep-2022: Google Cloud took over Mandiant, a dynamic cyber defense, threat intelligence, and incident response service provider. The acquisition would enable the company to help enterprises reinvent security, improving their threat, incident, and exposure management.
Jul-2022: IBM took over Databand.ai, a leading provider of data observability software. This acquisition aimed to provide IBM with the most comprehensive set of observability offerings for IT across applications, data, and machine learning and would continue to provide IBM's customers and partners with the technology they require to provide trustworthy data and AI at scale.
May-2022: NetApp took over Instaclustr, a leading platform provider of a fully managed open-source database, pipeline, and workflow applications delivered as a service. The acquisition would combine continuous storage and compute optimization of the company with Instaclustr's fully-managed database and data pipeline services to provide customers with a cloud operations platform that enables an optimized foundation for their applications in the public clouds and on-premises.
Mar-2022: Microsoft took over Nuance Communications, a leader in conversational AI and ambient intelligence industries. This acquisition aimed to bring together Nuance's best-in-class conversational AI and ambient intelligence with Microsoft's secure as well as trusted industry cloud offerings. Also, this acquisition would help providers offer more affordable, effective, and accessible healthcare, and help businesses in every industry create more personalized and meaningful customer experiences.
Mar-2022: Intel signed an agreement to acquire Granulate Cloud Solutions, an Israel-based developer of real-time continuous optimization software. The acquisition would complement Intel's current abilities by helping consumers realize performance benefits, cloud cost reductions & continue workload learning.
Feb-2022: IBM completed the acquisition of Neudesic, a leading U.S. cloud services consultancy. This acquisition aimed to expand IBM's portfolio of hybrid multi-cloud services and further improve the company's hybrid cloud as well as AI strategy.
Sep-2021: Hewlett Packard acquired Zerto, a new disaster recovery, and backup solution. This acquisition would position the HPE GreenLake edge-to-cloud platform in the high-growth data protection market with a proven solution and further propels HPE's storage enterprise into a cloud-native, software-defined data services business.
Jun-2021: Hewlett Packard Enterprise completed the acquisition of Determined AI, a San Francisco-based startup. This acquisition aimed to provide a strong and robust software stack to train AI models quicker, at any scale, utilizing its open source machine learning (ML) platform.
Jun-2021: IBM acquired Turbonomic, an Application Resource Management (ARM) and Network Performance Management (NPM) software, provider. This acquisition aimed to add Turbonomic to IBM's portfolio.
Jun-2021: NetApp acquired Data Mechanics, a managed platform provider for big data processing and cloud analytics. Through this acquisition, the company aimed at adding Data Mechanics*to its existing solutions that help businesses to advance their data and cloud initiatives by leveraging Apache Spark and Kubernetes.
Feb-2021: Cisco completed the acquisition of IMImobile, a leading global provider of cloud communications software and services. This acquisition aimed to integrate IMImobile's solution along with Webex Contact Center, to design a new robust Customer Experience as a Service offer. Additionally, this suite would combine artificial intelligence, collaboration, Communications, cloud contact center, and experience management as a Service to generate a single solution that would give the enterprise the capability to deliver the exceptional experiences consumers require.
Jan-2021: Cisco took over Banzai Cloud, a privately held company headquartered in Budapest, Hungary. Through this acquisition, the Banzai Cloud team would expand Cisco's expertise and abilities through its demonstrated experience with the entire end-to-end cloud-native application, deployment, and runtime, development, and security progress.
Dec-2020: IBM took over Instana, a German-American software firm. Through this acquisition, IBM aimed to deliver industry-leading, AI-powered automation offerings to handle the complications of modern applications that span hybrid cloud landscapes.
Scope of the Study
Market Segments covered in the Report:
By Component
- Hardware
- Software
By Storage Architecture
- File & Object Based Storage
- Object Storage
By Storage System
- Direct Attached Storage
- Network Attached Storage
- Storage Area Network
By Storage Medium
- Hard Disk Drive
- Solid State Drive
By End User
- Enterprises
- BFSI
- Manufacturing
- Media & Entertainment
- Healthcare
- Consumer Goods & Retail
- Others
- Cloud Service Providers
- Telecom Companies
- Others
By Geography
- North America
- US
- Canada
- Mexico
- Rest of North America
- Europe
- Germany
- UK
- France
- Russia
- Spain
- Italy
- Rest of Europe
- Asia Pacific
- China
- Japan
- India
- South Korea
- Singapore
- Malaysia
- Rest of Asia Pacific
- LAMEA
- Brazil
- Argentina
- UAE
- Saudi Arabia
- South Africa
- Nigeria
- Rest of LAMEA
Companies Profiled
- IBM Corporation
- Microsoft Corporation
- Amazon Web Services, Inc. (Amazon.com, Inc.)
- Google LLC (Alphabet Inc.)
- Cisco Systems, Inc.
- Hewlett-Packard Enterprise Company
- Intel Corporation
- Dell Technologies, Inc.
- Lenovo Group Limited
- NetApp, Inc.
Unique Offerings from KBV Research
- Exhaustive coverage
- Highest number of market tables and figures
- Subscription based model available
- Guaranteed best price
- Assured post sales research support with 10% customization free
Table of Contents
Chapter 1. Market Scope & Methodology
- 1.1 Market Definition
- 1.2 Objectives
- 1.3 Market Scope
- 1.4 Segmentation
- 1.4.1 Global AI Powered Storage Market, by Component
- 1.4.2 Global AI Powered Storage Market, by Storage Architecture
- 1.4.3 Global AI Powered Storage Market, by Storage System
- 1.4.4 Global AI Powered Storage Market, by Storage Medium
- 1.4.5 Global AI Powered Storage Market, by End User
- 1.4.6 Global AI Powered Storage Market, by Geography
- 1.5 Methodology for the research
Chapter 2. Market Overview
- 2.1 Introduction
- 2.1.1 Overview
- 2.1.1.1 Market Composition & Scenario
- 2.1.1 Overview
- 2.2 Key Factors Impacting the Market
- 2.2.1 Market Drivers
- 2.2.2 Market Restraints
Chapter 3. Competition Analysis - Global
- 3.1 KBV Cardinal Matrix
- 3.2 Recent Industry Wide Strategic Developments
- 3.2.1 Partnerships, Collaborations and Agreements
- 3.2.2 Product Launches and Product Expansions
- 3.2.3 Acquisition and Mergers
- 3.3 Top Winning Strategies
- 3.3.1 Key Leading Strategies: Percentage Distribution (2018-2022)
- 3.3.2 Key Strategic Move: (Acquisition and Mergers: 2019, Aug - 2023, Jan) Leading Players
Chapter 4. Global AI Powered Storage Market by Component
- 4.1 Global Hardware Market by Region
- 4.2 Global Software Market by Region
Chapter 5. Global AI Powered Storage Market by Storage Architecture
- 5.1 Global File & Object Based Storage Market by Region
- 5.2 Global Object Storage Market by Region
Chapter 6. Global AI Powered Storage Market by Storage System
- 6.1 Global Direct Attached Storage Market by Region
- 6.2 Global Network Attached Storage Market by Region
- 6.3 Global Storage Area Network Market by Region
Chapter 7. Global AI Powered Storage Market by Storage Medium
- 7.1 Global Hard Disk Drive Market by Region
- 7.2 Global Solid State Drive Market by Region
Chapter 8. Global AI Powered Storage Market by End User
- 8.1 Global Enterprises Market by Region
- 8.2 Global AI Powered Storage Market by Enterprises Type
- 8.2.1 Global BFSI Market by Region
- 8.2.2 Global Manufacturing Market by Region
- 8.2.3 Global Media & Entertainment Market by Region
- 8.2.4 Global Healthcare Market by Region
- 8.2.5 Global Consumer Goods & Retail Market by Region
- 8.2.6 Global Others Market by Region
- 8.3 Global Cloud Service Providers Market by Region
- 8.4 Global Telecom Companies Market by Region
- 8.5 Global Others Market by Region
Chapter 9. Global AI Powered Storage Market by Region
- 9.1 North America AI Powered Storage Market
- 9.1.1 North America AI Powered Storage Market by Component
- 9.1.1.1 North America Hardware Market by Country
- 9.1.1.2 North America Software Market by Country
- 9.1.2 North America AI Powered Storage Market by Storage Architecture
- 9.1.2.1 North America File & Object Based Storage Market by Country
- 9.1.2.2 North America Object Storage Market by Country
- 9.1.3 North America AI Powered Storage Market by Storage System
- 9.1.3.1 North America Direct Attached Storage Market by Country
- 9.1.3.2 North America Network Attached Storage Market by Country
- 9.1.3.3 North America Storage Area Network Market by Country
- 9.1.4 North America AI Powered Storage Market by Storage Medium
- 9.1.4.1 North America Hard Disk Drive Market by Country
- 9.1.4.2 North America Solid State Drive Market by Country
- 9.1.5 North America AI Powered Storage Market by End User
- 9.1.5.1 North America Enterprises Market by Country
- 9.1.5.2 North America AI Powered Storage Market by Enterprises Type
- 9.1.5.2.1 North America BFSI Market by Country
- 9.1.5.2.2 North America Manufacturing Market by Country
- 9.1.5.2.3 North America Media & Entertainment Market by Country
- 9.1.5.2.4 North America Healthcare Market by Country
- 9.1.5.2.5 North America Consumer Goods & Retail Market by Country
- 9.1.5.2.6 North America Others Market by Country
- 9.1.5.3 North America Cloud Service Providers Market by Country
- 9.1.5.4 North America Telecom Companies Market by Country
- 9.1.5.5 North America Others Market by Country
- 9.1.6 North America AI Powered Storage Market by Country
- 9.1.6.1 US AI Powered Storage Market
- 9.1.6.1.1 US AI Powered Storage Market by Component
- 9.1.6.1.2 US AI Powered Storage Market by Storage Architecture
- 9.1.6.1.3 US AI Powered Storage Market by Storage System
- 9.1.6.1.4 US AI Powered Storage Market by Storage Medium
- 9.1.6.1.5 US AI Powered Storage Market by End User
- 9.1.6.1.5.1 US AI Powered Storage Market by Enterprises Type
- 9.1.6.2 Canada AI Powered Storage Market
- 9.1.6.2.1 Canada AI Powered Storage Market by Component
- 9.1.6.2.2 Canada AI Powered Storage Market by Storage Architecture
- 9.1.6.2.3 Canada AI Powered Storage Market by Storage System
- 9.1.6.2.4 Canada AI Powered Storage Market by Storage Medium
- 9.1.6.2.5 Canada AI Powered Storage Market by End User
- 9.1.6.2.5.1 Canada AI Powered Storage Market by Enterprises Type
- 9.1.6.3 Mexico AI Powered Storage Market
- 9.1.6.3.1 Mexico AI Powered Storage Market by Component
- 9.1.6.3.2 Mexico AI Powered Storage Market by Storage Architecture
- 9.1.6.3.3 Mexico AI Powered Storage Market by Storage System
- 9.1.6.3.4 Mexico AI Powered Storage Market by Storage Medium
- 9.1.6.3.5 Mexico AI Powered Storage Market by End User
- 9.1.6.3.5.1 Mexico AI Powered Storage Market by Enterprises Type
- 9.1.6.4 Rest of North America AI Powered Storage Market
- 9.1.6.4.1 Rest of North America AI Powered Storage Market by Component
- 9.1.6.4.2 Rest of North America AI Powered Storage Market by Storage Architecture
- 9.1.6.4.3 Rest of North America AI Powered Storage Market by Storage System
- 9.1.6.4.4 Rest of North America AI Powered Storage Market by Storage Medium
- 9.1.6.4.5 Rest of North America AI Powered Storage Market by End User
- 9.1.6.4.5.1 Rest of North America AI Powered Storage Market by Enterprises Type
- 9.1.6.1 US AI Powered Storage Market
- 9.1.1 North America AI Powered Storage Market by Component
- 9.2 Europe AI Powered Storage Market
- 9.2.1 Europe AI Powered Storage Market by Component
- 9.2.1.1 Europe Hardware Market by Country
- 9.2.1.2 Europe Software Market by Country
- 9.2.2 Europe AI Powered Storage Market by Storage Architecture
- 9.2.2.1 Europe File & Object Based Storage Market by Country
- 9.2.2.2 Europe Object Storage Market by Country
- 9.2.3 Europe AI Powered Storage Market by Storage System
- 9.2.3.1 Europe Direct Attached Storage Market by Country
- 9.2.3.2 Europe Network Attached Storage Market by Country
- 9.2.3.3 Europe Storage Area Network Market by Country
- 9.2.4 Europe AI Powered Storage Market by Storage Medium
- 9.2.4.1 Europe Hard Disk Drive Market by Country
- 9.2.4.2 Europe Solid State Drive Market by Country
- 9.2.5 Europe AI Powered Storage Market by End User
- 9.2.5.1 Europe Enterprises Market by Country
- 9.2.5.2 Europe AI Powered Storage Market by Enterprises Type
- 9.2.5.2.1 Europe BFSI Market by Country
- 9.2.5.2.2 Europe Manufacturing Market by Country
- 9.2.5.2.3 Europe Media & Entertainment Market by Country
- 9.2.5.2.4 Europe Healthcare Market by Country
- 9.2.5.2.5 Europe Consumer Goods & Retail Market by Country
- 9.2.5.2.6 Europe Others Market by Country
- 9.2.5.3 Europe Cloud Service Providers Market by Country
- 9.2.5.4 Europe Telecom Companies Market by Country
- 9.2.5.5 Europe Others Market by Country
- 9.2.6 Europe AI Powered Storage Market by Country
- 9.2.6.1 Germany AI Powered Storage Market
- 9.2.6.1.1 Germany AI Powered Storage Market by Component
- 9.2.6.1.2 Germany AI Powered Storage Market by Storage Architecture
- 9.2.6.1.3 Germany AI Powered Storage Market by Storage System
- 9.2.6.1.4 Germany AI Powered Storage Market by Storage Medium
- 9.2.6.1.5 Germany AI Powered Storage Market by End User
- 9.2.6.1.5.1 Germany AI Powered Storage Market by Enterprises Type
- 9.2.6.2 UK AI Powered Storage Market
- 9.2.6.2.1 UK AI Powered Storage Market by Component
- 9.2.6.2.2 UK AI Powered Storage Market by Storage Architecture
- 9.2.6.2.3 UK AI Powered Storage Market by Storage System
- 9.2.6.2.4 UK AI Powered Storage Market by Storage Medium
- 9.2.6.2.5 UK AI Powered Storage Market by End User
- 9.2.6.2.5.1 UK AI Powered Storage Market by Enterprises Type
- 9.2.6.3 France AI Powered Storage Market
- 9.2.6.3.1 France AI Powered Storage Market by Component
- 9.2.6.3.2 France AI Powered Storage Market by Storage Architecture
- 9.2.6.3.3 France AI Powered Storage Market by Storage System
- 9.2.6.3.4 France AI Powered Storage Market by Storage Medium
- 9.2.6.3.5 France AI Powered Storage Market by End User
- 9.2.6.3.5.1 France AI Powered Storage Market by Enterprises Type
- 9.2.6.4 Russia AI Powered Storage Market
- 9.2.6.4.1 Russia AI Powered Storage Market by Component
- 9.2.6.4.2 Russia AI Powered Storage Market by Storage Architecture
- 9.2.6.4.3 Russia AI Powered Storage Market by Storage System
- 9.2.6.4.4 Russia AI Powered Storage Market by Storage Medium
- 9.2.6.4.5 Russia AI Powered Storage Market by End User
- 9.2.6.4.5.1 Russia AI Powered Storage Market by Enterprises Type
- 9.2.6.5 Spain AI Powered Storage Market
- 9.2.6.5.1 Spain AI Powered Storage Market by Component
- 9.2.6.5.2 Spain AI Powered Storage Market by Storage Architecture
- 9.2.6.5.3 Spain AI Powered Storage Market by Storage System
- 9.2.6.5.4 Spain AI Powered Storage Market by Storage Medium
- 9.2.6.5.5 Spain AI Powered Storage Market by End User
- 9.2.6.5.5.1 Spain AI Powered Storage Market by Enterprises Type
- 9.2.6.6 Italy AI Powered Storage Market
- 9.2.6.6.1 Italy AI Powered Storage Market by Component
- 9.2.6.6.2 Italy AI Powered Storage Market by Storage Architecture
- 9.2.6.6.3 Italy AI Powered Storage Market by Storage System
- 9.2.6.6.4 Italy AI Powered Storage Market by Storage Medium
- 9.2.6.6.5 Italy AI Powered Storage Market by End User
- 9.2.6.6.5.1 Italy AI Powered Storage Market by Enterprises Type
- 9.2.6.7 Rest of Europe AI Powered Storage Market
- 9.2.6.7.1 Rest of Europe AI Powered Storage Market by Component
- 9.2.6.7.2 Rest of Europe AI Powered Storage Market by Storage Architecture
- 9.2.6.7.3 Rest of Europe AI Powered Storage Market by Storage System
- 9.2.6.7.4 Rest of Europe AI Powered Storage Market by Storage Medium
- 9.2.6.7.5 Rest of Europe AI Powered Storage Market by End User
- 9.2.6.7.5.1 Rest of Europe AI Powered Storage Market by Enterprises Type
- 9.2.6.1 Germany AI Powered Storage Market
- 9.2.1 Europe AI Powered Storage Market by Component
- 9.3 Asia Pacific AI Powered Storage Market
- 9.3.1 Asia Pacific AI Powered Storage Market by Component
- 9.3.1.1 Asia Pacific Hardware Market by Country
- 9.3.1.2 Asia Pacific Software Market by Country
- 9.3.2 Asia Pacific AI Powered Storage Market by Storage Architecture
- 9.3.2.1 Asia Pacific File & Object Based Storage Market by Country
- 9.3.2.2 Asia Pacific Object Storage Market by Country
- 9.3.3 Asia Pacific AI Powered Storage Market by Storage System
- 9.3.3.1 Asia Pacific Direct Attached Storage Market by Country
- 9.3.3.2 Asia Pacific Network Attached Storage Market by Country
- 9.3.3.3 Asia Pacific Storage Area Network Market by Country
- 9.3.4 Asia Pacific AI Powered Storage Market by Storage Medium
- 9.3.4.1 Asia Pacific Hard Disk Drive Market by Country
- 9.3.4.2 Asia Pacific Solid State Drive Market by Country
- 9.3.5 Asia Pacific AI Powered Storage Market by End User
- 9.3.5.1 Asia Pacific Enterprises Market by Country
- 9.3.5.2 Asia Pacific AI Powered Storage Market by Enterprises Type
- 9.3.5.2.1 Asia Pacific BFSI Market by Country
- 9.3.5.2.2 Asia Pacific Manufacturing Market by Country
- 9.3.5.2.3 Asia Pacific Media & Entertainment Market by Country
- 9.3.5.2.4 Asia Pacific Healthcare Market by Country
- 9.3.5.2.5 Asia Pacific Consumer Goods & Retail Market by Country
- 9.3.5.2.6 Asia Pacific Others Market by Country
- 9.3.5.3 Asia Pacific Cloud Service Providers Market by Country
- 9.3.5.4 Asia Pacific Telecom Companies Market by Country
- 9.3.5.5 Asia Pacific Others Market by Country
- 9.3.6 Asia Pacific AI Powered Storage Market by Country
- 9.3.6.1 China AI Powered Storage Market
- 9.3.6.1.1 China AI Powered Storage Market by Component
- 9.3.6.1.2 China AI Powered Storage Market by Storage Architecture
- 9.3.6.1.3 China AI Powered Storage Market by Storage System
- 9.3.6.1.4 China AI Powered Storage Market by Storage Medium
- 9.3.6.1.5 China AI Powered Storage Market by End User
- 9.3.6.1.5.1 China AI Powered Storage Market by Enterprises Type
- 9.3.6.2 Japan AI Powered Storage Market
- 9.3.6.2.1 Japan AI Powered Storage Market by Component
- 9.3.6.2.2 Japan AI Powered Storage Market by Storage Architecture
- 9.3.6.2.3 Japan AI Powered Storage Market by Storage System
- 9.3.6.2.4 Japan AI Powered Storage Market by Storage Medium
- 9.3.6.2.5 Japan AI Powered Storage Market by End User
- 9.3.6.2.5.1 Japan AI Powered Storage Market by Enterprises Type
- 9.3.6.3 India AI Powered Storage Market
- 9.3.6.3.1 India AI Powered Storage Market by Component
- 9.3.6.3.2 India AI Powered Storage Market by Storage Architecture
- 9.3.6.3.3 India AI Powered Storage Market by Storage System
- 9.3.6.3.4 India AI Powered Storage Market by Storage Medium
- 9.3.6.3.5 India AI Powered Storage Market by End User
- 9.3.6.3.5.1 India AI Powered Storage Market by Enterprises Type
- 9.3.6.4 South Korea AI Powered Storage Market
- 9.3.6.4.1 South Korea AI Powered Storage Market by Component
- 9.3.6.4.2 South Korea AI Powered Storage Market by Storage Architecture
- 9.3.6.4.3 South Korea AI Powered Storage Market by Storage System
- 9.3.6.4.4 South Korea AI Powered Storage Market by Storage Medium
- 9.3.6.4.5 South Korea AI Powered Storage Market by End User
- 9.3.6.4.5.1 South Korea AI Powered Storage Market by Enterprises Type
- 9.3.6.5 Singapore AI Powered Storage Market
- 9.3.6.5.1 Singapore AI Powered Storage Market by Component
- 9.3.6.5.2 Singapore AI Powered Storage Market by Storage Architecture
- 9.3.6.5.3 Singapore AI Powered Storage Market by Storage System
- 9.3.6.5.4 Singapore AI Powered Storage Market by Storage Medium
- 9.3.6.5.5 Singapore AI Powered Storage Market by End User
- 9.3.6.5.5.1 Singapore AI Powered Storage Market by Enterprises Type
- 9.3.6.6 Malaysia AI Powered Storage Market
- 9.3.6.6.1 Malaysia AI Powered Storage Market by Component
- 9.3.6.6.2 Malaysia AI Powered Storage Market by Storage Architecture
- 9.3.6.6.3 Malaysia AI Powered Storage Market by Storage System
- 9.3.6.6.4 Malaysia AI Powered Storage Market by Storage Medium
- 9.3.6.6.5 Malaysia AI Powered Storage Market by End User
- 9.3.6.6.5.1 Malaysia AI Powered Storage Market by Enterprises Type
- 9.3.6.7 Rest of Asia Pacific AI Powered Storage Market
- 9.3.6.7.1 Rest of Asia Pacific AI Powered Storage Market by Component
- 9.3.6.7.2 Rest of Asia Pacific AI Powered Storage Market by Storage Architecture
- 9.3.6.7.3 Rest of Asia Pacific AI Powered Storage Market by Storage System
- 9.3.6.7.4 Rest of Asia Pacific AI Powered Storage Market by Storage Medium
- 9.3.6.7.5 Rest of Asia Pacific AI Powered Storage Market by End User
- 9.3.6.7.5.1 Rest of Asia Pacific AI Powered Storage Market by Enterprises Type
- 9.3.6.1 China AI Powered Storage Market
- 9.3.1 Asia Pacific AI Powered Storage Market by Component
- 9.4 LAMEA AI Powered Storage Market
- 9.4.1 LAMEA AI Powered Storage Market by Component
- 9.4.1.1 LAMEA Hardware Market by Country
- 9.4.1.2 LAMEA Software Market by Country
- 9.4.2 LAMEA AI Powered Storage Market by Storage Architecture
- 9.4.2.1 LAMEA File & Object Based Storage Market by Country
- 9.4.2.2 LAMEA Object Storage Market by Country
- 9.4.3 LAMEA AI Powered Storage Market by Storage System
- 9.4.3.1 LAMEA Direct Attached Storage Market by Country
- 9.4.3.2 LAMEA Network Attached Storage Market by Country
- 9.4.3.3 LAMEA Storage Area Network Market by Country
- 9.4.4 LAMEA AI Powered Storage Market by Storage Medium
- 9.4.4.1 LAMEA Hard Disk Drive Market by Country
- 9.4.4.2 LAMEA Solid State Drive Market by Country
- 9.4.5 LAMEA AI Powered Storage Market by End User
- 9.4.5.1 LAMEA Enterprises Market by Country
- 9.4.5.2 LAMEA AI Powered Storage Market by Enterprises Type
- 9.4.5.2.1 LAMEA BFSI Market by Country
- 9.4.5.2.2 LAMEA Manufacturing Market by Country
- 9.4.5.2.3 LAMEA Media & Entertainment Market by Country
- 9.4.5.2.4 LAMEA Healthcare Market by Country
- 9.4.5.2.5 LAMEA Consumer Goods & Retail Market by Country
- 9.4.5.2.6 LAMEA Others Market by Country
- 9.4.5.3 LAMEA Cloud Service Providers Market by Country
- 9.4.5.4 LAMEA Telecom Companies Market by Country
- 9.4.5.5 LAMEA Others Market by Country
- 9.4.6 LAMEA AI Powered Storage Market by Country
- 9.4.6.1 Brazil AI Powered Storage Market
- 9.4.6.1.1 Brazil AI Powered Storage Market by Component
- 9.4.6.1.2 Brazil AI Powered Storage Market by Storage Architecture
- 9.4.6.1.3 Brazil AI Powered Storage Market by Storage System
- 9.4.6.1.4 Brazil AI Powered Storage Market by Storage Medium
- 9.4.6.1.5 Brazil AI Powered Storage Market by End User
- 9.4.6.1.5.1 Brazil AI Powered Storage Market by Enterprises Type
- 9.4.6.2 Argentina AI Powered Storage Market
- 9.4.6.2.1 Argentina AI Powered Storage Market by Component
- 9.4.6.2.2 Argentina AI Powered Storage Market by Storage Architecture
- 9.4.6.2.3 Argentina AI Powered Storage Market by Storage System
- 9.4.6.2.4 Argentina AI Powered Storage Market by Storage Medium
- 9.4.6.2.5 Argentina AI Powered Storage Market by End User
- 9.4.6.2.5.1 Argentina AI Powered Storage Market by Enterprises Type
- 9.4.6.3 UAE AI Powered Storage Market
- 9.4.6.3.1 UAE AI Powered Storage Market by Component
- 9.4.6.3.2 UAE AI Powered Storage Market by Storage Architecture
- 9.4.6.3.3 UAE AI Powered Storage Market by Storage System
- 9.4.6.3.4 UAE AI Powered Storage Market by Storage Medium
- 9.4.6.3.5 UAE AI Powered Storage Market by End User
- 9.4.6.3.5.1 UAE AI Powered Storage Market by Enterprises Type
- 9.4.6.4 Saudi Arabia AI Powered Storage Market
- 9.4.6.4.1 Saudi Arabia AI Powered Storage Market by Component
- 9.4.6.4.2 Saudi Arabia AI Powered Storage Market by Storage Architecture
- 9.4.6.4.3 Saudi Arabia AI Powered Storage Market by Storage System
- 9.4.6.4.4 Saudi Arabia AI Powered Storage Market by Storage Medium
- 9.4.6.4.5 Saudi Arabia AI Powered Storage Market by End User
- 9.4.6.4.5.1 Saudi Arabia AI Powered Storage Market by Enterprises Type
- 9.4.6.5 South Africa AI Powered Storage Market
- 9.4.6.5.1 South Africa AI Powered Storage Market by Component
- 9.4.6.5.2 South Africa AI Powered Storage Market by Storage Architecture
- 9.4.6.5.3 South Africa AI Powered Storage Market by Storage System
- 9.4.6.5.4 South Africa AI Powered Storage Market by Storage Medium
- 9.4.6.5.5 South Africa AI Powered Storage Market by End User
- 9.4.6.5.5.1 South Africa AI Powered Storage Market by Enterprises Type
- 9.4.6.6 Nigeria AI Powered Storage Market
- 9.4.6.6.1 Nigeria AI Powered Storage Market by Component
- 9.4.6.6.2 Nigeria AI Powered Storage Market by Storage Architecture
- 9.4.6.6.3 Nigeria AI Powered Storage Market by Storage System
- 9.4.6.6.4 Nigeria AI Powered Storage Market by Storage Medium
- 9.4.6.6.5 Nigeria AI Powered Storage Market by End User
- 9.4.6.6.5.1 Nigeria AI Powered Storage Market by Enterprises Type
- 9.4.6.7 Rest of LAMEA AI Powered Storage Market
- 9.4.6.7.1 Rest of LAMEA AI Powered Storage Market by Component
- 9.4.6.7.2 Rest of LAMEA AI Powered Storage Market by Storage Architecture
- 9.4.6.7.3 Rest of LAMEA AI Powered Storage Market by Storage System
- 9.4.6.7.4 Rest of LAMEA AI Powered Storage Market by Storage Medium
- 9.4.6.7.5 Rest of LAMEA AI Powered Storage Market by End User
- 9.4.6.7.5.1 Rest of LAMEA AI Powered Storage Market by Enterprises Type
- 9.4.6.1 Brazil AI Powered Storage Market
- 9.4.1 LAMEA AI Powered Storage Market by Component
Chapter 10. Company Profiles
- 10.1 IBM Corporation
- 10.1.1 Company Overview
- 10.1.2 Financial Analysis
- 10.1.3 Regional & Segmental Analysis
- 10.1.4 Research & Development Expenses
- 10.1.5 Recent strategies and developments:
- 10.1.5.1 Partnerships, Collaborations, and Agreements:
- 10.1.5.2 Product Launches and Product Expansions:
- 10.1.5.3 Acquisition and Mergers:
- 10.1.6 SWOT Analysis
- 10.2 Microsoft Corporation
- 10.2.1 Company Overview
- 10.2.2 Financial Analysis
- 10.2.3 Segmental and Regional Analysis
- 10.2.4 Research & Development Expenses
- 10.2.5 Recent strategies and developments:
- 10.2.5.1 Acquisition and Mergers:
- 10.2.6 SWOT Analysis
- 10.3 Amazon Web Services, Inc. (Amazon.com, Inc.)
- 10.3.1 Company Overview
- 10.3.2 Financial Analysis
- 10.3.3 Segmental Analysis
- 10.3.4 SWOT Analysis
- 10.4 Google LLC (Alphabet Inc.)
- 10.4.1 Company Overview
- 10.4.2 Financial Analysis
- 10.4.3 Segmental and Regional Analysis
- 10.4.4 Research & Development Expense
- 10.4.5 Recent strategies and developments:
- 10.4.5.1 Partnerships, Collaborations, and Agreements:
- 10.4.5.2 Acquisition and Mergers:
- 10.4.6 SWOT Analysis
- 10.5 Cisco Systems, Inc.
- 10.5.1 Company Overview
- 10.5.2 Financial Analysis
- 10.5.3 Regional Analysis
- 10.5.4 Research & Development Expense
- 10.5.5 Recent strategies and developments:
- 10.5.5.1 Acquisition and Mergers:
- 10.5.6 SWOT Analysis
- 10.6 Dell Technologies, Inc.
- 10.6.1 Company Overview
- 10.6.2 Financial Analysis
- 10.6.3 Segmental and Regional Analysis
- 10.6.4 Research & Development Expense
- 10.6.5 Recent strategies and developments:
- 10.6.5.1 Acquisition and Mergers:
- 10.6.6 SWOT Analysis:
- 10.7 Hewlett Packard Enterprise Company
- 10.7.1 Company Overview
- 10.7.2 Financial Analysis
- 10.7.3 Segmental and Regional Analysis
- 10.7.4 Research & Development Expense
- 10.7.5 Recent strategies and developments:
- 10.7.5.1 Acquisition and Mergers:
- 10.7.6 SWOT Analysis
- 10.8 Intel Corporation
- 10.8.1 Company Overview
- 10.8.2 Financial Analysis
- 10.8.3 Segmental and Regional Analysis
- 10.8.4 Research & Development Expenses
- 10.8.5 Recent strategies and developments:
- 10.8.5.1 Acquisition and Mergers:
- 10.8.6 SWOT Analysis
- 10.9 NetApp, Inc.
- 10.9.1 Company Overview
- 10.9.2 Financial Analysis
- 10.9.3 Regional Analysis
- 10.9.4 Research & Development Expense
- 10.9.5 Recent strategies and developments:
- 10.9.5.1 Acquisition and Mergers:
- 10.9.6 SWOT Analysis
- 10.10. Lenovo Group Limited
- 10.10.1 Company Overview
- 10.10.2 Financial Analysis
- 10.10.3 Segmental and Regional Analysis
- 10.10.4 Research & Development Expense
- 10.10.5 Recent strategies and developments:
- 10.10.5.1 Partnerships, Collaborations, and Agreements: