|
|
市場調査レポート
商品コード
1219649
外付けブラインドの世界市場規模、シェア、産業動向分析レポート:操作システム別(手動および自動)、素材別、設置方法別、用途別(住宅および商業)、製品別、地域別展望・予測、2022年~2028年Global External Blinds Market Size, Share & Industry Trends Analysis Report By Operating System (Manual and Automatic), By Material, By Installation, By Application (Residential and Commercial), By Product, By Regional Outlook and Forecast, 2022 - 2028 |
||||||
|
|
|||||||


| 外付けブラインドの世界市場規模、シェア、産業動向分析レポート:操作システム別(手動および自動)、素材別、設置方法別、用途別(住宅および商業)、製品別、地域別展望・予測、2022年~2028年 |
|
出版日: 2023年01月31日
発行: KBV Research
ページ情報: 英文 268 Pages
納期: 即納可能
|
- 全表示
- 概要
- 図表
- 目次
外付けブラインドの世界市場規模は、2028年には163億米ドルに達し、予測期間中にCAGR6.9%の市場成長率で上昇すると予測されています。
住宅から商業施設まで、あらゆる種類の建物において、過熱を調節し、熱的快適性を維持するという要件がますます重要になってきています。数あるパッシブ冷却戦略の一つとして、ソーラーシェーディングが有効な場合があります。晴れた日に起こるかもしれない温度変化を少なくすることができるかもしれません。
日射透過率は、構造物に入る日射量を計算するために利用される値です。また、遮光係数を採用してもよく、その結果、日射透過率は遮光されていないガラスの場合のほんの一部となります。日射透過率や遮光係数が低いシステムは、特に日射取得量を減らすのに効果的です。さまざまな遮光方法の中で、外付けブラインドは遮光係数が最も低いです。外付けブラインドは、入ってくる日射がガラスを通して構造体に入る前に遮るので、かなり有効であることが分かっています。
COVID-19の影響分析
COVID-19の大流行が外付けブラインドの市場に与えた影響はごくわずかでした。不動産業を中心とした建設業の戸締りや開発の停滞が原因です。新型インフルエンザが流行した当時、首都圏では感染者が集中し、行政による厳しい締め付けが行われ、住宅建設が停滞しました。しかし、この時期、住宅のリフォームが盛んに行われ、特注の外付けブラインドの売り上げが減少したと、市場のベンダーは報告しています。家庭訪問が禁止されたこともその要因の一つです。"手頃な価格で家の内装を改善できる"方法として、DIY部門が大きく発展したのです。さらに、展示会が延期または中止されました。
市場の成長要因
不動産分野の台頭
外付けブラインド市場の成長は、予測期間を通じて不動産セクターの拡大により促進されると予測されます。市場の成長を促進する最も重要な要因の1つは、先進国と新興国の両方で商業施設や住宅の商業運営とその完成率が高まっていることです。人々の経済的余裕と購買力の上昇に伴い、新築住宅の需要も大幅に増加しています。予測期間中、マクロレベルでの市場成長は、ホスピタリティ産業の成長によって牽引されると予想されます。世界の観光ブームの回復に伴い、ホテル、エアビーアンドビー、ホステルなどのホスピタリティ施設のニーズが高まり、外付けブラインド業界の拡大を後押ししています。
都市化が進み、ソーシャルメディアが普及。
急速な都市化と人口増加が地球を覆っています。インドなど新興国の都市では、都市部への移住が増え続けています。現世代の期待を満たすために、天然資源は極度に逼迫しています。農村部の人々は、より良い雇用と教育の可能性を求めて、一斉に都市部へ移動しています。そのため、現代の生活に合った宿泊施設を提供することが急務となっています。このような人々は、家の外観や内装を魅力的にデザインすることを好みます。したがって、それは上昇都市化とソーシャルメディアプラットフォームは、外部ブラインド業界の拡大を後押しすることが予想されます。
市場抑制要因
代替品・コピー品
外付けブラインドは非常に安価です。しかし、市場で利用可能な代替品があります。安価な選択肢としては、タイアップカーテン、ローラーブラインド、シャッターブラインド、ウィンドウフィルム、グラスシェードなどがあります。安価な品物もありますが、耐久性に優れた品物もあります。ローラーシャッターは防犯性に優れ、外付けのブラインドやシェードに比べ、保存期間も長いです。しかし、キャンペーンやマーケティングによって消費者の認知度を高めることで、大手メーカーはこの課題を克服し、外付けブラインド業界の新たな展望を手にすることができるかもしれないです。
製品の展望
製品別に見ると、ブラインド市場は、バーチカルブラインド、パネルブラインド、コード付きブラインド、ベネチアンブラインド、ローラーブラインド、その他に分けられます。垂直ブラインドセグメントは、2021年に外部ブラインド市場でかなりの収益シェアを獲得しました。垂直ブラインドの傾きと角度の機能は、他のブラインドのものよりも優れています。垂直ブラインドの清掃は簡単です。布製であれば、スラットを簡単に取り外して洗濯・乾燥することができます。その他の素材は、軽くホコリを払ったり、湿らせた布で拭いたりするだけです。縦型ブラインドは、このような利点があるため、市場はこの分野で加速しているのです。
素材別の展望
素材タイプに基づき、外付けブラインド市場は金属、木材、プラスチック、その他に区分されます。2021年、木材セグメントは、外部ブラインド市場で顕著な収益シェアを獲得しました。強靭性、快適性の向上、審美的な魅力などの利点が、急成長の原因とされています。家具の生産に最も頻繁に利用される原材料の1つは、木材です。家庭の装飾品に最もよく使われる素材のひとつが木材です。
アプリケーションの展望
用途に基づき、外付けブラインド市場は住宅用と商業用に分けられます。2021年には、商業セグメントが外部ブラインド市場のかなりの収益シェアをカバーしました。世界の旅行・観光セクターがもたらすホテルやレストランの増加により、同製品の可能性が高まっています。また、ショッピングモールや小売施設、職場の増加により、世界的に市場が活性化しています。また、商業ビルのオーナーがビルの外観を魅力的にしたいと考えるようになり、需要が高まっています。
オペレーティングシステムの展望
外付けブラインド市場は、オペレーティングシステムに基づいて、自動と手動に分けられます。2021年では、手動操作システムセグメントが最も収益シェアが高いです。位置や調整が手で操作できるため、面倒な手順を踏まずにブラインドの高さを低くしたり高くしたりすることが容易です。コードレスやショートコード式の窓用カバーリングの安全機能が向上したため、消費者は依然として手動式の窓用カバーリングを好んで使用しています。スマートデバイスの利用拡大やスマートホームのアイデアの復活により、住宅・商業の両分野でスマートウィンドウカバーが使用されることがさらに促進されるでしょう。
設置の見通し
外付けブラインド市場は、設置場所に基づいて、新築と後付けに分けられます。2021年の市場では、後付けセグメントが最大の収益シェアを獲得しました。家のリフォームは、新しい家を買うよりも人気が出てきています。不動産価格や住宅ローン金利に関連する支出が多いため、顧客は住宅リフォームに目を向けるようになっています。例えば、RubyHomeによると、米国の住宅所有者は2021年に住宅の改善に平均10,341米ドルを費やし、前年比25%増となっています。
地域別の展望
外付けブラインド市場は地域別に、北米、欧州、アジア太平洋、LAMEAに分類されます。2021年の外付けブラインド市場では、北米地域が最大の収益シェアを占めています。最も効率的で費用対効果の高いウィンドウトリートメントのオプションは、ウィンドウシェードとブラインドです。また、シェードの設置により、効果的な省エネが促進されます。例えば、隣の壁や窓際にぴったりとブラインドを設置することで、熱の吸収と損失の両方を抑える密閉性が得られます。米国エネルギー省(DOE)は、明るい色のドレープカーテンと白いプラスチックの組み合わせで、太陽熱を33%カットすることができると主張しています。
目次
第1章 市場の範囲と調査手法
- 市場の定義
- 目的
- 市場規模
- セグメンテーション
- 外付けブラインドの世界市場、OS別
- 外付けブラインドの世界市場:素材別
- 外付けブラインドの世界市場、設置場所別
- 外付けブラインドの世界市場:用途別
- 外部ブラインドの世界市場:製品別
- 外部ブラインドの世界市場:地域別
- 調査手法
第2章 市場概要
- イントロダクション
- 概要説明
- 市場の構成とシナリオ
- 概要説明
- 市場に影響を与える主な要因
- 市場促進要因
- 市場の抑制要因
第3章 外付けブラインドの世界市場:オペレーティングシステム別
- マニュアルの世界市場:地域別
- 世界の自動運転市場:地域別
第4章 外付けブラインドの世界市場素材別
- 金属製の世界市場:地域別
- 木材の世界市場:地域別
- プラスチックの世界市場:地域別
- 世界の地域別その他市場
第5章 外付けブラインドの世界市場:設置方法別
- レトロフィットの世界市場:地域別
- 世界の新築市場:地域別
第6章 外付けブラインドの世界市場用途別
- 住宅用ブラインドの世界市場:地域別
- 商業施設の世界市場:地域別
第7章 外付けブラインドの世界市場製品別
- ローラーブラインドの世界市場:地域別
- ベネチアンブラインドの世界市場:地域別
- コード付きブラインドの世界市場:地域別
- パネルブラインドの世界市場:地域別
- バーチカルブラインドの世界市場:地域別
- その他の地域別世界市場
第8章 外付けブラインドの世界市場:地域別市場
- 北米
- 北米の外付けブラインドの国別市場
- 米国
- カナダ
- メキシコ
- その他北米地域
- 北米の外付けブラインドの国別市場
- 欧州
- 欧州の外付けブラインドの国別市場
- ドイツ
- 英国
- フランス
- ロシア
- スペイン
- イタリア
- その他欧州
- 欧州の外付けブラインドの国別市場
- アジア太平洋地域
- アジア太平洋地域の外付けブラインドの国別市場
- 中国
- 日本
- インド
- 韓国
- シンガポール
- マレーシア
- その他アジア太平洋地域
- アジア太平洋地域の外付けブラインドの国別市場
- LAMEA
- LAMEAの外付けブラインドの国別市場
- ブラジル
- アルゼンチン
- UAE
- サウジアラビア
- 南アフリカ
- ナイジェリア
- LAMEAの他の地域
- LAMEAの外付けブラインドの国別市場
第9章 企業プロファイル
- Hunter Douglas N.V.(3G Capital)
- StellaGroup, SAS(PAI Partners SAS)
- Griesser AG
- Country Blinds Pty Ltd.
- MHZ Hachtel GmbH & Co. KG
- ZALUZIE NEVA s.r.o
- Schenker Storen AG
- Verano B.V
- WAREMA Renkhoff SE
LIST OF TABLES
- TABLE 1 Global External Blinds Market, 2018 - 2021, USD Million
- TABLE 2 Global External Blinds Market, 2022 - 2028, USD Million
- TABLE 3 Global External Blinds Market by Operating System, 2018 - 2021, USD Million
- TABLE 4 Global External Blinds Market by Operating System, 2022 - 2028, USD Million
- TABLE 5 Global Manual Market by Region, 2018 - 2021, USD Million
- TABLE 6 Global Manual Market by Region, 2022 - 2028, USD Million
- TABLE 7 Global Automatic Market by Region, 2018 - 2021, USD Million
- TABLE 8 Global Automatic Market by Region, 2022 - 2028, USD Million
- TABLE 9 Global External Blinds Market by Material, 2018 - 2021, USD Million
- TABLE 10 Global External Blinds Market by Material, 2022 - 2028, USD Million
- TABLE 11 Global Metal Market by Region, 2018 - 2021, USD Million
- TABLE 12 Global Metal Market by Region, 2022 - 2028, USD Million
- TABLE 13 Global Wood Market by Region, 2018 - 2021, USD Million
- TABLE 14 Global Wood Market by Region, 2022 - 2028, USD Million
- TABLE 15 Global Plastic Market by Region, 2018 - 2021, USD Million
- TABLE 16 Global Plastic Market by Region, 2022 - 2028, USD Million
- TABLE 17 Global Others Market by Region, 2018 - 2021, USD Million
- TABLE 18 Global Others Market by Region, 2022 - 2028, USD Million
- TABLE 19 Global External Blinds Market by Installation, 2018 - 2021, USD Million
- TABLE 20 Global External Blinds Market by Installation, 2022 - 2028, USD Million
- TABLE 21 Global Retro-fit Market by Region, 2018 - 2021, USD Million
- TABLE 22 Global Retro-fit Market by Region, 2022 - 2028, USD Million
- TABLE 23 Global New Construction Market by Region, 2018 - 2021, USD Million
- TABLE 24 Global New Construction Market by Region, 2022 - 2028, USD Million
- TABLE 25 Global External Blinds Market by Application, 2018 - 2021, USD Million
- TABLE 26 Global External Blinds Market by Application, 2022 - 2028, USD Million
- TABLE 27 Global Residential Market by Region, 2018 - 2021, USD Million
- TABLE 28 Global Residential Market by Region, 2022 - 2028, USD Million
- TABLE 29 Global Commercial Market by Region, 2018 - 2021, USD Million
- TABLE 30 Global Commercial Market by Region, 2022 - 2028, USD Million
- TABLE 31 Global External Blinds Market by Product, 2018 - 2021, USD Million
- TABLE 32 Global External Blinds Market by Product, 2022 - 2028, USD Million
- TABLE 33 Global Roller Blinds Market by Region, 2018 - 2021, USD Million
- TABLE 34 Global Roller Blinds Market by Region, 2022 - 2028, USD Million
- TABLE 35 Global Venetian Blinds Market by Region, 2018 - 2021, USD Million
- TABLE 36 Global Venetian Blinds Market by Region, 2022 - 2028, USD Million
- TABLE 37 Global Corded Blinds Market by Region, 2018 - 2021, USD Million
- TABLE 38 Global Corded Blinds Market by Region, 2022 - 2028, USD Million
- TABLE 39 Global Panel Blinds Market by Region, 2018 - 2021, USD Million
- TABLE 40 Global Panel Blinds Market by Region, 2022 - 2028, USD Million
- TABLE 41 Global Vertical Blinds Market by Region, 2018 - 2021, USD Million
- TABLE 42 Global Vertical Blinds Market by Region, 2022 - 2028, USD Million
- TABLE 43 Global Others Market by Region, 2018 - 2021, USD Million
- TABLE 44 Global Others Market by Region, 2022 - 2028, USD Million
- TABLE 45 Global External Blinds Market by Region, 2018 - 2021, USD Million
- TABLE 46 Global External Blinds Market by Region, 2022 - 2028, USD Million
- TABLE 47 North America External Blinds Market, 2018 - 2021, USD Million
- TABLE 48 North America External Blinds Market, 2022 - 2028, USD Million
- TABLE 49 North America External Blinds Market by Operating System, 2018 - 2021, USD Million
- TABLE 50 North America External Blinds Market by Operating System, 2022 - 2028, USD Million
- TABLE 51 North America Manual Market by Country, 2018 - 2021, USD Million
- TABLE 52 North America Manual Market by Country, 2022 - 2028, USD Million
- TABLE 53 North America Automatic Market by Country, 2018 - 2021, USD Million
- TABLE 54 North America Automatic Market by Country, 2022 - 2028, USD Million
- TABLE 55 North America External Blinds Market by Material, 2018 - 2021, USD Million
- TABLE 56 North America External Blinds Market by Material, 2022 - 2028, USD Million
- TABLE 57 North America Metal Market by Country, 2018 - 2021, USD Million
- TABLE 58 North America Metal Market by Country, 2022 - 2028, USD Million
- TABLE 59 North America Wood Market by Country, 2018 - 2021, USD Million
- TABLE 60 North America Wood Market by Country, 2022 - 2028, USD Million
- TABLE 61 North America Plastic Market by Country, 2018 - 2021, USD Million
- TABLE 62 North America Plastic Market by Country, 2022 - 2028, USD Million
- TABLE 63 North America Others Market by Country, 2018 - 2021, USD Million
- TABLE 64 North America Others Market by Country, 2022 - 2028, USD Million
- TABLE 65 North America External Blinds Market by Installation, 2018 - 2021, USD Million
- TABLE 66 North America External Blinds Market by Installation, 2022 - 2028, USD Million
- TABLE 67 North America Retro-fit Market by Country, 2018 - 2021, USD Million
- TABLE 68 North America Retro-fit Market by Country, 2022 - 2028, USD Million
- TABLE 69 North America New Construction Market by Country, 2018 - 2021, USD Million
- TABLE 70 North America New Construction Market by Country, 2022 - 2028, USD Million
- TABLE 71 North America External Blinds Market by Application, 2018 - 2021, USD Million
- TABLE 72 North America External Blinds Market by Application, 2022 - 2028, USD Million
- TABLE 73 North America Residential Market by Country, 2018 - 2021, USD Million
- TABLE 74 North America Residential Market by Country, 2022 - 2028, USD Million
- TABLE 75 North America Commercial Market by Country, 2018 - 2021, USD Million
- TABLE 76 North America Commercial Market by Country, 2022 - 2028, USD Million
- TABLE 77 North America External Blinds Market by Product, 2018 - 2021, USD Million
- TABLE 78 North America External Blinds Market by Product, 2022 - 2028, USD Million
- TABLE 79 North America Roller Blinds Market by Country, 2018 - 2021, USD Million
- TABLE 80 North America Roller Blinds Market by Country, 2022 - 2028, USD Million
- TABLE 81 North America Venetian Blinds Market by Country, 2018 - 2021, USD Million
- TABLE 82 North America Venetian Blinds Market by Country, 2022 - 2028, USD Million
- TABLE 83 North America Corded Blinds Market by Country, 2018 - 2021, USD Million
- TABLE 84 North America Corded Blinds Market by Country, 2022 - 2028, USD Million
- TABLE 85 North America Panel Blinds Market by Country, 2018 - 2021, USD Million
- TABLE 86 North America Panel Blinds Market by Country, 2022 - 2028, USD Million
- TABLE 87 North America Vertical Blinds Market by Country, 2018 - 2021, USD Million
- TABLE 88 North America Vertical Blinds Market by Country, 2022 - 2028, USD Million
- TABLE 89 North America Others Market by Country, 2018 - 2021, USD Million
- TABLE 90 North America Others Market by Country, 2022 - 2028, USD Million
- TABLE 91 North America External Blinds Market by Country, 2018 - 2021, USD Million
- TABLE 92 North America External Blinds Market by Country, 2022 - 2028, USD Million
- TABLE 93 US External Blinds Market, 2018 - 2021, USD Million
- TABLE 94 US External Blinds Market, 2022 - 2028, USD Million
- TABLE 95 US External Blinds Market by Operating System, 2018 - 2021, USD Million
- TABLE 96 US External Blinds Market by Operating System, 2022 - 2028, USD Million
- TABLE 97 US External Blinds Market by Material, 2018 - 2021, USD Million
- TABLE 98 US External Blinds Market by Material, 2022 - 2028, USD Million
- TABLE 99 US External Blinds Market by Installation, 2018 - 2021, USD Million
- TABLE 100 US External Blinds Market by Installation, 2022 - 2028, USD Million
- TABLE 101 US External Blinds Market by Application, 2018 - 2021, USD Million
- TABLE 102 US External Blinds Market by Application, 2022 - 2028, USD Million
- TABLE 103 US External Blinds Market by Product, 2018 - 2021, USD Million
- TABLE 104 US External Blinds Market by Product, 2022 - 2028, USD Million
- TABLE 105 Canada External Blinds Market, 2018 - 2021, USD Million
- TABLE 106 Canada External Blinds Market, 2022 - 2028, USD Million
- TABLE 107 Canada External Blinds Market by Operating System, 2018 - 2021, USD Million
- TABLE 108 Canada External Blinds Market by Operating System, 2022 - 2028, USD Million
- TABLE 109 Canada External Blinds Market by Material, 2018 - 2021, USD Million
- TABLE 110 Canada External Blinds Market by Material, 2022 - 2028, USD Million
- TABLE 111 Canada External Blinds Market by Installation, 2018 - 2021, USD Million
- TABLE 112 Canada External Blinds Market by Installation, 2022 - 2028, USD Million
- TABLE 113 Canada External Blinds Market by Application, 2018 - 2021, USD Million
- TABLE 114 Canada External Blinds Market by Application, 2022 - 2028, USD Million
- TABLE 115 Canada External Blinds Market by Product, 2018 - 2021, USD Million
- TABLE 116 Canada External Blinds Market by Product, 2022 - 2028, USD Million
- TABLE 117 Mexico External Blinds Market, 2018 - 2021, USD Million
- TABLE 118 Mexico External Blinds Market, 2022 - 2028, USD Million
- TABLE 119 Mexico External Blinds Market by Operating System, 2018 - 2021, USD Million
- TABLE 120 Mexico External Blinds Market by Operating System, 2022 - 2028, USD Million
- TABLE 121 Mexico External Blinds Market by Material, 2018 - 2021, USD Million
- TABLE 122 Mexico External Blinds Market by Material, 2022 - 2028, USD Million
- TABLE 123 Mexico External Blinds Market by Installation, 2018 - 2021, USD Million
- TABLE 124 Mexico External Blinds Market by Installation, 2022 - 2028, USD Million
- TABLE 125 Mexico External Blinds Market by Application, 2018 - 2021, USD Million
- TABLE 126 Mexico External Blinds Market by Application, 2022 - 2028, USD Million
- TABLE 127 Mexico External Blinds Market by Product, 2018 - 2021, USD Million
- TABLE 128 Mexico External Blinds Market by Product, 2022 - 2028, USD Million
- TABLE 129 Rest of North America External Blinds Market, 2018 - 2021, USD Million
- TABLE 130 Rest of North America External Blinds Market, 2022 - 2028, USD Million
- TABLE 131 Rest of North America External Blinds Market by Operating System, 2018 - 2021, USD Million
- TABLE 132 Rest of North America External Blinds Market by Operating System, 2022 - 2028, USD Million
- TABLE 133 Rest of North America External Blinds Market by Material, 2018 - 2021, USD Million
- TABLE 134 Rest of North America External Blinds Market by Material, 2022 - 2028, USD Million
- TABLE 135 Rest of North America External Blinds Market by Installation, 2018 - 2021, USD Million
- TABLE 136 Rest of North America External Blinds Market by Installation, 2022 - 2028, USD Million
- TABLE 137 Rest of North America External Blinds Market by Application, 2018 - 2021, USD Million
- TABLE 138 Rest of North America External Blinds Market by Application, 2022 - 2028, USD Million
- TABLE 139 Rest of North America External Blinds Market by Product, 2018 - 2021, USD Million
- TABLE 140 Rest of North America External Blinds Market by Product, 2022 - 2028, USD Million
- TABLE 141 Europe External Blinds Market, 2018 - 2021, USD Million
- TABLE 142 Europe External Blinds Market, 2022 - 2028, USD Million
- TABLE 143 Europe External Blinds Market by Operating System, 2018 - 2021, USD Million
- TABLE 144 Europe External Blinds Market by Operating System, 2022 - 2028, USD Million
- TABLE 145 Europe Manual Market by Country, 2018 - 2021, USD Million
- TABLE 146 Europe Manual Market by Country, 2022 - 2028, USD Million
- TABLE 147 Europe Automatic Market by Country, 2018 - 2021, USD Million
- TABLE 148 Europe Automatic Market by Country, 2022 - 2028, USD Million
- TABLE 149 Europe External Blinds Market by Material, 2018 - 2021, USD Million
- TABLE 150 Europe External Blinds Market by Material, 2022 - 2028, USD Million
- TABLE 151 Europe Metal Market by Country, 2018 - 2021, USD Million
- TABLE 152 Europe Metal Market by Country, 2022 - 2028, USD Million
- TABLE 153 Europe Wood Market by Country, 2018 - 2021, USD Million
- TABLE 154 Europe Wood Market by Country, 2022 - 2028, USD Million
- TABLE 155 Europe Plastic Market by Country, 2018 - 2021, USD Million
- TABLE 156 Europe Plastic Market by Country, 2022 - 2028, USD Million
- TABLE 157 Europe Others Market by Country, 2018 - 2021, USD Million
- TABLE 158 Europe Others Market by Country, 2022 - 2028, USD Million
- TABLE 159 Europe External Blinds Market by Installation, 2018 - 2021, USD Million
- TABLE 160 Europe External Blinds Market by Installation, 2022 - 2028, USD Million
- TABLE 161 Europe Retro-fit Market by Country, 2018 - 2021, USD Million
- TABLE 162 Europe Retro-fit Market by Country, 2022 - 2028, USD Million
- TABLE 163 Europe New Construction Market by Country, 2018 - 2021, USD Million
- TABLE 164 Europe New Construction Market by Country, 2022 - 2028, USD Million
- TABLE 165 Europe External Blinds Market by Application, 2018 - 2021, USD Million
- TABLE 166 Europe External Blinds Market by Application, 2022 - 2028, USD Million
- TABLE 167 Europe Residential Market by Country, 2018 - 2021, USD Million
- TABLE 168 Europe Residential Market by Country, 2022 - 2028, USD Million
- TABLE 169 Europe Commercial Market by Country, 2018 - 2021, USD Million
- TABLE 170 Europe Commercial Market by Country, 2022 - 2028, USD Million
- TABLE 171 Europe External Blinds Market by Product, 2018 - 2021, USD Million
- TABLE 172 Europe External Blinds Market by Product, 2022 - 2028, USD Million
- TABLE 173 Europe Roller Blinds Market by Country, 2018 - 2021, USD Million
- TABLE 174 Europe Roller Blinds Market by Country, 2022 - 2028, USD Million
- TABLE 175 Europe Venetian Blinds Market by Country, 2018 - 2021, USD Million
- TABLE 176 Europe Venetian Blinds Market by Country, 2022 - 2028, USD Million
- TABLE 177 Europe Corded Blinds Market by Country, 2018 - 2021, USD Million
- TABLE 178 Europe Corded Blinds Market by Country, 2022 - 2028, USD Million
- TABLE 179 Europe Panel Blinds Market by Country, 2018 - 2021, USD Million
- TABLE 180 Europe Panel Blinds Market by Country, 2022 - 2028, USD Million
- TABLE 181 Europe Vertical Blinds Market by Country, 2018 - 2021, USD Million
- TABLE 182 Europe Vertical Blinds Market by Country, 2022 - 2028, USD Million
- TABLE 183 Europe Others Market by Country, 2018 - 2021, USD Million
- TABLE 184 Europe Others Market by Country, 2022 - 2028, USD Million
- TABLE 185 Europe External Blinds Market by Country, 2018 - 2021, USD Million
- TABLE 186 Europe External Blinds Market by Country, 2022 - 2028, USD Million
- TABLE 187 Germany External Blinds Market, 2018 - 2021, USD Million
- TABLE 188 Germany External Blinds Market, 2022 - 2028, USD Million
- TABLE 189 Germany External Blinds Market by Operating System, 2018 - 2021, USD Million
- TABLE 190 Germany External Blinds Market by Operating System, 2022 - 2028, USD Million
- TABLE 191 Germany External Blinds Market by Material, 2018 - 2021, USD Million
- TABLE 192 Germany External Blinds Market by Material, 2022 - 2028, USD Million
- TABLE 193 Germany External Blinds Market by Installation, 2018 - 2021, USD Million
- TABLE 194 Germany External Blinds Market by Installation, 2022 - 2028, USD Million
- TABLE 195 Germany External Blinds Market by Application, 2018 - 2021, USD Million
- TABLE 196 Germany External Blinds Market by Application, 2022 - 2028, USD Million
- TABLE 197 Germany External Blinds Market by Product, 2018 - 2021, USD Million
- TABLE 198 Germany External Blinds Market by Product, 2022 - 2028, USD Million
- TABLE 199 UK External Blinds Market, 2018 - 2021, USD Million
- TABLE 200 UK External Blinds Market, 2022 - 2028, USD Million
- TABLE 201 UK External Blinds Market by Operating System, 2018 - 2021, USD Million
- TABLE 202 UK External Blinds Market by Operating System, 2022 - 2028, USD Million
- TABLE 203 UK External Blinds Market by Material, 2018 - 2021, USD Million
- TABLE 204 UK External Blinds Market by Material, 2022 - 2028, USD Million
- TABLE 205 UK External Blinds Market by Installation, 2018 - 2021, USD Million
- TABLE 206 UK External Blinds Market by Installation, 2022 - 2028, USD Million
- TABLE 207 UK External Blinds Market by Application, 2018 - 2021, USD Million
- TABLE 208 UK External Blinds Market by Application, 2022 - 2028, USD Million
- TABLE 209 UK External Blinds Market by Product, 2018 - 2021, USD Million
- TABLE 210 UK External Blinds Market by Product, 2022 - 2028, USD Million
- TABLE 211 France External Blinds Market, 2018 - 2021, USD Million
- TABLE 212 France External Blinds Market, 2022 - 2028, USD Million
- TABLE 213 France External Blinds Market by Operating System, 2018 - 2021, USD Million
- TABLE 214 France External Blinds Market by Operating System, 2022 - 2028, USD Million
- TABLE 215 France External Blinds Market by Material, 2018 - 2021, USD Million
- TABLE 216 France External Blinds Market by Material, 2022 - 2028, USD Million
- TABLE 217 France External Blinds Market by Installation, 2018 - 2021, USD Million
- TABLE 218 France External Blinds Market by Installation, 2022 - 2028, USD Million
- TABLE 219 France External Blinds Market by Application, 2018 - 2021, USD Million
- TABLE 220 France External Blinds Market by Application, 2022 - 2028, USD Million
- TABLE 221 France External Blinds Market by Product, 2018 - 2021, USD Million
- TABLE 222 France External Blinds Market by Product, 2022 - 2028, USD Million
- TABLE 223 Russia External Blinds Market, 2018 - 2021, USD Million
- TABLE 224 Russia External Blinds Market, 2022 - 2028, USD Million
- TABLE 225 Russia External Blinds Market by Operating System, 2018 - 2021, USD Million
- TABLE 226 Russia External Blinds Market by Operating System, 2022 - 2028, USD Million
- TABLE 227 Russia External Blinds Market by Material, 2018 - 2021, USD Million
- TABLE 228 Russia External Blinds Market by Material, 2022 - 2028, USD Million
- TABLE 229 Russia External Blinds Market by Installation, 2018 - 2021, USD Million
- TABLE 230 Russia External Blinds Market by Installation, 2022 - 2028, USD Million
- TABLE 231 Russia External Blinds Market by Application, 2018 - 2021, USD Million
- TABLE 232 Russia External Blinds Market by Application, 2022 - 2028, USD Million
- TABLE 233 Russia External Blinds Market by Product, 2018 - 2021, USD Million
- TABLE 234 Russia External Blinds Market by Product, 2022 - 2028, USD Million
- TABLE 235 Spain External Blinds Market, 2018 - 2021, USD Million
- TABLE 236 Spain External Blinds Market, 2022 - 2028, USD Million
- TABLE 237 Spain External Blinds Market by Operating System, 2018 - 2021, USD Million
- TABLE 238 Spain External Blinds Market by Operating System, 2022 - 2028, USD Million
- TABLE 239 Spain External Blinds Market by Material, 2018 - 2021, USD Million
- TABLE 240 Spain External Blinds Market by Material, 2022 - 2028, USD Million
- TABLE 241 Spain External Blinds Market by Installation, 2018 - 2021, USD Million
- TABLE 242 Spain External Blinds Market by Installation, 2022 - 2028, USD Million
- TABLE 243 Spain External Blinds Market by Application, 2018 - 2021, USD Million
- TABLE 244 Spain External Blinds Market by Application, 2022 - 2028, USD Million
- TABLE 245 Spain External Blinds Market by Product, 2018 - 2021, USD Million
- TABLE 246 Spain External Blinds Market by Product, 2022 - 2028, USD Million
- TABLE 247 Italy External Blinds Market, 2018 - 2021, USD Million
- TABLE 248 Italy External Blinds Market, 2022 - 2028, USD Million
- TABLE 249 Italy External Blinds Market by Operating System, 2018 - 2021, USD Million
- TABLE 250 Italy External Blinds Market by Operating System, 2022 - 2028, USD Million
- TABLE 251 Italy External Blinds Market by Material, 2018 - 2021, USD Million
- TABLE 252 Italy External Blinds Market by Material, 2022 - 2028, USD Million
- TABLE 253 Italy External Blinds Market by Installation, 2018 - 2021, USD Million
- TABLE 254 Italy External Blinds Market by Installation, 2022 - 2028, USD Million
- TABLE 255 Italy External Blinds Market by Application, 2018 - 2021, USD Million
- TABLE 256 Italy External Blinds Market by Application, 2022 - 2028, USD Million
- TABLE 257 Italy External Blinds Market by Product, 2018 - 2021, USD Million
- TABLE 258 Italy External Blinds Market by Product, 2022 - 2028, USD Million
- TABLE 259 Rest of Europe External Blinds Market, 2018 - 2021, USD Million
- TABLE 260 Rest of Europe External Blinds Market, 2022 - 2028, USD Million
- TABLE 261 Rest of Europe External Blinds Market by Operating System, 2018 - 2021, USD Million
- TABLE 262 Rest of Europe External Blinds Market by Operating System, 2022 - 2028, USD Million
- TABLE 263 Rest of Europe External Blinds Market by Material, 2018 - 2021, USD Million
- TABLE 264 Rest of Europe External Blinds Market by Material, 2022 - 2028, USD Million
- TABLE 265 Rest of Europe External Blinds Market by Installation, 2018 - 2021, USD Million
- TABLE 266 Rest of Europe External Blinds Market by Installation, 2022 - 2028, USD Million
- TABLE 267 Rest of Europe External Blinds Market by Application, 2018 - 2021, USD Million
- TABLE 268 Rest of Europe External Blinds Market by Application, 2022 - 2028, USD Million
- TABLE 269 Rest of Europe External Blinds Market by Product, 2018 - 2021, USD Million
- TABLE 270 Rest of Europe External Blinds Market by Product, 2022 - 2028, USD Million
- TABLE 271 Asia Pacific External Blinds Market, 2018 - 2021, USD Million
- TABLE 272 Asia Pacific External Blinds Market, 2022 - 2028, USD Million
- TABLE 273 Asia Pacific External Blinds Market by Operating System, 2018 - 2021, USD Million
- TABLE 274 Asia Pacific External Blinds Market by Operating System, 2022 - 2028, USD Million
- TABLE 275 Asia Pacific Manual Market by Country, 2018 - 2021, USD Million
- TABLE 276 Asia Pacific Manual Market by Country, 2022 - 2028, USD Million
- TABLE 277 Asia Pacific Automatic Market by Country, 2018 - 2021, USD Million
- TABLE 278 Asia Pacific Automatic Market by Country, 2022 - 2028, USD Million
- TABLE 279 Asia Pacific External Blinds Market by Material, 2018 - 2021, USD Million
- TABLE 280 Asia Pacific External Blinds Market by Material, 2022 - 2028, USD Million
- TABLE 281 Asia Pacific Metal Market by Country, 2018 - 2021, USD Million
- TABLE 282 Asia Pacific Metal Market by Country, 2022 - 2028, USD Million
- TABLE 283 Asia Pacific Wood Market by Country, 2018 - 2021, USD Million
- TABLE 284 Asia Pacific Wood Market by Country, 2022 - 2028, USD Million
- TABLE 285 Asia Pacific Plastic Market by Country, 2018 - 2021, USD Million
- TABLE 286 Asia Pacific Plastic Market by Country, 2022 - 2028, USD Million
- TABLE 287 Asia Pacific Others Market by Country, 2018 - 2021, USD Million
- TABLE 288 Asia Pacific Others Market by Country, 2022 - 2028, USD Million
- TABLE 289 Asia Pacific External Blinds Market by Installation, 2018 - 2021, USD Million
- TABLE 290 Asia Pacific External Blinds Market by Installation, 2022 - 2028, USD Million
- TABLE 291 Asia Pacific Retro-fit Market by Country, 2018 - 2021, USD Million
- TABLE 292 Asia Pacific Retro-fit Market by Country, 2022 - 2028, USD Million
- TABLE 293 Asia Pacific New Construction Market by Country, 2018 - 2021, USD Million
- TABLE 294 Asia Pacific New Construction Market by Country, 2022 - 2028, USD Million
- TABLE 295 Asia Pacific External Blinds Market by Application, 2018 - 2021, USD Million
- TABLE 296 Asia Pacific External Blinds Market by Application, 2022 - 2028, USD Million
- TABLE 297 Asia Pacific Residential Market by Country, 2018 - 2021, USD Million
- TABLE 298 Asia Pacific Residential Market by Country, 2022 - 2028, USD Million
- TABLE 299 Asia Pacific Commercial Market by Country, 2018 - 2021, USD Million
- TABLE 300 Asia Pacific Commercial Market by Country, 2022 - 2028, USD Million
- TABLE 301 Asia Pacific External Blinds Market by Product, 2018 - 2021, USD Million
- TABLE 302 Asia Pacific External Blinds Market by Product, 2022 - 2028, USD Million
- TABLE 303 Asia Pacific Roller Blinds Market by Country, 2018 - 2021, USD Million
- TABLE 304 Asia Pacific Roller Blinds Market by Country, 2022 - 2028, USD Million
- TABLE 305 Asia Pacific Venetian Blinds Market by Country, 2018 - 2021, USD Million
- TABLE 306 Asia Pacific Venetian Blinds Market by Country, 2022 - 2028, USD Million
- TABLE 307 Asia Pacific Corded Blinds Market by Country, 2018 - 2021, USD Million
- TABLE 308 Asia Pacific Corded Blinds Market by Country, 2022 - 2028, USD Million
- TABLE 309 Asia Pacific Panel Blinds Market by Country, 2018 - 2021, USD Million
- TABLE 310 Asia Pacific Panel Blinds Market by Country, 2022 - 2028, USD Million
- TABLE 311 Asia Pacific Vertical Blinds Market by Country, 2018 - 2021, USD Million
- TABLE 312 Asia Pacific Vertical Blinds Market by Country, 2022 - 2028, USD Million
- TABLE 313 Asia Pacific Others Market by Country, 2018 - 2021, USD Million
- TABLE 314 Asia Pacific Others Market by Country, 2022 - 2028, USD Million
- TABLE 315 Asia Pacific External Blinds Market by Country, 2018 - 2021, USD Million
- TABLE 316 Asia Pacific External Blinds Market by Country, 2022 - 2028, USD Million
- TABLE 317 China External Blinds Market, 2018 - 2021, USD Million
- TABLE 318 China External Blinds Market, 2022 - 2028, USD Million
- TABLE 319 China External Blinds Market by Operating System, 2018 - 2021, USD Million
- TABLE 320 China External Blinds Market by Operating System, 2022 - 2028, USD Million
- TABLE 321 China External Blinds Market by Material, 2018 - 2021, USD Million
- TABLE 322 China External Blinds Market by Material, 2022 - 2028, USD Million
- TABLE 323 China External Blinds Market by Installation, 2018 - 2021, USD Million
- TABLE 324 China External Blinds Market by Installation, 2022 - 2028, USD Million
- TABLE 325 China External Blinds Market by Application, 2018 - 2021, USD Million
- TABLE 326 China External Blinds Market by Application, 2022 - 2028, USD Million
- TABLE 327 China External Blinds Market by Product, 2018 - 2021, USD Million
- TABLE 328 China External Blinds Market by Product, 2022 - 2028, USD Million
- TABLE 329 Japan External Blinds Market, 2018 - 2021, USD Million
- TABLE 330 Japan External Blinds Market, 2022 - 2028, USD Million
- TABLE 331 Japan External Blinds Market by Operating System, 2018 - 2021, USD Million
- TABLE 332 Japan External Blinds Market by Operating System, 2022 - 2028, USD Million
- TABLE 333 Japan External Blinds Market by Material, 2018 - 2021, USD Million
- TABLE 334 Japan External Blinds Market by Material, 2022 - 2028, USD Million
- TABLE 335 Japan External Blinds Market by Installation, 2018 - 2021, USD Million
- TABLE 336 Japan External Blinds Market by Installation, 2022 - 2028, USD Million
- TABLE 337 Japan External Blinds Market by Application, 2018 - 2021, USD Million
- TABLE 338 Japan External Blinds Market by Application, 2022 - 2028, USD Million
- TABLE 339 Japan External Blinds Market by Product, 2018 - 2021, USD Million
- TABLE 340 Japan External Blinds Market by Product, 2022 - 2028, USD Million
- TABLE 341 India External Blinds Market, 2018 - 2021, USD Million
- TABLE 342 India External Blinds Market, 2022 - 2028, USD Million
- TABLE 343 India External Blinds Market by Operating System, 2018 - 2021, USD Million
- TABLE 344 India External Blinds Market by Operating System, 2022 - 2028, USD Million
- TABLE 345 India External Blinds Market by Material, 2018 - 2021, USD Million
- TABLE 346 India External Blinds Market by Material, 2022 - 2028, USD Million
- TABLE 347 India External Blinds Market by Installation, 2018 - 2021, USD Million
- TABLE 348 India External Blinds Market by Installation, 2022 - 2028, USD Million
- TABLE 349 India External Blinds Market by Application, 2018 - 2021, USD Million
- TABLE 350 India External Blinds Market by Application, 2022 - 2028, USD Million
- TABLE 351 India External Blinds Market by Product, 2018 - 2021, USD Million
- TABLE 352 India External Blinds Market by Product, 2022 - 2028, USD Million
- TABLE 353 South Korea External Blinds Market, 2018 - 2021, USD Million
- TABLE 354 South Korea External Blinds Market, 2022 - 2028, USD Million
- TABLE 355 South Korea External Blinds Market by Operating System, 2018 - 2021, USD Million
- TABLE 356 South Korea External Blinds Market by Operating System, 2022 - 2028, USD Million
- TABLE 357 South Korea External Blinds Market by Material, 2018 - 2021, USD Million
- TABLE 358 South Korea External Blinds Market by Material, 2022 - 2028, USD Million
- TABLE 359 South Korea External Blinds Market by Installation, 2018 - 2021, USD Million
- TABLE 360 South Korea External Blinds Market by Installation, 2022 - 2028, USD Million
- TABLE 361 South Korea External Blinds Market by Application, 2018 - 2021, USD Million
- TABLE 362 South Korea External Blinds Market by Application, 2022 - 2028, USD Million
- TABLE 363 South Korea External Blinds Market by Product, 2018 - 2021, USD Million
- TABLE 364 South Korea External Blinds Market by Product, 2022 - 2028, USD Million
- TABLE 365 Singapore External Blinds Market, 2018 - 2021, USD Million
- TABLE 366 Singapore External Blinds Market, 2022 - 2028, USD Million
- TABLE 367 Singapore External Blinds Market by Operating System, 2018 - 2021, USD Million
- TABLE 368 Singapore External Blinds Market by Operating System, 2022 - 2028, USD Million
- TABLE 369 Singapore External Blinds Market by Material, 2018 - 2021, USD Million
- TABLE 370 Singapore External Blinds Market by Material, 2022 - 2028, USD Million
- TABLE 371 Singapore External Blinds Market by Installation, 2018 - 2021, USD Million
- TABLE 372 Singapore External Blinds Market by Installation, 2022 - 2028, USD Million
- TABLE 373 Singapore External Blinds Market by Application, 2018 - 2021, USD Million
- TABLE 374 Singapore External Blinds Market by Application, 2022 - 2028, USD Million
- TABLE 375 Singapore External Blinds Market by Product, 2018 - 2021, USD Million
- TABLE 376 Singapore External Blinds Market by Product, 2022 - 2028, USD Million
- TABLE 377 Malaysia External Blinds Market, 2018 - 2021, USD Million
- TABLE 378 Malaysia External Blinds Market, 2022 - 2028, USD Million
- TABLE 379 Malaysia External Blinds Market by Operating System, 2018 - 2021, USD Million
- TABLE 380 Malaysia External Blinds Market by Operating System, 2022 - 2028, USD Million
- TABLE 381 Malaysia External Blinds Market by Material, 2018 - 2021, USD Million
- TABLE 382 Malaysia External Blinds Market by Material, 2022 - 2028, USD Million
- TABLE 383 Malaysia External Blinds Market by Installation, 2018 - 2021, USD Million
- TABLE 384 Malaysia External Blinds Market by Installation, 2022 - 2028, USD Million
- TABLE 385 Malaysia External Blinds Market by Application, 2018 - 2021, USD Million
- TABLE 386 Malaysia External Blinds Market by Application, 2022 - 2028, USD Million
- TABLE 387 Malaysia External Blinds Market by Product, 2018 - 2021, USD Million
- TABLE 388 Malaysia External Blinds Market by Product, 2022 - 2028, USD Million
- TABLE 389 Rest of Asia Pacific External Blinds Market, 2018 - 2021, USD Million
- TABLE 390 Rest of Asia Pacific External Blinds Market, 2022 - 2028, USD Million
- TABLE 391 Rest of Asia Pacific External Blinds Market by Operating System, 2018 - 2021, USD Million
- TABLE 392 Rest of Asia Pacific External Blinds Market by Operating System, 2022 - 2028, USD Million
- TABLE 393 Rest of Asia Pacific External Blinds Market by Material, 2018 - 2021, USD Million
- TABLE 394 Rest of Asia Pacific External Blinds Market by Material, 2022 - 2028, USD Million
- TABLE 395 Rest of Asia Pacific External Blinds Market by Installation, 2018 - 2021, USD Million
- TABLE 396 Rest of Asia Pacific External Blinds Market by Installation, 2022 - 2028, USD Million
- TABLE 397 Rest of Asia Pacific External Blinds Market by Application, 2018 - 2021, USD Million
- TABLE 398 Rest of Asia Pacific External Blinds Market by Application, 2022 - 2028, USD Million
- TABLE 399 Rest of Asia Pacific External Blinds Market by Product, 2018 - 2021, USD Million
- TABLE 400 Rest of Asia Pacific External Blinds Market by Product, 2022 - 2028, USD Million
- TABLE 401 LAMEA External Blinds Market, 2018 - 2021, USD Million
- TABLE 402 LAMEA External Blinds Market, 2022 - 2028, USD Million
- TABLE 403 LAMEA External Blinds Market by Operating System, 2018 - 2021, USD Million
- TABLE 404 LAMEA External Blinds Market by Operating System, 2022 - 2028, USD Million
- TABLE 405 LAMEA Manual Market by Country, 2018 - 2021, USD Million
- TABLE 406 LAMEA Manual Market by Country, 2022 - 2028, USD Million
- TABLE 407 LAMEA Automatic Market by Country, 2018 - 2021, USD Million
- TABLE 408 LAMEA Automatic Market by Country, 2022 - 2028, USD Million
- TABLE 409 LAMEA External Blinds Market by Material, 2018 - 2021, USD Million
- TABLE 410 LAMEA External Blinds Market by Material, 2022 - 2028, USD Million
- TABLE 411 LAMEA Metal Market by Country, 2018 - 2021, USD Million
- TABLE 412 LAMEA Metal Market by Country, 2022 - 2028, USD Million
- TABLE 413 LAMEA Wood Market by Country, 2018 - 2021, USD Million
- TABLE 414 LAMEA Wood Market by Country, 2022 - 2028, USD Million
- TABLE 415 LAMEA Plastic Market by Country, 2018 - 2021, USD Million
- TABLE 416 LAMEA Plastic Market by Country, 2022 - 2028, USD Million
- TABLE 417 LAMEA Others Market by Country, 2018 - 2021, USD Million
- TABLE 418 LAMEA Others Market by Country, 2022 - 2028, USD Million
- TABLE 419 LAMEA External Blinds Market by Installation, 2018 - 2021, USD Million
- TABLE 420 LAMEA External Blinds Market by Installation, 2022 - 2028, USD Million
- TABLE 421 LAMEA Retro-fit Market by Country, 2018 - 2021, USD Million
- TABLE 422 LAMEA Retro-fit Market by Country, 2022 - 2028, USD Million
- TABLE 423 LAMEA New Construction Market by Country, 2018 - 2021, USD Million
- TABLE 424 LAMEA New Construction Market by Country, 2022 - 2028, USD Million
- TABLE 425 LAMEA External Blinds Market by Application, 2018 - 2021, USD Million
- TABLE 426 LAMEA External Blinds Market by Application, 2022 - 2028, USD Million
- TABLE 427 LAMEA Residential Market by Country, 2018 - 2021, USD Million
- TABLE 428 LAMEA Residential Market by Country, 2022 - 2028, USD Million
- TABLE 429 LAMEA Commercial Market by Country, 2018 - 2021, USD Million
- TABLE 430 LAMEA Commercial Market by Country, 2022 - 2028, USD Million
- TABLE 431 LAMEA External Blinds Market by Product, 2018 - 2021, USD Million
- TABLE 432 LAMEA External Blinds Market by Product, 2022 - 2028, USD Million
- TABLE 433 LAMEA Roller Blinds Market by Country, 2018 - 2021, USD Million
- TABLE 434 LAMEA Roller Blinds Market by Country, 2022 - 2028, USD Million
- TABLE 435 LAMEA Venetian Blinds Market by Country, 2018 - 2021, USD Million
- TABLE 436 LAMEA Venetian Blinds Market by Country, 2022 - 2028, USD Million
- TABLE 437 LAMEA Corded Blinds Market by Country, 2018 - 2021, USD Million
- TABLE 438 LAMEA Corded Blinds Market by Country, 2022 - 2028, USD Million
- TABLE 439 LAMEA Panel Blinds Market by Country, 2018 - 2021, USD Million
- TABLE 440 LAMEA Panel Blinds Market by Country, 2022 - 2028, USD Million
- TABLE 441 LAMEA Vertical Blinds Market by Country, 2018 - 2021, USD Million
- TABLE 442 LAMEA Vertical Blinds Market by Country, 2022 - 2028, USD Million
- TABLE 443 LAMEA Others Market by Country, 2018 - 2021, USD Million
- TABLE 444 LAMEA Others Market by Country, 2022 - 2028, USD Million
- TABLE 445 LAMEA External Blinds Market by Country, 2018 - 2021, USD Million
- TABLE 446 LAMEA External Blinds Market by Country, 2022 - 2028, USD Million
- TABLE 447 Brazil External Blinds Market, 2018 - 2021, USD Million
- TABLE 448 Brazil External Blinds Market, 2022 - 2028, USD Million
- TABLE 449 Brazil External Blinds Market by Operating System, 2018 - 2021, USD Million
- TABLE 450 Brazil External Blinds Market by Operating System, 2022 - 2028, USD Million
- TABLE 451 Brazil External Blinds Market by Material, 2018 - 2021, USD Million
- TABLE 452 Brazil External Blinds Market by Material, 2022 - 2028, USD Million
- TABLE 453 Brazil External Blinds Market by Installation, 2018 - 2021, USD Million
- TABLE 454 Brazil External Blinds Market by Installation, 2022 - 2028, USD Million
- TABLE 455 Brazil External Blinds Market by Application, 2018 - 2021, USD Million
- TABLE 456 Brazil External Blinds Market by Application, 2022 - 2028, USD Million
- TABLE 457 Brazil External Blinds Market by Product, 2018 - 2021, USD Million
- TABLE 458 Brazil External Blinds Market by Product, 2022 - 2028, USD Million
- TABLE 459 Argentina External Blinds Market, 2018 - 2021, USD Million
- TABLE 460 Argentina External Blinds Market, 2022 - 2028, USD Million
- TABLE 461 Argentina External Blinds Market by Operating System, 2018 - 2021, USD Million
- TABLE 462 Argentina External Blinds Market by Operating System, 2022 - 2028, USD Million
- TABLE 463 Argentina External Blinds Market by Material, 2018 - 2021, USD Million
- TABLE 464 Argentina External Blinds Market by Material, 2022 - 2028, USD Million
- TABLE 465 Argentina External Blinds Market by Installation, 2018 - 2021, USD Million
- TABLE 466 Argentina External Blinds Market by Installation, 2022 - 2028, USD Million
- TABLE 467 Argentina External Blinds Market by Application, 2018 - 2021, USD Million
- TABLE 468 Argentina External Blinds Market by Application, 2022 - 2028, USD Million
- TABLE 469 Argentina External Blinds Market by Product, 2018 - 2021, USD Million
- TABLE 470 Argentina External Blinds Market by Product, 2022 - 2028, USD Million
- TABLE 471 UAE External Blinds Market, 2018 - 2021, USD Million
- TABLE 472 UAE External Blinds Market, 2022 - 2028, USD Million
- TABLE 473 UAE External Blinds Market by Operating System, 2018 - 2021, USD Million
- TABLE 474 UAE External Blinds Market by Operating System, 2022 - 2028, USD Million
- TABLE 475 UAE External Blinds Market by Material, 2018 - 2021, USD Million
- TABLE 476 UAE External Blinds Market by Material, 2022 - 2028, USD Million
- TABLE 477 UAE External Blinds Market by Installation, 2018 - 2021, USD Million
- TABLE 478 UAE External Blinds Market by Installation, 2022 - 2028, USD Million
- TABLE 479 UAE External Blinds Market by Application, 2018 - 2021, USD Million
- TABLE 480 UAE External Blinds Market by Application, 2022 - 2028, USD Million
- TABLE 481 UAE External Blinds Market by Product, 2018 - 2021, USD Million
- TABLE 482 UAE External Blinds Market by Product, 2022 - 2028, USD Million
- TABLE 483 Saudi Arabia External Blinds Market, 2018 - 2021, USD Million
- TABLE 484 Saudi Arabia External Blinds Market, 2022 - 2028, USD Million
- TABLE 485 Saudi Arabia External Blinds Market by Operating System, 2018 - 2021, USD Million
- TABLE 486 Saudi Arabia External Blinds Market by Operating System, 2022 - 2028, USD Million
- TABLE 487 Saudi Arabia External Blinds Market by Material, 2018 - 2021, USD Million
- TABLE 488 Saudi Arabia External Blinds Market by Material, 2022 - 2028, USD Million
- TABLE 489 Saudi Arabia External Blinds Market by Installation, 2018 - 2021, USD Million
- TABLE 490 Saudi Arabia External Blinds Market by Installation, 2022 - 2028, USD Million
- TABLE 491 Saudi Arabia External Blinds Market by Application, 2018 - 2021, USD Million
- TABLE 492 Saudi Arabia External Blinds Market by Application, 2022 - 2028, USD Million
- TABLE 493 Saudi Arabia External Blinds Market by Product, 2018 - 2021, USD Million
- TABLE 494 Saudi Arabia External Blinds Market by Product, 2022 - 2028, USD Million
- TABLE 495 South Africa External Blinds Market, 2018 - 2021, USD Million
- TABLE 496 South Africa External Blinds Market, 2022 - 2028, USD Million
- TABLE 497 South Africa External Blinds Market by Operating System, 2018 - 2021, USD Million
- TABLE 498 South Africa External Blinds Market by Operating System, 2022 - 2028, USD Million
- TABLE 499 South Africa External Blinds Market by Material, 2018 - 2021, USD Million
- TABLE 500 South Africa External Blinds Market by Material, 2022 - 2028, USD Million
- TABLE 501 South Africa External Blinds Market by Installation, 2018 - 2021, USD Million
- TABLE 502 South Africa External Blinds Market by Installation, 2022 - 2028, USD Million
- TABLE 503 South Africa External Blinds Market by Application, 2018 - 2021, USD Million
- TABLE 504 South Africa External Blinds Market by Application, 2022 - 2028, USD Million
- TABLE 505 South Africa External Blinds Market by Product, 2018 - 2021, USD Million
- TABLE 506 South Africa External Blinds Market by Product, 2022 - 2028, USD Million
- TABLE 507 Nigeria External Blinds Market, 2018 - 2021, USD Million
- TABLE 508 Nigeria External Blinds Market, 2022 - 2028, USD Million
- TABLE 509 Nigeria External Blinds Market by Operating System, 2018 - 2021, USD Million
- TABLE 510 Nigeria External Blinds Market by Operating System, 2022 - 2028, USD Million
- TABLE 511 Nigeria External Blinds Market by Material, 2018 - 2021, USD Million
- TABLE 512 Nigeria External Blinds Market by Material, 2022 - 2028, USD Million
- TABLE 513 Nigeria External Blinds Market by Installation, 2018 - 2021, USD Million
- TABLE 514 Nigeria External Blinds Market by Installation, 2022 - 2028, USD Million
- TABLE 515 Nigeria External Blinds Market by Application, 2018 - 2021, USD Million
- TABLE 516 Nigeria External Blinds Market by Application, 2022 - 2028, USD Million
- TABLE 517 Nigeria External Blinds Market by Product, 2018 - 2021, USD Million
- TABLE 518 Nigeria External Blinds Market by Product, 2022 - 2028, USD Million
- TABLE 519 Rest of LAMEA External Blinds Market, 2018 - 2021, USD Million
- TABLE 520 Rest of LAMEA External Blinds Market, 2022 - 2028, USD Million
- TABLE 521 Rest of LAMEA External Blinds Market by Operating System, 2018 - 2021, USD Million
- TABLE 522 Rest of LAMEA External Blinds Market by Operating System, 2022 - 2028, USD Million
- TABLE 523 Rest of LAMEA External Blinds Market by Material, 2018 - 2021, USD Million
- TABLE 524 Rest of LAMEA External Blinds Market by Material, 2022 - 2028, USD Million
- TABLE 525 Rest of LAMEA External Blinds Market by Installation, 2018 - 2021, USD Million
- TABLE 526 Rest of LAMEA External Blinds Market by Installation, 2022 - 2028, USD Million
- TABLE 527 Rest of LAMEA External Blinds Market by Application, 2018 - 2021, USD Million
- TABLE 528 Rest of LAMEA External Blinds Market by Application, 2022 - 2028, USD Million
- TABLE 529 Rest of LAMEA External Blinds Market by Product, 2018 - 2021, USD Million
- TABLE 530 Rest of LAMEA External Blinds Market by Product, 2022 - 2028, USD Million
- TABLE 531 key information - Hunter Douglas N.V.
- TABLE 532 Key Information - StellaGroup, SAS
- TABLE 533 Key Information - Griesser AG
- TABLE 534 Key Information - Country Blinds Pty Ltd.
- TABLE 535 Key Information - MHZ Hachtel GmbH & Co. KG
- TABLE 536 Key Information - ZALUZIE NEVA s.r.o.
- TABLE 537 Key Information - Schenker Storen AG
- TABLE 538 Key Information - Verano B.V.
- TABLE 539 Key Information - WAREMA Renkhoff SE
List of Figures
- FIG 1 Methodology for the research
- FIG 2 Global External Blinds Market Share by Operating System, 2021
- FIG 3 Global External Blinds Market Share by Operating System, 2028
- FIG 4 Global External Blinds Market by Operating System, 2018 - 2028, USD Million
- FIG 5 Global External Blinds Market Share by Material, 2021
- FIG 6 Global External Blinds Market Share by Material, 2028
- FIG 7 Global External Blinds Market by Material, 2018 - 2028, USD Million
- FIG 8 Global External Blinds Market Share by Installation, 2021
- FIG 9 Global External Blinds Market Share by Installation, 2028
- FIG 10 Global External Blinds Market by Installation, 2018 - 2028, USD Million
- FIG 11 Global External Blinds Market Share by Application, 2021
- FIG 12 Global External Blinds Market Share by Application, 2028
- FIG 13 Global External Blinds Market by Application, 2018 - 2028, USD Million
- FIG 14 Global External Blinds Market Share by Product, 2021
- FIG 15 Global External Blinds Market Share by Product, 2028
- FIG 16 Global External Blinds Market by Product, 2018 - 2028, USD Million
- FIG 17 Global External Blinds Market Share by Region, 2021
- FIG 18 Global External Blinds Market Share by Region, 2028
- FIG 19 Global External Blinds Market by Region, 2018 - 2028, USD Million
The Global External Blinds Market size is expected to reach $16.3 billion by 2028, rising at a market growth of 6.9% CAGR during the forecast period.
An example of a window treatment is an exterior blind. In order to stop heat from coming into direct contact with the window, it is intended to be installed on the exterior of the building. In other words, exterior blinds may be made to block the heat and let the cold air in. They may shield damaging sun rays while allowing wind to pass through.
Controlling the amount of solar heat and light entering a building has a significant impact on its energy requirements. Even though specifiers have a variety of alternatives, external blinds are a really good choice. Correct solar shading techniques have a significant influence on the building's energy usage as well as the occupants' thermal and visual comfort.
In all kinds of buildings, from residential to commercial, the requirement to regulate overheating and maintain thermal comfort is becoming more and more crucial. As one of a number of passive cooling strategies, solar shading may be useful. It may lessen temperature changes that might happen on sunny days.
The solar transmittance value is utilized to calculate the quantity of solar radiation that enters a structure. You may also employ the shading coefficient, which results in solar transmittance, which is just a small portion of that for glass that is not shaded. If the system has a low solar transmittance or shade coefficient, it is especially effective in reducing solar gain. Of all the various shading solutions, external blinds have the least shading coefficient. Because they block incoming solar radiation before it enters the structure via the glass, it has been discovered that they are quite effective.
COVID-19 Impact Analysis
The COVID-19 pandemic had a negligible effect on the market for exterior blinds. Lockdowns and sluggish development in the construction business, especially in the real estate sector, are to blame for this. Metropolitan areas were the hub of cases at the pandemic's height, prompting authorities to implement severe lockdowns that slowed down house construction projects. Renovations of homes increased in popularity during the pandemic, however, market vendors reported a decline in sales of bespoke exterior blinds. The prohibition on home visits was another factor in this. A significant DIY sector has developed as a way to enable "affordable home decor improvements." Additionally, trade exhibitions were postponed or canceled.
Market Growth Factors
The rise in real estate sector
The rise of the external blinds market is projected to be aided by the expanding real estate sector throughout the forecast period. One of the most important factors promoting market growth is the growing rate of commercial and residential commercial operations and their completion in both developed and emerging countries. As people's affordability and buying power rise, there is a significant rise in the demand for new homes. Over the projected period, market growth at a macro level is anticipated to be driven by the growing hospitality industry. The need for hotels, airbnbs, hostels, and other hospitality venues rises as tourism picks back up throughout the world, fueling the expansion of the external blinds industry.
Urbanization is growing, and more people are using social media sites.
Rapid urbanization and population growth are overrunning the earth. Cities in developing countries like India continue to see an increase in emigration to urban regions. In order to satisfy the expectations of the present generation, natural resources are under extreme strain. The population of rural areas is moving en masse to metropolitan areas in quest of better employment and educational possibilities. There is an urgent need to provide appropriate accommodations for contemporary living solutions. These folks like creating attractive external and interior designs for their houses. Therefore, it is anticipated that rising urbanization and social media platforms will boost the expansion of the external blinds industry.
Market Restraining Factors
Substitutions and copying
External blinds are quite inexpensive. But there are alternatives available on the market. Less costly options include tie-up curtains, roller and shutter blinds, window film, grass shades, and others. While some of the goods are inexpensive, others are more durable. Roller shutters provide superior security and have a longer shelf life than exterior blinds and shades. However, by raising consumer awareness via campaigns and marketing, major manufacturers may be able to overcome this challenge and take advantage of new prospects in the external blinds industry.
Product Outlook
Based on product, the external blinds market is divided into vertical blinds, panel blinds, corded blinds, venetian blinds, roller blinds, and others. The vertical blinds segment acquired a substantial revenue share in the external blinds market in 2021. The tilt and angle capabilities of a vertical blind are superior than those of others blinds. Cleaning vertical blinds is a breeze. The slats can be easily removed from the tracks to be washed and dried if they are made of fabric. Any other material can simply be lightly dusted or swiped with a moist cloth. With these benefits of vertical blinds over others, the market is accelerating in this segment.
Material Type Outlook
Based on material type, the external blinds market is segmented into metal, wood, plastic, and others. In 2021, the wood segment acquired the prominent revenue share in the external blinds market. Its advantages, including toughness, increased comfort, and aesthetic appeal, are blamed for the rapid growth. One of the most often utilized raw materials for the production of furniture is wood. One of the most popular materials for use in home decor is wood.
Application Outlook
Based on application, the external blinds market is divided into residential and commercial. In 2021, the commercial segment covered a substantial revenue share in the external blinds market. The possibility for the product has grown due to the rise in hotels and restaurants brought on by the global travel and tourist sector. The market for these items has also been boosted globally by the growth of malls, retail establishments, and workplaces. Also, the demand is rising as commercial buildings owners wish to have an appealing look of the buildings.
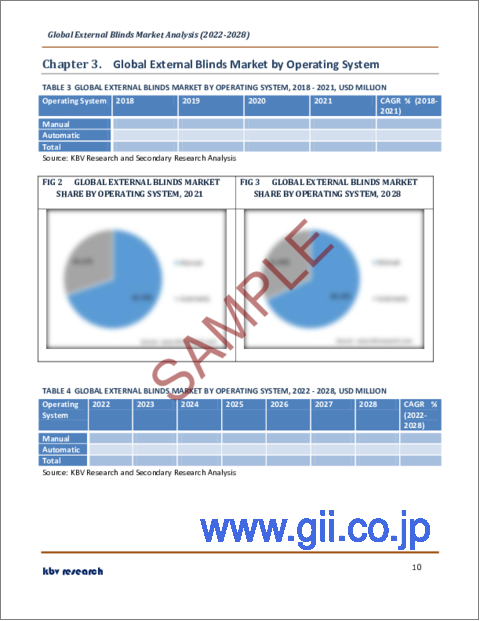
Operating System Outlook
Based on the operating system, the external blinds market is divided into automated and manual. In 2021, the manual operating system segment had the most revenue share. Because the position and adjustment are hand-controlled, it is easy to reduce or increase the blind height without having to go through a laborious procedure. Due to the increased safety features of cordless or short-corded window coverings, consumers still prefer manual window coverings. The use of a smart window covering in both the residential and commercial sectors is further encouraged by the growing use of smart devices and the resurgence of smart home ideas.
Installation Outlook
Based on the installation, the external blinds market is divided into new construction and retrofit. The retrofit segment garnered the largest revenue share in the market in 2021. Home remodeling is becoming more popular than buying a new house. Customers are increasingly turning to house renovation because of the high expenditures related to property prices and mortgage rates. For example, according to RubyHome, homeowners in the US spent an average of USD 10,341 on home improvements in 2021, up by 25% from the year before.
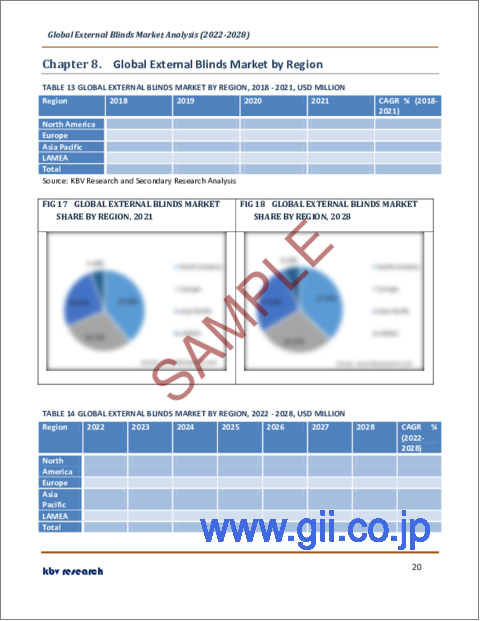
Regional Outlook
Based on region, the external blinds market is categorized into North America, Europe, Asia Pacific, and LAMEA. The North American region held the largest revenue share in 2021 in the external blinds market. The most efficient and cost-effective window treatment options are window shades and blinds. In addition, effective energy savings are facilitated by shade installation. For instance, installing blinds set right up against neighboring walls and near the window provides a tight seal that reduces both heat absorption and loss. The US Department of Energy (DOE) claims that a simple arrangement of light-colored draperies paired with white plastic may cut solar heat gain by 33%.
The market research report covers the analysis of key stake holders of the market. Key companies profiled in the report include Hunter Douglas N.V., StellaGroup, SAS (PAI Partners SAS), Griesser AG, Country Blinds Pty Ltd., MHZ Hachtel GmbH & Co. KG, ZALUZIE NEVA s.r.o., Schenker Storen AG, Verano B.V., and WAREMA Renkhoff SE.
Scope of the Study
Market Segments covered in the Report:
By Operating System
- Manual
- Automatic
By Material
- Metal
- Wood
- Plastic
- Others
By Installation
- Retro-fit
- New Construction
By Application
- Residential
- Commercial
By Product
- Roller Blinds
- Venetian Blinds
- Corded Blinds
- Panel Blinds
- Vertical Blinds
- Others
By Geography
- North America
- US
- Canada
- Mexico
- Rest of North America
- Europe
- Germany
- UK
- France
- Russia
- Spain
- Italy
- Rest of Europe
- Asia Pacific
- China
- Japan
- India
- South Korea
- Singapore
- Malaysia
- Rest of Asia Pacific
- LAMEA
- Brazil
- Argentina
- UAE
- Saudi Arabia
- South Africa
- Nigeria
- Rest of LAMEA
Companies Profiled
- Hunter Douglas N.V.
- StellaGroup, SAS (PAI Partners SAS)
- Griesser AG
- Country Blinds Pty Ltd.
- MHZ Hachtel GmbH & Co. KG
- ZALUZIE NEVA s.r.o.
- Schenker Storen AG
- Verano B.V.
- WAREMA Renkhoff SE
Unique Offerings from KBV Research
- Exhaustive coverage
- Highest number of market tables and figures
- Subscription based model available
- Guaranteed best price
- Assured post sales research support with 10% customization free
Table of Contents
Chapter 1. Market Scope & Methodology
- 1.1 Market Definition
- 1.2 Objectives
- 1.3 Market Scope
- 1.4 Segmentation
- 1.4.1 Global External Blinds Market, by Operating System
- 1.4.2 Global External Blinds Market, by Material
- 1.4.3 Global External Blinds Market, by Installation
- 1.4.4 Global External Blinds Market, by Application
- 1.4.5 Global External Blinds Market, by Product
- 1.4.6 Global External Blinds Market, by Geography
- 1.5 Methodology for the research
Chapter 2. Market Overview
- 2.1 Introduction
- 2.1.1 Overview
- 2.1.1.1 Market Composition & Scenario
- 2.1.1 Overview
- 2.2 Key Factors Impacting the Market
- 2.2.1 Market Drivers
- 2.2.2 Market Restraints
Chapter 3. Global External Blinds Market by Operating System
- 3.1 Global Manual Market by Region
- 3.2 Global Automatic Market by Region
Chapter 4. Global External Blinds Market by Material
- 4.1 Global Metal Market by Region
- 4.2 Global Wood Market by Region
- 4.3 Global Plastic Market by Region
- 4.4 Global Others Market by Region
Chapter 5. Global External Blinds Market by Installation
- 5.1 Global Retro-fit Market by Region
- 5.2 Global New Construction Market by Region
Chapter 6. Global External Blinds Market by Application
- 6.1 Global Residential Market by Region
- 6.2 Global Commercial Market by Region
Chapter 7. Global External Blinds Market by Product
- 7.1 Global Roller Blinds Market by Region
- 7.2 Global Venetian Blinds Market by Region
- 7.3 Global Corded Blinds Market by Region
- 7.4 Global Panel Blinds Market by Region
- 7.5 Global Vertical Blinds Market by Region
- 7.6 Global Others Market by Region
Chapter 8. Global External Blinds Market by Region
- 8.1 North America External Blinds Market
- 8.1.1 North America External Blinds Market by Operating System
- 8.1.1.1 North America Manual Market by Country
- 8.1.1.2 North America Automatic Market by Country
- 8.1.2 North America External Blinds Market by Material
- 8.1.2.1 North America Metal Market by Country
- 8.1.2.2 North America Wood Market by Country
- 8.1.2.3 North America Plastic Market by Country
- 8.1.2.4 North America Others Market by Country
- 8.1.3 North America External Blinds Market by Installation
- 8.1.3.1 North America Retro-fit Market by Country
- 8.1.3.2 North America New Construction Market by Country
- 8.1.4 North America External Blinds Market by Application
- 8.1.4.1 North America Residential Market by Country
- 8.1.4.2 North America Commercial Market by Country
- 8.1.5 North America External Blinds Market by Product
- 8.1.5.1 North America Roller Blinds Market by Country
- 8.1.5.2 North America Venetian Blinds Market by Country
- 8.1.5.3 North America Corded Blinds Market by Country
- 8.1.5.4 North America Panel Blinds Market by Country
- 8.1.5.5 North America Vertical Blinds Market by Country
- 8.1.5.6 North America Others Market by Country
- 8.1.6 North America External Blinds Market by Country
- 8.1.6.1 US External Blinds Market
- 8.1.6.1.1 US External Blinds Market by Operating System
- 8.1.6.1.2 US External Blinds Market by Material
- 8.1.6.1.3 US External Blinds Market by Installation
- 8.1.6.1.4 US External Blinds Market by Application
- 8.1.6.1.5 US External Blinds Market by Product
- 8.1.6.2 Canada External Blinds Market
- 8.1.6.2.1 Canada External Blinds Market by Operating System
- 8.1.6.2.2 Canada External Blinds Market by Material
- 8.1.6.2.3 Canada External Blinds Market by Installation
- 8.1.6.2.4 Canada External Blinds Market by Application
- 8.1.6.2.5 Canada External Blinds Market by Product
- 8.1.6.3 Mexico External Blinds Market
- 8.1.6.3.1 Mexico External Blinds Market by Operating System
- 8.1.6.3.2 Mexico External Blinds Market by Material
- 8.1.6.3.3 Mexico External Blinds Market by Installation
- 8.1.6.3.4 Mexico External Blinds Market by Application
- 8.1.6.3.5 Mexico External Blinds Market by Product
- 8.1.6.4 Rest of North America External Blinds Market
- 8.1.6.4.1 Rest of North America External Blinds Market by Operating System
- 8.1.6.4.2 Rest of North America External Blinds Market by Material
- 8.1.6.4.3 Rest of North America External Blinds Market by Installation
- 8.1.6.4.4 Rest of North America External Blinds Market by Application
- 8.1.6.4.5 Rest of North America External Blinds Market by Product
- 8.1.6.1 US External Blinds Market
- 8.1.1 North America External Blinds Market by Operating System
- 8.2 Europe External Blinds Market
- 8.2.1 Europe External Blinds Market by Operating System
- 8.2.1.1 Europe Manual Market by Country
- 8.2.1.2 Europe Automatic Market by Country
- 8.2.2 Europe External Blinds Market by Material
- 8.2.2.1 Europe Metal Market by Country
- 8.2.2.2 Europe Wood Market by Country
- 8.2.2.3 Europe Plastic Market by Country
- 8.2.2.4 Europe Others Market by Country
- 8.2.3 Europe External Blinds Market by Installation
- 8.2.3.1 Europe Retro-fit Market by Country
- 8.2.3.2 Europe New Construction Market by Country
- 8.2.4 Europe External Blinds Market by Application
- 8.2.4.1 Europe Residential Market by Country
- 8.2.4.2 Europe Commercial Market by Country
- 8.2.5 Europe External Blinds Market by Product
- 8.2.5.1 Europe Roller Blinds Market by Country
- 8.2.5.2 Europe Venetian Blinds Market by Country
- 8.2.5.3 Europe Corded Blinds Market by Country
- 8.2.5.4 Europe Panel Blinds Market by Country
- 8.2.5.5 Europe Vertical Blinds Market by Country
- 8.2.5.6 Europe Others Market by Country
- 8.2.6 Europe External Blinds Market by Country
- 8.2.6.1 Germany External Blinds Market
- 8.2.6.1.1 Germany External Blinds Market by Operating System
- 8.2.6.1.2 Germany External Blinds Market by Material
- 8.2.6.1.3 Germany External Blinds Market by Installation
- 8.2.6.1.4 Germany External Blinds Market by Application
- 8.2.6.1.5 Germany External Blinds Market by Product
- 8.2.6.2 UK External Blinds Market
- 8.2.6.2.1 UK External Blinds Market by Operating System
- 8.2.6.2.2 UK External Blinds Market by Material
- 8.2.6.2.3 UK External Blinds Market by Installation
- 8.2.6.2.4 UK External Blinds Market by Application
- 8.2.6.2.5 UK External Blinds Market by Product
- 8.2.6.3 France External Blinds Market
- 8.2.6.3.1 France External Blinds Market by Operating System
- 8.2.6.3.2 France External Blinds Market by Material
- 8.2.6.3.3 France External Blinds Market by Installation
- 8.2.6.3.4 France External Blinds Market by Application
- 8.2.6.3.5 France External Blinds Market by Product
- 8.2.6.4 Russia External Blinds Market
- 8.2.6.4.1 Russia External Blinds Market by Operating System
- 8.2.6.4.2 Russia External Blinds Market by Material
- 8.2.6.4.3 Russia External Blinds Market by Installation
- 8.2.6.4.4 Russia External Blinds Market by Application
- 8.2.6.4.5 Russia External Blinds Market by Product
- 8.2.6.5 Spain External Blinds Market
- 8.2.6.5.1 Spain External Blinds Market by Operating System
- 8.2.6.5.2 Spain External Blinds Market by Material
- 8.2.6.5.3 Spain External Blinds Market by Installation
- 8.2.6.5.4 Spain External Blinds Market by Application
- 8.2.6.5.5 Spain External Blinds Market by Product
- 8.2.6.6 Italy External Blinds Market
- 8.2.6.6.1 Italy External Blinds Market by Operating System
- 8.2.6.6.2 Italy External Blinds Market by Material
- 8.2.6.6.3 Italy External Blinds Market by Installation
- 8.2.6.6.4 Italy External Blinds Market by Application
- 8.2.6.6.5 Italy External Blinds Market by Product
- 8.2.6.7 Rest of Europe External Blinds Market
- 8.2.6.7.1 Rest of Europe External Blinds Market by Operating System
- 8.2.6.7.2 Rest of Europe External Blinds Market by Material
- 8.2.6.7.3 Rest of Europe External Blinds Market by Installation
- 8.2.6.7.4 Rest of Europe External Blinds Market by Application
- 8.2.6.7.5 Rest of Europe External Blinds Market by Product
- 8.2.6.1 Germany External Blinds Market
- 8.2.1 Europe External Blinds Market by Operating System
- 8.3 Asia Pacific External Blinds Market
- 8.3.1 Asia Pacific External Blinds Market by Operating System
- 8.3.1.1 Asia Pacific Manual Market by Country
- 8.3.1.2 Asia Pacific Automatic Market by Country
- 8.3.2 Asia Pacific External Blinds Market by Material
- 8.3.2.1 Asia Pacific Metal Market by Country
- 8.3.2.2 Asia Pacific Wood Market by Country
- 8.3.2.3 Asia Pacific Plastic Market by Country
- 8.3.2.4 Asia Pacific Others Market by Country
- 8.3.3 Asia Pacific External Blinds Market by Installation
- 8.3.3.1 Asia Pacific Retro-fit Market by Country
- 8.3.3.2 Asia Pacific New Construction Market by Country
- 8.3.4 Asia Pacific External Blinds Market by Application
- 8.3.4.1 Asia Pacific Residential Market by Country
- 8.3.4.2 Asia Pacific Commercial Market by Country
- 8.3.5 Asia Pacific External Blinds Market by Product
- 8.3.5.1 Asia Pacific Roller Blinds Market by Country
- 8.3.5.2 Asia Pacific Venetian Blinds Market by Country
- 8.3.5.3 Asia Pacific Corded Blinds Market by Country
- 8.3.5.4 Asia Pacific Panel Blinds Market by Country
- 8.3.5.5 Asia Pacific Vertical Blinds Market by Country
- 8.3.5.6 Asia Pacific Others Market by Country
- 8.3.6 Asia Pacific External Blinds Market by Country
- 8.3.6.1 China External Blinds Market
- 8.3.6.1.1 China External Blinds Market by Operating System
- 8.3.6.1.2 China External Blinds Market by Material
- 8.3.6.1.3 China External Blinds Market by Installation
- 8.3.6.1.4 China External Blinds Market by Application
- 8.3.6.1.5 China External Blinds Market by Product
- 8.3.6.2 Japan External Blinds Market
- 8.3.6.2.1 Japan External Blinds Market by Operating System
- 8.3.6.2.2 Japan External Blinds Market by Material
- 8.3.6.2.3 Japan External Blinds Market by Installation
- 8.3.6.2.4 Japan External Blinds Market by Application
- 8.3.6.2.5 Japan External Blinds Market by Product
- 8.3.6.3 India External Blinds Market
- 8.3.6.3.1 India External Blinds Market by Operating System
- 8.3.6.3.2 India External Blinds Market by Material
- 8.3.6.3.3 India External Blinds Market by Installation
- 8.3.6.3.4 India External Blinds Market by Application
- 8.3.6.3.5 India External Blinds Market by Product
- 8.3.6.4 South Korea External Blinds Market
- 8.3.6.4.1 South Korea External Blinds Market by Operating System
- 8.3.6.4.2 South Korea External Blinds Market by Material
- 8.3.6.4.3 South Korea External Blinds Market by Installation
- 8.3.6.4.4 South Korea External Blinds Market by Application
- 8.3.6.4.5 South Korea External Blinds Market by Product
- 8.3.6.5 Singapore External Blinds Market
- 8.3.6.5.1 Singapore External Blinds Market by Operating System
- 8.3.6.5.2 Singapore External Blinds Market by Material
- 8.3.6.5.3 Singapore External Blinds Market by Installation
- 8.3.6.5.4 Singapore External Blinds Market by Application
- 8.3.6.5.5 Singapore External Blinds Market by Product
- 8.3.6.6 Malaysia External Blinds Market
- 8.3.6.6.1 Malaysia External Blinds Market by Operating System
- 8.3.6.6.2 Malaysia External Blinds Market by Material
- 8.3.6.6.3 Malaysia External Blinds Market by Installation
- 8.3.6.6.4 Malaysia External Blinds Market by Application
- 8.3.6.6.5 Malaysia External Blinds Market by Product
- 8.3.6.7 Rest of Asia Pacific External Blinds Market
- 8.3.6.7.1 Rest of Asia Pacific External Blinds Market by Operating System
- 8.3.6.7.2 Rest of Asia Pacific External Blinds Market by Material
- 8.3.6.7.3 Rest of Asia Pacific External Blinds Market by Installation
- 8.3.6.7.4 Rest of Asia Pacific External Blinds Market by Application
- 8.3.6.7.5 Rest of Asia Pacific External Blinds Market by Product
- 8.3.6.1 China External Blinds Market
- 8.3.1 Asia Pacific External Blinds Market by Operating System
- 8.4 LAMEA External Blinds Market
- 8.4.1 LAMEA External Blinds Market by Operating System
- 8.4.1.1 LAMEA Manual Market by Country
- 8.4.1.2 LAMEA Automatic Market by Country
- 8.4.2 LAMEA External Blinds Market by Material
- 8.4.2.1 LAMEA Metal Market by Country
- 8.4.2.2 LAMEA Wood Market by Country
- 8.4.2.3 LAMEA Plastic Market by Country
- 8.4.2.4 LAMEA Others Market by Country
- 8.4.3 LAMEA External Blinds Market by Installation
- 8.4.3.1 LAMEA Retro-fit Market by Country
- 8.4.3.2 LAMEA New Construction Market by Country
- 8.4.4 LAMEA External Blinds Market by Application
- 8.4.4.1 LAMEA Residential Market by Country
- 8.4.4.2 LAMEA Commercial Market by Country
- 8.4.5 LAMEA External Blinds Market by Product
- 8.4.5.1 LAMEA Roller Blinds Market by Country
- 8.4.5.2 LAMEA Venetian Blinds Market by Country
- 8.4.5.3 LAMEA Corded Blinds Market by Country
- 8.4.5.4 LAMEA Panel Blinds Market by Country
- 8.4.5.5 LAMEA Vertical Blinds Market by Country
- 8.4.5.6 LAMEA Others Market by Country
- 8.4.6 LAMEA External Blinds Market by Country
- 8.4.6.1 Brazil External Blinds Market
- 8.4.6.1.1 Brazil External Blinds Market by Operating System
- 8.4.6.1.2 Brazil External Blinds Market by Material
- 8.4.6.1.3 Brazil External Blinds Market by Installation
- 8.4.6.1.4 Brazil External Blinds Market by Application
- 8.4.6.1.5 Brazil External Blinds Market by Product
- 8.4.6.2 Argentina External Blinds Market
- 8.4.6.2.1 Argentina External Blinds Market by Operating System
- 8.4.6.2.2 Argentina External Blinds Market by Material
- 8.4.6.2.3 Argentina External Blinds Market by Installation
- 8.4.6.2.4 Argentina External Blinds Market by Application
- 8.4.6.2.5 Argentina External Blinds Market by Product
- 8.4.6.3 UAE External Blinds Market
- 8.4.6.3.1 UAE External Blinds Market by Operating System
- 8.4.6.3.2 UAE External Blinds Market by Material
- 8.4.6.3.3 UAE External Blinds Market by Installation
- 8.4.6.3.4 UAE External Blinds Market by Application
- 8.4.6.3.5 UAE External Blinds Market by Product
- 8.4.6.4 Saudi Arabia External Blinds Market
- 8.4.6.4.1 Saudi Arabia External Blinds Market by Operating System
- 8.4.6.4.2 Saudi Arabia External Blinds Market by Material
- 8.4.6.4.3 Saudi Arabia External Blinds Market by Installation
- 8.4.6.4.4 Saudi Arabia External Blinds Market by Application
- 8.4.6.4.5 Saudi Arabia External Blinds Market by Product
- 8.4.6.5 South Africa External Blinds Market
- 8.4.6.5.1 South Africa External Blinds Market by Operating System
- 8.4.6.5.2 South Africa External Blinds Market by Material
- 8.4.6.5.3 South Africa External Blinds Market by Installation
- 8.4.6.5.4 South Africa External Blinds Market by Application
- 8.4.6.5.5 South Africa External Blinds Market by Product
- 8.4.6.6 Nigeria External Blinds Market
- 8.4.6.6.1 Nigeria External Blinds Market by Operating System
- 8.4.6.6.2 Nigeria External Blinds Market by Material
- 8.4.6.6.3 Nigeria External Blinds Market by Installation
- 8.4.6.6.4 Nigeria External Blinds Market by Application
- 8.4.6.6.5 Nigeria External Blinds Market by Product
- 8.4.6.7 Rest of LAMEA External Blinds Market
- 8.4.6.7.1 Rest of LAMEA External Blinds Market by Operating System
- 8.4.6.7.2 Rest of LAMEA External Blinds Market by Material
- 8.4.6.7.3 Rest of LAMEA External Blinds Market by Installation
- 8.4.6.7.4 Rest of LAMEA External Blinds Market by Application
- 8.4.6.7.5 Rest of LAMEA External Blinds Market by Product
- 8.4.6.1 Brazil External Blinds Market
- 8.4.1 LAMEA External Blinds Market by Operating System
Chapter 9. Company Profiles
- 9.1 Hunter Douglas N.V. (3G Capital)
- 9.1.1 Company Overview
- 9.1.2 Financial Analysis
- 9.1.3 Segmental and Regional Analysis
- 9.1.4 Research & Development Expense
- 9.2 StellaGroup, SAS (PAI Partners SAS)
- 9.2.1 Company Overview
- 9.3 Griesser AG
- 9.3.1 Company Overview
- 9.4 Country Blinds Pty Ltd.
- 9.4.1 Company Overview
- 9.5 MHZ Hachtel GmbH & Co. KG
- 9.5.1 Company Overview
- 9.6 ZALUZIE NEVA s.r.o.
- 9.6.1 Company Overview
- 9.7 Schenker Storen AG
- 9.7.1 Company Overview
- 9.8 Verano B.V.
- 9.8.1 Company Overview
- 9.9 WAREMA Renkhoff SE
- 9.9.1 Company Overview