|
|
市場調査レポート
商品コード
1184328
シアバターの世界市場規模・シェア・産業動向分析レポート製品別(生・未精製、精製)、用途別(化粧品・パーソナルケア、食品、その他)、地域別展望・予測、2022年~2028年版Global Shea Butter Market Size, Share & Industry Trends Analysis Report By Product (Raw & Unrefined and Refined), By Application (Cosmetics & Personal Care, Food and Others), By Regional Outlook and Forecast, 2022 - 2028 |
||||||
|
|
|||||||


| シアバターの世界市場規模・シェア・産業動向分析レポート製品別(生・未精製、精製)、用途別(化粧品・パーソナルケア、食品、その他)、地域別展望・予測、2022年~2028年版 |
|
出版日: 2022年12月30日
発行: KBV Research
ページ情報: 英文 144 Pages
納期: 即納可能
|
- 全表示
- 概要
- 図表
- 目次
世界のシアバター市場規模は、2028年までに30億米ドルに達し、予測期間中にCAGR7.0%の市場成長率で上昇すると予想されています。
一般的に、シアバターの調製には、2つの著名なシアナッツの品種が使用されています。西アフリカのヴィテラリア・パラドクサと東アフリカのヴィテラリア・ニロティカは、質感、栄養分、一貫性がわずかに異なるシアバターを生産しています。パラドクサ種のシアバターは密度が高く、ニロティカ種のシアバターは液状になる傾向があります。
また、東アフリカ産のシアバターはより高級とされ、供給量も限られているため、ほとんど手に入らないです。また、のびがよく、敏感肌、肌あれ、乾燥肌、傷、やけど、老化肌、赤ちゃん肌など、さまざまな肌の悩みに適しています。一方、西アフリカ産のシアバターは、ビタミンAを多く含むことから、妊娠線、シミ、シワ、傷跡などに使用されています。
COVID-19の影響分析
COVID-19の大流行はシアバター市場に深刻な悪影響を及ぼしました。この時期は、この市場に関連する製造、新興国開拓、ロジスティクス企業にとって困難な時期として浮上しました。多くの国で政府による規制が行われたため、市場のサプライチェーンに支障をきたしました。特に、原料であるシアバターの調達・流通に携わる企業にとっては、パンデミックにより国境が閉鎖されたことが大きな打撃となっています。
市場の成長要因
シアバターの効能に対する認知度の向上
シアバターは、肌をなめらかにし、柔らかくする優れたエモリエント成分として広く知られています。シアバターには豊富な油分が含まれており、肌に素早く浸透し、潤いを閉じ込めるバリア機能を発揮します。さらに、ここ数年、シアバターのその他の特典が強烈にクローズアップされています。シアバターには癒しと抗炎症作用があり、顔の腫れや赤みに効果があります。それはまたコラーゲンの生産を促進します。シアバターのすべてのプロパティは、ナッツの脂肪の存在に由来します。
アンチエイジング・スキンケアと化粧品への需要の高まり
現代の多忙なライフスタイルは、一般的に高性能で時間効率の良い製品の需要の増加をもたらしています。パーソナルケア業界においても同様の需要があります。さらに、多忙なライフスタイルは、肌の劣化やシワを拡大させる原因となる砂糖や防腐剤を多く含む食品や飲料の消費にもつながっています。その結果、抗酸化物質が肌の老化を最小限に抑えるのに役立つことから、抗酸化物質を豊富に含む製品への需要が高まっています。
市場抑制要因
シアバターの使用に関連するリスクと制限
シアバターは、低リスクの外用化合物として知られており、使用によるアレルギー反応の可能性は稀であるが、可能性はあります。研究者は、特定の木の実のタンパク質の低い存在が、アレルギーを誘発する主な原因であると信じています。アレルギーを引き起こす要因が少ないことから、すべての人に適した製品であると考えられていますが、そうとは限りません。シアバターは、毛穴を詰まらせたり、ニキビを悪化させたりする可能性があります。
製品の展望
製品に基づき、シアバター市場は、生と未精製と精製に分類されます。精製されたセグメントは、2021年にシアバター市場でかなりの成長率を調達しました。加工または精製された製品は、製品の貯蔵寿命を伸ばします。精製プロセスは、製品の任意の香りと色を除去するように、現在、より多くの人々が精製されたシアバターを要求し、これは特に敏感な人々のために良いことです。また、色や香りの除去は、他の成分と混合するシアバターの適用性を高める。
アプリケーションの展望
シアバター市場は、用途別に化粧品・パーソナルケア、食品、その他に分類されます。化粧品・パーソナルケア分野は、2021年のシアバター市場において最大の収益シェアを獲得しました。ローション、クリーム、石鹸、トイレタリー、カラー化粧品におけるシアバターの使用の増加が、このセグメントの拡大に寄与しています。この需要は、オーガニックや天然の美容・スキンケア製品に対する消費者の志向の高まりによって推進されています。また、持続可能性の影響力の高まりにより、オーガニック製品の需要も着実に増加しています。
地域別の展望
地域別に、シアバター市場は北米、欧州、アジア太平洋、LAMEAで分析されています。欧州地域は、2021年にシアバター市場で最大の収益シェアを獲得しました。シアバターの使用は、多数の製薬および化粧品産業の存在により、この地域の保湿剤、ボディローション、チョコレートなどの製品で増加しています。また、この地域はアフリカ亜大陸に近いため、シアバターの安定供給が確保されています。
目次
第1章 市場の範囲と調査手法
- 市場の定義
- 目的
- 市場規模
- セグメンテーション
- シアバターの世界市場、製品別
- シアバターの世界市場、用途別
- シアバターの世界市場、地域別
- 調査手法
第2章 市場概要
- イントロダクション
- 概要の説明
- 市場の構成とシナリオ
- 概要の説明
- 市場に影響を与える主な要因
- 市場促進要因
- 市場の抑制要因
第3章 シアバターの世界市場:製品別
- 生・未精製の世界市場:地域別
- 精製された世界市場:地域別
第4章 シアバターの世界市場用途別
- 化粧品・パーソナルケアの世界市場:地域別
- 世界の食品市場:地域別
- 世界のその他の市場:地域別
第5章 シアバターの世界市場:地域別市場
- 北米
- 北米のシアバター国別市場
- 米国
- カナダ
- メキシコ
- その他北米地域
- 北米のシアバター国別市場
- 欧州
- 欧州のシアバター市場:国別
- ドイツ
- 英国
- フランス
- ロシア
- スペイン
- イタリア
- その他欧州
- 欧州のシアバター市場:国別
- アジア太平洋地域
- アジア太平洋地域のシアバター市場:国別
- 中国
- 日本
- インド
- 韓国
- シンガポール
- マレーシア
- その他アジア太平洋地域
- アジア太平洋地域のシアバター市場:国別
- LAMEA
- LAMEAのシアバター市場:国別
- ブラジル
- アルゼンチン
- UAE
- サウジアラビア
- 南アフリカ
- ナイジェリア
- LAMEAの他の地域
- LAMEAのシアバター市場:国別
第6章 企業プロファイル
- AAK AB
- Bunge Limited
- BASF SE
- Archer-Daniels-Midland Company
- Clariant AG
- Croda International PLC
- Cargill, Incorporated
- Stern-Wywiol Gruppe GmbH & Co. KG
- OLVEA Group
- 3F Industries Ltd.
LIST OF TABLES
- TABLE 1 Global Shea Butter Market, 2018 - 2021, USD Million
- TABLE 2 Global Shea Butter Market, 2022 - 2028, USD Million
- TABLE 3 Global Shea Butter Market by Product, 2018 - 2021, USD Million
- TABLE 4 Global Shea Butter Market by Product, 2022 - 2028, USD Million
- TABLE 5 Global Raw & Unrefined Market by Region, 2018 - 2021, USD Million
- TABLE 6 Global Raw & Unrefined Market by Region, 2022 - 2028, USD Million
- TABLE 7 Global Refined Market by Region, 2018 - 2021, USD Million
- TABLE 8 Global Refined Market by Region, 2022 - 2028, USD Million
- TABLE 9 Global Shea Butter Market by Application, 2018 - 2021, USD Million
- TABLE 10 Global Shea Butter Market by Application, 2022 - 2028, USD Million
- TABLE 11 Global Cosmetics & Personal Care Market by Region, 2018 - 2021, USD Million
- TABLE 12 Global Cosmetics & Personal Care Market by Region, 2022 - 2028, USD Million
- TABLE 13 Global Food Market by Region, 2018 - 2021, USD Million
- TABLE 14 Global Food Market by Region, 2022 - 2028, USD Million
- TABLE 15 Global Others Market by Region, 2018 - 2021, USD Million
- TABLE 16 Global Others Market by Region, 2022 - 2028, USD Million
- TABLE 17 Global Shea Butter Market by Region, 2018 - 2021, USD Million
- TABLE 18 Global Shea Butter Market by Region, 2022 - 2028, USD Million
- TABLE 19 North America Shea Butter Market, 2018 - 2021, USD Million
- TABLE 20 North America Shea Butter Market, 2022 - 2028, USD Million
- TABLE 21 North America Shea Butter Market by Product, 2018 - 2021, USD Million
- TABLE 22 North America Shea Butter Market by Product, 2022 - 2028, USD Million
- TABLE 23 North America Raw & Unrefined Market by Country, 2018 - 2021, USD Million
- TABLE 24 North America Raw & Unrefined Market by Country, 2022 - 2028, USD Million
- TABLE 25 North America Refined Market by Country, 2018 - 2021, USD Million
- TABLE 26 North America Refined Market by Country, 2022 - 2028, USD Million
- TABLE 27 North America Shea Butter Market by Application, 2018 - 2021, USD Million
- TABLE 28 North America Shea Butter Market by Application, 2022 - 2028, USD Million
- TABLE 29 North America Cosmetics & Personal Care Market by Country, 2018 - 2021, USD Million
- TABLE 30 North America Cosmetics & Personal Care Market by Country, 2022 - 2028, USD Million
- TABLE 31 North America Food Market by Country, 2018 - 2021, USD Million
- TABLE 32 North America Food Market by Country, 2022 - 2028, USD Million
- TABLE 33 North America Others Market by Country, 2018 - 2021, USD Million
- TABLE 34 North America Others Market by Country, 2022 - 2028, USD Million
- TABLE 35 North America Shea Butter Market by Country, 2018 - 2021, USD Million
- TABLE 36 North America Shea Butter Market by Country, 2022 - 2028, USD Million
- TABLE 37 US Shea Butter Market, 2018 - 2021, USD Million
- TABLE 38 US Shea Butter Market, 2022 - 2028, USD Million
- TABLE 39 US Shea Butter Market by Product, 2018 - 2021, USD Million
- TABLE 40 US Shea Butter Market by Product, 2022 - 2028, USD Million
- TABLE 41 US Shea Butter Market by Application, 2018 - 2021, USD Million
- TABLE 42 US Shea Butter Market by Application, 2022 - 2028, USD Million
- TABLE 43 Canada Shea Butter Market, 2018 - 2021, USD Million
- TABLE 44 Canada Shea Butter Market, 2022 - 2028, USD Million
- TABLE 45 Canada Shea Butter Market by Product, 2018 - 2021, USD Million
- TABLE 46 Canada Shea Butter Market by Product, 2022 - 2028, USD Million
- TABLE 47 Canada Shea Butter Market by Application, 2018 - 2021, USD Million
- TABLE 48 Canada Shea Butter Market by Application, 2022 - 2028, USD Million
- TABLE 49 Mexico Shea Butter Market, 2018 - 2021, USD Million
- TABLE 50 Mexico Shea Butter Market, 2022 - 2028, USD Million
- TABLE 51 Mexico Shea Butter Market by Product, 2018 - 2021, USD Million
- TABLE 52 Mexico Shea Butter Market by Product, 2022 - 2028, USD Million
- TABLE 53 Mexico Shea Butter Market by Application, 2018 - 2021, USD Million
- TABLE 54 Mexico Shea Butter Market by Application, 2022 - 2028, USD Million
- TABLE 55 Rest of North America Shea Butter Market, 2018 - 2021, USD Million
- TABLE 56 Rest of North America Shea Butter Market, 2022 - 2028, USD Million
- TABLE 57 Rest of North America Shea Butter Market by Product, 2018 - 2021, USD Million
- TABLE 58 Rest of North America Shea Butter Market by Product, 2022 - 2028, USD Million
- TABLE 59 Rest of North America Shea Butter Market by Application, 2018 - 2021, USD Million
- TABLE 60 Rest of North America Shea Butter Market by Application, 2022 - 2028, USD Million
- TABLE 61 Europe Shea Butter Market, 2018 - 2021, USD Million
- TABLE 62 Europe Shea Butter Market, 2022 - 2028, USD Million
- TABLE 63 Europe Shea Butter Market by Product, 2018 - 2021, USD Million
- TABLE 64 Europe Shea Butter Market by Product, 2022 - 2028, USD Million
- TABLE 65 Europe Raw & Unrefined Market by Country, 2018 - 2021, USD Million
- TABLE 66 Europe Raw & Unrefined Market by Country, 2022 - 2028, USD Million
- TABLE 67 Europe Refined Market by Country, 2018 - 2021, USD Million
- TABLE 68 Europe Refined Market by Country, 2022 - 2028, USD Million
- TABLE 69 Europe Shea Butter Market by Application, 2018 - 2021, USD Million
- TABLE 70 Europe Shea Butter Market by Application, 2022 - 2028, USD Million
- TABLE 71 Europe Cosmetics & Personal Care Market by Country, 2018 - 2021, USD Million
- TABLE 72 Europe Cosmetics & Personal Care Market by Country, 2022 - 2028, USD Million
- TABLE 73 Europe Food Market by Country, 2018 - 2021, USD Million
- TABLE 74 Europe Food Market by Country, 2022 - 2028, USD Million
- TABLE 75 Europe Others Market by Country, 2018 - 2021, USD Million
- TABLE 76 Europe Others Market by Country, 2022 - 2028, USD Million
- TABLE 77 Europe Shea Butter Market by Country, 2018 - 2021, USD Million
- TABLE 78 Europe Shea Butter Market by Country, 2022 - 2028, USD Million
- TABLE 79 Germany Shea Butter Market, 2018 - 2021, USD Million
- TABLE 80 Germany Shea Butter Market, 2022 - 2028, USD Million
- TABLE 81 Germany Shea Butter Market by Product, 2018 - 2021, USD Million
- TABLE 82 Germany Shea Butter Market by Product, 2022 - 2028, USD Million
- TABLE 83 Germany Shea Butter Market by Application, 2018 - 2021, USD Million
- TABLE 84 Germany Shea Butter Market by Application, 2022 - 2028, USD Million
- TABLE 85 UK Shea Butter Market, 2018 - 2021, USD Million
- TABLE 86 UK Shea Butter Market, 2022 - 2028, USD Million
- TABLE 87 UK Shea Butter Market by Product, 2018 - 2021, USD Million
- TABLE 88 UK Shea Butter Market by Product, 2022 - 2028, USD Million
- TABLE 89 UK Shea Butter Market by Application, 2018 - 2021, USD Million
- TABLE 90 UK Shea Butter Market by Application, 2022 - 2028, USD Million
- TABLE 91 France Shea Butter Market, 2018 - 2021, USD Million
- TABLE 92 France Shea Butter Market, 2022 - 2028, USD Million
- TABLE 93 France Shea Butter Market by Product, 2018 - 2021, USD Million
- TABLE 94 France Shea Butter Market by Product, 2022 - 2028, USD Million
- TABLE 95 France Shea Butter Market by Application, 2018 - 2021, USD Million
- TABLE 96 France Shea Butter Market by Application, 2022 - 2028, USD Million
- TABLE 97 Russia Shea Butter Market, 2018 - 2021, USD Million
- TABLE 98 Russia Shea Butter Market, 2022 - 2028, USD Million
- TABLE 99 Russia Shea Butter Market by Product, 2018 - 2021, USD Million
- TABLE 100 Russia Shea Butter Market by Product, 2022 - 2028, USD Million
- TABLE 101 Russia Shea Butter Market by Application, 2018 - 2021, USD Million
- TABLE 102 Russia Shea Butter Market by Application, 2022 - 2028, USD Million
- TABLE 103 Spain Shea Butter Market, 2018 - 2021, USD Million
- TABLE 104 Spain Shea Butter Market, 2022 - 2028, USD Million
- TABLE 105 Spain Shea Butter Market by Product, 2018 - 2021, USD Million
- TABLE 106 Spain Shea Butter Market by Product, 2022 - 2028, USD Million
- TABLE 107 Spain Shea Butter Market by Application, 2018 - 2021, USD Million
- TABLE 108 Spain Shea Butter Market by Application, 2022 - 2028, USD Million
- TABLE 109 Italy Shea Butter Market, 2018 - 2021, USD Million
- TABLE 110 Italy Shea Butter Market, 2022 - 2028, USD Million
- TABLE 111 Italy Shea Butter Market by Product, 2018 - 2021, USD Million
- TABLE 112 Italy Shea Butter Market by Product, 2022 - 2028, USD Million
- TABLE 113 Italy Shea Butter Market by Application, 2018 - 2021, USD Million
- TABLE 114 Italy Shea Butter Market by Application, 2022 - 2028, USD Million
- TABLE 115 Rest of Europe Shea Butter Market, 2018 - 2021, USD Million
- TABLE 116 Rest of Europe Shea Butter Market, 2022 - 2028, USD Million
- TABLE 117 Rest of Europe Shea Butter Market by Product, 2018 - 2021, USD Million
- TABLE 118 Rest of Europe Shea Butter Market by Product, 2022 - 2028, USD Million
- TABLE 119 Rest of Europe Shea Butter Market by Application, 2018 - 2021, USD Million
- TABLE 120 Rest of Europe Shea Butter Market by Application, 2022 - 2028, USD Million
- TABLE 121 Asia Pacific Shea Butter Market, 2018 - 2021, USD Million
- TABLE 122 Asia Pacific Shea Butter Market, 2022 - 2028, USD Million
- TABLE 123 Asia Pacific Shea Butter Market by Product, 2018 - 2021, USD Million
- TABLE 124 Asia Pacific Shea Butter Market by Product, 2022 - 2028, USD Million
- TABLE 125 Asia Pacific Raw & Unrefined Market by Country, 2018 - 2021, USD Million
- TABLE 126 Asia Pacific Raw & Unrefined Market by Country, 2022 - 2028, USD Million
- TABLE 127 Asia Pacific Refined Market by Country, 2018 - 2021, USD Million
- TABLE 128 Asia Pacific Refined Market by Country, 2022 - 2028, USD Million
- TABLE 129 Asia Pacific Shea Butter Market by Application, 2018 - 2021, USD Million
- TABLE 130 Asia Pacific Shea Butter Market by Application, 2022 - 2028, USD Million
- TABLE 131 Asia Pacific Cosmetics & Personal Care Market by Country, 2018 - 2021, USD Million
- TABLE 132 Asia Pacific Cosmetics & Personal Care Market by Country, 2022 - 2028, USD Million
- TABLE 133 Asia Pacific Food Market by Country, 2018 - 2021, USD Million
- TABLE 134 Asia Pacific Food Market by Country, 2022 - 2028, USD Million
- TABLE 135 Asia Pacific Others Market by Country, 2018 - 2021, USD Million
- TABLE 136 Asia Pacific Others Market by Country, 2022 - 2028, USD Million
- TABLE 137 Asia Pacific Shea Butter Market by Country, 2018 - 2021, USD Million
- TABLE 138 Asia Pacific Shea Butter Market by Country, 2022 - 2028, USD Million
- TABLE 139 China Shea Butter Market, 2018 - 2021, USD Million
- TABLE 140 China Shea Butter Market, 2022 - 2028, USD Million
- TABLE 141 China Shea Butter Market by Product, 2018 - 2021, USD Million
- TABLE 142 China Shea Butter Market by Product, 2022 - 2028, USD Million
- TABLE 143 China Shea Butter Market by Application, 2018 - 2021, USD Million
- TABLE 144 China Shea Butter Market by Application, 2022 - 2028, USD Million
- TABLE 145 Japan Shea Butter Market, 2018 - 2021, USD Million
- TABLE 146 Japan Shea Butter Market, 2022 - 2028, USD Million
- TABLE 147 Japan Shea Butter Market by Product, 2018 - 2021, USD Million
- TABLE 148 Japan Shea Butter Market by Product, 2022 - 2028, USD Million
- TABLE 149 Japan Shea Butter Market by Application, 2018 - 2021, USD Million
- TABLE 150 Japan Shea Butter Market by Application, 2022 - 2028, USD Million
- TABLE 151 India Shea Butter Market, 2018 - 2021, USD Million
- TABLE 152 India Shea Butter Market, 2022 - 2028, USD Million
- TABLE 153 India Shea Butter Market by Product, 2018 - 2021, USD Million
- TABLE 154 India Shea Butter Market by Product, 2022 - 2028, USD Million
- TABLE 155 India Shea Butter Market by Application, 2018 - 2021, USD Million
- TABLE 156 India Shea Butter Market by Application, 2022 - 2028, USD Million
- TABLE 157 South Korea Shea Butter Market, 2018 - 2021, USD Million
- TABLE 158 South Korea Shea Butter Market, 2022 - 2028, USD Million
- TABLE 159 South Korea Shea Butter Market by Product, 2018 - 2021, USD Million
- TABLE 160 South Korea Shea Butter Market by Product, 2022 - 2028, USD Million
- TABLE 161 South Korea Shea Butter Market by Application, 2018 - 2021, USD Million
- TABLE 162 South Korea Shea Butter Market by Application, 2022 - 2028, USD Million
- TABLE 163 Singapore Shea Butter Market, 2018 - 2021, USD Million
- TABLE 164 Singapore Shea Butter Market, 2022 - 2028, USD Million
- TABLE 165 Singapore Shea Butter Market by Product, 2018 - 2021, USD Million
- TABLE 166 Singapore Shea Butter Market by Product, 2022 - 2028, USD Million
- TABLE 167 Singapore Shea Butter Market by Application, 2018 - 2021, USD Million
- TABLE 168 Singapore Shea Butter Market by Application, 2022 - 2028, USD Million
- TABLE 169 Malaysia Shea Butter Market, 2018 - 2021, USD Million
- TABLE 170 Malaysia Shea Butter Market, 2022 - 2028, USD Million
- TABLE 171 Malaysia Shea Butter Market by Product, 2018 - 2021, USD Million
- TABLE 172 Malaysia Shea Butter Market by Product, 2022 - 2028, USD Million
- TABLE 173 Malaysia Shea Butter Market by Application, 2018 - 2021, USD Million
- TABLE 174 Malaysia Shea Butter Market by Application, 2022 - 2028, USD Million
- TABLE 175 Rest of Asia Pacific Shea Butter Market, 2018 - 2021, USD Million
- TABLE 176 Rest of Asia Pacific Shea Butter Market, 2022 - 2028, USD Million
- TABLE 177 Rest of Asia Pacific Shea Butter Market by Product, 2018 - 2021, USD Million
- TABLE 178 Rest of Asia Pacific Shea Butter Market by Product, 2022 - 2028, USD Million
- TABLE 179 Rest of Asia Pacific Shea Butter Market by Application, 2018 - 2021, USD Million
- TABLE 180 Rest of Asia Pacific Shea Butter Market by Application, 2022 - 2028, USD Million
- TABLE 181 LAMEA Shea Butter Market, 2018 - 2021, USD Million
- TABLE 182 LAMEA Shea Butter Market, 2022 - 2028, USD Million
- TABLE 183 LAMEA Shea Butter Market by Product, 2018 - 2021, USD Million
- TABLE 184 LAMEA Shea Butter Market by Product, 2022 - 2028, USD Million
- TABLE 185 LAMEA Raw & Unrefined Market by Country, 2018 - 2021, USD Million
- TABLE 186 LAMEA Raw & Unrefined Market by Country, 2022 - 2028, USD Million
- TABLE 187 LAMEA Refined Market by Country, 2018 - 2021, USD Million
- TABLE 188 LAMEA Refined Market by Country, 2022 - 2028, USD Million
- TABLE 189 LAMEA Shea Butter Market by Application, 2018 - 2021, USD Million
- TABLE 190 LAMEA Shea Butter Market by Application, 2022 - 2028, USD Million
- TABLE 191 LAMEA Cosmetics & Personal Care Market by Country, 2018 - 2021, USD Million
- TABLE 192 LAMEA Cosmetics & Personal Care Market by Country, 2022 - 2028, USD Million
- TABLE 193 LAMEA Food Market by Country, 2018 - 2021, USD Million
- TABLE 194 LAMEA Food Market by Country, 2022 - 2028, USD Million
- TABLE 195 LAMEA Others Market by Country, 2018 - 2021, USD Million
- TABLE 196 LAMEA Others Market by Country, 2022 - 2028, USD Million
- TABLE 197 LAMEA Shea Butter Market by Country, 2018 - 2021, USD Million
- TABLE 198 LAMEA Shea Butter Market by Country, 2022 - 2028, USD Million
- TABLE 199 Brazil Shea Butter Market, 2018 - 2021, USD Million
- TABLE 200 Brazil Shea Butter Market, 2022 - 2028, USD Million
- TABLE 201 Brazil Shea Butter Market by Product, 2018 - 2021, USD Million
- TABLE 202 Brazil Shea Butter Market by Product, 2022 - 2028, USD Million
- TABLE 203 Brazil Shea Butter Market by Application, 2018 - 2021, USD Million
- TABLE 204 Brazil Shea Butter Market by Application, 2022 - 2028, USD Million
- TABLE 205 Argentina Shea Butter Market, 2018 - 2021, USD Million
- TABLE 206 Argentina Shea Butter Market, 2022 - 2028, USD Million
- TABLE 207 Argentina Shea Butter Market by Product, 2018 - 2021, USD Million
- TABLE 208 Argentina Shea Butter Market by Product, 2022 - 2028, USD Million
- TABLE 209 Argentina Shea Butter Market by Application, 2018 - 2021, USD Million
- TABLE 210 Argentina Shea Butter Market by Application, 2022 - 2028, USD Million
- TABLE 211 UAE Shea Butter Market, 2018 - 2021, USD Million
- TABLE 212 UAE Shea Butter Market, 2022 - 2028, USD Million
- TABLE 213 UAE Shea Butter Market by Product, 2018 - 2021, USD Million
- TABLE 214 UAE Shea Butter Market by Product, 2022 - 2028, USD Million
- TABLE 215 UAE Shea Butter Market by Application, 2018 - 2021, USD Million
- TABLE 216 UAE Shea Butter Market by Application, 2022 - 2028, USD Million
- TABLE 217 Saudi Arabia Shea Butter Market, 2018 - 2021, USD Million
- TABLE 218 Saudi Arabia Shea Butter Market, 2022 - 2028, USD Million
- TABLE 219 Saudi Arabia Shea Butter Market by Product, 2018 - 2021, USD Million
- TABLE 220 Saudi Arabia Shea Butter Market by Product, 2022 - 2028, USD Million
- TABLE 221 Saudi Arabia Shea Butter Market by Application, 2018 - 2021, USD Million
- TABLE 222 Saudi Arabia Shea Butter Market by Application, 2022 - 2028, USD Million
- TABLE 223 South Africa Shea Butter Market, 2018 - 2021, USD Million
- TABLE 224 South Africa Shea Butter Market, 2022 - 2028, USD Million
- TABLE 225 South Africa Shea Butter Market by Product, 2018 - 2021, USD Million
- TABLE 226 South Africa Shea Butter Market by Product, 2022 - 2028, USD Million
- TABLE 227 South Africa Shea Butter Market by Application, 2018 - 2021, USD Million
- TABLE 228 South Africa Shea Butter Market by Application, 2022 - 2028, USD Million
- TABLE 229 Nigeria Shea Butter Market, 2018 - 2021, USD Million
- TABLE 230 Nigeria Shea Butter Market, 2022 - 2028, USD Million
- TABLE 231 Nigeria Shea Butter Market by Product, 2018 - 2021, USD Million
- TABLE 232 Nigeria Shea Butter Market by Product, 2022 - 2028, USD Million
- TABLE 233 Nigeria Shea Butter Market by Application, 2018 - 2021, USD Million
- TABLE 234 Nigeria Shea Butter Market by Application, 2022 - 2028, USD Million
- TABLE 235 Rest of LAMEA Shea Butter Market, 2018 - 2021, USD Million
- TABLE 236 Rest of LAMEA Shea Butter Market, 2022 - 2028, USD Million
- TABLE 237 Rest of LAMEA Shea Butter Market by Product, 2018 - 2021, USD Million
- TABLE 238 Rest of LAMEA Shea Butter Market by Product, 2022 - 2028, USD Million
- TABLE 239 Rest of LAMEA Shea Butter Market by Application, 2018 - 2021, USD Million
- TABLE 240 Rest of LAMEA Shea Butter Market by Application, 2022 - 2028, USD Million
- TABLE 241 Key information - AAK AB
- TABLE 242 Key Information - Bunge Limited
- TABLE 243 Key Information - BASF SE
- TABLE 244 key Information - Archer Daniels Midland Company
- TABLE 245 Key Information - Clariant AG
- TABLE 246 Key Information - Croda International PLC
- TABLE 247 Key Information - Cargill, Incorporated
- TABLE 248 Key Information - Stern-Wywiol Gruppe GmbH & Co. KG
- TABLE 249 Key Information - OLVEA Group
- TABLE 250 Key Information - 3F Industries Ltd.
List of Figures
- FIG 1 Methodology for the research
- FIG 2 Global Shea Butter Market Share by Product, 2021
- FIG 3 Global Shea Butter Market Share by Product, 2028
- FIG 4 Global Shea Butter Market by Product, 2018 - 2028, USD Million
- FIG 5 Global Shea Butter Market Share by Application, 2021
- FIG 6 Global Shea Butter Market Share by Application, 2028
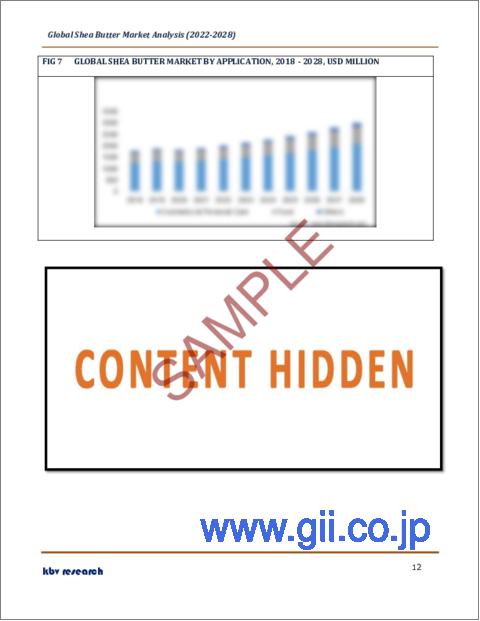
- FIG 7 Global Shea Butter Market by Application, 2018 - 2028, USD Million
- FIG 8 Global Shea Butter Market Share by Region, 2021
- FIG 9 Global Shea Butter Market Share by Region, 2028
- FIG 10 Global Shea Butter Market by Region, 2018 - 2028, USD Million
The Global Shea Butter Market size is expected to reach $3 billion by 2028, rising at a market growth of 7.0% CAGR during the forecast period.
Fats accumulated from the shea tree nuts are known as shea butter. The butter is a native product of the West Africa region and is usually solid at room temperature. The color of this butter varies from ivory or off-white to grayish-yellow. It is ivory in its raw state and yellow when dyed with palm oil or borututu root. For centuries, the people of the African peninsula have used shea butter as a cosmetic ingredient, mostly as a lotion, salve, or moisturizer.
The high vitamin and fatty acid concentrations of the butter make it an exceptional product for conditioning, soothing and smoothing the skin. Additionally, since the butter is edible, it is also used as a cooking oil and supplement. Many African countries have been traditionally using shea butter in food preparation, and presently, the butter is used in the food industry in products that need consistency or texture enhancement.
Generally, two prominent varieties of shea nuts are used for the preparation of shea butter. The West African variety, Vitellaria paradoxa, and the east African variety, Vitellaria nilotica produce shea butter that differs slightly in texture, nutrient content, and consistency. Shea butter prepared from the paradoxa variety is denser, while those crafted from nilotica tend to be more liquid.
Additionally, the east African variety of shea butter is considered to be more luxurious and is scarcely available because of the limited supply of the product. It also spreads more easily and suits many skin types and problems like sensitive skin, bruised skin, dry & peeling skin, wounds, burns, aging skin, and baby skin. On the other hand, the West African variety of shea butter is generally used for stretch marks, blemishes, wrinkles, and scars owing to its high vitamin A content.
COVID-19 Impact Analysis
The COVID-19 pandemic had a severely negative impact on the shea butter market. The period emerged as a difficult time for the manufacturing, developing, and logistics companies associated with this market. Since restrictions were placed in many nations by the governments, it disrupted the supply chain of the market. The most negative impact was faced by companies that dealt with the procurement and distribution of shea butter as a raw material since the pandemic led to the closure of international borders.
Market Growth Factors
Increasing Awareness of the Benefits of Shea Butter
Shea butter is widely known as an excellent emollient that smoothens and softens the skin. The rich amount of oil present in it rapidly soaks into the skin, creating a soft moisture-sealing barrier. Additionally, in the last few years, the other benefits of shea butter have been glorified intensely. The butter has healing and anti-inflammatory properties that help in managing swelling and redness on the face. It also promotes collagen production. All properties of shea butter emerge from the presence of fats in the nut.
Rising Demand for Anti-Aging Skincare and Cosmetic Products
The hectic lifestyles of the present day have resulted in an increase in demand for high-performance and time-efficient products in general. The same demand is also made in the personal care industry. Additionally, hectic lifestyles have also led to the consumption of foods and beverages that are high in sugar or preservatives, which are responsible for the deterioration of skin and magnify wrinkles. As a result, the demand for antioxidant-rich products has intensified as antioxidants readily help in minimizing the effects of aging on the skin.
Market Restraining Factors
Risks and Limitations Associated With the Use of Shea Butter
Shea butter is known as a low-risk topical compound for use, and the chances of allergic reactions from using it are rare but possible. Researchers believe that the low presence of a specific tree nut protein is mainly accountable for triggering allergies. While the low allergy-causing factor projects the product as suitable for all, it might not be the case. For many users, shea butter may clog pores and aggravate acne problems.
Product Outlook
Based on product, the shea butter market is categorized into raw & unrefined and refined. The refined segment procured a considerable growth rate in the shea butter market in 2021. Processed or refined products elongate the shelf life of products. More people now demand refined shea butter as the refining process removes any scent and color of the product, which is especially good for sensitive people. The removal of color and scent also increases the applicability of shea butter to be mixed with other ingredients.
Application Outlook
On the basis of application, the shea butter market is divided into cosmetics & personal care, food, and others. The cosmetic and personal care segment acquired the largest revenue share in the shea butter market in 2021. The increasing use of shea butter in lotions, creams, soaps, toiletries, and color cosmetics is helping in the expansion of the segment. This demand is propelled by growing consumer inclination towards organic and natural beauty and skin care products. Additionally, the rising influence of sustainability is steadily increasing the demand for organic products.
Regional Outlook
Based on region, the shea butter market is analyzed across North America, Europe, Asia Pacific, and LAMEA. The Europe region garnered the maximum revenue share in the shea butter market in 2021. The use of shea butter is increasing in products like moisturizers, body lotions, and chocolates in this region owing to the presence of numerous pharmaceutical and cosmetics industries. The proximity of the region to the African subcontinent also ensures a steady supply of shea butter.
The market research report covers the analysis of key stake holders of the market. Key companies profiled in the report include AAK AB, Bunge Limited, BASF SE, Archer-Daniels-Midland Company, Clariant AG, Croda International PLC, Cargill, Incorporated, Stern-Wywiol Gruppe GmbH & Co. KG, OLVEA Group, 3F Industries Ltd.
Scope of the Study
Market Segments covered in the Report:
By Product
- Raw & Unrefined
- Refined
By Application
- Cosmetics & Personal Care
- Food
- Others
By Geography
- North America
- US
- Canada
- Mexico
- Rest of North America
- Europe
- Germany
- UK
- France
- Russia
- Spain
- Italy
- Rest of Europe
- Asia Pacific
- China
- Japan
- India
- South Korea
- Singapore
- Malaysia
- Rest of Asia Pacific
- LAMEA
- Brazil
- Argentina
- UAE
- Saudi Arabia
- South Africa
- Nigeria
- Rest of LAMEA
Companies Profiled
- AAK AB
- Bunge Limited
- BASF SE
- Archer-Daniels-Midland Company
- Clariant AG
- Croda International PLC
- Cargill, Incorporated
- Stern-Wywiol Gruppe GmbH & Co. KG
- OLVEA Group
- 3F Industries Ltd.
Unique Offerings from KBV Research
- Exhaustive coverage
- Highest number of market tables and figures
- Subscription based model available
- Guaranteed best price
- Assured post sales research support with 10% customization free
Table of Contents
Chapter 1. Market Scope & Methodology
- 1.1 Market Definition
- 1.2 Objectives
- 1.3 Market Scope
- 1.4 Segmentation
- 1.4.1 Global Shea Butter Market, by Product
- 1.4.2 Global Shea Butter Market, by Application
- 1.4.3 Global Shea Butter Market, by Geography
- 1.5 Methodology for the research
Chapter 2. Market Overview
- 2.1 Introduction
- 2.1.1 Overview
- 2.1.1.1 Market Composition and Scenario
- 2.1.1 Overview
- 2.2 Key Factors Impacting the Market
- 2.2.1 Market Drivers
- 2.2.2 Market Restraints
Chapter 3. Global Shea Butter Market by Product
- 3.1 Global Raw & Unrefined Market by Region
- 3.2 Global Refined Market by Region
Chapter 4. Global Shea Butter Market by Application
- 4.1 Global Cosmetics & Personal Care Market by Region
- 4.2 Global Food Market by Region
- 4.3 Global Others Market by Region
Chapter 5. Global Shea Butter Market by Region
- 5.1 North America Shea Butter Market
- 5.1.1 North America Shea Butter Market by Product
- 5.1.1.1 North America Raw & Unrefined Market by Country
- 5.1.1.2 North America Refined Market by Country
- 5.1.2 North America Shea Butter Market by Application
- 5.1.2.1 North America Cosmetics & Personal Care Market by Country
- 5.1.2.2 North America Food Market by Country
- 5.1.2.3 North America Others Market by Country
- 5.1.3 North America Shea Butter Market by Country
- 5.1.3.1 US Shea Butter Market
- 5.1.3.1.1 US Shea Butter Market by Product
- 5.1.3.1.2 US Shea Butter Market by Application
- 5.1.3.2 Canada Shea Butter Market
- 5.1.3.2.1 Canada Shea Butter Market by Product
- 5.1.3.2.2 Canada Shea Butter Market by Application
- 5.1.3.3 Mexico Shea Butter Market
- 5.1.3.3.1 Mexico Shea Butter Market by Product
- 5.1.3.3.2 Mexico Shea Butter Market by Application
- 5.1.3.4 Rest of North America Shea Butter Market
- 5.1.3.4.1 Rest of North America Shea Butter Market by Product
- 5.1.3.4.2 Rest of North America Shea Butter Market by Application
- 5.1.3.1 US Shea Butter Market
- 5.1.1 North America Shea Butter Market by Product
- 5.2 Europe Shea Butter Market
- 5.2.1 Europe Shea Butter Market by Product
- 5.2.1.1 Europe Raw & Unrefined Market by Country
- 5.2.1.2 Europe Refined Market by Country
- 5.2.2 Europe Shea Butter Market by Application
- 5.2.2.1 Europe Cosmetics & Personal Care Market by Country
- 5.2.2.2 Europe Food Market by Country
- 5.2.2.3 Europe Others Market by Country
- 5.2.3 Europe Shea Butter Market by Country
- 5.2.3.1 Germany Shea Butter Market
- 5.2.3.1.1 Germany Shea Butter Market by Product
- 5.2.3.1.2 Germany Shea Butter Market by Application
- 5.2.3.2 UK Shea Butter Market
- 5.2.3.2.1 UK Shea Butter Market by Product
- 5.2.3.2.2 UK Shea Butter Market by Application
- 5.2.3.3 France Shea Butter Market
- 5.2.3.3.1 France Shea Butter Market by Product
- 5.2.3.3.2 France Shea Butter Market by Application
- 5.2.3.4 Russia Shea Butter Market
- 5.2.3.4.1 Russia Shea Butter Market by Product
- 5.2.3.4.2 Russia Shea Butter Market by Application
- 5.2.3.5 Spain Shea Butter Market
- 5.2.3.5.1 Spain Shea Butter Market by Product
- 5.2.3.5.2 Spain Shea Butter Market by Application
- 5.2.3.6 Italy Shea Butter Market
- 5.2.3.6.1 Italy Shea Butter Market by Product
- 5.2.3.6.2 Italy Shea Butter Market by Application
- 5.2.3.7 Rest of Europe Shea Butter Market
- 5.2.3.7.1 Rest of Europe Shea Butter Market by Product
- 5.2.3.7.2 Rest of Europe Shea Butter Market by Application
- 5.2.3.1 Germany Shea Butter Market
- 5.2.1 Europe Shea Butter Market by Product
- 5.3 Asia Pacific Shea Butter Market
- 5.3.1 Asia Pacific Shea Butter Market by Product
- 5.3.1.1 Asia Pacific Raw & Unrefined Market by Country
- 5.3.1.2 Asia Pacific Refined Market by Country
- 5.3.2 Asia Pacific Shea Butter Market by Application
- 5.3.2.1 Asia Pacific Cosmetics & Personal Care Market by Country
- 5.3.2.2 Asia Pacific Food Market by Country
- 5.3.2.3 Asia Pacific Others Market by Country
- 5.3.3 Asia Pacific Shea Butter Market by Country
- 5.3.3.1 China Shea Butter Market
- 5.3.3.1.1 China Shea Butter Market by Product
- 5.3.3.1.2 China Shea Butter Market by Application
- 5.3.3.2 Japan Shea Butter Market
- 5.3.3.2.1 Japan Shea Butter Market by Product
- 5.3.3.2.2 Japan Shea Butter Market by Application
- 5.3.3.3 India Shea Butter Market
- 5.3.3.3.1 India Shea Butter Market by Product
- 5.3.3.3.2 India Shea Butter Market by Application
- 5.3.3.4 South Korea Shea Butter Market
- 5.3.3.4.1 South Korea Shea Butter Market by Product
- 5.3.3.4.2 South Korea Shea Butter Market by Application
- 5.3.3.5 Singapore Shea Butter Market
- 5.3.3.5.1 Singapore Shea Butter Market by Product
- 5.3.3.5.2 Singapore Shea Butter Market by Application
- 5.3.3.6 Malaysia Shea Butter Market
- 5.3.3.6.1 Malaysia Shea Butter Market by Product
- 5.3.3.6.2 Malaysia Shea Butter Market by Application
- 5.3.3.7 Rest of Asia Pacific Shea Butter Market
- 5.3.3.7.1 Rest of Asia Pacific Shea Butter Market by Product
- 5.3.3.7.2 Rest of Asia Pacific Shea Butter Market by Application
- 5.3.3.1 China Shea Butter Market
- 5.3.1 Asia Pacific Shea Butter Market by Product
- 5.4 LAMEA Shea Butter Market
- 5.4.1 LAMEA Shea Butter Market by Product
- 5.4.1.1 LAMEA Raw & Unrefined Market by Country
- 5.4.1.2 LAMEA Refined Market by Country
- 5.4.2 LAMEA Shea Butter Market by Application
- 5.4.2.1 LAMEA Cosmetics & Personal Care Market by Country
- 5.4.2.2 LAMEA Food Market by Country
- 5.4.2.3 LAMEA Others Market by Country
- 5.4.3 LAMEA Shea Butter Market by Country
- 5.4.3.1 Brazil Shea Butter Market
- 5.4.3.1.1 Brazil Shea Butter Market by Product
- 5.4.3.1.2 Brazil Shea Butter Market by Application
- 5.4.3.2 Argentina Shea Butter Market
- 5.4.3.2.1 Argentina Shea Butter Market by Product
- 5.4.3.2.2 Argentina Shea Butter Market by Application
- 5.4.3.3 UAE Shea Butter Market
- 5.4.3.3.1 UAE Shea Butter Market by Product
- 5.4.3.3.2 UAE Shea Butter Market by Application
- 5.4.3.4 Saudi Arabia Shea Butter Market
- 5.4.3.4.1 Saudi Arabia Shea Butter Market by Product
- 5.4.3.4.2 Saudi Arabia Shea Butter Market by Application
- 5.4.3.5 South Africa Shea Butter Market
- 5.4.3.5.1 South Africa Shea Butter Market by Product
- 5.4.3.5.2 South Africa Shea Butter Market by Application
- 5.4.3.6 Nigeria Shea Butter Market
- 5.4.3.6.1 Nigeria Shea Butter Market by Product
- 5.4.3.6.2 Nigeria Shea Butter Market by Application
- 5.4.3.7 Rest of LAMEA Shea Butter Market
- 5.4.3.7.1 Rest of LAMEA Shea Butter Market by Product
- 5.4.3.7.2 Rest of LAMEA Shea Butter Market by Application
- 5.4.3.1 Brazil Shea Butter Market
- 5.4.1 LAMEA Shea Butter Market by Product
Chapter 6. Company Profiles
- 6.1 AAK AB
- 6.1.1 Company Overview
- 6.1.2 Financial Analysis
- 6.1.3 Regional & Segmental Analysis
- 6.1.4 Recent strategies and developments:
- 6.1.4.1 Acquisition and Mergers:
- 6.2 Bunge Limited
- 6.2.1 Company Overview
- 6.2.2 Financial Analysis
- 6.2.3 Segmental and Regional Analysis
- 6.2.4 Research & Development Expense
- 6.2.5 Recent strategies and developments:
- 6.2.5.1 Approvals and Trials:
- 6.2.5.2 Geographical Expansions:
- 6.3 BASF SE
- 6.3.1 Company Overview
- 6.3.2 Financial Analysis
- 6.3.3 Segmental and Regional Analysis
- 6.3.4 Research & Development Expense
- 6.3.5 Recent strategies and developments:
- 6.3.5.1 Partnerships, Collaborations, and Agreements:
- 6.4 Archer-Daniels-Midland Company
- 6.4.1 Company Overview
- 6.4.2 Financial Analysis
- 6.4.3 Segmental and Regional Analysis
- 6.4.4 Research & Development Expense
- 6.5 Clariant AG
- 6.5.1 Company Overview
- 6.5.2 Financial Analysis
- 6.5.3 Segmental and Regional Analysis
- 6.5.4 Research & Development Expenses
- 6.6 Croda International PLC
- 6.6.1 Company Overview
- 6.6.2 Financial Analysis
- 6.6.3 Segmental and Regional Analysis
- 6.6.4 Research & Development Expenses
- 6.6.5 Recent strategies and developments:
- 6.6.5.1 Partnerships, Collaborations, and Agreements:
- 6.7 Cargill, Incorporated
- 6.7.1 Company Overview
- 6.7.2 Recent strategies and developments:
- 6.7.2.1 Acquisition and Mergers:
- 6.8 Stern-Wywiol Gruppe GmbH & Co. KG
- 6.8.1 Company Overview
- 6.9 OLVEA Group
- 6.9.1 Company Overview
- 6.10. 3F Industries Ltd.
- 6.10.1 Company Overview