|
|
市場調査レポート
商品コード
1154854
環境修復の世界市場規模、シェア、産業動向分析レポート:サイトタイプ別(民間、公共)、技術別、環境媒体別(土壌、地下水)、用途別、地域別展望と予測、2022年~2028年Global Environmental Remediation Market Size, Share & Industry Trends Analysis Report By Site Type (Private and Public), By Technology, By Environment Medium (Soil and Groundwater), By Application, By Regional Outlook and Forecast, 2022 - 2028 |
||||||
|
|
|||||||


| 環境修復の世界市場規模、シェア、産業動向分析レポート:サイトタイプ別(民間、公共)、技術別、環境媒体別(土壌、地下水)、用途別、地域別展望と予測、2022年~2028年 |
|
出版日: 2022年10月31日
発行: KBV Research
ページ情報: 英文 326 Pages
納期: 即納可能
|
- 全表示
- 概要
- 図表
- 目次
環境修復の世界市場規模は、予測期間中にCAGR8.1%で成長し、2028年には1696億米ドルに達すると予測されています。
土壌、堆積物、地下水、地表水など、さまざまな環境媒体で環境修復が行われます。土壌浄化には表土、下層土、堆積物が含まれ、水質浄化には地下水と地表水の両方が含まれます。汚染の性質や程度に応じて、土壌と水の浄化は別々に行われることもあれば、同時に行われることもあります。
水質浄化は、水中の汚染物質を除去することです。湖、小川、河川の地表水は、汚染物質が直接水中に投棄されたり、土地から流出することによって汚染されることがあります。地下水は、多孔質の物質を透過する地下水であり、その上の土壌やシルトから染み出た有害物質によって汚染されることがあります。廃棄物が不適切に処理されたり、土地に保管されたりして、土壌に浸透し、その後地下水に運ばれた結果、多くの地域で地下水汚染が発生しています。また、地下水の汚染は、鉱業や石油・天然ガス採掘などの産業活動によっても引き起こされています。
COVID-19の影響分析
COVID-19の悪影響はすでに明らかになっており、2020年の環境浄化活動に大きな影響を及ぼしています。輸出入、製造業、観光業、金融業はいずれも大きな被害を被っています。ウイルスの出現は、ただでさえ低調な経済成長にリスク要因を追加することになっています。複数の国際機関によると、現在の経済情勢は金融危機以降で最も厳しいとされています。パンデミック以降、消費者の消費と需要のパターンが変化したため、輸出入の制限は環境浄化に大きな影響を及ぼしています。多くの企業が環境修復工事の発注を延期・中止しており、その結果、被害を受けた油田跡地の環境修復サービスに対する需要が減少しています。
市場の成長要因
規制の枠組みが市場の基盤
産業活動から排出される規制が緩く、管理されていない廃棄物、特に有害な産業廃棄物の処分や管理は、土地や水の汚染問題の先行を含め、環境破壊の主要な要因となっています。産業運営と法律の成熟により、大多数の先進国では、土地や水質汚染が将来的に著しく増加することはないと考えられています。規制とその施行は、修復作業の主要な推進力です。したがって、規制の重点の調整や予測されるシフトは、修復サービスの需要パターンに大きな影響を与えるであろう。
修復手順の革新
近年、汚泥を発生させない新しい酸化プロセスが、汚染された水や廃水の浄化に大きな成果を上げていることが示されています。また、ナノ粒子を用いた汎環境修復は、環境汚染物質の発見と除去を加速させる。ナノ材料と分析技術を使用して、さまざまな環境汚染物質を検出するための安価で使いやすい小型のデバイスが作成されています。
市場抑制要因
修復プロセスの高価な設備
土地の再開発や修復を行う際、危険物や有害廃棄物を移動させるには、大量のマテリアルハンドリングマシンが必要です。これらの機械は、廃棄物を移動させるために必要なものです。ショベルカー、ローダー、ダンプカー、トラックなど、レンタルで購入する場合でも、比較的高額な費用がかかります。そのため、クリーンアッププロジェクトを完了させるためには、補助的ではあるが非常に重要な機器に多大な資金を投入する必要があります。
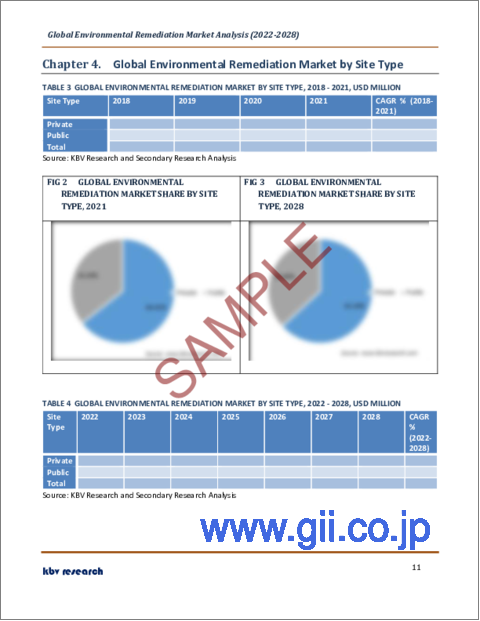
サイトタイプの展望
環境修復市場は、サイトの種類によって、民間と公共施設に分類されます。公共部門は、2021年の環境修復市場で大きな収益シェアを登録しました。それは、世界中で生産される廃水の約80%が環境に戻され、主に未処理のまま、川や湖、海などの水路の汚染に寄与しているためです。水質汚染という問題が蔓延した結果、人々の健康が危険にさらされているのです。
技術展望
環境修復市場は、技術別に土壌洗浄、化学処理、バイオレメディエーション、動電型修復、掘削、透水性反応バリア、原位置グラウティング・原位置ガラス固化、ファイトレメディエーション、ポンプ&トリートメント、土壌蒸気抽出、熱処理に区分されます。2021年の環境浄化市場では、化学処理分野がかなりの収益シェアを記録しました。それは、化学的浄化が、化学物質を用いて汚染物質から汚染物質を抽出する原位置法であるためです。化学的浄化技術は、現場で実施できるため浄化コストを低く抑えることができ、処理のために土壌や水を現場外に移送する必要がないため、急速な成長を遂げています。
環境媒体の展望
環境媒体別に見ると、環境修復市場は土壌と地下水に分けられます。地下水セグメントは、2021年の環境修復市場でかなりの収益シェアを記録しました。地下水の汚染は、ガソリン、油、道路塩、化学物質などの人工物質が土壌を通して地下水に到達し、汚染されて人間の消費に適さなくなることで起こります。地下水には、多数の無機物、物理的、有機化合物、および細菌や放射性汚染物質が存在します。
アプリケーションの展望
環境修復市場は用途によって、鉱業・林業、石油・ガス、農業、自動車、埋立地・廃棄物処理場、製造業・工業・化学品生産/加工、建設・土地開拓に分けられます。2021年の環境修復市場では、鉱業・林業分野が大きな収益シェアを占めています。金や銅などの金属やリンなどの資源を含む石炭や硬岩鉱を採掘していた地域の浄化・修復は、独特の問題に直面しています。
地域別展望
環境修復市場は、北米、欧州、アジア太平洋、LAMEAの各地域で分析されています。アジア太平洋地域は、2021年の環境修復市場において有望な成長率を獲得しました。これらの要因は、環境問題を悪化させ、アジア太平洋地域の環境修復市場の拡大に寄与すると予測されます。同地域の鉱業・林業用途では、揮発性有機汚染物質を環境中に排出する石炭やその他の鉱物の採掘が盛んであることから、環境修復の利用が増加しています。
目次
第1章 市場の範囲と調査手法
- 市場の定義
- 目的
- 市場規模
- セグメンテーション
- 環境修復の世界市場、サイトタイプ別
- 環境修復の世界市場、技術別
- 環境修復の世界市場、環境媒体別
- 環境修復の世界市場、用途別
- 環境修復の世界市場、地域別
- 調査手法
第2章 市場概要
- イントロダクション
- 概要説明
- 市場の構成とシナリオ
- 概要説明
- 市場に影響を与える主要因
- 市場促進要因
- 市場抑制要因
第3章 環境修復市場で展開されている戦略
第4章 環境修復の世界市場:サイトタイプ別
- 民間の世界市場:地域別
- 世界の公共施設市場:地域別
第5章 環境修復の世界市場:技術別
- バイオレメディエーションの世界市場:地域別
- 土壌洗浄の世界市場:地域別
- ファイトレメディエーションの世界市場:地域別
- 掘削の世界市場:地域別
- 世界の透水性反応バリア地域別市場
- 化学処理の地域別世界市場
- 動電型修復世界市場:地域別
- 地域別ポンプ&トリート世界市場
- 地域別土壌気化抽出の世界市場
- 地域別熱処理の世界市場
- 地域別原位置グラウティング&原位置ガラス固化の世界市場
第6章 環境修復の世界市場:環境媒体別
- 土壌の世界市場:地域別
- 世界の地下水市場:地域別
第7章 環境修復の世界市場アプリケーション別
- 世界の石油・ガス市場:地域別
- 製造業、工業、化学生産/処理の世界市場:地域別
- 自動車分野の世界市場:地域別
- 建設・土地開拓の世界市場:地域別
- 農業の世界市場:地域別
- 鉱業・林業の地域別世界市場
- 世界の埋立地・廃棄物処理場の地域別市場
- 地域別世界のその他市場
第8章 環境修復の世界市場:地域別
- 北米
- 北米の環境修復の国別市場
- 米国
- カナダ
- メキシコ
- その他北米地域
- 北米の環境修復の国別市場
- 欧州
- 欧州環境修復市場:国別
- ドイツ
- 英国
- フランス
- ロシア
- スペイン
- イタリア
- その他欧州
- 欧州環境修復市場:国別
- アジア太平洋地域
- アジア太平洋地域の環境修復市場:国別
- 中国
- 日本
- インド
- 韓国
- シンガポール
- マレーシア
- その他アジア太平洋地域
- アジア太平洋地域の環境修復市場:国別
- LAMEA
- LAMEAの環境修復市場:国別
- ブラジル
- アルゼンチン
- UAE
- サウジアラビア
- 南アフリカ
- ナイジェリア
- LAMEAの他の地域
- LAMEAの環境修復市場:国別
第9章 企業プロファイル
- Golder Associates(WSP Global Inc.)
- Clean Harbors, Inc.
- AECOM Corporation
- Stantec, Inc.
- HDR, Inc.
- Tetra Tech, Inc.
- Jacobs Engineering Group, Inc.
- DEME NV
- BRISEA Group, Inc.
LIST OF TABLES
- TABLE 1: Global Environmental Remediation Market, 2018 - 2021, USD Million
- TABLE 2: Global Environmental Remediation Market, 2022 - 2028, USD Million
- TABLE 3: Global Environmental Remediation Market by Site Type, 2018 - 2021, USD Million
- TABLE 4: Global Environmental Remediation Market by Site Type, 2022 - 2028, USD Million
- TABLE 5: Global Private Market by Region, 2018 - 2021, USD Million
- TABLE 6: Global Private Market by Region, 2022 - 2028, USD Million
- TABLE 7: Global Public Market by Region, 2018 - 2021, USD Million
- TABLE 8: Global Public Market by Region, 2022 - 2028, USD Million
- TABLE 9: Global Environmental Remediation Market by Technology, 2018 - 2021, USD Million
- TABLE 10: Global Environmental Remediation Market by Technology, 2022 - 2028, USD Million
- TABLE 11: Global Bioremediation Market by Region, 2018 - 2021, USD Million
- TABLE 12: Global Bioremediation Market by Region, 2022 - 2028, USD Million
- TABLE 13: Global Soil Washing Market by Region, 2018 - 2021, USD Million
- TABLE 14: Global Soil Washing Market by Region, 2022 - 2028, USD Million
- TABLE 15: Global Phytoremediation Market by Region, 2018 - 2021, USD Million
- TABLE 16: Global Phytoremediation Market by Region, 2022 - 2028, USD Million
- TABLE 17: Global Excavation Market by Region, 2018 - 2021, USD Million
- TABLE 18: Global Excavation Market by Region, 2022 - 2028, USD Million
- TABLE 19: Global Permeable Reactive Barriers Market by Region, 2018 - 2021, USD Million
- TABLE 20: Global Permeable Reactive Barriers Market by Region, 2022 - 2028, USD Million
- TABLE 21: Global Chemical Treatment Market by Region, 2018 - 2021, USD Million
- TABLE 22: Global Chemical Treatment Market by Region, 2022 - 2028, USD Million
- TABLE 23: Global Electrokinetic Remediation Market by Region, 2018 - 2021, USD Million
- TABLE 24: Global Electrokinetic Remediation Market by Region, 2022 - 2028, USD Million
- TABLE 25: Global Pump & Treat Market by Region, 2018 - 2021, USD Million
- TABLE 26: Global Pump & Treat Market by Region, 2022 - 2028, USD Million
- TABLE 27: Global Soil Vapor Extraction Market by Region, 2018 - 2021, USD Million
- TABLE 28: Global Soil Vapor Extraction Market by Region, 2022 - 2028, USD Million
- TABLE 29: Global Thermal Treatment Market by Region, 2018 - 2021, USD Million
- TABLE 30: Global Thermal Treatment Market by Region, 2022 - 2028, USD Million
- TABLE 31: Global In-situ Grouting & In-situ Vitrification Market by Region, 2018 - 2021, USD Million
- TABLE 32: Global In-situ Grouting & In-situ Vitrification Market by Region, 2022 - 2028, USD Million
- TABLE 33: Global Environmental Remediation Market by Environment Medium, 2018 - 2021, USD Million
- TABLE 34: Global Environmental Remediation Market by Environment Medium, 2022 - 2028, USD Million
- TABLE 35: Global Soil Market by Region, 2018 - 2021, USD Million
- TABLE 36: Global Soil Market by Region, 2022 - 2028, USD Million
- TABLE 37: Global Groundwater Market by Region, 2018 - 2021, USD Million
- TABLE 38: Global Groundwater Market by Region, 2022 - 2028, USD Million
- TABLE 39: Global Environmental Remediation Market by Application, 2018 - 2021, USD Million
- TABLE 40: Global Environmental Remediation Market by Application, 2022 - 2028, USD Million
- TABLE 41: Global Oil & Gas Market by Region, 2018 - 2021, USD Million
- TABLE 42: Global Oil & Gas Market by Region, 2022 - 2028, USD Million
- TABLE 43: Global Manufacturing, Industrial, & Chemical Production/Processing Market by Region, 2018 - 2021, USD Million
- TABLE 44: Global Manufacturing, Industrial, & Chemical Production/Processing Market by Region, 2022 - 2028, USD Million
- TABLE 45: Global Automotive Market by Region, 2018 - 2021, USD Million
- TABLE 46: Global Automotive Market by Region, 2022 - 2028, USD Million
- TABLE 47: Global Construction & Land Development Market by Region, 2018 - 2021, USD Million
- TABLE 48: Global Construction & Land Development Market by Region, 2022 - 2028, USD Million
- TABLE 49: Global Agriculture Market by Region, 2018 - 2021, USD Million
- TABLE 50: Global Agriculture Market by Region, 2022 - 2028, USD Million
- TABLE 51: Global Mining & Forestry Market by Region, 2018 - 2021, USD Million
- TABLE 52: Global Mining & Forestry Market by Region, 2022 - 2028, USD Million
- TABLE 53: Global Landfills & Waste Disposal Sites Market by Region, 2018 - 2021, USD Million
- TABLE 54: Global Landfills & Waste Disposal Sites Market by Region, 2022 - 2028, USD Million
- TABLE 55: Global Others Market by Region, 2018 - 2021, USD Million
- TABLE 56: Global Others Market by Region, 2022 - 2028, USD Million
- TABLE 57: Global Environmental Remediation Market by Region, 2018 - 2021, USD Million
- TABLE 58: Global Environmental Remediation Market by Region, 2022 - 2028, USD Million
- TABLE 59: North America Environmental Remediation Market, 2018 - 2021, USD Million
- TABLE 60: North America Environmental Remediation Market, 2022 - 2028, USD Million
- TABLE 61: North America Environmental Remediation Market by Site Type, 2018 - 2021, USD Million
- TABLE 62: North America Environmental Remediation Market by Site Type, 2022 - 2028, USD Million
- TABLE 63: North America Private Market by Country, 2018 - 2021, USD Million
- TABLE 64: North America Private Market by Country, 2022 - 2028, USD Million
- TABLE 65: North America Public Market by Country, 2018 - 2021, USD Million
- TABLE 66: North America Public Market by Country, 2022 - 2028, USD Million
- TABLE 67: North America Environmental Remediation Market by Technology, 2018 - 2021, USD Million
- TABLE 68: North America Environmental Remediation Market by Technology, 2022 - 2028, USD Million
- TABLE 69: North America Bioremediation Market by Country, 2018 - 2021, USD Million
- TABLE 70: North America Bioremediation Market by Country, 2022 - 2028, USD Million
- TABLE 71: North America Soil Washing Market by Country, 2018 - 2021, USD Million
- TABLE 72: North America Soil Washing Market by Country, 2022 - 2028, USD Million
- TABLE 73: North America Phytoremediation Market by Country, 2018 - 2021, USD Million
- TABLE 74: North America Phytoremediation Market by Country, 2022 - 2028, USD Million
- TABLE 75: North America Excavation Market by Country, 2018 - 2021, USD Million
- TABLE 76: North America Excavation Market by Country, 2022 - 2028, USD Million
- TABLE 77: North America Permeable Reactive Barriers Market by Country, 2018 - 2021, USD Million
- TABLE 78: North America Permeable Reactive Barriers Market by Country, 2022 - 2028, USD Million
- TABLE 79: North America Chemical Treatment Market by Country, 2018 - 2021, USD Million
- TABLE 80: North America Chemical Treatment Market by Country, 2022 - 2028, USD Million
- TABLE 81: North America Electrokinetic Remediation Market by Country, 2018 - 2021, USD Million
- TABLE 82: North America Electrokinetic Remediation Market by Country, 2022 - 2028, USD Million
- TABLE 83: North America Pump & Treat Market by Country, 2018 - 2021, USD Million
- TABLE 84: North America Pump & Treat Market by Country, 2022 - 2028, USD Million
- TABLE 85: North America Soil Vapor Extraction Market by Country, 2018 - 2021, USD Million
- TABLE 86: North America Soil Vapor Extraction Market by Country, 2022 - 2028, USD Million
- TABLE 87: North America Thermal Treatment Market by Country, 2018 - 2021, USD Million
- TABLE 88: North America Thermal Treatment Market by Country, 2022 - 2028, USD Million
- TABLE 89: North America In-situ Grouting & In-situ Vitrification Market by Country, 2018 - 2021, USD Million
- TABLE 90: North America In-situ Grouting & In-situ Vitrification Market by Country, 2022 - 2028, USD Million
- TABLE 91: North America Environmental Remediation Market by Environment Medium, 2018 - 2021, USD Million
- TABLE 92: North America Environmental Remediation Market by Environment Medium, 2022 - 2028, USD Million
- TABLE 93: North America Soil Market by Country, 2018 - 2021, USD Million
- TABLE 94: North America Soil Market by Country, 2022 - 2028, USD Million
- TABLE 95: North America Groundwater Market by Country, 2018 - 2021, USD Million
- TABLE 96: North America Groundwater Market by Country, 2022 - 2028, USD Million
- TABLE 97: North America Environmental Remediation Market by Application, 2018 - 2021, USD Million
- TABLE 98: North America Environmental Remediation Market by Application, 2022 - 2028, USD Million
- TABLE 99: North America Oil & Gas Market by Country, 2018 - 2021, USD Million
- TABLE 100: North America Oil & Gas Market by Country, 2022 - 2028, USD Million
- TABLE 101: North America Manufacturing, Industrial, & Chemical Production/Processing Market by Country, 2018 - 2021, USD Million
- TABLE 102: North America Manufacturing, Industrial, & Chemical Production/Processing Market by Country, 2022 - 2028, USD Million
- TABLE 103: North America Automotive Market by Country, 2018 - 2021, USD Million
- TABLE 104: North America Automotive Market by Country, 2022 - 2028, USD Million
- TABLE 105: North America Construction & Land Development Market by Country, 2018 - 2021, USD Million
- TABLE 106: North America Construction & Land Development Market by Country, 2022 - 2028, USD Million
- TABLE 107: North America Agriculture Market by Country, 2018 - 2021, USD Million
- TABLE 108: North America Agriculture Market by Country, 2022 - 2028, USD Million
- TABLE 109: North America Mining & Forestry Market by Country, 2018 - 2021, USD Million
- TABLE 110: North America Mining & Forestry Market by Country, 2022 - 2028, USD Million
- TABLE 111: North America Landfills & Waste Disposal Sites Market by Country, 2018 - 2021, USD Million
- TABLE 112: North America Landfills & Waste Disposal Sites Market by Country, 2022 - 2028, USD Million
- TABLE 113: North America Others Market by Country, 2018 - 2021, USD Million
- TABLE 114: North America Others Market by Country, 2022 - 2028, USD Million
- TABLE 115: North America Environmental Remediation Market by Country, 2018 - 2021, USD Million
- TABLE 116: North America Environmental Remediation Market by Country, 2022 - 2028, USD Million
- TABLE 117: US Environmental Remediation Market, 2018 - 2021, USD Million
- TABLE 118: US Environmental Remediation Market, 2022 - 2028, USD Million
- TABLE 119: US Environmental Remediation Market by Site Type, 2018 - 2021, USD Million
- TABLE 120: US Environmental Remediation Market by Site Type, 2022 - 2028, USD Million
- TABLE 121: US Environmental Remediation Market by Technology, 2018 - 2021, USD Million
- TABLE 122: US Environmental Remediation Market by Technology, 2022 - 2028, USD Million
- TABLE 123: US Environmental Remediation Market by Environment Medium, 2018 - 2021, USD Million
- TABLE 124: US Environmental Remediation Market by Environment Medium, 2022 - 2028, USD Million
- TABLE 125: US Environmental Remediation Market by Application, 2018 - 2021, USD Million
- TABLE 126: US Environmental Remediation Market by Application, 2022 - 2028, USD Million
- TABLE 127: Canada Environmental Remediation Market, 2018 - 2021, USD Million
- TABLE 128: Canada Environmental Remediation Market, 2022 - 2028, USD Million
- TABLE 129: Canada Environmental Remediation Market by Site Type, 2018 - 2021, USD Million
- TABLE 130: Canada Environmental Remediation Market by Site Type, 2022 - 2028, USD Million
- TABLE 131: Canada Environmental Remediation Market by Technology, 2018 - 2021, USD Million
- TABLE 132: Canada Environmental Remediation Market by Technology, 2022 - 2028, USD Million
- TABLE 133: Canada Environmental Remediation Market by Environment Medium, 2018 - 2021, USD Million
- TABLE 134: Canada Environmental Remediation Market by Environment Medium, 2022 - 2028, USD Million
- TABLE 135: Canada Environmental Remediation Market by Application, 2018 - 2021, USD Million
- TABLE 136: Canada Environmental Remediation Market by Application, 2022 - 2028, USD Million
- TABLE 137: Mexico Environmental Remediation Market, 2018 - 2021, USD Million
- TABLE 138: Mexico Environmental Remediation Market, 2022 - 2028, USD Million
- TABLE 139: Mexico Environmental Remediation Market by Site Type, 2018 - 2021, USD Million
- TABLE 140: Mexico Environmental Remediation Market by Site Type, 2022 - 2028, USD Million
- TABLE 141: Mexico Environmental Remediation Market by Technology, 2018 - 2021, USD Million
- TABLE 142: Mexico Environmental Remediation Market by Technology, 2022 - 2028, USD Million
- TABLE 143: Mexico Environmental Remediation Market by Environment Medium, 2018 - 2021, USD Million
- TABLE 144: Mexico Environmental Remediation Market by Environment Medium, 2022 - 2028, USD Million
- TABLE 145: Mexico Environmental Remediation Market by Application, 2018 - 2021, USD Million
- TABLE 146: Mexico Environmental Remediation Market by Application, 2022 - 2028, USD Million
- TABLE 147: Rest of North America Environmental Remediation Market, 2018 - 2021, USD Million
- TABLE 148: Rest of North America Environmental Remediation Market, 2022 - 2028, USD Million
- TABLE 149: Rest of North America Environmental Remediation Market by Site Type, 2018 - 2021, USD Million
- TABLE 150: Rest of North America Environmental Remediation Market by Site Type, 2022 - 2028, USD Million
- TABLE 151: Rest of North America Environmental Remediation Market by Technology, 2018 - 2021, USD Million
- TABLE 152: Rest of North America Environmental Remediation Market by Technology, 2022 - 2028, USD Million
- TABLE 153: Rest of North America Environmental Remediation Market by Environment Medium, 2018 - 2021, USD Million
- TABLE 154: Rest of North America Environmental Remediation Market by Environment Medium, 2022 - 2028, USD Million
- TABLE 155: Rest of North America Environmental Remediation Market by Application, 2018 - 2021, USD Million
- TABLE 156: Rest of North America Environmental Remediation Market by Application, 2022 - 2028, USD Million
- TABLE 157: Europe Environmental Remediation Market, 2018 - 2021, USD Million
- TABLE 158: Europe Environmental Remediation Market, 2022 - 2028, USD Million
- TABLE 159: Europe Environmental Remediation Market by Site Type, 2018 - 2021, USD Million
- TABLE 160: Europe Environmental Remediation Market by Site Type, 2022 - 2028, USD Million
- TABLE 161: Europe Private Market by Country, 2018 - 2021, USD Million
- TABLE 162: Europe Private Market by Country, 2022 - 2028, USD Million
- TABLE 163: Europe Public Market by Country, 2018 - 2021, USD Million
- TABLE 164: Europe Public Market by Country, 2022 - 2028, USD Million
- TABLE 165: Europe Environmental Remediation Market by Technology, 2018 - 2021, USD Million
- TABLE 166: Europe Environmental Remediation Market by Technology, 2022 - 2028, USD Million
- TABLE 167: Europe Bioremediation Market by Country, 2018 - 2021, USD Million
- TABLE 168: Europe Bioremediation Market by Country, 2022 - 2028, USD Million
- TABLE 169: Europe Soil Washing Market by Country, 2018 - 2021, USD Million
- TABLE 170: Europe Soil Washing Market by Country, 2022 - 2028, USD Million
- TABLE 171: Europe Phytoremediation Market by Country, 2018 - 2021, USD Million
- TABLE 172: Europe Phytoremediation Market by Country, 2022 - 2028, USD Million
- TABLE 173: Europe Excavation Market by Country, 2018 - 2021, USD Million
- TABLE 174: Europe Excavation Market by Country, 2022 - 2028, USD Million
- TABLE 175: Europe Permeable Reactive Barriers Market by Country, 2018 - 2021, USD Million
- TABLE 176: Europe Permeable Reactive Barriers Market by Country, 2022 - 2028, USD Million
- TABLE 177: Europe Chemical Treatment Market by Country, 2018 - 2021, USD Million
- TABLE 178: Europe Chemical Treatment Market by Country, 2022 - 2028, USD Million
- TABLE 179: Europe Electrokinetic Remediation Market by Country, 2018 - 2021, USD Million
- TABLE 180: Europe Electrokinetic Remediation Market by Country, 2022 - 2028, USD Million
- TABLE 181: Europe Pump & Treat Market by Country, 2018 - 2021, USD Million
- TABLE 182: Europe Pump & Treat Market by Country, 2022 - 2028, USD Million
- TABLE 183: Europe Soil Vapor Extraction Market by Country, 2018 - 2021, USD Million
- TABLE 184: Europe Soil Vapor Extraction Market by Country, 2022 - 2028, USD Million
- TABLE 185: Europe Thermal Treatment Market by Country, 2018 - 2021, USD Million
- TABLE 186: Europe Thermal Treatment Market by Country, 2022 - 2028, USD Million
- TABLE 187: Europe In-situ Grouting & In-situ Vitrification Market by Country, 2018 - 2021, USD Million
- TABLE 188: Europe In-situ Grouting & In-situ Vitrification Market by Country, 2022 - 2028, USD Million
- TABLE 189: Europe Environmental Remediation Market by Environment Medium, 2018 - 2021, USD Million
- TABLE 190: Europe Environmental Remediation Market by Environment Medium, 2022 - 2028, USD Million
- TABLE 191: Europe Soil Market by Country, 2018 - 2021, USD Million
- TABLE 192: Europe Soil Market by Country, 2022 - 2028, USD Million
- TABLE 193: Europe Groundwater Market by Country, 2018 - 2021, USD Million
- TABLE 194: Europe Groundwater Market by Country, 2022 - 2028, USD Million
- TABLE 195: Europe Environmental Remediation Market by Application, 2018 - 2021, USD Million
- TABLE 196: Europe Environmental Remediation Market by Application, 2022 - 2028, USD Million
- TABLE 197: Europe Oil & Gas Market by Country, 2018 - 2021, USD Million
- TABLE 198: Europe Oil & Gas Market by Country, 2022 - 2028, USD Million
- TABLE 199: Europe Manufacturing, Industrial, & Chemical Production/Processing Market by Country, 2018 - 2021, USD Million
- TABLE 200: Europe Manufacturing, Industrial, & Chemical Production/Processing Market by Country, 2022 - 2028, USD Million
- TABLE 201: Europe Automotive Market by Country, 2018 - 2021, USD Million
- TABLE 202: Europe Automotive Market by Country, 2022 - 2028, USD Million
- TABLE 203: Europe Construction & Land Development Market by Country, 2018 - 2021, USD Million
- TABLE 204: Europe Construction & Land Development Market by Country, 2022 - 2028, USD Million
- TABLE 205: Europe Agriculture Market by Country, 2018 - 2021, USD Million
- TABLE 206: Europe Agriculture Market by Country, 2022 - 2028, USD Million
- TABLE 207: Europe Mining & Forestry Market by Country, 2018 - 2021, USD Million
- TABLE 208: Europe Mining & Forestry Market by Country, 2022 - 2028, USD Million
- TABLE 209: Europe Landfills & Waste Disposal Sites Market by Country, 2018 - 2021, USD Million
- TABLE 210: Europe Landfills & Waste Disposal Sites Market by Country, 2022 - 2028, USD Million
- TABLE 211: Europe Others Market by Country, 2018 - 2021, USD Million
- TABLE 212: Europe Others Market by Country, 2022 - 2028, USD Million
- TABLE 213: Europe Environmental Remediation Market by Country, 2018 - 2021, USD Million
- TABLE 214: Europe Environmental Remediation Market by Country, 2022 - 2028, USD Million
- TABLE 215: Germany Environmental Remediation Market, 2018 - 2021, USD Million
- TABLE 216: Germany Environmental Remediation Market, 2022 - 2028, USD Million
- TABLE 217: Germany Environmental Remediation Market by Site Type, 2018 - 2021, USD Million
- TABLE 218: Germany Environmental Remediation Market by Site Type, 2022 - 2028, USD Million
- TABLE 219: Germany Environmental Remediation Market by Technology, 2018 - 2021, USD Million
- TABLE 220: Germany Environmental Remediation Market by Technology, 2022 - 2028, USD Million
- TABLE 221: Germany Environmental Remediation Market by Environment Medium, 2018 - 2021, USD Million
- TABLE 222: Germany Environmental Remediation Market by Environment Medium, 2022 - 2028, USD Million
- TABLE 223: Germany Environmental Remediation Market by Application, 2018 - 2021, USD Million
- TABLE 224: Germany Environmental Remediation Market by Application, 2022 - 2028, USD Million
- TABLE 225: UK Environmental Remediation Market, 2018 - 2021, USD Million
- TABLE 226: UK Environmental Remediation Market, 2022 - 2028, USD Million
- TABLE 227: UK Environmental Remediation Market by Site Type, 2018 - 2021, USD Million
- TABLE 228: UK Environmental Remediation Market by Site Type, 2022 - 2028, USD Million
- TABLE 229: UK Environmental Remediation Market by Technology, 2018 - 2021, USD Million
- TABLE 230: UK Environmental Remediation Market by Technology, 2022 - 2028, USD Million
- TABLE 231: UK Environmental Remediation Market by Environment Medium, 2018 - 2021, USD Million
- TABLE 232: UK Environmental Remediation Market by Environment Medium, 2022 - 2028, USD Million
- TABLE 233: UK Environmental Remediation Market by Application, 2018 - 2021, USD Million
- TABLE 234: UK Environmental Remediation Market by Application, 2022 - 2028, USD Million
- TABLE 235: France Environmental Remediation Market, 2018 - 2021, USD Million
- TABLE 236: France Environmental Remediation Market, 2022 - 2028, USD Million
- TABLE 237: France Environmental Remediation Market by Site Type, 2018 - 2021, USD Million
- TABLE 238: France Environmental Remediation Market by Site Type, 2022 - 2028, USD Million
- TABLE 239: France Environmental Remediation Market by Technology, 2018 - 2021, USD Million
- TABLE 240: France Environmental Remediation Market by Technology, 2022 - 2028, USD Million
- TABLE 241: France Environmental Remediation Market by Environment Medium, 2018 - 2021, USD Million
- TABLE 242: France Environmental Remediation Market by Environment Medium, 2022 - 2028, USD Million
- TABLE 243: France Environmental Remediation Market by Application, 2018 - 2021, USD Million
- TABLE 244: France Environmental Remediation Market by Application, 2022 - 2028, USD Million
- TABLE 245: Russia Environmental Remediation Market, 2018 - 2021, USD Million
- TABLE 246: Russia Environmental Remediation Market, 2022 - 2028, USD Million
- TABLE 247: Russia Environmental Remediation Market by Site Type, 2018 - 2021, USD Million
- TABLE 248: Russia Environmental Remediation Market by Site Type, 2022 - 2028, USD Million
- TABLE 249: Russia Environmental Remediation Market by Technology, 2018 - 2021, USD Million
- TABLE 250: Russia Environmental Remediation Market by Technology, 2022 - 2028, USD Million
- TABLE 251: Russia Environmental Remediation Market by Environment Medium, 2018 - 2021, USD Million
- TABLE 252: Russia Environmental Remediation Market by Environment Medium, 2022 - 2028, USD Million
- TABLE 253: Russia Environmental Remediation Market by Application, 2018 - 2021, USD Million
- TABLE 254: Russia Environmental Remediation Market by Application, 2022 - 2028, USD Million
- TABLE 255: Spain Environmental Remediation Market, 2018 - 2021, USD Million
- TABLE 256: Spain Environmental Remediation Market, 2022 - 2028, USD Million
- TABLE 257: Spain Environmental Remediation Market by Site Type, 2018 - 2021, USD Million
- TABLE 258: Spain Environmental Remediation Market by Site Type, 2022 - 2028, USD Million
- TABLE 259: Spain Environmental Remediation Market by Technology, 2018 - 2021, USD Million
- TABLE 260: Spain Environmental Remediation Market by Technology, 2022 - 2028, USD Million
- TABLE 261: Spain Environmental Remediation Market by Environment Medium, 2018 - 2021, USD Million
- TABLE 262: Spain Environmental Remediation Market by Environment Medium, 2022 - 2028, USD Million
- TABLE 263: Spain Environmental Remediation Market by Application, 2018 - 2021, USD Million
- TABLE 264: Spain Environmental Remediation Market by Application, 2022 - 2028, USD Million
- TABLE 265: Italy Environmental Remediation Market, 2018 - 2021, USD Million
- TABLE 266: Italy Environmental Remediation Market, 2022 - 2028, USD Million
- TABLE 267: Italy Environmental Remediation Market by Site Type, 2018 - 2021, USD Million
- TABLE 268: Italy Environmental Remediation Market by Site Type, 2022 - 2028, USD Million
- TABLE 269: Italy Environmental Remediation Market by Technology, 2018 - 2021, USD Million
- TABLE 270: Italy Environmental Remediation Market by Technology, 2022 - 2028, USD Million
- TABLE 271: Italy Environmental Remediation Market by Environment Medium, 2018 - 2021, USD Million
- TABLE 272: Italy Environmental Remediation Market by Environment Medium, 2022 - 2028, USD Million
- TABLE 273: Italy Environmental Remediation Market by Application, 2018 - 2021, USD Million
- TABLE 274: Italy Environmental Remediation Market by Application, 2022 - 2028, USD Million
- TABLE 275: Rest of Europe Environmental Remediation Market, 2018 - 2021, USD Million
- TABLE 276: Rest of Europe Environmental Remediation Market, 2022 - 2028, USD Million
- TABLE 277: Rest of Europe Environmental Remediation Market by Site Type, 2018 - 2021, USD Million
- TABLE 278: Rest of Europe Environmental Remediation Market by Site Type, 2022 - 2028, USD Million
- TABLE 279: Rest of Europe Environmental Remediation Market by Technology, 2018 - 2021, USD Million
- TABLE 280: Rest of Europe Environmental Remediation Market by Technology, 2022 - 2028, USD Million
- TABLE 281: Rest of Europe Environmental Remediation Market by Environment Medium, 2018 - 2021, USD Million
- TABLE 282: Rest of Europe Environmental Remediation Market by Environment Medium, 2022 - 2028, USD Million
- TABLE 283: Rest of Europe Environmental Remediation Market by Application, 2018 - 2021, USD Million
- TABLE 284: Rest of Europe Environmental Remediation Market by Application, 2022 - 2028, USD Million
- TABLE 285: Asia Pacific Environmental Remediation Market, 2018 - 2021, USD Million
- TABLE 286: Asia Pacific Environmental Remediation Market, 2022 - 2028, USD Million
- TABLE 287: Asia Pacific Environmental Remediation Market by Site Type, 2018 - 2021, USD Million
- TABLE 288: Asia Pacific Environmental Remediation Market by Site Type, 2022 - 2028, USD Million
- TABLE 289: Asia Pacific Private Market by Country, 2018 - 2021, USD Million
- TABLE 290: Asia Pacific Private Market by Country, 2022 - 2028, USD Million
- TABLE 291: Asia Pacific Public Market by Country, 2018 - 2021, USD Million
- TABLE 292: Asia Pacific Public Market by Country, 2022 - 2028, USD Million
- TABLE 293: Asia Pacific Environmental Remediation Market by Technology, 2018 - 2021, USD Million
- TABLE 294: Asia Pacific Environmental Remediation Market by Technology, 2022 - 2028, USD Million
- TABLE 295: Asia Pacific Bioremediation Market by Country, 2018 - 2021, USD Million
- TABLE 296: Asia Pacific Bioremediation Market by Country, 2022 - 2028, USD Million
- TABLE 297: Asia Pacific Soil Washing Market by Country, 2018 - 2021, USD Million
- TABLE 298: Asia Pacific Soil Washing Market by Country, 2022 - 2028, USD Million
- TABLE 299: Asia Pacific Phytoremediation Market by Country, 2018 - 2021, USD Million
- TABLE 300: Asia Pacific Phytoremediation Market by Country, 2022 - 2028, USD Million
- TABLE 301: Asia Pacific Excavation Market by Country, 2018 - 2021, USD Million
- TABLE 302: Asia Pacific Excavation Market by Country, 2022 - 2028, USD Million
- TABLE 303: Asia Pacific Permeable Reactive Barriers Market by Country, 2018 - 2021, USD Million
- TABLE 304: Asia Pacific Permeable Reactive Barriers Market by Country, 2022 - 2028, USD Million
- TABLE 305: Asia Pacific Chemical Treatment Market by Country, 2018 - 2021, USD Million
- TABLE 306: Asia Pacific Chemical Treatment Market by Country, 2022 - 2028, USD Million
- TABLE 307: Asia Pacific Electrokinetic Remediation Market by Country, 2018 - 2021, USD Million
- TABLE 308: Asia Pacific Electrokinetic Remediation Market by Country, 2022 - 2028, USD Million
- TABLE 309: Asia Pacific Pump & Treat Market by Country, 2018 - 2021, USD Million
- TABLE 310: Asia Pacific Pump & Treat Market by Country, 2022 - 2028, USD Million
- TABLE 311: Asia Pacific Soil Vapor Extraction Market by Country, 2018 - 2021, USD Million
- TABLE 312: Asia Pacific Soil Vapor Extraction Market by Country, 2022 - 2028, USD Million
- TABLE 313: Asia Pacific Thermal Treatment Market by Country, 2018 - 2021, USD Million
- TABLE 314: Asia Pacific Thermal Treatment Market by Country, 2022 - 2028, USD Million
- TABLE 315: Asia Pacific In-situ Grouting & In-situ Vitrification Market by Country, 2018 - 2021, USD Million
- TABLE 316: Asia Pacific In-situ Grouting & In-situ Vitrification Market by Country, 2022 - 2028, USD Million
- TABLE 317: Asia Pacific Environmental Remediation Market by Environment Medium, 2018 - 2021, USD Million
- TABLE 318: Asia Pacific Environmental Remediation Market by Environment Medium, 2022 - 2028, USD Million
- TABLE 319: Asia Pacific Soil Market by Country, 2018 - 2021, USD Million
- TABLE 320: Asia Pacific Soil Market by Country, 2022 - 2028, USD Million
- TABLE 321: Asia Pacific Groundwater Market by Country, 2018 - 2021, USD Million
- TABLE 322: Asia Pacific Groundwater Market by Country, 2022 - 2028, USD Million
- TABLE 323: Asia Pacific Environmental Remediation Market by Application, 2018 - 2021, USD Million
- TABLE 324: Asia Pacific Environmental Remediation Market by Application, 2022 - 2028, USD Million
- TABLE 325: Asia Pacific Oil & Gas Market by Country, 2018 - 2021, USD Million
- TABLE 326: Asia Pacific Oil & Gas Market by Country, 2022 - 2028, USD Million
- TABLE 327: Asia Pacific Manufacturing, Industrial, & Chemical Production/Processing Market by Country, 2018 - 2021, USD Million
- TABLE 328: Asia Pacific Manufacturing, Industrial, & Chemical Production/Processing Market by Country, 2022 - 2028, USD Million
- TABLE 329: Asia Pacific Automotive Market by Country, 2018 - 2021, USD Million
- TABLE 330: Asia Pacific Automotive Market by Country, 2022 - 2028, USD Million
- TABLE 331: Asia Pacific Construction & Land Development Market by Country, 2018 - 2021, USD Million
- TABLE 332: Asia Pacific Construction & Land Development Market by Country, 2022 - 2028, USD Million
- TABLE 333: Asia Pacific Agriculture Market by Country, 2018 - 2021, USD Million
- TABLE 334: Asia Pacific Agriculture Market by Country, 2022 - 2028, USD Million
- TABLE 335: Asia Pacific Mining & Forestry Market by Country, 2018 - 2021, USD Million
- TABLE 336: Asia Pacific Mining & Forestry Market by Country, 2022 - 2028, USD Million
- TABLE 337: Asia Pacific Landfills & Waste Disposal Sites Market by Country, 2018 - 2021, USD Million
- TABLE 338: Asia Pacific Landfills & Waste Disposal Sites Market by Country, 2022 - 2028, USD Million
- TABLE 339: Asia Pacific Others Market by Country, 2018 - 2021, USD Million
- TABLE 340: Asia Pacific Others Market by Country, 2022 - 2028, USD Million
- TABLE 341: Asia Pacific Environmental Remediation Market by Country, 2018 - 2021, USD Million
- TABLE 342: Asia Pacific Environmental Remediation Market by Country, 2022 - 2028, USD Million
- TABLE 343: China Environmental Remediation Market, 2018 - 2021, USD Million
- TABLE 344: China Environmental Remediation Market, 2022 - 2028, USD Million
- TABLE 345: China Environmental Remediation Market by Site Type, 2018 - 2021, USD Million
- TABLE 346: China Environmental Remediation Market by Site Type, 2022 - 2028, USD Million
- TABLE 347: China Environmental Remediation Market by Technology, 2018 - 2021, USD Million
- TABLE 348: China Environmental Remediation Market by Technology, 2022 - 2028, USD Million
- TABLE 349: China Environmental Remediation Market by Environment Medium, 2018 - 2021, USD Million
- TABLE 350: China Environmental Remediation Market by Environment Medium, 2022 - 2028, USD Million
- TABLE 351: China Environmental Remediation Market by Application, 2018 - 2021, USD Million
- TABLE 352: China Environmental Remediation Market by Application, 2022 - 2028, USD Million
- TABLE 353: Japan Environmental Remediation Market, 2018 - 2021, USD Million
- TABLE 354: Japan Environmental Remediation Market, 2022 - 2028, USD Million
- TABLE 355: Japan Environmental Remediation Market by Site Type, 2018 - 2021, USD Million
- TABLE 356: Japan Environmental Remediation Market by Site Type, 2022 - 2028, USD Million
- TABLE 357: Japan Environmental Remediation Market by Technology, 2018 - 2021, USD Million
- TABLE 358: Japan Environmental Remediation Market by Technology, 2022 - 2028, USD Million
- TABLE 359: Japan Environmental Remediation Market by Environment Medium, 2018 - 2021, USD Million
- TABLE 360: Japan Environmental Remediation Market by Environment Medium, 2022 - 2028, USD Million
- TABLE 361: Japan Environmental Remediation Market by Application, 2018 - 2021, USD Million
- TABLE 362: Japan Environmental Remediation Market by Application, 2022 - 2028, USD Million
- TABLE 363: India Environmental Remediation Market, 2018 - 2021, USD Million
- TABLE 364: India Environmental Remediation Market, 2022 - 2028, USD Million
- TABLE 365: India Environmental Remediation Market by Site Type, 2018 - 2021, USD Million
- TABLE 366: India Environmental Remediation Market by Site Type, 2022 - 2028, USD Million
- TABLE 367: India Environmental Remediation Market by Technology, 2018 - 2021, USD Million
- TABLE 368: India Environmental Remediation Market by Technology, 2022 - 2028, USD Million
- TABLE 369: India Environmental Remediation Market by Environment Medium, 2018 - 2021, USD Million
- TABLE 370: India Environmental Remediation Market by Environment Medium, 2022 - 2028, USD Million
- TABLE 371: India Environmental Remediation Market by Application, 2018 - 2021, USD Million
- TABLE 372: India Environmental Remediation Market by Application, 2022 - 2028, USD Million
- TABLE 373: South Korea Environmental Remediation Market, 2018 - 2021, USD Million
- TABLE 374: South Korea Environmental Remediation Market, 2022 - 2028, USD Million
- TABLE 375: South Korea Environmental Remediation Market by Site Type, 2018 - 2021, USD Million
- TABLE 376: South Korea Environmental Remediation Market by Site Type, 2022 - 2028, USD Million
- TABLE 377: South Korea Environmental Remediation Market by Technology, 2018 - 2021, USD Million
- TABLE 378: South Korea Environmental Remediation Market by Technology, 2022 - 2028, USD Million
- TABLE 379: South Korea Environmental Remediation Market by Environment Medium, 2018 - 2021, USD Million
- TABLE 380: South Korea Environmental Remediation Market by Environment Medium, 2022 - 2028, USD Million
- TABLE 381: South Korea Environmental Remediation Market by Application, 2018 - 2021, USD Million
- TABLE 382: South Korea Environmental Remediation Market by Application, 2022 - 2028, USD Million
- TABLE 383: Singapore Environmental Remediation Market, 2018 - 2021, USD Million
- TABLE 384: Singapore Environmental Remediation Market, 2022 - 2028, USD Million
- TABLE 385: Singapore Environmental Remediation Market by Site Type, 2018 - 2021, USD Million
- TABLE 386: Singapore Environmental Remediation Market by Site Type, 2022 - 2028, USD Million
- TABLE 387: Singapore Environmental Remediation Market by Technology, 2018 - 2021, USD Million
- TABLE 388: Singapore Environmental Remediation Market by Technology, 2022 - 2028, USD Million
- TABLE 389: Singapore Environmental Remediation Market by Environment Medium, 2018 - 2021, USD Million
- TABLE 390: Singapore Environmental Remediation Market by Environment Medium, 2022 - 2028, USD Million
- TABLE 391: Singapore Environmental Remediation Market by Application, 2018 - 2021, USD Million
- TABLE 392: Singapore Environmental Remediation Market by Application, 2022 - 2028, USD Million
- TABLE 393: Malaysia Environmental Remediation Market, 2018 - 2021, USD Million
- TABLE 394: Malaysia Environmental Remediation Market, 2022 - 2028, USD Million
- TABLE 395: Malaysia Environmental Remediation Market by Site Type, 2018 - 2021, USD Million
- TABLE 396: Malaysia Environmental Remediation Market by Site Type, 2022 - 2028, USD Million
- TABLE 397: Malaysia Environmental Remediation Market by Technology, 2018 - 2021, USD Million
- TABLE 398: Malaysia Environmental Remediation Market by Technology, 2022 - 2028, USD Million
- TABLE 399: Malaysia Environmental Remediation Market by Environment Medium, 2018 - 2021, USD Million
- TABLE 400: Malaysia Environmental Remediation Market by Environment Medium, 2022 - 2028, USD Million
- TABLE 401: Malaysia Environmental Remediation Market by Application, 2018 - 2021, USD Million
- TABLE 402: Malaysia Environmental Remediation Market by Application, 2022 - 2028, USD Million
- TABLE 403: Rest of Asia Pacific Environmental Remediation Market, 2018 - 2021, USD Million
- TABLE 404: Rest of Asia Pacific Environmental Remediation Market, 2022 - 2028, USD Million
- TABLE 405: Rest of Asia Pacific Environmental Remediation Market by Site Type, 2018 - 2021, USD Million
- TABLE 406: Rest of Asia Pacific Environmental Remediation Market by Site Type, 2022 - 2028, USD Million
- TABLE 407: Rest of Asia Pacific Environmental Remediation Market by Technology, 2018 - 2021, USD Million
- TABLE 408: Rest of Asia Pacific Environmental Remediation Market by Technology, 2022 - 2028, USD Million
- TABLE 409: Rest of Asia Pacific Environmental Remediation Market by Environment Medium, 2018 - 2021, USD Million
- TABLE 410: Rest of Asia Pacific Environmental Remediation Market by Environment Medium, 2022 - 2028, USD Million
- TABLE 411: Rest of Asia Pacific Environmental Remediation Market by Application, 2018 - 2021, USD Million
- TABLE 412: Rest of Asia Pacific Environmental Remediation Market by Application, 2022 - 2028, USD Million
- TABLE 413: LAMEA Environmental Remediation Market, 2018 - 2021, USD Million
- TABLE 414: LAMEA Environmental Remediation Market, 2022 - 2028, USD Million
- TABLE 415: LAMEA Environmental Remediation Market by Site Type, 2018 - 2021, USD Million
- TABLE 416: LAMEA Environmental Remediation Market by Site Type, 2022 - 2028, USD Million
- TABLE 417: LAMEA Private Market by Country, 2018 - 2021, USD Million
- TABLE 418: LAMEA Private Market by Country, 2022 - 2028, USD Million
- TABLE 419: LAMEA Public Market by Country, 2018 - 2021, USD Million
- TABLE 420: LAMEA Public Market by Country, 2022 - 2028, USD Million
- TABLE 421: LAMEA Environmental Remediation Market by Technology, 2018 - 2021, USD Million
- TABLE 422: LAMEA Environmental Remediation Market by Technology, 2022 - 2028, USD Million
- TABLE 423: LAMEA Bioremediation Market by Country, 2018 - 2021, USD Million
- TABLE 424: LAMEA Bioremediation Market by Country, 2022 - 2028, USD Million
- TABLE 425: LAMEA Soil Washing Market by Country, 2018 - 2021, USD Million
- TABLE 426: LAMEA Soil Washing Market by Country, 2022 - 2028, USD Million
- TABLE 427: LAMEA Phytoremediation Market by Country, 2018 - 2021, USD Million
- TABLE 428: LAMEA Phytoremediation Market by Country, 2022 - 2028, USD Million
- TABLE 429: LAMEA Excavation Market by Country, 2018 - 2021, USD Million
- TABLE 430: LAMEA Excavation Market by Country, 2022 - 2028, USD Million
- TABLE 431: LAMEA Permeable Reactive Barriers Market by Country, 2018 - 2021, USD Million
- TABLE 432: LAMEA Permeable Reactive Barriers Market by Country, 2022 - 2028, USD Million
- TABLE 433: LAMEA Chemical Treatment Market by Country, 2018 - 2021, USD Million
- TABLE 434: LAMEA Chemical Treatment Market by Country, 2022 - 2028, USD Million
- TABLE 435: LAMEA Electrokinetic Remediation Market by Country, 2018 - 2021, USD Million
- TABLE 436: LAMEA Electrokinetic Remediation Market by Country, 2022 - 2028, USD Million
- TABLE 437: LAMEA Pump & Treat Market by Country, 2018 - 2021, USD Million
- TABLE 438: LAMEA Pump & Treat Market by Country, 2022 - 2028, USD Million
- TABLE 439: LAMEA Soil Vapor Extraction Market by Country, 2018 - 2021, USD Million
- TABLE 440: LAMEA Soil Vapor Extraction Market by Country, 2022 - 2028, USD Million
- TABLE 441: LAMEA Thermal Treatment Market by Country, 2018 - 2021, USD Million
- TABLE 442: LAMEA Thermal Treatment Market by Country, 2022 - 2028, USD Million
- TABLE 443: LAMEA In-situ Grouting & In-situ Vitrification Market by Country, 2018 - 2021, USD Million
- TABLE 444: LAMEA In-situ Grouting & In-situ Vitrification Market by Country, 2022 - 2028, USD Million
- TABLE 445: LAMEA Environmental Remediation Market by Environment Medium, 2018 - 2021, USD Million
- TABLE 446: LAMEA Environmental Remediation Market by Environment Medium, 2022 - 2028, USD Million
- TABLE 447: LAMEA Soil Market by Country, 2018 - 2021, USD Million
- TABLE 448: LAMEA Soil Market by Country, 2022 - 2028, USD Million
- TABLE 449: LAMEA Groundwater Market by Country, 2018 - 2021, USD Million
- TABLE 450: LAMEA Groundwater Market by Country, 2022 - 2028, USD Million
- TABLE 451: LAMEA Environmental Remediation Market by Application, 2018 - 2021, USD Million
- TABLE 452: LAMEA Environmental Remediation Market by Application, 2022 - 2028, USD Million
- TABLE 453: LAMEA Oil & Gas Market by Country, 2018 - 2021, USD Million
- TABLE 454: LAMEA Oil & Gas Market by Country, 2022 - 2028, USD Million
- TABLE 455: LAMEA Manufacturing, Industrial, & Chemical Production/Processing Market by Country, 2018 - 2021, USD Million
- TABLE 456: LAMEA Manufacturing, Industrial, & Chemical Production/Processing Market by Country, 2022 - 2028, USD Million
- TABLE 457: LAMEA Automotive Market by Country, 2018 - 2021, USD Million
- TABLE 458: LAMEA Automotive Market by Country, 2022 - 2028, USD Million
- TABLE 459: LAMEA Construction & Land Development Market by Country, 2018 - 2021, USD Million
- TABLE 460: LAMEA Construction & Land Development Market by Country, 2022 - 2028, USD Million
- TABLE 461: LAMEA Agriculture Market by Country, 2018 - 2021, USD Million
- TABLE 462: LAMEA Agriculture Market by Country, 2022 - 2028, USD Million
- TABLE 463: LAMEA Mining & Forestry Market by Country, 2018 - 2021, USD Million
- TABLE 464: LAMEA Mining & Forestry Market by Country, 2022 - 2028, USD Million
- TABLE 465: LAMEA Landfills & Waste Disposal Sites Market by Country, 2018 - 2021, USD Million
- TABLE 466: LAMEA Landfills & Waste Disposal Sites Market by Country, 2022 - 2028, USD Million
- TABLE 467: LAMEA Others Market by Country, 2018 - 2021, USD Million
- TABLE 468: LAMEA Others Market by Country, 2022 - 2028, USD Million
- TABLE 469: LAMEA Environmental Remediation Market by Country, 2018 - 2021, USD Million
- TABLE 470: LAMEA Environmental Remediation Market by Country, 2022 - 2028, USD Million
- TABLE 471: Brazil Environmental Remediation Market, 2018 - 2021, USD Million
- TABLE 472: Brazil Environmental Remediation Market, 2022 - 2028, USD Million
- TABLE 473: Brazil Environmental Remediation Market by Site Type, 2018 - 2021, USD Million
- TABLE 474: Brazil Environmental Remediation Market by Site Type, 2022 - 2028, USD Million
- TABLE 475: Brazil Environmental Remediation Market by Technology, 2018 - 2021, USD Million
- TABLE 476: Brazil Environmental Remediation Market by Technology, 2022 - 2028, USD Million
- TABLE 477: Brazil Environmental Remediation Market by Environment Medium, 2018 - 2021, USD Million
- TABLE 478: Brazil Environmental Remediation Market by Environment Medium, 2022 - 2028, USD Million
- TABLE 479: Brazil Environmental Remediation Market by Application, 2018 - 2021, USD Million
- TABLE 480: Brazil Environmental Remediation Market by Application, 2022 - 2028, USD Million
- TABLE 481: Argentina Environmental Remediation Market, 2018 - 2021, USD Million
- TABLE 482: Argentina Environmental Remediation Market, 2022 - 2028, USD Million
- TABLE 483: Argentina Environmental Remediation Market by Site Type, 2018 - 2021, USD Million
- TABLE 484: Argentina Environmental Remediation Market by Site Type, 2022 - 2028, USD Million
- TABLE 485: Argentina Environmental Remediation Market by Technology, 2018 - 2021, USD Million
- TABLE 486: Argentina Environmental Remediation Market by Technology, 2022 - 2028, USD Million
- TABLE 487: Argentina Environmental Remediation Market by Environment Medium, 2018 - 2021, USD Million
- TABLE 488: Argentina Environmental Remediation Market by Environment Medium, 2022 - 2028, USD Million
- TABLE 489: Argentina Environmental Remediation Market by Application, 2018 - 2021, USD Million
- TABLE 490: Argentina Environmental Remediation Market by Application, 2022 - 2028, USD Million
- TABLE 491: UAE Environmental Remediation Market, 2018 - 2021, USD Million
- TABLE 492: UAE Environmental Remediation Market, 2022 - 2028, USD Million
- TABLE 493: UAE Environmental Remediation Market by Site Type, 2018 - 2021, USD Million
- TABLE 494: UAE Environmental Remediation Market by Site Type, 2022 - 2028, USD Million
- TABLE 495: UAE Environmental Remediation Market by Technology, 2018 - 2021, USD Million
- TABLE 496: UAE Environmental Remediation Market by Technology, 2022 - 2028, USD Million
- TABLE 497: UAE Environmental Remediation Market by Environment Medium, 2018 - 2021, USD Million
- TABLE 498: UAE Environmental Remediation Market by Environment Medium, 2022 - 2028, USD Million
- TABLE 499: UAE Environmental Remediation Market by Application, 2018 - 2021, USD Million
- TABLE 500: UAE Environmental Remediation Market by Application, 2022 - 2028, USD Million
- TABLE 501: Saudi Arabia Environmental Remediation Market, 2018 - 2021, USD Million
- TABLE 502: Saudi Arabia Environmental Remediation Market, 2022 - 2028, USD Million
- TABLE 503: Saudi Arabia Environmental Remediation Market by Site Type, 2018 - 2021, USD Million
- TABLE 504: Saudi Arabia Environmental Remediation Market by Site Type, 2022 - 2028, USD Million
- TABLE 505: Saudi Arabia Environmental Remediation Market by Technology, 2018 - 2021, USD Million
- TABLE 506: Saudi Arabia Environmental Remediation Market by Technology, 2022 - 2028, USD Million
- TABLE 507: Saudi Arabia Environmental Remediation Market by Environment Medium, 2018 - 2021, USD Million
- TABLE 508: Saudi Arabia Environmental Remediation Market by Environment Medium, 2022 - 2028, USD Million
- TABLE 509: Saudi Arabia Environmental Remediation Market by Application, 2018 - 2021, USD Million
- TABLE 510: Saudi Arabia Environmental Remediation Market by Application, 2022 - 2028, USD Million
- TABLE 511: South Africa Environmental Remediation Market, 2018 - 2021, USD Million
- TABLE 512: South Africa Environmental Remediation Market, 2022 - 2028, USD Million
- TABLE 513: South Africa Environmental Remediation Market by Site Type, 2018 - 2021, USD Million
- TABLE 514: South Africa Environmental Remediation Market by Site Type, 2022 - 2028, USD Million
- TABLE 515: South Africa Environmental Remediation Market by Technology, 2018 - 2021, USD Million
- TABLE 516: South Africa Environmental Remediation Market by Technology, 2022 - 2028, USD Million
- TABLE 517: South Africa Environmental Remediation Market by Environment Medium, 2018 - 2021, USD Million
- TABLE 518: South Africa Environmental Remediation Market by Environment Medium, 2022 - 2028, USD Million
- TABLE 519: South Africa Environmental Remediation Market by Application, 2018 - 2021, USD Million
- TABLE 520: South Africa Environmental Remediation Market by Application, 2022 - 2028, USD Million
- TABLE 521: Nigeria Environmental Remediation Market, 2018 - 2021, USD Million
- TABLE 522: Nigeria Environmental Remediation Market, 2022 - 2028, USD Million
- TABLE 523: Nigeria Environmental Remediation Market by Site Type, 2018 - 2021, USD Million
- TABLE 524: Nigeria Environmental Remediation Market by Site Type, 2022 - 2028, USD Million
- TABLE 525: Nigeria Environmental Remediation Market by Technology, 2018 - 2021, USD Million
- TABLE 526: Nigeria Environmental Remediation Market by Technology, 2022 - 2028, USD Million
- TABLE 527: Nigeria Environmental Remediation Market by Environment Medium, 2018 - 2021, USD Million
- TABLE 528: Nigeria Environmental Remediation Market by Environment Medium, 2022 - 2028, USD Million
- TABLE 529: Nigeria Environmental Remediation Market by Application, 2018 - 2021, USD Million
- TABLE 530: Nigeria Environmental Remediation Market by Application, 2022 - 2028, USD Million
- TABLE 531: Rest of LAMEA Environmental Remediation Market, 2018 - 2021, USD Million
- TABLE 532: Rest of LAMEA Environmental Remediation Market, 2022 - 2028, USD Million
- TABLE 533: Rest of LAMEA Environmental Remediation Market by Site Type, 2018 - 2021, USD Million
- TABLE 534: Rest of LAMEA Environmental Remediation Market by Site Type, 2022 - 2028, USD Million
- TABLE 535: Rest of LAMEA Environmental Remediation Market by Technology, 2018 - 2021, USD Million
- TABLE 536: Rest of LAMEA Environmental Remediation Market by Technology, 2022 - 2028, USD Million
- TABLE 537: Rest of LAMEA Environmental Remediation Market by Environment Medium, 2018 - 2021, USD Million
- TABLE 538: Rest of LAMEA Environmental Remediation Market by Environment Medium, 2022 - 2028, USD Million
- TABLE 539: Rest of LAMEA Environmental Remediation Market by Application, 2018 - 2021, USD Million
- TABLE 540: Rest of LAMEA Environmental Remediation Market by Application, 2022 - 2028, USD Million
- TABLE 541: Key Information - Golder Associates (WSP Global inc.)
- TABLE 542: Key Information - Clean Harbors, Inc.
- TABLE 543: key information - AECOM corporation
- TABLE 544: Key Information - Stantec, Inc.
- TABLE 545: key information - HDR, Inc.
- TABLE 546: Key Information - Tetra Tech, Inc.
- TABLE 547: Key Information - Jacobs Engineering Group, Inc.
- TABLE 548: Key Information - DEME NV
- TABLE 549: Key Information - BRISEA Group, Inc.
List of Figures
- FIG 1: Methodology for the research
- FIG 2: Global Environmental Remediation Market share by Site Type, 2021
- FIG 3: Global Environmental Remediation Market share by Site Type, 2028
- FIG 4: Global Environmental Remediation Market by Site Type, 2018 - 2028, USD Million
- FIG 5: Global Environmental Remediation Market share by Technology, 2021
- FIG 6: Global Environmental Remediation Market share by Technology, 2028
- FIG 7: Global Environmental Remediation Market by Technology, 2018 - 2028, USD Million
- FIG 8: Global Environmental Remediation Market share by Environment Medium, 2021
- FIG 9: Global Environmental Remediation Market share by Environment Medium, 2028
- FIG 10: Global Environmental Remediation Market by Environment Medium, 2018 - 2028, USD Million
- FIG 11: Global Environmental Remediation Market share by Application, 2021
- FIG 12: Global Environmental Remediation Market share by Application, 2028
- FIG 13: Global Environmental Remediation Market by Application, 2018 - 2028, USD Million
- FIG 14: Global Environmental Remediation Market share by Region, 2021
- FIG 15: Global Environmental Remediation Market share by Region, 2028
- FIG 16: Global Environmental Remediation Market by Region, 2018 - 2028, USD Million
The Global Environmental Remediation Market size is expected to reach $169.6 billion by 2028, rising at a market growth of 8.1% CAGR during the forecast period.
Environmental remediation removes pollutants or toxins from water (including ground and surface water) and soil. These waste materials are eliminated to protect human health and restore the ecosystem. Brownfield sites are remediated for reconstruction or to return them to their natural form. The cleanup of sites that have been exploited for hazardous waste disposal presents a particular difficulty. Many of these so-called Superfund sites are governed by federal rules by the Environmental Protection Agency (EPA).
The EPA organizes the cleaning of these sites, mandating that the responsible party either execute the cleanup themselves or compensate the government for EPA-led cleanups. Environmental remediation is heavily regulated and subject to a variety of regulatory standards, which are often based on risk assessments of human health and the environment.
Various environmental media, including soil, sediment, groundwater, and surface water, undergo environmental rehabilitation. Soil remediation covers topsoil, subsoil, and sediment, whereas water remediation encompasses both groundwater and surface water. Depending on the nature and degree of the contamination, soil and water cleanup may be undertaken separately or simultaneously.
Remediation of water is the removal of pollutants from water. Surface water in lakes, streams, and rivers can be polluted by pollutants dumped directly into the water or runoff from the land. Groundwater, the subterranean water that permeates porous material, may get contaminated by toxins that seep through the soil and silt above it. Many regions have experienced groundwater contamination as a result of waste products improperly disposed of or kept on land, where they percolated into the soil and were subsequently transported into the groundwater. The contamination of groundwater has also been caused by industrial activities such as mining and oil and natural gas extraction.
COVID-19 Impact Analysis
The negative consequences of COVID-19 are already apparent, and it has had a significant influence on environmental cleanup efforts in 2020. Exports and imports, manufacturing, tourism, and the financial industry have all sustained significant harm. The emergence of the virus has added risk factors to the already slow economic growth. According to several international organizations, the current economic climate is the most challenging since the financial crisis. Since the pandemic, restrictions on imports and exports have significantly impacted environmental cleanup, since consumer consumption and demand patterns have shifted. Many businesses have delayed or canceled environmental rehabilitation orders, resulting in a decline in demand for environmental remediation services at damaged oil field sites.
Market Growth Factor
The regulatory framework is the foundation of the market
Lightly regulated and uncontrolled emissions from industrial operations, as well as the disposal and management of wastes, especially hazardous industrial wastes, are key contributors to environmental damage, including prior land and water pollution problems. Due to the maturity of industrial operations and laws, it is not expected that land and water pollution will rise significantly in the future in the majority of industrialized nations. Regulations and their enforcement are major drivers of remediation work; hence, adjustments or projected shifts in regulatory emphasis will have a substantial influence on demand patterns for remediation services.
Innovation of Remedial Procedures
In recent years, new oxidation processes that do not produce sludge have shown to be highly successful at cleaning contaminated water and wastewater. Using nanoparticles for remediation, the pan-remediation approach speeds up the procedures of finding and eliminating environmental contaminants. Using nanomaterials and analytical techniques, inexpensive, user-friendly, and tiny devices for the detection of a range of environmental contaminants are created.
Market Restraining Factor
Expensive Equipment of The Remediation Process
Moving hazardous or toxic waste during land redevelopment and restoration services requires a large number of bulk materials handling machines. These machines are necessary to transfer the waste. Even when purchased on a rental basis, this equipment, which includes, among other things, excavators, loaders, dumpers, and trucks, has a relatively high acquisition cost. As a result, finishing a cleanup project will demand a significant financial investment in the auxiliary but very important equipment.
Site Type Outlook
By Site Type, the Environmental Remediation Market is classified into Private and Public. The public segment registered a significant revenue share in the environmental remediation market in 2021. It is because about 80 percent of the wastewater produced across the world is released back into the environment, where it is mainly untreated and contributes to the pollution of waterways such as rivers, lakes, and seas. The well-being is being put in jeopardy as a direct result of the pervasive problem of water contamination.
Technology Outlook
Based on the Technology, the Environmental Remediation Market is segmented into Soil Washing, Chemical Treatment, Bioremediation, Electrokinetic Remediation, Excavation, Permeable Reactive Barriers, In-situ Grouting & In-situ Vitrification, Phytoremediation, Pump and Treat, Soil Vapor Extraction, and Thermal Treatment. The chemical treatment segment recorded a substantial revenue share in the environmental remediation market in 2021. It is because chemical remediation is an in-situ method that extracts contaminants from polluted material using chemicals. Chemical remediation techniques can keep cleanup costs low since they can be undertaken on-site, eliminating the need to transfer soil or water off-site for treatment; hence, they have a rapid growth rate.
Environment Medium Outlook
On the basis of Environmental Medium, the Environmental Remediation Market is divided into Soil and Groundwater. The groundwater segment recorded a substantial revenue share in the environmental remediation market in 2021. The pollution of groundwater happens when man-made substances such as gasoline, oil, road salts, and chemicals reach the groundwater through the soil, rendering it contaminated and unfit for human consumption. There are numerous inorganics, physical, and organic compounds as well as bacterial and radioactive contaminants in groundwater.
Application Outlook
Based on the Application, the Environmental Remediation Market is bifurcated into Mining and Forestry, Oil & Gas, Agriculture, Automotive, Landfills, and Waste Disposal Sites, Manufacturing, Industrial, and Chemical Production/Processing, and Construction and Land Development. The mining and forestry segment witnessed a substantial revenue share in the environmental remediation market in 2021. Cleanup and restoration of sites comprising regions that were once accustomed mine coal or hard rock ore containing metals like gold or copper or other resources such as phosphorus face distinct problems.
Regional Outlook
Region-wise, the Environmental Remediation Market is analyzed across North America, Europe, Asia Pacific, and LAMEA. The Asia Pacific segment garnered a promising growth rate in the environmental remediation market in 2021. These factors are anticipated to exacerbate environmental difficulties and will contribute to the expansion of the environmental remediation market in Asia-Pacific. In mining and forestry applications in the region, the use of environmental remediation has increased due to the extensive mining of coal and other minerals, which discharges volatile organic pollutants into the environment.
The market research report covers the analysis of key stake holders of the market. Key companies profiled in the report include WSP Global, Inc. (Golder Associates), Clean Harbors, Inc., AECOM Corporation, Stantec, Inc., HDR, Inc., Tetra Tech, Inc., Jacobs Engineering Group Inc., DEME NV and BRISEA Group, Inc.
Strategies Deployed in Environmental Remediation Market
-
Sep-2022: WSP completed the acquisition of the Environment & Infrastructure business, a subsidiary of John Wood Group. Through this acquisition, the WSP aimed to include E&I's 6,000 experts in the WSP team to produce a powerful market leader from two respected institutions with bold ambitions. Moreover, this would permit WSP to deliver customers expanded world-class multidisciplinary benefits while conveying new solutions and improved value.
-
Sep-2022: Tetra Tech took over RPS Group, a global experienced services firm of consultants. Under this acquisition, RPS Group would advance Tetra's long-term strategy to improve it's position as the exclusive global high-end consulting and engineering company focused on sustainable infrastructure, water, environment, and energy transformation. Moreover, RPS Group's associates unite and collectively utilize long-term customer relationships and work experience.
-
Aug-2022: Tetra Tech completed the acquisition of The Integration Group of Americas (TIGA), an industry authority in process automation and systems combination solutions. With this acquisition, TIGA allows Tetra to further develop high-end digital consulting and medium solutions with in the environmental, water, and energy sectors.
-
Oct-2021: Clean Harbors acquired HydroChemPSC, a leading U.S. provider of specialty maintenance, industrial cleaning, and utility services. This acquisition would develop significant strategic advantages for Clean Harbors beyond just growing the size and scale of processes. Additionally, Clean Harbors expect HPC's automation and hands-free technology abilities to propel safety advances, and the acquisition to complete multiple cross-selling possibilities that would propel incremental garbage into the network.
-
Aug-2021: HDR completed the acquisition of the WRECO, experts in civil engineering, and environmental observation. Under this partnership, WRECO carries industry-leading knowledge, connections, and talent to the HDR group to develop transportation and water resources services in the region. Moreover, by improving technical expertise in hydraulics and hydrology, are in an ideal rank to move forward with municipal and state projects, completing the full life cycle process to infrastructure growth.
-
Feb-2021: WSP took over Earth Consulting Group, a US-based environmental and engineering consulting company. This acquisition would permit WSP to achieve strategic initiatives of further supporting actions in the Southeast Region of the United States while persisting to build on its assignment as a supreme Earth & Environment services consulting company.
-
Sep-2019: AECOM introduced DE-FLUORO, a technology that effectively and permanently releases per and poly-fluoroalkyl compounds. The DE-FLUORO can be set up on-site and decrease PFAS-concentrated liquids sustainably and cost-effectively. Additionally, AECOM is now capable to help consumers to satisfy the strict regulatory conditions that govern PFAS exposure.
-
Aug-2019: Jacobs acquired John Wood Group's Nuclear business, British multinational engineering and consulting business. This acquisition reinforces Jacobs' position is highly beneficial and complementary sectors within defense and nuclear, improving identified program management skills with technical expertise, deep, given the effective and synergistic fit of the two communities. Moreover, Jacob believes the transaction would translate into significant value for Jacobs' shareholders, diverse possibilities for workers, and new, differentiated defense and nuclear solutions for customers.
Scope of the Study
Market Segments covered in the Report:
By Site Type
- Private
- Public
By Technology
- Bioremediation
- Soil Washing
- Phytoremediation
- Excavation
- Permeable Reactive Barriers
- Chemical Treatment
- Electrokinetic Remediation
- Pump & Treat
- Soil Vapor Extraction
- Thermal Treatment
- In-situ Grouting & In-situ Vitrification
By Environment Medium
- Soil
- Groundwater
By Application
- Oil & Gas
- Manufacturing, Industrial, & Chemical Production/Processing
- Automotive
- Construction & Land Development
- Agriculture
- Mining & Forestry
- Landfills & Waste Disposal Sites
- Others
By Geography
- North America
- US
- Canada
- Mexico
- Rest of North America
- Europe
- Germany
- UK
- France
- Russia
- Spain
- Italy
- Rest of Europe
- Asia Pacific
- China
- Japan
- India
- South Korea
- Singapore
- Malaysia
- Rest of Asia Pacific
- LAMEA
- Brazil
- Argentina
- UAE
- Saudi Arabia
- South Africa
- Nigeria
- Rest of LAMEA
Companies Profiled:
- WSP Global, Inc. (Golder Associates)
- Clean Harbors, Inc.
- AECOM Corporation
- Stantec, Inc.
- HDR, Inc.
- Tetra Tech, Inc.
- Jacobs Engineering Group Inc.
- DEME NV
- BRISEA Group, Inc.
Unique Offerings from KBV Research:
- Exhaustive coverage
- Highest number of market tables and figures
- Subscription based model available
- Guaranteed best price
- Assured post sales research support with 10% customization free
Table of Contents
Chapter 1. Market Scope & Methodology
- 1.1. Market Definition
- 1.2. Objectives
- 1.3. Market Scope
- 1.4. Segmentation
- 1.4.1. Global Environmental Remediation Market, by Site Type
- 1.4.2. Global Environmental Remediation Market, by Technology
- 1.4.3. Global Environmental Remediation Market, by Environment Medium
- 1.4.4. Global Environmental Remediation Market, by Application
- 1.4.5. Global Environmental Remediation Market, by Geography
- 1.5. Methodology for the research
Chapter 2. Market Overview
- 2.1. Introduction
- 2.1.1. Overview
- 2.1.1.1. Market Composition & Scenarios
- 2.1.1. Overview
- 2.2. Key Factors Impacting the Market
- 2.2.1. Market Drivers
- 2.2.2. Market Restraints
Chapter 3. Strategies Deployed in Environmental Remediation Market
Chapter 4. Global Environmental Remediation Market by Site Type
- 4.1. Global Private Market by Region
- 4.2. Global Public Market by Region
Chapter 5. Global Environmental Remediation Market by Technology
- 5.1. Global Bioremediation Market by Region
- 5.2. Global Soil Washing Market by Region
- 5.3. Global Phytoremediation Market by Region
- 5.4. Global Excavation Market by Region
- 5.5. Global Permeable Reactive Barriers Market by Region
- 5.6. Global Chemical Treatment Market by Region
- 5.7. Global Electrokinetic Remediation Market by Region
- 5.8. Global Pump & Treat Market by Region
- 5.9. Global Soil Vapor Extraction Market by Region
- 5.1. Global Thermal Treatment Market by Region
- 5.11. Global In-situ Grouting & In-situ Vitrification Market by Region
Chapter 6. Global Environmental Remediation Market by Environment Medium
- 6.1. Global Soil Market by Region
- 6.2. Global Groundwater Market by Region
Chapter 7. Global Environmental Remediation Market by Application
- 7.1. Global Oil & Gas Market by Region
- 7.2. Global Manufacturing, Industrial, & Chemical Production/Processing Market by Region
- 7.3. Global Automotive Market by Region
- 7.4. Global Construction & Land Development Market by Region
- 7.5. Global Agriculture Market by Region
- 7.6. Global Mining & Forestry Market by Region
- 7.7. Global Landfills & Waste Disposal Sites Market by Region
- 7.8. Global Others Market by Region
Chapter 8. Global Environmental Remediation Market by Region
- 8.1. North America Environmental Remediation Market
- 8.1.1. North America Environmental Remediation Market by Site Type
- 8.1.1.1. North America Private Market by Country
- 8.1.1.2. North America Public Market by Country
- 8.1.2. North America Environmental Remediation Market by Technology
- 8.1.2.1. North America Bioremediation Market by Country
- 8.1.2.2. North America Soil Washing Market by Country
- 8.1.2.3. North America Phytoremediation Market by Country
- 8.1.2.4. North America Excavation Market by Country
- 8.1.2.5. North America Permeable Reactive Barriers Market by Country
- 8.1.2.6. North America Chemical Treatment Market by Country
- 8.1.2.7. North America Electrokinetic Remediation Market by Country
- 8.1.2.8. North America Pump & Treat Market by Country
- 8.1.2.9. North America Soil Vapor Extraction Market by Country
- 8.1.2.10. North America Thermal Treatment Market by Country
- 8.1.2.11. North America In-situ Grouting & In-situ Vitrification Market by Country
- 8.1.3. North America Environmental Remediation Market by Environment Medium
- 8.1.3.1. North America Soil Market by Country
- 8.1.3.2. North America Groundwater Market by Country
- 8.1.4. North America Environmental Remediation Market by Application
- 8.1.4.1. North America Oil & Gas Market by Country
- 8.1.4.2. North America Manufacturing, Industrial, & Chemical Production/Processing Market by Country
- 8.1.4.3. North America Automotive Market by Country
- 8.1.4.4. North America Construction & Land Development Market by Country
- 8.1.4.5. North America Agriculture Market by Country
- 8.1.4.6. North America Mining & Forestry Market by Country
- 8.1.4.7. North America Landfills & Waste Disposal Sites Market by Country
- 8.1.4.8. North America Others Market by Country
- 8.1.5. North America Environmental Remediation Market by Country
- 8.1.5.1. US Environmental Remediation Market
- 8.1.5.1.1. US Environmental Remediation Market by Site Type
- 8.1.5.1.2. US Environmental Remediation Market by Technology
- 8.1.5.1.3. US Environmental Remediation Market by Environment Medium
- 8.1.5.1.4. US Environmental Remediation Market by Application
- 8.1.5.2. Canada Environmental Remediation Market
- 8.1.5.2.1. Canada Environmental Remediation Market by Site Type
- 8.1.5.2.2. Canada Environmental Remediation Market by Technology
- 8.1.5.2.3. Canada Environmental Remediation Market by Environment Medium
- 8.1.5.2.4. Canada Environmental Remediation Market by Application
- 8.1.5.3. Mexico Environmental Remediation Market
- 8.1.5.3.1. Mexico Environmental Remediation Market by Site Type
- 8.1.5.3.2. Mexico Environmental Remediation Market by Technology
- 8.1.5.3.3. Mexico Environmental Remediation Market by Environment Medium
- 8.1.5.3.4. Mexico Environmental Remediation Market by Application
- 8.1.5.4. Rest of North America Environmental Remediation Market
- 8.1.5.4.1. Rest of North America Environmental Remediation Market by Site Type
- 8.1.5.4.2. Rest of North America Environmental Remediation Market by Technology
- 8.1.5.4.3. Rest of North America Environmental Remediation Market by Environment Medium
- 8.1.5.4.4. Rest of North America Environmental Remediation Market by Application
- 8.1.5.1. US Environmental Remediation Market
- 8.1.1. North America Environmental Remediation Market by Site Type
- 8.2. Europe Environmental Remediation Market
- 8.2.1. Europe Environmental Remediation Market by Site Type
- 8.2.1.1. Europe Private Market by Country
- 8.2.1.2. Europe Public Market by Country
- 8.2.2. Europe Environmental Remediation Market by Technology
- 8.2.2.1. Europe Bioremediation Market by Country
- 8.2.2.2. Europe Soil Washing Market by Country
- 8.2.2.3. Europe Phytoremediation Market by Country
- 8.2.2.4. Europe Excavation Market by Country
- 8.2.2.5. Europe Permeable Reactive Barriers Market by Country
- 8.2.2.6. Europe Chemical Treatment Market by Country
- 8.2.2.7. Europe Electrokinetic Remediation Market by Country
- 8.2.2.8. Europe Pump & Treat Market by Country
- 8.2.2.9. Europe Soil Vapor Extraction Market by Country
- 8.2.2.10. Europe Thermal Treatment Market by Country
- 8.2.2.11. Europe In-situ Grouting & In-situ Vitrification Market by Country
- 8.2.3. Europe Environmental Remediation Market by Environment Medium
- 8.2.3.1. Europe Soil Market by Country
- 8.2.3.2. Europe Groundwater Market by Country
- 8.2.4. Europe Environmental Remediation Market by Application
- 8.2.4.1. Europe Oil & Gas Market by Country
- 8.2.4.2. Europe Manufacturing, Industrial, & Chemical Production/Processing Market by Country
- 8.2.4.3. Europe Automotive Market by Country
- 8.2.4.4. Europe Construction & Land Development Market by Country
- 8.2.4.5. Europe Agriculture Market by Country
- 8.2.4.6. Europe Mining & Forestry Market by Country
- 8.2.4.7. Europe Landfills & Waste Disposal Sites Market by Country
- 8.2.4.8. Europe Others Market by Country
- 8.2.5. Europe Environmental Remediation Market by Country
- 8.2.5.1. Germany Environmental Remediation Market
- 8.2.5.1.1. Germany Environmental Remediation Market by Site Type
- 8.2.5.1.2. Germany Environmental Remediation Market by Technology
- 8.2.5.1.3. Germany Environmental Remediation Market by Environment Medium
- 8.2.5.1.4. Germany Environmental Remediation Market by Application
- 8.2.5.2. UK Environmental Remediation Market
- 8.2.5.2.1. UK Environmental Remediation Market by Site Type
- 8.2.5.2.2. UK Environmental Remediation Market by Technology
- 8.2.5.2.3. UK Environmental Remediation Market by Environment Medium
- 8.2.5.2.4. UK Environmental Remediation Market by Application
- 8.2.5.3. France Environmental Remediation Market
- 8.2.5.3.1. France Environmental Remediation Market by Site Type
- 8.2.5.3.2. France Environmental Remediation Market by Technology
- 8.2.5.3.3. France Environmental Remediation Market by Environment Medium
- 8.2.5.3.4. France Environmental Remediation Market by Application
- 8.2.5.4. Russia Environmental Remediation Market
- 8.2.5.4.1. Russia Environmental Remediation Market by Site Type
- 8.2.5.4.2. Russia Environmental Remediation Market by Technology
- 8.2.5.4.3. Russia Environmental Remediation Market by Environment Medium
- 8.2.5.4.4. Russia Environmental Remediation Market by Application
- 8.2.5.5. Spain Environmental Remediation Market
- 8.2.5.5.1. Spain Environmental Remediation Market by Site Type
- 8.2.5.5.2. Spain Environmental Remediation Market by Technology
- 8.2.5.5.3. Spain Environmental Remediation Market by Environment Medium
- 8.2.5.5.4. Spain Environmental Remediation Market by Application
- 8.2.5.6. Italy Environmental Remediation Market
- 8.2.5.6.1. Italy Environmental Remediation Market by Site Type
- 8.2.5.6.2. Italy Environmental Remediation Market by Technology
- 8.2.5.6.3. Italy Environmental Remediation Market by Environment Medium
- 8.2.5.6.4. Italy Environmental Remediation Market by Application
- 8.2.5.7. Rest of Europe Environmental Remediation Market
- 8.2.5.7.1. Rest of Europe Environmental Remediation Market by Site Type
- 8.2.5.7.2. Rest of Europe Environmental Remediation Market by Technology
- 8.2.5.7.3. Rest of Europe Environmental Remediation Market by Environment Medium
- 8.2.5.7.4. Rest of Europe Environmental Remediation Market by Application
- 8.2.5.1. Germany Environmental Remediation Market
- 8.2.1. Europe Environmental Remediation Market by Site Type
- 8.3. Asia Pacific Environmental Remediation Market
- 8.3.1. Asia Pacific Environmental Remediation Market by Site Type
- 8.3.1.1. Asia Pacific Private Market by Country
- 8.3.1.2. Asia Pacific Public Market by Country
- 8.3.2. Asia Pacific Environmental Remediation Market by Technology
- 8.3.2.1. Asia Pacific Bioremediation Market by Country
- 8.3.2.2. Asia Pacific Soil Washing Market by Country
- 8.3.2.3. Asia Pacific Phytoremediation Market by Country
- 8.3.2.4. Asia Pacific Excavation Market by Country
- 8.3.2.5. Asia Pacific Permeable Reactive Barriers Market by Country
- 8.3.2.6. Asia Pacific Chemical Treatment Market by Country
- 8.3.2.7. Asia Pacific Electrokinetic Remediation Market by Country
- 8.3.2.8. Asia Pacific Pump & Treat Market by Country
- 8.3.2.9. Asia Pacific Soil Vapor Extraction Market by Country
- 8.3.2.10. Asia Pacific Thermal Treatment Market by Country
- 8.3.2.11. Asia Pacific In-situ Grouting & In-situ Vitrification Market by Country
- 8.3.3. Asia Pacific Environmental Remediation Market by Environment Medium
- 8.3.3.1. Asia Pacific Soil Market by Country
- 8.3.3.2. Asia Pacific Groundwater Market by Country
- 8.3.4. Asia Pacific Environmental Remediation Market by Application
- 8.3.4.1. Asia Pacific Oil & Gas Market by Country
- 8.3.4.2. Asia Pacific Manufacturing, Industrial, & Chemical Production/Processing Market by Country
- 8.3.4.3. Asia Pacific Automotive Market by Country
- 8.3.4.4. Asia Pacific Construction & Land Development Market by Country
- 8.3.4.5. Asia Pacific Agriculture Market by Country
- 8.3.4.6. Asia Pacific Mining & Forestry Market by Country
- 8.3.4.7. Asia Pacific Landfills & Waste Disposal Sites Market by Country
- 8.3.4.8. Asia Pacific Others Market by Country
- 8.3.5. Asia Pacific Environmental Remediation Market by Country
- 8.3.5.1. China Environmental Remediation Market
- 8.3.5.1.1. China Environmental Remediation Market by Site Type
- 8.3.5.1.2. China Environmental Remediation Market by Technology
- 8.3.5.1.3. China Environmental Remediation Market by Environment Medium
- 8.3.5.1.4. China Environmental Remediation Market by Application
- 8.3.5.2. Japan Environmental Remediation Market
- 8.3.5.2.1. Japan Environmental Remediation Market by Site Type
- 8.3.5.2.2. Japan Environmental Remediation Market by Technology
- 8.3.5.2.3. Japan Environmental Remediation Market by Environment Medium
- 8.3.5.2.4. Japan Environmental Remediation Market by Application
- 8.3.5.3. India Environmental Remediation Market
- 8.3.5.3.1. India Environmental Remediation Market by Site Type
- 8.3.5.3.2. India Environmental Remediation Market by Technology
- 8.3.5.3.3. India Environmental Remediation Market by Environment Medium
- 8.3.5.3.4. India Environmental Remediation Market by Application
- 8.3.5.4. South Korea Environmental Remediation Market
- 8.3.5.4.1. South Korea Environmental Remediation Market by Site Type
- 8.3.5.4.2. South Korea Environmental Remediation Market by Technology
- 8.3.5.4.3. South Korea Environmental Remediation Market by Environment Medium
- 8.3.5.4.4. South Korea Environmental Remediation Market by Application
- 8.3.5.5. Singapore Environmental Remediation Market
- 8.3.5.5.1. Singapore Environmental Remediation Market by Site Type
- 8.3.5.5.2. Singapore Environmental Remediation Market by Technology
- 8.3.5.5.3. Singapore Environmental Remediation Market by Environment Medium
- 8.3.5.5.4. Singapore Environmental Remediation Market by Application
- 8.3.5.6. Malaysia Environmental Remediation Market
- 8.3.5.6.1. Malaysia Environmental Remediation Market by Site Type
- 8.3.5.6.2. Malaysia Environmental Remediation Market by Technology
- 8.3.5.6.3. Malaysia Environmental Remediation Market by Environment Medium
- 8.3.5.6.4. Malaysia Environmental Remediation Market by Application
- 8.3.5.7. Rest of Asia Pacific Environmental Remediation Market
- 8.3.5.7.1. Rest of Asia Pacific Environmental Remediation Market by Site Type
- 8.3.5.7.2. Rest of Asia Pacific Environmental Remediation Market by Technology
- 8.3.5.7.3. Rest of Asia Pacific Environmental Remediation Market by Environment Medium
- 8.3.5.7.4. Rest of Asia Pacific Environmental Remediation Market by Application
- 8.3.5.1. China Environmental Remediation Market
- 8.3.1. Asia Pacific Environmental Remediation Market by Site Type
- 8.4. LAMEA Environmental Remediation Market
- 8.4.1. LAMEA Environmental Remediation Market by Site Type
- 8.4.1.1. LAMEA Private Market by Country
- 8.4.1.2. LAMEA Public Market by Country
- 8.4.2. LAMEA Environmental Remediation Market by Technology
- 8.4.2.1. LAMEA Bioremediation Market by Country
- 8.4.2.2. LAMEA Soil Washing Market by Country
- 8.4.2.3. LAMEA Phytoremediation Market by Country
- 8.4.2.4. LAMEA Excavation Market by Country
- 8.4.2.5. LAMEA Permeable Reactive Barriers Market by Country
- 8.4.2.6. LAMEA Chemical Treatment Market by Country
- 8.4.2.7. LAMEA Electrokinetic Remediation Market by Country
- 8.4.2.8. LAMEA Pump & Treat Market by Country
- 8.4.2.9. LAMEA Soil Vapor Extraction Market by Country
- 8.4.2.10. LAMEA Thermal Treatment Market by Country
- 8.4.2.11. LAMEA In-situ Grouting & In-situ Vitrification Market by Country
- 8.4.3. LAMEA Environmental Remediation Market by Environment Medium
- 8.4.3.1. LAMEA Soil Market by Country
- 8.4.3.2. LAMEA Groundwater Market by Country
- 8.4.4. LAMEA Environmental Remediation Market by Application
- 8.4.4.1. LAMEA Oil & Gas Market by Country
- 8.4.4.2. LAMEA Manufacturing, Industrial, & Chemical Production/Processing Market by Country
- 8.4.4.3. LAMEA Automotive Market by Country
- 8.4.4.4. LAMEA Construction & Land Development Market by Country
- 8.4.4.5. LAMEA Agriculture Market by Country
- 8.4.4.6. LAMEA Mining & Forestry Market by Country
- 8.4.4.7. LAMEA Landfills & Waste Disposal Sites Market by Country
- 8.4.4.8. LAMEA Others Market by Country
- 8.4.5. LAMEA Environmental Remediation Market by Country
- 8.4.5.1. Brazil Environmental Remediation Market
- 8.4.5.1.1. Brazil Environmental Remediation Market by Site Type
- 8.4.5.1.2. Brazil Environmental Remediation Market by Technology
- 8.4.5.1.3. Brazil Environmental Remediation Market by Environment Medium
- 8.4.5.1.4. Brazil Environmental Remediation Market by Application
- 8.4.5.2. Argentina Environmental Remediation Market
- 8.4.5.2.1. Argentina Environmental Remediation Market by Site Type
- 8.4.5.2.2. Argentina Environmental Remediation Market by Technology
- 8.4.5.2.3. Argentina Environmental Remediation Market by Environment Medium
- 8.4.5.2.4. Argentina Environmental Remediation Market by Application
- 8.4.5.3. UAE Environmental Remediation Market
- 8.4.5.3.1. UAE Environmental Remediation Market by Site Type
- 8.4.5.3.2. UAE Environmental Remediation Market by Technology
- 8.4.5.3.3. UAE Environmental Remediation Market by Environment Medium
- 8.4.5.3.4. UAE Environmental Remediation Market by Application
- 8.4.5.4. Saudi Arabia Environmental Remediation Market
- 8.4.5.4.1. Saudi Arabia Environmental Remediation Market by Site Type
- 8.4.5.4.2. Saudi Arabia Environmental Remediation Market by Technology
- 8.4.5.4.3. Saudi Arabia Environmental Remediation Market by Environment Medium
- 8.4.5.4.4. Saudi Arabia Environmental Remediation Market by Application
- 8.4.5.5. South Africa Environmental Remediation Market
- 8.4.5.5.1. South Africa Environmental Remediation Market by Site Type
- 8.4.5.5.2. South Africa Environmental Remediation Market by Technology
- 8.4.5.5.3. South Africa Environmental Remediation Market by Environment Medium
- 8.4.5.5.4. South Africa Environmental Remediation Market by Application
- 8.4.5.6. Nigeria Environmental Remediation Market
- 8.4.5.6.1. Nigeria Environmental Remediation Market by Site Type
- 8.4.5.6.2. Nigeria Environmental Remediation Market by Technology
- 8.4.5.6.3. Nigeria Environmental Remediation Market by Environment Medium
- 8.4.5.6.4. Nigeria Environmental Remediation Market by Application
- 8.4.5.7. Rest of LAMEA Environmental Remediation Market
- 8.4.5.7.1. Rest of LAMEA Environmental Remediation Market by Site Type
- 8.4.5.7.2. Rest of LAMEA Environmental Remediation Market by Technology
- 8.4.5.7.3. Rest of LAMEA Environmental Remediation Market by Environment Medium
- 8.4.5.7.4. Rest of LAMEA Environmental Remediation Market by Application
- 8.4.5.1. Brazil Environmental Remediation Market
- 8.4.1. LAMEA Environmental Remediation Market by Site Type
Chapter 9. Company Profiles
- 9.1. Golder Associates (WSP Global Inc.)
- 9.1.1. Company Overview
- 9.1.2. Financial Analysis
- 9.1.3. Regional Analysis
- 9.1.4. Recent strategies and developments:
- 9.1.4.1. Acquisition and Mergers:
- 9.2. Clean Harbors, Inc.
- 9.2.1. Company Overview
- 9.2.2. Financial Analysis
- 9.2.3. Segmental and Regional Analysis
- 9.2.4. Recent strategies and developments:
- 9.2.4.1. Acquisition and Mergers:
- 9.3. AECOM Corporation
- 9.3.1. Company Overview
- 9.3.2. Financial Analysis
- 9.3.3. Regional Analysis
- 9.3.4. Recent strategies and developments:
- 9.3.4.1. Product Launches and Product Expansions:
- 9.4. Stantec, Inc.
- 9.4.1. Company Overview
- 9.4.2. Financial Analysis
- 9.4.3. Regional Analysis
- 9.5. HDR, Inc.
- 9.5.1. Company Overview
- 9.5.2. Recent strategies and developments:
- 9.5.2.1. Acquisition and Mergers:
- 9.6. Tetra Tech, Inc.
- 9.6.1. Company Overview
- 9.6.2. Financial Analysis
- 9.6.3. Segmental and Regional Analysis
- 9.6.4. Recent strategies and developments:
- 9.6.4.1. Acquisition and Mergers:
- 9.7. Jacobs Engineering Group, Inc.
- 9.7.1. Company Overview
- 9.7.2. Financial Analysis
- 9.7.3. Segmental and Regional Analysis
- 9.7.4. Recent strategies and developments:
- 9.7.4.1. Acquisition and Mergers:
- 9.8. DEME NV
- 9.8.1. Company Overview
- 9.8.2. Financial Analysis
- 9.8.3. Segmental and Regional Analysis
- 9.9. BRISEA Group, Inc.
- 9.9.1. Company Overview