|
|
市場調査レポート
商品コード
1150094
3Dテクノロジーの世界市場規模、シェア、産業動向分析レポート製品別、用途別(軍事・防衛、メディア・エンターテインメント、自動車、産業、ヘルスケア)、地域別展望・予測、2022年~2028年Global 3D Technology Market Size, Share & Industry Trends Analysis Report By Product, By Application (Military & Defense, Media & Entertainment, Automotive, Industrial, Healthcare), By Regional Outlook and Forecast, 2022 - 2028 |
||||||
|
|
|||||||


| 3Dテクノロジーの世界市場規模、シェア、産業動向分析レポート製品別、用途別(軍事・防衛、メディア・エンターテインメント、自動車、産業、ヘルスケア)、地域別展望・予測、2022年~2028年 |
|
出版日: 2022年09月30日
発行: KBV Research
ページ情報: 英文 222 Pages
納期: 即納可能
|
- 全表示
- 概要
- 図表
- 目次
3Dテクノロジーの世界市場規模は、2028年までに4635億米ドルに達し、予測期間中にCAGR16.1%の市場成長率で上昇すると予想されています。
さらに、3Dプリントを航空宇宙産業に応用する考えは、この技術が軽量構造を製造できることから、特に魅力的です。さらに、3Dプリント技術には、飛行をサポートするのに十分な堅牢性を持つ部品を製造する能力があります。3Dプリンターで軽量な構造物を作れば、重いボルトやナットは不要になります。
COVID-19のインパクト分析
3Dテクノロジービジネスのプレーヤーは、COVID-19の勃発と伝播によって深刻な打撃を受けています。3Dテクノロジー産業の成長を促進する主要な要因の1つは、世界規模での自動車需要の増加です。しかし、COVID-19の拡散を食い止めるために多くの政府が実施した封鎖措置により、世界的に自動車販売が激減し、3Dテクノロジー市場にも悪影響を及ぼしています。また、各国のGDPや国民一人当たりの所得にも悪影響を及ぼしています。
市場の成長要因
世界のエンターテインメント分野での3Dテクノロジーの需要拡大
エンターテインメント分野では、3D・4D映像やインタラクティブ効果によるリアルな映像が人気を博しています。近年の3Dアニメーションの進化やコンピューターによる映像表現の増加により、特殊効果も3Dが主流となりつつあります。ここ数年、映画における3Dアニメーションの人気は、手描きや実写を凌ぐ勢いです。映画では、よりリアルな設定を実現するために、VFX(ビジュアルエフェクト)が頻繁に活用されています。3Dデジタル技術を映画で活用することで、総合的で多感な映画体験ができるようになりつつあります。
軍事・防衛分野での成長機会の増大
3Dカメラ、プリンター、センサー、スキャナー、ディスプレイは、軍事・防衛産業において、正確な測定や検査に利用されています。従来の測定技術と比較して、3Dスキャナは、自動車、戦車、ヘリコプターの新しい部品や再利用される部品を迅速かつ正確に測定するために採用されています。また、センサー、3Dカメラ、スキャナーは、無人地上走行車(UGV)の位置確認、ルート計画、地形図作成にも利用されています。
市場の抑制要因
3Dイメージングデバイスのメンテナンスにかかる膨大なコスト
3Dイメージングに使用されるセンサーやカメラは、埃や微粒子、汚染物質、外傷の影響を受けやすいです。画像の品質は、わずかな乱れによって大きな影響を受ける可能性があります。そのため、このような機器は慎重に扱う必要があり、一定期間ごとにメンテナンスが必要です。スキャンする3D画像の大きさや複雑さ、購入する機器のサイズや形状は、すべて3Dイメージングにかかる費用に影響します。
製品の展望
3Dテクノロジー市場は、製品によって、3Dプリント、3Dメガネ、3Dディスプレイ、3Dイメージング、3Dカメラに区分されます。2021年の3Dテクノロジー市場では、3Dイメージング部門が大きな収益シェアを記録しました。ジェスチャー認識、3Dモデリング、3Dレンダリング、その他のアプリケーションはすべて、3Dイメージング技術を活用しています。3Dテクノロジーは、医療、セキュリティ・監視、防衛、エンターテインメント、産業オートメーション、建設などの分野で活用されています。中でも医療用3D画像は、最もよく知られた用途の一つです。
アプリケーションの展望
3Dテクノロジー市場は、用途別にメディア&エンターテインメント、自動車、産業、ヘルスケア、軍事・防衛、その他に分類されます。2021年の3Dテクノロジー市場では、軍事・防衛分野が最大の収益シェアを獲得しています。これは、戦争で利用される柔軟な材料が、信じられないほど正確なプロトタイプの印刷に活用された結果です。軍事・防衛分野の強化に関する様々な国の投資の増加は、予測期間中に幅広い3Dテクノロジーやシステムに対するより多くの需要を生み出すと思われます。
地域別展望
地域別に見ると、3Dテクノロジー市場は北米、欧州、アジア太平洋、LAMEAで分析されています。北米は、2021年の収益シェアが最大で、3Dテクノロジー市場の主要地域となっています。同地域で3Dテクノロジーが多くのアプリケーション分野に採用された主な理由は、処理時間の短縮を支援する先進技術ベースのソリューションに対するニーズが高まっているためです。米国とカナダは、さまざまな製造手順において、こうした技術の主要かつ初期のユーザーであった北米の2つの例です。
市場参入企業がとっている主な戦略は、製品の上市です。Cardinal matrixに記載されている分析によると、Sony CorporationとHP Development Company L.P.が3Dテクノロジー市場の先駆者です。パナソニック株式会社、Hexagon AB、Autodesk, Inc.などの企業は、3Dテクノロジー市場における主要な革新者の一人です。
目次
第1章 市場の範囲と調査手法
- 市場の定義
- 目的
- 市場規模
- セグメンテーション
- 3Dテクノロジーの世界市場、製品別
- 3Dテクノロジーの世界市場、アプリケーション別
- 3Dテクノロジーの世界市場、地域別
- 調査手法
第2章 市場概要
- イントロダクション
- 概要説明
- 市場の構成とシナリオ
- 概要説明
- 市場に影響を与える主な要因
- 市場促進要因
- 市場の抑制要因
第3章 競合分析-世界
- KBVカーディナルマトリックス
- 最近の業界全体の戦略的展開
- パートナーシップ、コラボレーション、契約
- 製品上市と製品拡張
- 買収と合併
- 地理的拡大
- 主要成功戦略
- 主要なリーディング戦略:割合の分布(2018-2022)
- 主要な戦略的動き:(製品発表と製品拡張:2019年、1月~2022年、9月)主要なプレイヤーたち
第4章 3Dテクノロジーの世界市場:製品別
- 3Dディスプレイの世界市場:地域別
- 3Dプリンティングの世界市場:地域別
- 3Dメガネの世界市場:地域別
- 3Dカメラの世界市場:地域別
- 3Dイメージングの世界市場:地域別
- その他の地域別世界市場
第5章 3Dテクノロジーの世界市場:アプリケーション別
- 軍事・防衛の世界市場:地域別
- メディア&エンターテインメントの世界市場:地域別
- 自動車分野の世界市場:地域別
- 産業分野の世界市場:地域別
- ヘルスケアの世界市場:地域別
- その他分野の世界市場:地域別
第6章 3Dテクノロジーの世界市場:地域別市場
- 北米
- 北米の3Dテクノロジーの国別市場
- 米国
- カナダ
- メキシコ
- 北米以外の地域
- 北米の3Dテクノロジーの国別市場
- 欧州
- 欧州3Dテクノロジー市場:国別
- ドイツ
- 英国
- フランス
- ロシア
- スペイン
- イタリア
- その他欧州
- 欧州3Dテクノロジー市場:国別
- アジア太平洋地域
- アジア太平洋地域の3Dテクノロジー国別市場
- 中国
- 日本
- インド
- 韓国
- シンガポール
- マレーシア
- その他アジア太平洋地域
- アジア太平洋地域の3Dテクノロジー国別市場
- LAMEA
- LAMEAの3Dテクノロジー市場:国別
- ブラジル
- アルゼンチン
- UAE
- サウジアラビア
- 南アフリカ共和国
- ナイジェリア
- その他のLAMEA
- LAMEAの3Dテクノロジー市場:国別
第7章 企業プロファイル
- 3D Systems Corporation
- Autodesk, Inc.
- Panasonic Corporation
- Sony Corporation
- FARO Technologies, Inc.
- Hewlett Packard Enterprise Company(HP Development Company L.P.)
- The ExOne company(Desktop Metal, Inc.)
- Hexagon AB
- Stratasys, Ltd.
- Vicon Motion System, Ltd.
LIST OF TABLES
- TABLE 1 Global 3D Technology Market, 2018 - 2021, USD Million
- TABLE 2 Global 3D Technology Market, 2022 - 2028, USD Million
- TABLE 3 Partnerships, Collaborations and Agreements- 3D Technology Market
- TABLE 4 Product Launches And Product Expansions- 3D Technology Market
- TABLE 5 Acquisition and Mergers- 3D Technology Market
- TABLE 6 Geographical Expansion- 3D Technology Market
- TABLE 7 Global 3D Technology Market by Product, 2018 - 2021, USD Million
- TABLE 8 Global 3D Technology Market by Product, 2022 - 2028, USD Million
- TABLE 9 Global 3D Display Market by Region, 2018 - 2021, USD Million
- TABLE 10 Global 3D Display Market by Region, 2022 - 2028, USD Million
- TABLE 11 Global 3D Printing Market by Region, 2018 - 2021, USD Million
- TABLE 12 Global 3D Printing Market by Region, 2022 - 2028, USD Million
- TABLE 13 Global 3D Glasses Market by Region, 2018 - 2021, USD Million
- TABLE 14 Global 3D Glasses Market by Region, 2022 - 2028, USD Million
- TABLE 15 Global 3D Camera Market by Region, 2018 - 2021, USD Million
- TABLE 16 Global 3D Camera Market by Region, 2022 - 2028, USD Million
- TABLE 17 Global 3D Imaging Market by Region, 2018 - 2021, USD Million
- TABLE 18 Global 3D Imaging Market by Region, 2022 - 2028, USD Million
- TABLE 19 Global Others Market by Region, 2018 - 2021, USD Million
- TABLE 20 Global Others Market by Region, 2022 - 2028, USD Million
- TABLE 21 Global 3D Technology Market by Application, 2018 - 2021, USD Million
- TABLE 22 Global 3D Technology Market by Application, 2022 - 2028, USD Million
- TABLE 23 Global Military & Defense Market by Region, 2018 - 2021, USD Million
- TABLE 24 Global Military & Defense Market by Region, 2022 - 2028, USD Million
- TABLE 25 Global Media & Entertainment Market by Region, 2018 - 2021, USD Million
- TABLE 26 Global Media & Entertainment Market by Region, 2022 - 2028, USD Million
- TABLE 27 Global Automotive Market by Region, 2018 - 2021, USD Million
- TABLE 28 Global Automotive Market by Region, 2022 - 2028, USD Million
- TABLE 29 Global Industrial Market by Region, 2018 - 2021, USD Million
- TABLE 30 Global Industrial Market by Region, 2022 - 2028, USD Million
- TABLE 31 Global Healthcare Market by Region, 2018 - 2021, USD Million
- TABLE 32 Global Healthcare Market by Region, 2022 - 2028, USD Million
- TABLE 33 Global Others Market by Region, 2018 - 2021, USD Million
- TABLE 34 Global Others Market by Region, 2022 - 2028, USD Million
- TABLE 35 Global 3D Technology Market by Region, 2018 - 2021, USD Million
- TABLE 36 Global 3D Technology Market by Region, 2022 - 2028, USD Million
- TABLE 37 North America 3D Technology Market, 2018 - 2021, USD Million
- TABLE 38 North America 3D Technology Market, 2022 - 2028, USD Million
- TABLE 39 North America 3D Technology Market by Product, 2018 - 2021, USD Million
- TABLE 40 North America 3D Technology Market by Product, 2022 - 2028, USD Million
- TABLE 41 North America 3D Display Market by Country, 2018 - 2021, USD Million
- TABLE 42 North America 3D Display Market by Country, 2022 - 2028, USD Million
- TABLE 43 North America 3D Printing Market by Country, 2018 - 2021, USD Million
- TABLE 44 North America 3D Printing Market by Country, 2022 - 2028, USD Million
- TABLE 45 North America 3D Glasses Market by Country, 2018 - 2021, USD Million
- TABLE 46 North America 3D Glasses Market by Country, 2022 - 2028, USD Million
- TABLE 47 North America 3D Camera Market by Country, 2018 - 2021, USD Million
- TABLE 48 North America 3D Camera Market by Country, 2022 - 2028, USD Million
- TABLE 49 North America 3D Imaging Market by Country, 2018 - 2021, USD Million
- TABLE 50 North America 3D Imaging Market by Country, 2022 - 2028, USD Million
- TABLE 51 North America Others Market by Country, 2018 - 2021, USD Million
- TABLE 52 North America Others Market by Country, 2022 - 2028, USD Million
- TABLE 53 North America 3D Technology Market by Application, 2018 - 2021, USD Million
- TABLE 54 North America 3D Technology Market by Application, 2022 - 2028, USD Million
- TABLE 55 North America Military & Defense Market by Country, 2018 - 2021, USD Million
- TABLE 56 North America Military & Defense Market by Country, 2022 - 2028, USD Million
- TABLE 57 North America Media & Entertainment Market by Country, 2018 - 2021, USD Million
- TABLE 58 North America Media & Entertainment Market by Country, 2022 - 2028, USD Million
- TABLE 59 North America Automotive Market by Country, 2018 - 2021, USD Million
- TABLE 60 North America Automotive Market by Country, 2022 - 2028, USD Million
- TABLE 61 North America Industrial Market by Country, 2018 - 2021, USD Million
- TABLE 62 North America Industrial Market by Country, 2022 - 2028, USD Million
- TABLE 63 North America Healthcare Market by Country, 2018 - 2021, USD Million
- TABLE 64 North America Healthcare Market by Country, 2022 - 2028, USD Million
- TABLE 65 North America Others Market by Country, 2018 - 2021, USD Million
- TABLE 66 North America Others Market by Country, 2022 - 2028, USD Million
- TABLE 67 North America 3D Technology Market by Country, 2018 - 2021, USD Million
- TABLE 68 North America 3D Technology Market by Country, 2022 - 2028, USD Million
- TABLE 69 US 3D Technology Market, 2018 - 2021, USD Million
- TABLE 70 US 3D Technology Market, 2022 - 2028, USD Million
- TABLE 71 US 3D Technology Market by Product, 2018 - 2021, USD Million
- TABLE 72 US 3D Technology Market by Product, 2022 - 2028, USD Million
- TABLE 73 US 3D Technology Market by Application, 2018 - 2021, USD Million
- TABLE 74 US 3D Technology Market by Application, 2022 - 2028, USD Million
- TABLE 75 Canada 3D Technology Market, 2018 - 2021, USD Million
- TABLE 76 Canada 3D Technology Market, 2022 - 2028, USD Million
- TABLE 77 Canada 3D Technology Market by Product, 2018 - 2021, USD Million
- TABLE 78 Canada 3D Technology Market by Product, 2022 - 2028, USD Million
- TABLE 79 Canada 3D Technology Market by Application, 2018 - 2021, USD Million
- TABLE 80 Canada 3D Technology Market by Application, 2022 - 2028, USD Million
- TABLE 81 Mexico 3D Technology Market, 2018 - 2021, USD Million
- TABLE 82 Mexico 3D Technology Market, 2022 - 2028, USD Million
- TABLE 83 Mexico 3D Technology Market by Product, 2018 - 2021, USD Million
- TABLE 84 Mexico 3D Technology Market by Product, 2022 - 2028, USD Million
- TABLE 85 Mexico 3D Technology Market by Application, 2018 - 2021, USD Million
- TABLE 86 Mexico 3D Technology Market by Application, 2022 - 2028, USD Million
- TABLE 87 Rest of North America 3D Technology Market, 2018 - 2021, USD Million
- TABLE 88 Rest of North America 3D Technology Market, 2022 - 2028, USD Million
- TABLE 89 Rest of North America 3D Technology Market by Product, 2018 - 2021, USD Million
- TABLE 90 Rest of North America 3D Technology Market by Product, 2022 - 2028, USD Million
- TABLE 91 Rest of North America 3D Technology Market by Application, 2018 - 2021, USD Million
- TABLE 92 Rest of North America 3D Technology Market by Application, 2022 - 2028, USD Million
- TABLE 93 Europe 3D Technology Market, 2018 - 2021, USD Million
- TABLE 94 Europe 3D Technology Market, 2022 - 2028, USD Million
- TABLE 95 Europe 3D Technology Market by Product, 2018 - 2021, USD Million
- TABLE 96 Europe 3D Technology Market by Product, 2022 - 2028, USD Million
- TABLE 97 Europe 3D Display Market by Country, 2018 - 2021, USD Million
- TABLE 98 Europe 3D Display Market by Country, 2022 - 2028, USD Million
- TABLE 99 Europe 3D Printing Market by Country, 2018 - 2021, USD Million
- TABLE 100 Europe 3D Printing Market by Country, 2022 - 2028, USD Million
- TABLE 101 Europe 3D Glasses Market by Country, 2018 - 2021, USD Million
- TABLE 102 Europe 3D Glasses Market by Country, 2022 - 2028, USD Million
- TABLE 103 Europe 3D Camera Market by Country, 2018 - 2021, USD Million
- TABLE 104 Europe 3D Camera Market by Country, 2022 - 2028, USD Million
- TABLE 105 Europe 3D Imaging Market by Country, 2018 - 2021, USD Million
- TABLE 106 Europe 3D Imaging Market by Country, 2022 - 2028, USD Million
- TABLE 107 Europe Others Market by Country, 2018 - 2021, USD Million
- TABLE 108 Europe Others Market by Country, 2022 - 2028, USD Million
- TABLE 109 Europe 3D Technology Market by Application, 2018 - 2021, USD Million
- TABLE 110 Europe 3D Technology Market by Application, 2022 - 2028, USD Million
- TABLE 111 Europe Military & Defense Market by Country, 2018 - 2021, USD Million
- TABLE 112 Europe Military & Defense Market by Country, 2022 - 2028, USD Million
- TABLE 113 Europe Media & Entertainment Market by Country, 2018 - 2021, USD Million
- TABLE 114 Europe Media & Entertainment Market by Country, 2022 - 2028, USD Million
- TABLE 115 Europe Automotive Market by Country, 2018 - 2021, USD Million
- TABLE 116 Europe Automotive Market by Country, 2022 - 2028, USD Million
- TABLE 117 Europe Industrial Market by Country, 2018 - 2021, USD Million
- TABLE 118 Europe Industrial Market by Country, 2022 - 2028, USD Million
- TABLE 119 Europe Healthcare Market by Country, 2018 - 2021, USD Million
- TABLE 120 Europe Healthcare Market by Country, 2022 - 2028, USD Million
- TABLE 121 Europe Others Market by Country, 2018 - 2021, USD Million
- TABLE 122 Europe Others Market by Country, 2022 - 2028, USD Million
- TABLE 123 Europe 3D Technology Market by Country, 2018 - 2021, USD Million
- TABLE 124 Europe 3D Technology Market by Country, 2022 - 2028, USD Million
- TABLE 125 Germany 3D Technology Market, 2018 - 2021, USD Million
- TABLE 126 Germany 3D Technology Market, 2022 - 2028, USD Million
- TABLE 127 Germany 3D Technology Market by Product, 2018 - 2021, USD Million
- TABLE 128 Germany 3D Technology Market by Product, 2022 - 2028, USD Million
- TABLE 129 Germany 3D Technology Market by Application, 2018 - 2021, USD Million
- TABLE 130 Germany 3D Technology Market by Application, 2022 - 2028, USD Million
- TABLE 131 UK 3D Technology Market, 2018 - 2021, USD Million
- TABLE 132 UK 3D Technology Market, 2022 - 2028, USD Million
- TABLE 133 UK 3D Technology Market by Product, 2018 - 2021, USD Million
- TABLE 134 UK 3D Technology Market by Product, 2022 - 2028, USD Million
- TABLE 135 UK 3D Technology Market by Application, 2018 - 2021, USD Million
- TABLE 136 UK 3D Technology Market by Application, 2022 - 2028, USD Million
- TABLE 137 France 3D Technology Market, 2018 - 2021, USD Million
- TABLE 138 France 3D Technology Market, 2022 - 2028, USD Million
- TABLE 139 France 3D Technology Market by Product, 2018 - 2021, USD Million
- TABLE 140 France 3D Technology Market by Product, 2022 - 2028, USD Million
- TABLE 141 France 3D Technology Market by Application, 2018 - 2021, USD Million
- TABLE 142 France 3D Technology Market by Application, 2022 - 2028, USD Million
- TABLE 143 Russia 3D Technology Market, 2018 - 2021, USD Million
- TABLE 144 Russia 3D Technology Market, 2022 - 2028, USD Million
- TABLE 145 Russia 3D Technology Market by Product, 2018 - 2021, USD Million
- TABLE 146 Russia 3D Technology Market by Product, 2022 - 2028, USD Million
- TABLE 147 Russia 3D Technology Market by Application, 2018 - 2021, USD Million
- TABLE 148 Russia 3D Technology Market by Application, 2022 - 2028, USD Million
- TABLE 149 Spain 3D Technology Market, 2018 - 2021, USD Million
- TABLE 150 Spain 3D Technology Market, 2022 - 2028, USD Million
- TABLE 151 Spain 3D Technology Market by Product, 2018 - 2021, USD Million
- TABLE 152 Spain 3D Technology Market by Product, 2022 - 2028, USD Million
- TABLE 153 Spain 3D Technology Market by Application, 2018 - 2021, USD Million
- TABLE 154 Spain 3D Technology Market by Application, 2022 - 2028, USD Million
- TABLE 155 Italy 3D Technology Market, 2018 - 2021, USD Million
- TABLE 156 Italy 3D Technology Market, 2022 - 2028, USD Million
- TABLE 157 Italy 3D Technology Market by Product, 2018 - 2021, USD Million
- TABLE 158 Italy 3D Technology Market by Product, 2022 - 2028, USD Million
- TABLE 159 Italy 3D Technology Market by Application, 2018 - 2021, USD Million
- TABLE 160 Italy 3D Technology Market by Application, 2022 - 2028, USD Million
- TABLE 161 Rest of Europe 3D Technology Market, 2018 - 2021, USD Million
- TABLE 162 Rest of Europe 3D Technology Market, 2022 - 2028, USD Million
- TABLE 163 Rest of Europe 3D Technology Market by Product, 2018 - 2021, USD Million
- TABLE 164 Rest of Europe 3D Technology Market by Product, 2022 - 2028, USD Million
- TABLE 165 Rest of Europe 3D Technology Market by Application, 2018 - 2021, USD Million
- TABLE 166 Rest of Europe 3D Technology Market by Application, 2022 - 2028, USD Million
- TABLE 167 Asia Pacific 3D Technology Market, 2018 - 2021, USD Million
- TABLE 168 Asia Pacific 3D Technology Market, 2022 - 2028, USD Million
- TABLE 169 Asia Pacific 3D Technology Market by Product, 2018 - 2021, USD Million
- TABLE 170 Asia Pacific 3D Technology Market by Product, 2022 - 2028, USD Million
- TABLE 171 Asia Pacific 3D Display Market by Country, 2018 - 2021, USD Million
- TABLE 172 Asia Pacific 3D Display Market by Country, 2022 - 2028, USD Million
- TABLE 173 Asia Pacific 3D Printing Market by Country, 2018 - 2021, USD Million
- TABLE 174 Asia Pacific 3D Printing Market by Country, 2022 - 2028, USD Million
- TABLE 175 Asia Pacific 3D Glasses Market by Country, 2018 - 2021, USD Million
- TABLE 176 Asia Pacific 3D Glasses Market by Country, 2022 - 2028, USD Million
- TABLE 177 Asia Pacific 3D Camera Market by Country, 2018 - 2021, USD Million
- TABLE 178 Asia Pacific 3D Camera Market by Country, 2022 - 2028, USD Million
- TABLE 179 Asia Pacific 3D Imaging Market by Country, 2018 - 2021, USD Million
- TABLE 180 Asia Pacific 3D Imaging Market by Country, 2022 - 2028, USD Million
- TABLE 181 Asia Pacific Others Market by Country, 2018 - 2021, USD Million
- TABLE 182 Asia Pacific Others Market by Country, 2022 - 2028, USD Million
- TABLE 183 Asia Pacific 3D Technology Market by Application, 2018 - 2021, USD Million
- TABLE 184 Asia Pacific 3D Technology Market by Application, 2022 - 2028, USD Million
- TABLE 185 Asia Pacific Military & Defense Market by Country, 2018 - 2021, USD Million
- TABLE 186 Asia Pacific Military & Defense Market by Country, 2022 - 2028, USD Million
- TABLE 187 Asia Pacific Media & Entertainment Market by Country, 2018 - 2021, USD Million
- TABLE 188 Asia Pacific Media & Entertainment Market by Country, 2022 - 2028, USD Million
- TABLE 189 Asia Pacific Automotive Market by Country, 2018 - 2021, USD Million
- TABLE 190 Asia Pacific Automotive Market by Country, 2022 - 2028, USD Million
- TABLE 191 Asia Pacific Industrial Market by Country, 2018 - 2021, USD Million
- TABLE 192 Asia Pacific Industrial Market by Country, 2022 - 2028, USD Million
- TABLE 193 Asia Pacific Healthcare Market by Country, 2018 - 2021, USD Million
- TABLE 194 Asia Pacific Healthcare Market by Country, 2022 - 2028, USD Million
- TABLE 195 Asia Pacific Others Market by Country, 2018 - 2021, USD Million
- TABLE 196 Asia Pacific Others Market by Country, 2022 - 2028, USD Million
- TABLE 197 Asia Pacific 3D Technology Market by Country, 2018 - 2021, USD Million
- TABLE 198 Asia Pacific 3D Technology Market by Country, 2022 - 2028, USD Million
- TABLE 199 China 3D Technology Market, 2018 - 2021, USD Million
- TABLE 200 China 3D Technology Market, 2022 - 2028, USD Million
- TABLE 201 China 3D Technology Market by Product, 2018 - 2021, USD Million
- TABLE 202 China 3D Technology Market by Product, 2022 - 2028, USD Million
- TABLE 203 China 3D Technology Market by Application, 2018 - 2021, USD Million
- TABLE 204 China 3D Technology Market by Application, 2022 - 2028, USD Million
- TABLE 205 Japan 3D Technology Market, 2018 - 2021, USD Million
- TABLE 206 Japan 3D Technology Market, 2022 - 2028, USD Million
- TABLE 207 Japan 3D Technology Market by Product, 2018 - 2021, USD Million
- TABLE 208 Japan 3D Technology Market by Product, 2022 - 2028, USD Million
- TABLE 209 Japan 3D Technology Market by Application, 2018 - 2021, USD Million
- TABLE 210 Japan 3D Technology Market by Application, 2022 - 2028, USD Million
- TABLE 211 India 3D Technology Market, 2018 - 2021, USD Million
- TABLE 212 India 3D Technology Market, 2022 - 2028, USD Million
- TABLE 213 India 3D Technology Market by Product, 2018 - 2021, USD Million
- TABLE 214 India 3D Technology Market by Product, 2022 - 2028, USD Million
- TABLE 215 India 3D Technology Market by Application, 2018 - 2021, USD Million
- TABLE 216 India 3D Technology Market by Application, 2022 - 2028, USD Million
- TABLE 217 South Korea 3D Technology Market, 2018 - 2021, USD Million
- TABLE 218 South Korea 3D Technology Market, 2022 - 2028, USD Million
- TABLE 219 South Korea 3D Technology Market by Product, 2018 - 2021, USD Million
- TABLE 220 South Korea 3D Technology Market by Product, 2022 - 2028, USD Million
- TABLE 221 South Korea 3D Technology Market by Application, 2018 - 2021, USD Million
- TABLE 222 South Korea 3D Technology Market by Application, 2022 - 2028, USD Million
- TABLE 223 Singapore 3D Technology Market, 2018 - 2021, USD Million
- TABLE 224 Singapore 3D Technology Market, 2022 - 2028, USD Million
- TABLE 225 Singapore 3D Technology Market by Product, 2018 - 2021, USD Million
- TABLE 226 Singapore 3D Technology Market by Product, 2022 - 2028, USD Million
- TABLE 227 Singapore 3D Technology Market by Application, 2018 - 2021, USD Million
- TABLE 228 Singapore 3D Technology Market by Application, 2022 - 2028, USD Million
- TABLE 229 Malaysia 3D Technology Market, 2018 - 2021, USD Million
- TABLE 230 Malaysia 3D Technology Market, 2022 - 2028, USD Million
- TABLE 231 Malaysia 3D Technology Market by Product, 2018 - 2021, USD Million
- TABLE 232 Malaysia 3D Technology Market by Product, 2022 - 2028, USD Million
- TABLE 233 Malaysia 3D Technology Market by Application, 2018 - 2021, USD Million
- TABLE 234 Malaysia 3D Technology Market by Application, 2022 - 2028, USD Million
- TABLE 235 Rest of Asia Pacific 3D Technology Market, 2018 - 2021, USD Million
- TABLE 236 Rest of Asia Pacific 3D Technology Market, 2022 - 2028, USD Million
- TABLE 237 Rest of Asia Pacific 3D Technology Market by Product, 2018 - 2021, USD Million
- TABLE 238 Rest of Asia Pacific 3D Technology Market by Product, 2022 - 2028, USD Million
- TABLE 239 Rest of Asia Pacific 3D Technology Market by Application, 2018 - 2021, USD Million
- TABLE 240 Rest of Asia Pacific 3D Technology Market by Application, 2022 - 2028, USD Million
- TABLE 241 LAMEA 3D Technology Market, 2018 - 2021, USD Million
- TABLE 242 LAMEA 3D Technology Market, 2022 - 2028, USD Million
- TABLE 243 LAMEA 3D Technology Market by Product, 2018 - 2021, USD Million
- TABLE 244 LAMEA 3D Technology Market by Product, 2022 - 2028, USD Million
- TABLE 245 LAMEA 3D Display Market by Country, 2018 - 2021, USD Million
- TABLE 246 LAMEA 3D Display Market by Country, 2022 - 2028, USD Million
- TABLE 247 LAMEA 3D Printing Market by Country, 2018 - 2021, USD Million
- TABLE 248 LAMEA 3D Printing Market by Country, 2022 - 2028, USD Million
- TABLE 249 LAMEA 3D Glasses Market by Country, 2018 - 2021, USD Million
- TABLE 250 LAMEA 3D Glasses Market by Country, 2022 - 2028, USD Million
- TABLE 251 LAMEA 3D Camera Market by Country, 2018 - 2021, USD Million
- TABLE 252 LAMEA 3D Camera Market by Country, 2022 - 2028, USD Million
- TABLE 253 LAMEA 3D Imaging Market by Country, 2018 - 2021, USD Million
- TABLE 254 LAMEA 3D Imaging Market by Country, 2022 - 2028, USD Million
- TABLE 255 LAMEA Others Market by Country, 2018 - 2021, USD Million
- TABLE 256 LAMEA Others Market by Country, 2022 - 2028, USD Million
- TABLE 257 LAMEA 3D Technology Market by Application, 2018 - 2021, USD Million
- TABLE 258 LAMEA 3D Technology Market by Application, 2022 - 2028, USD Million
- TABLE 259 LAMEA Military & Defense Market by Country, 2018 - 2021, USD Million
- TABLE 260 LAMEA Military & Defense Market by Country, 2022 - 2028, USD Million
- TABLE 261 LAMEA Media & Entertainment Market by Country, 2018 - 2021, USD Million
- TABLE 262 LAMEA Media & Entertainment Market by Country, 2022 - 2028, USD Million
- TABLE 263 LAMEA Automotive Market by Country, 2018 - 2021, USD Million
- TABLE 264 LAMEA Automotive Market by Country, 2022 - 2028, USD Million
- TABLE 265 LAMEA Industrial Market by Country, 2018 - 2021, USD Million
- TABLE 266 LAMEA Industrial Market by Country, 2022 - 2028, USD Million
- TABLE 267 LAMEA Healthcare Market by Country, 2018 - 2021, USD Million
- TABLE 268 LAMEA Healthcare Market by Country, 2022 - 2028, USD Million
- TABLE 269 LAMEA Others Market by Country, 2018 - 2021, USD Million
- TABLE 270 LAMEA Others Market by Country, 2022 - 2028, USD Million
- TABLE 271 LAMEA 3D Technology Market by Country, 2018 - 2021, USD Million
- TABLE 272 LAMEA 3D Technology Market by Country, 2022 - 2028, USD Million
- TABLE 273 Brazil 3D Technology Market, 2018 - 2021, USD Million
- TABLE 274 Brazil 3D Technology Market, 2022 - 2028, USD Million
- TABLE 275 Brazil 3D Technology Market by Product, 2018 - 2021, USD Million
- TABLE 276 Brazil 3D Technology Market by Product, 2022 - 2028, USD Million
- TABLE 277 Brazil 3D Technology Market by Application, 2018 - 2021, USD Million
- TABLE 278 Brazil 3D Technology Market by Application, 2022 - 2028, USD Million
- TABLE 279 Argentina 3D Technology Market, 2018 - 2021, USD Million
- TABLE 280 Argentina 3D Technology Market, 2022 - 2028, USD Million
- TABLE 281 Argentina 3D Technology Market by Product, 2018 - 2021, USD Million
- TABLE 282 Argentina 3D Technology Market by Product, 2022 - 2028, USD Million
- TABLE 283 Argentina 3D Technology Market by Application, 2018 - 2021, USD Million
- TABLE 284 Argentina 3D Technology Market by Application, 2022 - 2028, USD Million
- TABLE 285 UAE 3D Technology Market, 2018 - 2021, USD Million
- TABLE 286 UAE 3D Technology Market, 2022 - 2028, USD Million
- TABLE 287 UAE 3D Technology Market by Product, 2018 - 2021, USD Million
- TABLE 288 UAE 3D Technology Market by Product, 2022 - 2028, USD Million
- TABLE 289 UAE 3D Technology Market by Application, 2018 - 2021, USD Million
- TABLE 290 UAE 3D Technology Market by Application, 2022 - 2028, USD Million
- TABLE 291 Saudi Arabia 3D Technology Market, 2018 - 2021, USD Million
- TABLE 292 Saudi Arabia 3D Technology Market, 2022 - 2028, USD Million
- TABLE 293 Saudi Arabia 3D Technology Market by Product, 2018 - 2021, USD Million
- TABLE 294 Saudi Arabia 3D Technology Market by Product, 2022 - 2028, USD Million
- TABLE 295 Saudi Arabia 3D Technology Market by Application, 2018 - 2021, USD Million
- TABLE 296 Saudi Arabia 3D Technology Market by Application, 2022 - 2028, USD Million
- TABLE 297 South Africa 3D Technology Market, 2018 - 2021, USD Million
- TABLE 298 South Africa 3D Technology Market, 2022 - 2028, USD Million
- TABLE 299 South Africa 3D Technology Market by Product, 2018 - 2021, USD Million
- TABLE 300 South Africa 3D Technology Market by Product, 2022 - 2028, USD Million
- TABLE 301 South Africa 3D Technology Market by Application, 2018 - 2021, USD Million
- TABLE 302 South Africa 3D Technology Market by Application, 2022 - 2028, USD Million
- TABLE 303 Nigeria 3D Technology Market, 2018 - 2021, USD Million
- TABLE 304 Nigeria 3D Technology Market, 2022 - 2028, USD Million
- TABLE 305 Nigeria 3D Technology Market by Product, 2018 - 2021, USD Million
- TABLE 306 Nigeria 3D Technology Market by Product, 2022 - 2028, USD Million
- TABLE 307 Nigeria 3D Technology Market by Application, 2018 - 2021, USD Million
- TABLE 308 Nigeria 3D Technology Market by Application, 2022 - 2028, USD Million
- TABLE 309 Rest of LAMEA 3D Technology Market, 2018 - 2021, USD Million
- TABLE 310 Rest of LAMEA 3D Technology Market, 2022 - 2028, USD Million
- TABLE 311 Rest of LAMEA 3D Technology Market by Product, 2018 - 2021, USD Million
- TABLE 312 Rest of LAMEA 3D Technology Market by Product, 2022 - 2028, USD Million
- TABLE 313 Rest of LAMEA 3D Technology Market by Application, 2018 - 2021, USD Million
- TABLE 314 Rest of LAMEA 3D Technology Market by Application, 2022 - 2028, USD Million
- TABLE 315 Key Information - 3D Systems Corporation
- TABLE 316 Key Information - Autodesk, Inc.
- TABLE 317 Key Information - Panasonic Corporation
- TABLE 318 Key Information - Sony Corporation
- TABLE 319 Key Information - FARO Technologies, Inc.
- TABLE 320 key information - Hewlett Packard Enterprise Company
- TABLE 321 Key Information - The ExOne company
- TABLE 322 Key information - Hexagon AB
- TABLE 323 key Information - Stratasys, Ltd.
- TABLE 324 Key Information - Vicon Motion System, Ltd.
List of Figures
- FIG 1 Methodology for the research
- FIG 2 KBV Cardinal Matrix
- FIG 3 Key Leading Strategies: Percentage Distribution (2018-2022)
- FIG 4 Key Strategic Move: (Product Launches and Product Expansions : 2019, Jan - 2022, sep) Leading Players
- FIG 5 Global 3D Technology Market share by Product, 2021
- FIG 6 Global 3D Technology Market share by Product, 2028
- FIG 7 Global 3D Technology Market by Product, 2018 - 2028, USD Million
- FIG 8 Global 3D Technology Market share by Application, 2021
- FIG 9 Global 3D Technology Market share by Application, 2028
- FIG 10 Global 3D Technology Market by Application, 2018 - 2028, USD Million
- FIG 11 Global 3D Technology Market share by Region, 2021
- FIG 12 Global 3D Technology Market share by Region, 2028
- FIG 13 Global 3D Technology Market by Region, 2018 - 2028, USD Million
- FIG 14 Recent strategies and developments: 3D Systems Corporation
- FIG 15 SWOT Analysis: 3D Systems Corporation
- FIG 16 Recent strategies and developments: Autodesk, Inc.
- FIG 17 SWOT Analysis: Autodesk, Inc.
- FIG 18 SWOT Analysis: Panasonic Corporation
- FIG 19 Swot analysis: sony corporation
- FIG 20 Recent strategies and developments: FARO Technologies, Inc.
- FIG 21 SWOT Analysis: FARO Technologies, Inc.
- FIG 22 Recent strategies and developments: HP Development Company L.P.
- FIG 23 SWOT analysis: Hewlett-Packard enterprise Company
- FIG 24 Recent strategies and developments: The ExOne company
- FIG 25 Recent strategies and developments: Hexagon AB
- FIG 26 Recent strategies and developments: Stratasys, Ltd.
The Global 3D Technology Market size is expected to reach $463.5 billion by 2028, rising at a market growth of 16.1% CAGR during the forecast period.
3D views of the data or photos that were gathered, are delivered using 3D technology. In a number of application areas, including healthcare, government & defence, aerospace, entertainment, entertainment & automotive, and industrial divisions, there is a growth in demand for products based on 3D technology. An accurate and completely effective image of an object is produced by 3D technology. It is anticipated that the use of 3D technology would reduce production costs and time across a range of application categories.
The viability of any invention can be intuitively understood by designers from the very beginning thanks to a ready-made tool. Several countries are interested in 3D printing because of its potential. This move by the governments is expected to have a significant impact on the demand for 3D printing technology. The favorable environment is contributing to the demand for 3D printing technology.
Additionally, the thought of applying 3D printing to the aerospace industry is particularly attractive because this technology can produce lightweight structures. Additionally, 3D printing technology has the capacity to produce parts that are robust enough to support flight. The requirement for heavy bolts and nuts can be avoided by manufacturing light material structures with the aid of 3D printing technology.
COVID-19 Impact Analysis
Players in the 3D technology business have been severely harmed by the breakout and propagation of COVID-19. One of the major factors driving the growth of the 3D technology industry is the rising demand for automobiles on a global scale. Nevertheless, lockdowns implemented by many governments to stem the spread of the COVID-19 have dramatically reduced automobile sales globally, which has had an adverse effect on the market for 3D technology. Furthermore, the GDP of nations and the per capita income of people all around the world have both been damaged by these lockdowns.
Market Growth Factors
Growing Demand for 3D Technology in Entertainment Sector All Over the World
Realistic films with 3D and 4D motion images and interactive effects are increasingly popular in the entertainment field. A result of recent advancements in 3D animation and a rise in computer-based visuals, 3D is now the norm for special effects. In past years, 3D animation in films has surpassed both hand-drawn and practical effects in terms of popularity. To create a more realistic setting, visual effects (VFX) are frequently utilized in films. The utilization of 3D digital technology in films to create a comprehensive, multi-sensory cinematic experience is growing.
Rising Growth Opportunities by Military and Defense Sector
3D cameras, printers, sensors, scanners, and displays are utilized in the military and defense industry for accurate measurement and inspection. In comparison to more conventional measurement techniques, 3D scanners are employed to swiftly and accurately measure new or reused parts of vehicles, tanks, and helicopters. The sensors, 3D cameras, and scanners are also utilized to locate, plan routes for unmanned ground vehicles (UGVs), and map terrains.
Market Restraining Factors
Huge Cost of Maintenance of 3D Imaging Devices
The sensors and cameras used for 3D imaging are susceptible to dust, microparticles, contaminants, and trauma. An image's quality could be greatly impacted by a small disruption. Thus, such devices need to be handled carefully and are needed to be maintained after a regular interval of time. The dimension and complexity of the scanned 3D image, in addition to the total size and geometry of the devices be purchased, all affect how much 3D imaging costs.
Product Outlook
Based on product, the 3D technology market is segmented into 3D Printing, 3D Glasses, 3D Glasses, 3D Display, 3D Imaging and 3D Camera. 3D Imaging segment recorded a significant revenue share in the 3D technology market in 2021. Gesture recognition, 3D modelling, 3D rendering, and other applications all make utilization 3D imaging technologies. There are several uses for 3D technology in the fields of medicine, security & surveillance, defense, entertainment, industrial automation, construction, and others. 3D medical imaging is among the most well-known uses.
Application Outlook
By application, the 3D technology market is divided into Media & Entertainment, Automotive, Industrial, Healthcare, Military and Defense, and Others. The Military and Defense segment garnered the maximum revenue share in the 3D technology market in 2021. This is a result of flexible materials utilized in war being utilized to print incredibly accurate prototypes. The rise in the investments by various nations on strengthening their military and defense sector would create more demand for a wide range of 3D technologies and systems over the forecast period.
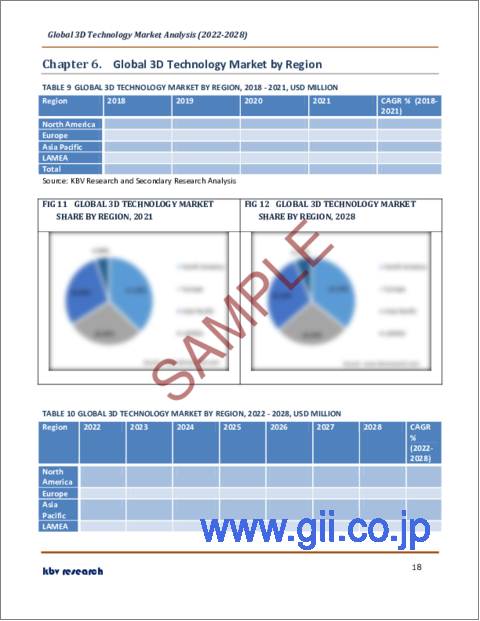
Regional Outlook
Region-wise, the 3D technology market is analyzed across North America, Europe, Asia Pacific and LAMEA. North America emerged as the leading region in the 3D technology market with the largest revenue share in 2021. The main reason behind the adoption of 3D technology into numerous application sectors in the region is the rising need for advanced technology-based solutions that assist to shorten processing times. The U.S. and Canada are two examples of North American nations that were among the leading and early users of such technologies in a variety of manufacturing procedures.
The major strategies followed by the market participants are Product Launches. Based on the Analysis presented in the Cardinal matrix; Sony Corporation and HP Development Company L.P. are the forerunners in the 3D Technology Market. Companies such as Panasonic Corporation, Hexagon AB and Autodesk, Inc. are some of the key innovators in 3D Technology Market.
The market research report covers the analysis of key stake holders of the market. Key companies profiled in the report include 3D Systems Corporation, Autodesk, Inc., Panasonic Corporation, Sony Corporation, FARO Technologies, Inc., Hewlett-Packard enterprise company (HP Development Company L.P.), The ExOne company (Desktop Metal, Inc.), Hexagon AB, Stratasys, Ltd., Vicon Motion System, Ltd.
Recent strategies deployed in 3D Technology Market
Partnerships, Collaborations & Agreements
May-2022: Sony Group Corporation entered into a partnership with Theta Labs, a leading decentralized video streaming platform. This partnership aimed to introduce 3D non-fungible token (NFT) assets. The NFTs would be crafted for the Sony Spatial Reality Display and would be developed for three-dimensional viewing.
Dec-2021: Autodesk entered into a collaboration with Capgemini, a business and technology transformation leader. This collaboration aimed to provide end-to-end Building Information Modeling (BIM) platforms and transformation programs.
Nov-2021: Stratasys entered into a partnership with ECCO, a Danish shoe manufacturer and retailer. This partnership aimed to innovate footwear manufacturing using 3D printing technology, which would boost automation and a more simplified development process.
Oct-2021: Hexagon came into a partnership with Stratasys, an American-Israeli manufacturer of 3D printers, software, and materials. Under this partnership, customers of Stratasys' ULTEM 9085 filaments would utilize Hexagon's Digimat material modeling software to predict the way printed parts would perform.
Jul-2021: Stratasys formed a partnership with Tata Technologies, a provider of services in engineering and design. This partnership aimed to integrate comprehensive capabilities & offerings of Stratasys in the polymer space with deep manufacturing domain knowledge and a strong presence of Tata Technologies in the manufacturing industry, providing end-to-end solutions from concept to prototyping to manufacturing organizations based out of India.
Product Launches & Product Expansion
Sep-2022: HP unveiled a new metal 3D printer. This printer would assist industries to shore up their supply chain along with scalable mass production component printing. This printer would be commercially available for mass production of high-quality 3D printed metal parts for users in medical, consumer goods, industrial, and automotive industries.
Apr-2022: FARO released End-To-End 3D Digital Reality Capture & Collaboration Platform. This platform would allow simple, fast & precise 3D Model Creation. Through FARO Sphere as its backbone, the new end-to-end 3D capture platform would deliver customers with leading ease of use, precise and speed. In addition, real-time data would capture validation, and remote collaboration would transform the way customers access, generate, and use 3D data models.
Oct-2021: Autodesk unveiled the latest version of its Netfabb 3D printing, design, and simulation platform. This platform is developed to offer customers a more refined experience, and update its tool pathing and simulation tools.
Jun-2021: Stratasys released two new PolyJet 3D printers, the Stratasys J35 Pro and the Stratasys J55 Prime, with the latest software solutions for research and packaging prototyping. The latest versatile J35 Pro 3D printer would accommodate everything from concept modeling to high-fidelity, fully functioning, and realistic models.
May-2021: Stratasys introduced three new 3D printers. These printers together would address a huge portion of the multi-billion-dollar market growth prospect in additive manufacturing of end-use parts. These systems would enhance the shift from conventional to additive manufacturing for low-to-mid-volume production applications underserved by conventional manufacturing ways.
Nov-2020: FARO launched a new Vantage Laser Tracker 6DoF Probe. The platform would deliver complete, large-volume 3D measurements up to 80 meters, substantially simplifying the procedure and decreasing inspection cycle times along with ensuring complete confidence in the results.
Jul-2020: ExOne released New Sand 3D Printing Network. This product is used in automotive, aerospace, agricultural, and other manufacturers, who can deploy it to tap the advantages of 3D printed sand molds & cores for high-value metal casting projects.
May-2020: Panasonic Corporation launched a new hybrid manufacturing method for mold cooling water channels. This method contains 3D printing, milling, and generative design. In addition, the company developed a conformal cooling system, which would minimize cooling time by 20% in comparison to the traditional drilled channels.
Mergers & Acquisition
Feb-2022: 3D Systems took over Titan Additive and Kumovis, polymer extrusion 3D printing companies. This acquisition aimed to expand its play in the industrial and medical markets. Through the acquisition of Titan, 3D Systems would have a larger play in sand casting, tooling, jigs and fixtures, and end-use parts applications such as air ducts, brackets, and structural components.
Feb-2022: HP acquired Choose Packaging, a plastic-free packaging development company. Through this acquisition, HP launched its Molded Fiber Advanced Tooling technology.
Oct-2021: 3D Systems acquired Volumetric Biotechnologies, a Houston-based biotech company. This acquisition aimed to use the Volumetric team's expertise to expand the applications of the 'Print to Perfusion' technology it would develop with United Therapeutics.
Aug-2021: Hexagon took over Wuhan Zhongguan Company. This acquisition aimed to enhance its offerings in the field of 3D data acquisition and would expand Hexagon's solution portfolio in the field of intelligent manufacturing.
Apr-2021: The ExOne Company took over Freshmade 3D, an Ohio-based startup. This acquisition aimed to strengthen ExOne's position as a provider of large-format 3D printed tooling for various industrial applications.
Geographical Expansion
Sep-2022: Autodesk expanded its geographical footprint by opening its UK Technology Centre in Birmingham. This center would assist people to solve the world's most innovative high-value manufacturing challenges. This center would house a variety of tools from subtractive to additive manufacturing (AM) and robotics and would benefit customers such as BMW and GKN Aerospace.
Feb-2021: 3D Systems expanded its geographical footprints in South Carolina headquarters through the addition of 100,000 square feet in space. The expansion is established as a vehicle that would bring to market his Stereolithography 3D printing technology.
Scope of the Study
Market Segments covered in the Report:
By Product
- 3D Display
- 3D Printing
- 3D Glasses
- 3D Camera
- 3D Imaging
- Others
By Application
- Military & Defense
- Media & Entertainment
- Automotive
- Industrial
- Healthcare
- Others
By Geography
- North America
- US
- Canada
- Mexico
- Rest of North America
- Europe
- Germany
- UK
- France
- Russia
- Spain
- Italy
- Rest of Europe
- Asia Pacific
- China
- Japan
- India
- South Korea
- Singapore
- Malaysia
- Rest of Asia Pacific
- LAMEA
- Brazil
- Argentina
- UAE
- Saudi Arabia
- South Africa
- Nigeria
- Rest of LAMEA
Companies Profiled
- 3D Systems Corporation
- Autodesk, Inc.
- Panasonic Corporation
- Sony Corporation
- FARO Technologies, Inc.
- Hewlett-Packard enterprise company (HP Development Company L.P.)
- The ExOne Company (Desktop Metal, Inc.)
- Hexagon AB
- Stratasys, Ltd.
- Vicon Motion System, Ltd.
Unique Offerings from KBV Research
- Exhaustive coverage
- Highest number of market tables and figures
- Subscription based model available
- Guaranteed best price
- Assured post sales research support with 10% customization free
Table of Contents
Chapter 1. Market Scope & Methodology
- 1.1 Market Definition
- 1.2 Objectives
- 1.3 Market Scope
- 1.4 Segmentation
- 1.4.1 Global 3D Technology Market, by Product
- 1.4.2 Global 3D Technology Market, by Application
- 1.4.3 Global 3D Technology Market, by Geography
- 1.5 Methodology for the research
Chapter 2. Market Overview
- 2.1 Introduction
- 2.1.1 Overview
- 2.1.1.1 Market Composition and Scenario
- 2.1.1 Overview
- 2.2 Key Factors Impacting the Market
- 2.2.1 Market Drivers
- 2.2.2 Market Restraints
Chapter 3. Competition Analysis - Global
- 3.1 KBV Cardinal Matrix
- 3.2 Recent Industry Wide Strategic Developments
- 3.2.1 Partnerships, Collaborations and Agreements
- 3.2.2 Product Launches and Product Expansions
- 3.2.3 Acquisition and Mergers
- 3.2.4 Geographical Expansion
- 3.3 Top Winning Strategies
- 3.3.1 Key Leading Strategies: Percentage Distribution (2018-2022)
- 3.3.2 Key Strategic Move: (Product Launches and Product Expansions: 2019, Jan - 2022, Sep) Leading Players
Chapter 4. Global 3D Technology Market by Product
- 4.1 Global 3D Display Market by Region
- 4.2 Global 3D Printing Market by Region
- 4.3 Global 3D Glasses Market by Region
- 4.4 Global 3D Camera Market by Region
- 4.5 Global 3D Imaging Market by Region
- 4.6 Global Others Market by Region
Chapter 5. Global 3D Technology Market by Application
- 5.1 Global Military & Defense Market by Region
- 5.2 Global Media & Entertainment Market by Region
- 5.3 Global Automotive Market by Region
- 5.4 Global Industrial Market by Region
- 5.5 Global Healthcare Market by Region
- 5.6 Global Others Market by Region
Chapter 6. Global 3D Technology Market by Region
- 6.1 North America 3D Technology Market
- 6.1.1 North America 3D Technology Market by Product
- 6.1.1.1 North America 3D Display Market by Country
- 6.1.1.2 North America 3D Printing Market by Country
- 6.1.1.3 North America 3D Glasses Market by Country
- 6.1.1.4 North America 3D Camera Market by Country
- 6.1.1.5 North America 3D Imaging Market by Country
- 6.1.1.6 North America Others Market by Country
- 6.1.2 North America 3D Technology Market by Application
- 6.1.2.1 North America Military & Defense Market by Country
- 6.1.2.2 North America Media & Entertainment Market by Country
- 6.1.2.3 North America Automotive Market by Country
- 6.1.2.4 North America Industrial Market by Country
- 6.1.2.5 North America Healthcare Market by Country
- 6.1.2.6 North America Others Market by Country
- 6.1.3 North America 3D Technology Market by Country
- 6.1.3.1 US 3D Technology Market
- 6.1.3.1.1 US 3D Technology Market by Product
- 6.1.3.1.2 US 3D Technology Market by Application
- 6.1.3.2 Canada 3D Technology Market
- 6.1.3.2.1 Canada 3D Technology Market by Product
- 6.1.3.2.2 Canada 3D Technology Market by Application
- 6.1.3.3 Mexico 3D Technology Market
- 6.1.3.3.1 Mexico 3D Technology Market by Product
- 6.1.3.3.2 Mexico 3D Technology Market by Application
- 6.1.3.4 Rest of North America 3D Technology Market
- 6.1.3.4.1 Rest of North America 3D Technology Market by Product
- 6.1.3.4.2 Rest of North America 3D Technology Market by Application
- 6.1.3.1 US 3D Technology Market
- 6.1.1 North America 3D Technology Market by Product
- 6.2 Europe 3D Technology Market
- 6.2.1 Europe 3D Technology Market by Product
- 6.2.1.1 Europe 3D Display Market by Country
- 6.2.1.2 Europe 3D Printing Market by Country
- 6.2.1.3 Europe 3D Glasses Market by Country
- 6.2.1.4 Europe 3D Camera Market by Country
- 6.2.1.5 Europe 3D Imaging Market by Country
- 6.2.1.6 Europe Others Market by Country
- 6.2.2 Europe 3D Technology Market by Application
- 6.2.2.1 Europe Military & Defense Market by Country
- 6.2.2.2 Europe Media & Entertainment Market by Country
- 6.2.2.3 Europe Automotive Market by Country
- 6.2.2.4 Europe Industrial Market by Country
- 6.2.2.5 Europe Healthcare Market by Country
- 6.2.2.6 Europe Others Market by Country
- 6.2.3 Europe 3D Technology Market by Country
- 6.2.3.1 Germany 3D Technology Market
- 6.2.3.1.1 Germany 3D Technology Market by Product
- 6.2.3.1.2 Germany 3D Technology Market by Application
- 6.2.3.2 UK 3D Technology Market
- 6.2.3.2.1 UK 3D Technology Market by Product
- 6.2.3.2.2 UK 3D Technology Market by Application
- 6.2.3.3 France 3D Technology Market
- 6.2.3.3.1 France 3D Technology Market by Product
- 6.2.3.3.2 France 3D Technology Market by Application
- 6.2.3.4 Russia 3D Technology Market
- 6.2.3.4.1 Russia 3D Technology Market by Product
- 6.2.3.4.2 Russia 3D Technology Market by Application
- 6.2.3.5 Spain 3D Technology Market
- 6.2.3.5.1 Spain 3D Technology Market by Product
- 6.2.3.5.2 Spain 3D Technology Market by Application
- 6.2.3.6 Italy 3D Technology Market
- 6.2.3.6.1 Italy 3D Technology Market by Product
- 6.2.3.6.2 Italy 3D Technology Market by Application
- 6.2.3.7 Rest of Europe 3D Technology Market
- 6.2.3.7.1 Rest of Europe 3D Technology Market by Product
- 6.2.3.7.2 Rest of Europe 3D Technology Market by Application
- 6.2.3.1 Germany 3D Technology Market
- 6.2.1 Europe 3D Technology Market by Product
- 6.3 Asia Pacific 3D Technology Market
- 6.3.1 Asia Pacific 3D Technology Market by Product
- 6.3.1.1 Asia Pacific 3D Display Market by Country
- 6.3.1.2 Asia Pacific 3D Printing Market by Country
- 6.3.1.3 Asia Pacific 3D Glasses Market by Country
- 6.3.1.4 Asia Pacific 3D Camera Market by Country
- 6.3.1.5 Asia Pacific 3D Imaging Market by Country
- 6.3.1.6 Asia Pacific Others Market by Country
- 6.3.2 Asia Pacific 3D Technology Market by Application
- 6.3.2.1 Asia Pacific Military & Defense Market by Country
- 6.3.2.2 Asia Pacific Media & Entertainment Market by Country
- 6.3.2.3 Asia Pacific Automotive Market by Country
- 6.3.2.4 Asia Pacific Industrial Market by Country
- 6.3.2.5 Asia Pacific Healthcare Market by Country
- 6.3.2.6 Asia Pacific Others Market by Country
- 6.3.3 Asia Pacific 3D Technology Market by Country
- 6.3.3.1 China 3D Technology Market
- 6.3.3.1.1 China 3D Technology Market by Product
- 6.3.3.1.2 China 3D Technology Market by Application
- 6.3.3.2 Japan 3D Technology Market
- 6.3.3.2.1 Japan 3D Technology Market by Product
- 6.3.3.2.2 Japan 3D Technology Market by Application
- 6.3.3.3 India 3D Technology Market
- 6.3.3.3.1 India 3D Technology Market by Product
- 6.3.3.3.2 India 3D Technology Market by Application
- 6.3.3.4 South Korea 3D Technology Market
- 6.3.3.4.1 South Korea 3D Technology Market by Product
- 6.3.3.4.2 South Korea 3D Technology Market by Application
- 6.3.3.5 Singapore 3D Technology Market
- 6.3.3.5.1 Singapore 3D Technology Market by Product
- 6.3.3.5.2 Singapore 3D Technology Market by Application
- 6.3.3.6 Malaysia 3D Technology Market
- 6.3.3.6.1 Malaysia 3D Technology Market by Product
- 6.3.3.6.2 Malaysia 3D Technology Market by Application
- 6.3.3.7 Rest of Asia Pacific 3D Technology Market
- 6.3.3.7.1 Rest of Asia Pacific 3D Technology Market by Product
- 6.3.3.7.2 Rest of Asia Pacific 3D Technology Market by Application
- 6.3.3.1 China 3D Technology Market
- 6.3.1 Asia Pacific 3D Technology Market by Product
- 6.4 LAMEA 3D Technology Market
- 6.4.1 LAMEA 3D Technology Market by Product
- 6.4.1.1 LAMEA 3D Display Market by Country
- 6.4.1.2 LAMEA 3D Printing Market by Country
- 6.4.1.3 LAMEA 3D Glasses Market by Country
- 6.4.1.4 LAMEA 3D Camera Market by Country
- 6.4.1.5 LAMEA 3D Imaging Market by Country
- 6.4.1.6 LAMEA Others Market by Country
- 6.4.2 LAMEA 3D Technology Market by Application
- 6.4.2.1 LAMEA Military & Defense Market by Country
- 6.4.2.2 LAMEA Media & Entertainment Market by Country
- 6.4.2.3 LAMEA Automotive Market by Country
- 6.4.2.4 LAMEA Industrial Market by Country
- 6.4.2.5 LAMEA Healthcare Market by Country
- 6.4.2.6 LAMEA Others Market by Country
- 6.4.3 LAMEA 3D Technology Market by Country
- 6.4.3.1 Brazil 3D Technology Market
- 6.4.3.1.1 Brazil 3D Technology Market by Product
- 6.4.3.1.2 Brazil 3D Technology Market by Application
- 6.4.3.2 Argentina 3D Technology Market
- 6.4.3.2.1 Argentina 3D Technology Market by Product
- 6.4.3.2.2 Argentina 3D Technology Market by Application
- 6.4.3.3 UAE 3D Technology Market
- 6.4.3.3.1 UAE 3D Technology Market by Product
- 6.4.3.3.2 UAE 3D Technology Market by Application
- 6.4.3.4 Saudi Arabia 3D Technology Market
- 6.4.3.4.1 Saudi Arabia 3D Technology Market by Product
- 6.4.3.4.2 Saudi Arabia 3D Technology Market by Application
- 6.4.3.5 South Africa 3D Technology Market
- 6.4.3.5.1 South Africa 3D Technology Market by Product
- 6.4.3.5.2 South Africa 3D Technology Market by Application
- 6.4.3.6 Nigeria 3D Technology Market
- 6.4.3.6.1 Nigeria 3D Technology Market by Product
- 6.4.3.6.2 Nigeria 3D Technology Market by Application
- 6.4.3.7 Rest of LAMEA 3D Technology Market
- 6.4.3.7.1 Rest of LAMEA 3D Technology Market by Product
- 6.4.3.7.2 Rest of LAMEA 3D Technology Market by Application
- 6.4.3.1 Brazil 3D Technology Market
- 6.4.1 LAMEA 3D Technology Market by Product
Chapter 7. Company Profiles
- 7.1 3D Systems Corporation
- 7.1.1 Company Overview
- 7.1.2 Financial Analysis
- 7.1.3 Segmental and Regional Analysis
- 7.1.4 Research & Development Expense
- 7.1.5 Recent strategies and developments:
- 7.1.5.1 Acquisition and Mergers:
- 7.1.5.2 Geographical Expansions:
- 7.1.6 SWOT Analysis
- 7.2 Autodesk, Inc.
- 7.2.1 Company Overview
- 7.2.2 Financial Analysis
- 7.2.3 Regional Analysis
- 7.2.4 Research & Development Expenses
- 7.2.5 Recent strategies and developments:
- 7.2.5.1 Partnerships, Collaborations, and Agreements:
- 7.2.5.2 Product Launches and Product Expansions:
- 7.2.5.3 Geographical Expansions:
- 7.2.6 SWOT Analysis
- 7.3 Panasonic Corporation
- 7.3.1 Company Overview
- 7.3.2 Financial Analysis
- 7.3.3 Segmental and Regional Analysis
- 7.3.4 Research & Development Expense
- 7.3.5 Recent strategies and developments:
- 7.3.5.1 Product Launches and Product Expansions:
- 7.3.6 SWOT Analysis
- 7.4 Sony Corporation
- 7.4.1 Company Overview
- 7.4.2 Financial Analysis
- 7.4.3 Segmental and Regional Analysis
- 7.4.4 Research & Development Expenses
- 7.4.5 Recent strategies and developments:
- 7.4.5.1 Partnerships, Collaborations, and Agreements:
- 7.4.6 SWOT Analysis
- 7.5 FARO Technologies, Inc.
- 7.5.1 Company Overview
- 7.5.2 Financial Analysis
- 7.5.3 Regional Analysis
- 7.5.4 Research & Development Expense
- 7.5.5 Recent strategies and developments:
- 7.5.5.1 Product Launches and Product Expansions:
- 7.5.5.2 Acquisition and Mergers:
- 7.5.6 SWOT Analysis
- 7.6 Hewlett Packard Enterprise Company (HP Development Company L.P.)
- 7.6.1 Company Overview
- 7.6.2 Financial Analysis
- 7.6.3 Segmental and Regional Analysis
- 7.6.4 Research & Development Expense
- 7.6.5 Recent strategies and developments:
- 7.6.5.1 Product Launches and Product Expansions:
- 7.6.5.2 Acquisition and Mergers:
- 7.6.5.3 Geographical Expansions:
- 7.6.6 SWOT Analysis
- 7.7 The ExOne company (Desktop Metal, Inc.)
- 7.7.1 Company Overview
- 7.7.2 Financial Analysis
- 7.7.3 Regional Analysis
- 7.7.4 Research & Development Expenses
- 7.7.5 Recent strategies and developments:
- 7.7.5.1 Partnerships, Collaborations, and Agreements:
- 7.7.5.2 Product Launches and Product Expansions:
- 7.7.5.3 Acquisition and Mergers:
- 7.8 Hexagon AB
- 7.8.1 Company Overview
- 7.8.2 Financial Analysis
- 7.8.3 Regional & Segmental Analysis
- 7.8.4 Research & Development Expenses
- 7.8.5 Recent strategies and developments:
- 7.8.5.1 Partnerships, Collaborations, and Agreements:
- 7.8.5.2 Acquisition and Mergers:
- 7.9 Stratasys, Ltd.
- 7.9.1 Company Overview
- 7.9.2 Recent strategies and developments:
- 7.9.2.1 Partnerships, Collaborations, and Agreements:
- 7.9.2.2 Product Launches and Product Expansions:
- 7.10. Vicon Motion System, Ltd.
- 7.10.1 Company Overview