|
|
市場調査レポート
商品コード
1126432
アプリケーションコンテナの世界市場規模、シェア、産業動向分析レポート:展開モデル別、組織規模別、業種別(通信・IT、ヘルスケア、BFSI、小売、政府、教育)、地域別展望と予測、2022年~2028年Global Application Container Market Size, Share & Industry Trends Analysis Report By Deployment Model, By Organization Size, By Vertical (Telecom & IT, Healthcare, BFSI, Retail, Government, Education), By Regional Outlook and Forecast, 2022 - 2028 |
||||||
|
|
|||||||


| アプリケーションコンテナの世界市場規模、シェア、産業動向分析レポート:展開モデル別、組織規模別、業種別(通信・IT、ヘルスケア、BFSI、小売、政府、教育)、地域別展望と予測、2022年~2028年 |
|
出版日: 2022年08月31日
発行: KBV Research
ページ情報: 英文 241 Pages
納期: 即納可能
|
- 全表示
- 概要
- 図表
- 目次
アプリケーションコンテナの世界市場規模は、2028年までに120億米ドルに達し、予測期間中にCAGR 33.1%で上昇すると予測されています。
ハイブリッドクラウドコンピューティングモデルは、クラウド環境の柔軟性を提供します。これらのシステム導入により、企業はプライベートな機密データを遠隔地のクラウドに保管することができます。企業は、アプリケーションコンテナ技術の利用により、セキュリティ、ネットワーク接続、顧客とのやり取り、エンドツーエンドのサービスレベルの監視など、コアスキルを向上させることができます。エンドユーザー企業は、運用コストを削減し、アプリケーションインフラのリソース利用を最大化することができます。
COVID-19インパクト分析
ITオペレーションは通常、「在宅勤務」の取り決めによって行われているため、ロックダウンはアプリケーション・コンテナ市場を混乱させることはありません。その結果、アプリケーション・コンテナは、IT分野において依然として高い需要があります。また、アプリケーションコンテナは、在宅勤務中の生産性やアプリケーション開発を向上させることが示されています。その結果、COVID-19の大流行時には、すべてのソフトウェア組織がアプリケーションコンテナを採用しました。IT業界では在宅勤務が普及しているため、ロックダウンは主にアプリケーションコンテナ業界にはほとんど影響を与えませんでした。
市場の成長要因
仮想マシンよりも普及が進むアプリケーションコンテナ技術
アプリケーションコンテナ技術は、仮想マシンと比較して多くの利点があるため、業界はより急速に成長すると予想されます。例えば、OSを搭載した仮想マシンは数ギガバイトの大きさになりますが、アプリケーションコンテナはわずか10メガバイトです。このため、仮想マシンとコンテナを同じサーバーで使用することができます。また、仮想マシンがオペレーティング・プラットフォームを起動し、ホストするアプリケーションの実行を開始するまでに数分かかるのに対し、アプリケーション・コンテナはすぐに起動できることも大きな利点です。
ビジネスの俊敏性と市場投入スピードの重要性が増している
ビジネスが拡大し、激化する競争に適応していくためには、連携が必要です。最先端の技術を導入し、最新のアプリケーションを作成・配布することで、初めて可能になるのです。アプリケーションコンテナは、テスト時間の短縮やテスト手順の簡素化により、アプリケーションの開発をスピードアップし、俊敏性を高めます。また、コンテナのオーケストレーションにより、仮想または物理インフラ、パブリック、プライベート、ハイブリッドクラウドなど、さまざまなコンテキストにおけるアプリケーションの展開が簡素化されます。
市場抑制要因
アプリケーションコンテナのスプロール化
コンテナによって制御不能な複数のプログラムインスタンスを実行すること、およびそれに伴うリソースの大量消費は、「コンテナスプロール」と呼ばれます。このような状況では、リソースの使用により、実用的なコンテナを実行するためのリソースが少なくなってしまいます。また、特定のホスト上で制御不能なコンテナの設定ミスや不適切な取り扱いが発生する可能性もあり、それらのリスクも高まる。コンテナ・スプロールにより、パブリッククラウド環境のコストが増加する可能性があります。大企業は、中小企業よりもコンテナ・スプロールの影響を受けやすいです。
導入モデルの展望
アプリケーションコンテナ市場は、導入モデルによって、オンプレミスとクラウドに分類されます。オンプレミスセグメントは、2021年のアプリケーションコンテナ市場で最も高い収益シェアを獲得しました。オンプレミスの展開が進んでいるため、高レベルの仮想化やハードウェアの制限からの相対的な分離など、多くのクラウドに似た特徴を示しています。オンプレミスとは、ハードウェアやソフトウェアなど、ローカルにホストされているITネットワーク要素を指します。パブリッククラウドや遠隔地のデータセンターでホストされているIT資産は、これとは対照的です。
組織規模の展望
アプリケーションコンテナ市場は、組織規模により、中小企業と大企業に分類されます。2021年のアプリケーションコンテナ市場では、中小企業(SMEs)セグメントがかなりの収益シェアを記録しました。それは、中小企業がアプリケーションコンテナ技術により、顧客との関係、セキュリティ、ネットワーク接続、エンドツーエンドのサービスレベルの監視など、本質的な能力をアップグレードするためです。アプリケーションコンテナは、エンドユーザー企業が運用コストを削減し、アプリケーションインフラのリソース利用を最大化することを可能にします。
業界別展望
アプリケーションコンテナ市場は、業界別では、テレコム&IT、政府、ヘルスケア、BFSI、小売、教育、その他に区分されます。2021年のアプリケーションコンテナ市場では、テレコム&IT分野が最も高い収益シェアを獲得しています。コンテナは、非常に重要なイネーブリングテクノロジーとして浮上しています。デジタル変革プロジェクトの一環として、多数の組織が主に、従来の手動ベースのIT業務を、テスト、インストール、ランタイムの手順を自動化できるソフトウェアに置き換えることに注力しています。
地域別の展望
地域別では、アプリケーションコンテナ市場は、北米、欧州、アジア太平洋、LAMEAで分析されます。北米地域は、2021年のアプリケーションコンテナ市場において最大の収益シェアを獲得しました。この地域における最先端のICTインフラの存在、技術プロバイダーによる継続的な研究開発努力、大手クラウドサービスプロバイダーによって構築された広大なクラウドネットワークなどの要因による。最先端のアナリティクスを展開するために必要なサポートインフラが十分に用意されていることや、上位のクラウドサービスプロバイダーが存在していることから、アプリケーションコンテナの市場は予測期間中も優位な傾向を維持すると考えられます。
市場参加者がとる主な戦略は、「パートナーシップ」です。カーディナルマトリックスで提示された分析に基づき、Google LLC、Microsoft Corporation、Amazon Web Services, Inc.がアプリケーションコンテナ市場における先駆者です。Joyent, Inc.、IBM Corporation、SAP SEなどの企業は、アプリケーションコンテナ市場における主要な革新者の一部です。
目次
第1章 市場の範囲と調査手法
- 市場の定義
- 目的
- 市場規模
- セグメンテーション
- アプリケーションコンテナの世界市場、デプロイメントモデル別
- アプリケーションコンテナの世界市場、組織規模別
- アプリケーションコンテナの世界市場、業界別
- アプリケーションコンテナの世界市場、地域別
- 調査手法
第2章 市場概要
- イントロダクション
- 概要説明
- 市場の構成とシナリオ
- 概要説明
- 市場に影響を与える主な要因
- 市場促進要因
- 市場の抑制要因
第3章 競合分析-世界
- KBVカーディナルマトリックス
- 最近の業界全体の戦略的展開
- パートナーシップ、コラボレーション、契約
- 製品上市と製品拡張
- 買収と合併
- トップ・ウィニング・ストラテジー
- 主要なリーディング戦略:割合の分布(2018-2022)
- 主要戦略的動き:(パートナーシップ、コラボレーション&アグリーメント:2018年、1月~2022年、8月)主要プレイヤー
第4章 アプリケーションコンテナの世界市場:デプロイメントモデル別
- オンプレミスの世界市場:地域別
- 世界のクラウド市場:地域別
第5章 アプリケーションコンテナの世界市場:組織規模別
- 世界の大企業市場:地域別
- 中小企業の世界市場:地域別
第6章 アプリケーションコンテナの世界市場:業界別
- テレコム&ITの世界市場:地域別
- ヘルスケアの世界市場:地域別
- BFSIの世界市場:地域別
- 小売業の世界市場:地域別
- 政府機関の世界市場:地域別
- 教育分野の世界市場:地域別
- 世界の地域別その他市場
第7章 アプリケーションコンテナの世界市場:地域別
- 北米
- 北米のアプリケーションコンテナの国別市場
- 米国
- カナダ
- メキシコ
- 北米の残りの地域
- 北米のアプリケーションコンテナの国別市場
- 欧州
- 欧州アプリケーションコンテナ市場:国別
- ドイツ
- 英国
- フランス
- ロシア
- スペイン
- イタリア
- その他欧州
- 欧州アプリケーションコンテナ市場:国別
- アジア太平洋地域
- アジア太平洋地域のアプリケーションコンテナ市場:国別
- 中国
- 日本
- インド
- 韓国
- シンガポール
- マレーシア
- その他アジア太平洋地域
- アジア太平洋地域のアプリケーションコンテナ市場:国別
- LAMEA
- LAMEAアプリケーションコンテナ市場:国別
- ブラジル
- アルゼンチン
- UAE
- サウジアラビア
- 南アフリカ
- ナイジェリア
- LAMEAの残りの地域
- LAMEAアプリケーションコンテナ市場:国別
第8章 企業プロファイル
- Amazon Web Services, Inc.(Amazon.com, Inc.)
- Google LLC
- IBM Corporation
- SAP SE
- Microsoft Corporation
- Broadcom, Inc.(CA Technologies, Inc.)
- Rancher Labs, Inc.(SUSE SE)
- Joyent, Inc.(Samsung Group)
- Docker, Inc.(Mirantis)
- D2iQ
LIST OF TABLES
- TABLE 1 Global Application Container Market, 2018 - 2021, USD Million
- TABLE 2 Global Application Container Market, 2022 - 2028, USD Million
- TABLE 3 Partnerships, Collaborations and Agreements- Application Container Market
- TABLE 4 Product Launches And Product Expansions- Application Container Market
- TABLE 5 Acquisition and Mergers- Application Container Market
- TABLE 6 Global Application Container Market by Deployment Model, 2018 - 2021, USD Million
- TABLE 7 Global Application Container Market by Deployment Model, 2022 - 2028, USD Million
- TABLE 8 Global On-premise Market by Region, 2018 - 2021, USD Million
- TABLE 9 Global On-premise Market by Region, 2022 - 2028, USD Million
- TABLE 10 Global Cloud Market by Region, 2018 - 2021, USD Million
- TABLE 11 Global Cloud Market by Region, 2022 - 2028, USD Million
- TABLE 12 Global Application Container Market by Organization Size, 2018 - 2021, USD Million
- TABLE 13 Global Application Container Market by Organization Size, 2022 - 2028, USD Million
- TABLE 14 Global Large Enterprises Market by Region, 2018 - 2021, USD Million
- TABLE 15 Global Large Enterprises Market by Region, 2022 - 2028, USD Million
- TABLE 16 Global Small- & Medium-sized Enterprises (SMEs) Market by Region, 2018 - 2021, USD Million
- TABLE 17 Global Small- & Medium-sized Enterprises (SMEs) Market by Region, 2022 - 2028, USD Million
- TABLE 18 Global Application Container Market by Vertical, 2018 - 2021, USD Million
- TABLE 19 Global Application Container Market by Vertical, 2022 - 2028, USD Million
- TABLE 20 Global Telecom & IT Market by Region, 2018 - 2021, USD Million
- TABLE 21 Global Telecom & IT Market by Region, 2022 - 2028, USD Million
- TABLE 22 Global Healthcare Market by Region, 2018 - 2021, USD Million
- TABLE 23 Global Healthcare Market by Region, 2022 - 2028, USD Million
- TABLE 24 Global BFSI Market by Region, 2018 - 2021, USD Million
- TABLE 25 Global BFSI Market by Region, 2022 - 2028, USD Million
- TABLE 26 Global Retail Market by Region, 2018 - 2021, USD Million
- TABLE 27 Global Retail Market by Region, 2022 - 2028, USD Million
- TABLE 28 Global Government Market by Region, 2018 - 2021, USD Million
- TABLE 29 Global Government Market by Region, 2022 - 2028, USD Million
- TABLE 30 Global Education Market by Region, 2018 - 2021, USD Million
- TABLE 31 Global Education Market by Region, 2022 - 2028, USD Million
- TABLE 32 Global Others Market by Region, 2018 - 2021, USD Million
- TABLE 33 Global Others Market by Region, 2022 - 2028, USD Million
- TABLE 34 Global Application Container Market by Region, 2018 - 2021, USD Million
- TABLE 35 Global Application Container Market by Region, 2022 - 2028, USD Million
- TABLE 36 North America Application Container Market, 2018 - 2021, USD Million
- TABLE 37 North America Application Container Market, 2022 - 2028, USD Million
- TABLE 38 North America Application Container Market by Deployment Model, 2018 - 2021, USD Million
- TABLE 39 North America Application Container Market by Deployment Model, 2022 - 2028, USD Million
- TABLE 40 North America On-premise Market by Country, 2018 - 2021, USD Million
- TABLE 41 North America On-premise Market by Country, 2022 - 2028, USD Million
- TABLE 42 North America Cloud Market by Country, 2018 - 2021, USD Million
- TABLE 43 North America Cloud Market by Country, 2022 - 2028, USD Million
- TABLE 44 North America Application Container Market by Organization Size, 2018 - 2021, USD Million
- TABLE 45 North America Application Container Market by Organization Size, 2022 - 2028, USD Million
- TABLE 46 North America Large Enterprises Market by Country, 2018 - 2021, USD Million
- TABLE 47 North America Large Enterprises Market by Country, 2022 - 2028, USD Million
- TABLE 48 North America Small- & Medium-sized Enterprises (SMEs) Market by Country, 2018 - 2021, USD Million
- TABLE 49 North America Small- & Medium-sized Enterprises (SMEs) Market by Country, 2022 - 2028, USD Million
- TABLE 50 North America Application Container Market by Vertical, 2018 - 2021, USD Million
- TABLE 51 North America Application Container Market by Vertical, 2022 - 2028, USD Million
- TABLE 52 North America Telecom & IT Market by Country, 2018 - 2021, USD Million
- TABLE 53 North America Telecom & IT Market by Country, 2022 - 2028, USD Million
- TABLE 54 North America Healthcare Market by Country, 2018 - 2021, USD Million
- TABLE 55 North America Healthcare Market by Country, 2022 - 2028, USD Million
- TABLE 56 North America BFSI Market by Country, 2018 - 2021, USD Million
- TABLE 57 North America BFSI Market by Country, 2022 - 2028, USD Million
- TABLE 58 North America Retail Market by Country, 2018 - 2021, USD Million
- TABLE 59 North America Retail Market by Country, 2022 - 2028, USD Million
- TABLE 60 North America Government Market by Country, 2018 - 2021, USD Million
- TABLE 61 North America Government Market by Country, 2022 - 2028, USD Million
- TABLE 62 North America Education Market by Country, 2018 - 2021, USD Million
- TABLE 63 North America Education Market by Country, 2022 - 2028, USD Million
- TABLE 64 North America Others Market by Country, 2018 - 2021, USD Million
- TABLE 65 North America Others Market by Country, 2022 - 2028, USD Million
- TABLE 66 North America Application Container Market by Country, 2018 - 2021, USD Million
- TABLE 67 North America Application Container Market by Country, 2022 - 2028, USD Million
- TABLE 68 US Application Container Market, 2018 - 2021, USD Million
- TABLE 69 US Application Container Market, 2022 - 2028, USD Million
- TABLE 70 US Application Container Market by Deployment Model, 2018 - 2021, USD Million
- TABLE 71 US Application Container Market by Deployment Model, 2022 - 2028, USD Million
- TABLE 72 US Application Container Market by Organization Size, 2018 - 2021, USD Million
- TABLE 73 US Application Container Market by Organization Size, 2022 - 2028, USD Million
- TABLE 74 US Application Container Market by Vertical, 2018 - 2021, USD Million
- TABLE 75 US Application Container Market by Vertical, 2022 - 2028, USD Million
- TABLE 76 Canada Application Container Market, 2018 - 2021, USD Million
- TABLE 77 Canada Application Container Market, 2022 - 2028, USD Million
- TABLE 78 Canada Application Container Market by Deployment Model, 2018 - 2021, USD Million
- TABLE 79 Canada Application Container Market by Deployment Model, 2022 - 2028, USD Million
- TABLE 80 Canada Application Container Market by Organization Size, 2018 - 2021, USD Million
- TABLE 81 Canada Application Container Market by Organization Size, 2022 - 2028, USD Million
- TABLE 82 Canada Application Container Market by Vertical, 2018 - 2021, USD Million
- TABLE 83 Canada Application Container Market by Vertical, 2022 - 2028, USD Million
- TABLE 84 Mexico Application Container Market, 2018 - 2021, USD Million
- TABLE 85 Mexico Application Container Market, 2022 - 2028, USD Million
- TABLE 86 Mexico Application Container Market by Deployment Model, 2018 - 2021, USD Million
- TABLE 87 Mexico Application Container Market by Deployment Model, 2022 - 2028, USD Million
- TABLE 88 Mexico Application Container Market by Organization Size, 2018 - 2021, USD Million
- TABLE 89 Mexico Application Container Market by Organization Size, 2022 - 2028, USD Million
- TABLE 90 Mexico Application Container Market by Vertical, 2018 - 2021, USD Million
- TABLE 91 Mexico Application Container Market by Vertical, 2022 - 2028, USD Million
- TABLE 92 Rest of North America Application Container Market, 2018 - 2021, USD Million
- TABLE 93 Rest of North America Application Container Market, 2022 - 2028, USD Million
- TABLE 94 Rest of North America Application Container Market by Deployment Model, 2018 - 2021, USD Million
- TABLE 95 Rest of North America Application Container Market by Deployment Model, 2022 - 2028, USD Million
- TABLE 96 Rest of North America Application Container Market by Organization Size, 2018 - 2021, USD Million
- TABLE 97 Rest of North America Application Container Market by Organization Size, 2022 - 2028, USD Million
- TABLE 98 Rest of North America Application Container Market by Vertical, 2018 - 2021, USD Million
- TABLE 99 Rest of North America Application Container Market by Vertical, 2022 - 2028, USD Million
- TABLE 100 Europe Application Container Market, 2018 - 2021, USD Million
- TABLE 101 Europe Application Container Market, 2022 - 2028, USD Million
- TABLE 102 Europe Application Container Market by Deployment Model, 2018 - 2021, USD Million
- TABLE 103 Europe Application Container Market by Deployment Model, 2022 - 2028, USD Million
- TABLE 104 Europe On-premise Market by Country, 2018 - 2021, USD Million
- TABLE 105 Europe On-premise Market by Country, 2022 - 2028, USD Million
- TABLE 106 Europe Cloud Market by Country, 2018 - 2021, USD Million
- TABLE 107 Europe Cloud Market by Country, 2022 - 2028, USD Million
- TABLE 108 Europe Application Container Market by Organization Size, 2018 - 2021, USD Million
- TABLE 109 Europe Application Container Market by Organization Size, 2022 - 2028, USD Million
- TABLE 110 Europe Large Enterprises Market by Country, 2018 - 2021, USD Million
- TABLE 111 Europe Large Enterprises Market by Country, 2022 - 2028, USD Million
- TABLE 112 Europe Small- & Medium-sized Enterprises (SMEs) Market by Country, 2018 - 2021, USD Million
- TABLE 113 Europe Small- & Medium-sized Enterprises (SMEs) Market by Country, 2022 - 2028, USD Million
- TABLE 114 Europe Application Container Market by Vertical, 2018 - 2021, USD Million
- TABLE 115 Europe Application Container Market by Vertical, 2022 - 2028, USD Million
- TABLE 116 Europe Telecom & IT Market by Country, 2018 - 2021, USD Million
- TABLE 117 Europe Telecom & IT Market by Country, 2022 - 2028, USD Million
- TABLE 118 Europe Healthcare Market by Country, 2018 - 2021, USD Million
- TABLE 119 Europe Healthcare Market by Country, 2022 - 2028, USD Million
- TABLE 120 Europe BFSI Market by Country, 2018 - 2021, USD Million
- TABLE 121 Europe BFSI Market by Country, 2022 - 2028, USD Million
- TABLE 122 Europe Retail Market by Country, 2018 - 2021, USD Million
- TABLE 123 Europe Retail Market by Country, 2022 - 2028, USD Million
- TABLE 124 Europe Government Market by Country, 2018 - 2021, USD Million
- TABLE 125 Europe Government Market by Country, 2022 - 2028, USD Million
- TABLE 126 Europe Education Market by Country, 2018 - 2021, USD Million
- TABLE 127 Europe Education Market by Country, 2022 - 2028, USD Million
- TABLE 128 Europe Others Market by Country, 2018 - 2021, USD Million
- TABLE 129 Europe Others Market by Country, 2022 - 2028, USD Million
- TABLE 130 Europe Application Container Market by Country, 2018 - 2021, USD Million
- TABLE 131 Europe Application Container Market by Country, 2022 - 2028, USD Million
- TABLE 132 Germany Application Container Market, 2018 - 2021, USD Million
- TABLE 133 Germany Application Container Market, 2022 - 2028, USD Million
- TABLE 134 Germany Application Container Market by Deployment Model, 2018 - 2021, USD Million
- TABLE 135 Germany Application Container Market by Deployment Model, 2022 - 2028, USD Million
- TABLE 136 Germany Application Container Market by Organization Size, 2018 - 2021, USD Million
- TABLE 137 Germany Application Container Market by Organization Size, 2022 - 2028, USD Million
- TABLE 138 Germany Application Container Market by Vertical, 2018 - 2021, USD Million
- TABLE 139 Germany Application Container Market by Vertical, 2022 - 2028, USD Million
- TABLE 140 UK Application Container Market, 2018 - 2021, USD Million
- TABLE 141 UK Application Container Market, 2022 - 2028, USD Million
- TABLE 142 UK Application Container Market by Deployment Model, 2018 - 2021, USD Million
- TABLE 143 UK Application Container Market by Deployment Model, 2022 - 2028, USD Million
- TABLE 144 UK Application Container Market by Organization Size, 2018 - 2021, USD Million
- TABLE 145 UK Application Container Market by Organization Size, 2022 - 2028, USD Million
- TABLE 146 UK Application Container Market by Vertical, 2018 - 2021, USD Million
- TABLE 147 UK Application Container Market by Vertical, 2022 - 2028, USD Million
- TABLE 148 France Application Container Market, 2018 - 2021, USD Million
- TABLE 149 France Application Container Market, 2022 - 2028, USD Million
- TABLE 150 France Application Container Market by Deployment Model, 2018 - 2021, USD Million
- TABLE 151 France Application Container Market by Deployment Model, 2022 - 2028, USD Million
- TABLE 152 France Application Container Market by Organization Size, 2018 - 2021, USD Million
- TABLE 153 France Application Container Market by Organization Size, 2022 - 2028, USD Million
- TABLE 154 France Application Container Market by Vertical, 2018 - 2021, USD Million
- TABLE 155 France Application Container Market by Vertical, 2022 - 2028, USD Million
- TABLE 156 Russia Application Container Market, 2018 - 2021, USD Million
- TABLE 157 Russia Application Container Market, 2022 - 2028, USD Million
- TABLE 158 Russia Application Container Market by Deployment Model, 2018 - 2021, USD Million
- TABLE 159 Russia Application Container Market by Deployment Model, 2022 - 2028, USD Million
- TABLE 160 Russia Application Container Market by Organization Size, 2018 - 2021, USD Million
- TABLE 161 Russia Application Container Market by Organization Size, 2022 - 2028, USD Million
- TABLE 162 Russia Application Container Market by Vertical, 2018 - 2021, USD Million
- TABLE 163 Russia Application Container Market by Vertical, 2022 - 2028, USD Million
- TABLE 164 Spain Application Container Market, 2018 - 2021, USD Million
- TABLE 165 Spain Application Container Market, 2022 - 2028, USD Million
- TABLE 166 Spain Application Container Market by Deployment Model, 2018 - 2021, USD Million
- TABLE 167 Spain Application Container Market by Deployment Model, 2022 - 2028, USD Million
- TABLE 168 Spain Application Container Market by Organization Size, 2018 - 2021, USD Million
- TABLE 169 Spain Application Container Market by Organization Size, 2022 - 2028, USD Million
- TABLE 170 Spain Application Container Market by Vertical, 2018 - 2021, USD Million
- TABLE 171 Spain Application Container Market by Vertical, 2022 - 2028, USD Million
- TABLE 172 Italy Application Container Market, 2018 - 2021, USD Million
- TABLE 173 Italy Application Container Market, 2022 - 2028, USD Million
- TABLE 174 Italy Application Container Market by Deployment Model, 2018 - 2021, USD Million
- TABLE 175 Italy Application Container Market by Deployment Model, 2022 - 2028, USD Million
- TABLE 176 Italy Application Container Market by Organization Size, 2018 - 2021, USD Million
- TABLE 177 Italy Application Container Market by Organization Size, 2022 - 2028, USD Million
- TABLE 178 Italy Application Container Market by Vertical, 2018 - 2021, USD Million
- TABLE 179 Italy Application Container Market by Vertical, 2022 - 2028, USD Million
- TABLE 180 Rest of Europe Application Container Market, 2018 - 2021, USD Million
- TABLE 181 Rest of Europe Application Container Market, 2022 - 2028, USD Million
- TABLE 182 Rest of Europe Application Container Market by Deployment Model, 2018 - 2021, USD Million
- TABLE 183 Rest of Europe Application Container Market by Deployment Model, 2022 - 2028, USD Million
- TABLE 184 Rest of Europe Application Container Market by Organization Size, 2018 - 2021, USD Million
- TABLE 185 Rest of Europe Application Container Market by Organization Size, 2022 - 2028, USD Million
- TABLE 186 Rest of Europe Application Container Market by Vertical, 2018 - 2021, USD Million
- TABLE 187 Rest of Europe Application Container Market by Vertical, 2022 - 2028, USD Million
- TABLE 188 Asia Pacific Application Container Market, 2018 - 2021, USD Million
- TABLE 189 Asia Pacific Application Container Market, 2022 - 2028, USD Million
- TABLE 190 Asia Pacific Application Container Market by Deployment Model, 2018 - 2021, USD Million
- TABLE 191 Asia Pacific Application Container Market by Deployment Model, 2022 - 2028, USD Million
- TABLE 192 Asia Pacific On-premise Market by Country, 2018 - 2021, USD Million
- TABLE 193 Asia Pacific On-premise Market by Country, 2022 - 2028, USD Million
- TABLE 194 Asia Pacific Cloud Market by Country, 2018 - 2021, USD Million
- TABLE 195 Asia Pacific Cloud Market by Country, 2022 - 2028, USD Million
- TABLE 196 Asia Pacific Application Container Market by Organization Size, 2018 - 2021, USD Million
- TABLE 197 Asia Pacific Application Container Market by Organization Size, 2022 - 2028, USD Million
- TABLE 198 Asia Pacific Large Enterprises Market by Country, 2018 - 2021, USD Million
- TABLE 199 Asia Pacific Large Enterprises Market by Country, 2022 - 2028, USD Million
- TABLE 200 Asia Pacific Small- & Medium-sized Enterprises (SMEs) Market by Country, 2018 - 2021, USD Million
- TABLE 201 Asia Pacific Small- & Medium-sized Enterprises (SMEs) Market by Country, 2022 - 2028, USD Million
- TABLE 202 Asia Pacific Application Container Market by Vertical, 2018 - 2021, USD Million
- TABLE 203 Asia Pacific Application Container Market by Vertical, 2022 - 2028, USD Million
- TABLE 204 Asia Pacific Telecom & IT Market by Country, 2018 - 2021, USD Million
- TABLE 205 Asia Pacific Telecom & IT Market by Country, 2022 - 2028, USD Million
- TABLE 206 Asia Pacific Healthcare Market by Country, 2018 - 2021, USD Million
- TABLE 207 Asia Pacific Healthcare Market by Country, 2022 - 2028, USD Million
- TABLE 208 Asia Pacific BFSI Market by Country, 2018 - 2021, USD Million
- TABLE 209 Asia Pacific BFSI Market by Country, 2022 - 2028, USD Million
- TABLE 210 Asia Pacific Retail Market by Country, 2018 - 2021, USD Million
- TABLE 211 Asia Pacific Retail Market by Country, 2022 - 2028, USD Million
- TABLE 212 Asia Pacific Government Market by Country, 2018 - 2021, USD Million
- TABLE 213 Asia Pacific Government Market by Country, 2022 - 2028, USD Million
- TABLE 214 Asia Pacific Education Market by Country, 2018 - 2021, USD Million
- TABLE 215 Asia Pacific Education Market by Country, 2022 - 2028, USD Million
- TABLE 216 Asia Pacific Others Market by Country, 2018 - 2021, USD Million
- TABLE 217 Asia Pacific Others Market by Country, 2022 - 2028, USD Million
- TABLE 218 Asia Pacific Application Container Market by Country, 2018 - 2021, USD Million
- TABLE 219 Asia Pacific Application Container Market by Country, 2022 - 2028, USD Million
- TABLE 220 China Application Container Market, 2018 - 2021, USD Million
- TABLE 221 China Application Container Market, 2022 - 2028, USD Million
- TABLE 222 China Application Container Market by Deployment Model, 2018 - 2021, USD Million
- TABLE 223 China Application Container Market by Deployment Model, 2022 - 2028, USD Million
- TABLE 224 China Application Container Market by Organization Size, 2018 - 2021, USD Million
- TABLE 225 China Application Container Market by Organization Size, 2022 - 2028, USD Million
- TABLE 226 China Application Container Market by Vertical, 2018 - 2021, USD Million
- TABLE 227 China Application Container Market by Vertical, 2022 - 2028, USD Million
- TABLE 228 Japan Application Container Market, 2018 - 2021, USD Million
- TABLE 229 Japan Application Container Market, 2022 - 2028, USD Million
- TABLE 230 Japan Application Container Market by Deployment Model, 2018 - 2021, USD Million
- TABLE 231 Japan Application Container Market by Deployment Model, 2022 - 2028, USD Million
- TABLE 232 Japan Application Container Market by Organization Size, 2018 - 2021, USD Million
- TABLE 233 Japan Application Container Market by Organization Size, 2022 - 2028, USD Million
- TABLE 234 Japan Application Container Market by Vertical, 2018 - 2021, USD Million
- TABLE 235 Japan Application Container Market by Vertical, 2022 - 2028, USD Million
- TABLE 236 India Application Container Market, 2018 - 2021, USD Million
- TABLE 237 India Application Container Market, 2022 - 2028, USD Million
- TABLE 238 India Application Container Market by Deployment Model, 2018 - 2021, USD Million
- TABLE 239 India Application Container Market by Deployment Model, 2022 - 2028, USD Million
- TABLE 240 India Application Container Market by Organization Size, 2018 - 2021, USD Million
- TABLE 241 India Application Container Market by Organization Size, 2022 - 2028, USD Million
- TABLE 242 India Application Container Market by Vertical, 2018 - 2021, USD Million
- TABLE 243 India Application Container Market by Vertical, 2022 - 2028, USD Million
- TABLE 244 South Korea Application Container Market, 2018 - 2021, USD Million
- TABLE 245 South Korea Application Container Market, 2022 - 2028, USD Million
- TABLE 246 South Korea Application Container Market by Deployment Model, 2018 - 2021, USD Million
- TABLE 247 South Korea Application Container Market by Deployment Model, 2022 - 2028, USD Million
- TABLE 248 South Korea Application Container Market by Organization Size, 2018 - 2021, USD Million
- TABLE 249 South Korea Application Container Market by Organization Size, 2022 - 2028, USD Million
- TABLE 250 South Korea Application Container Market by Vertical, 2018 - 2021, USD Million
- TABLE 251 South Korea Application Container Market by Vertical, 2022 - 2028, USD Million
- TABLE 252 Singapore Application Container Market, 2018 - 2021, USD Million
- TABLE 253 Singapore Application Container Market, 2022 - 2028, USD Million
- TABLE 254 Singapore Application Container Market by Deployment Model, 2018 - 2021, USD Million
- TABLE 255 Singapore Application Container Market by Deployment Model, 2022 - 2028, USD Million
- TABLE 256 Singapore Application Container Market by Organization Size, 2018 - 2021, USD Million
- TABLE 257 Singapore Application Container Market by Organization Size, 2022 - 2028, USD Million
- TABLE 258 Singapore Application Container Market by Vertical, 2018 - 2021, USD Million
- TABLE 259 Singapore Application Container Market by Vertical, 2022 - 2028, USD Million
- TABLE 260 Malaysia Application Container Market, 2018 - 2021, USD Million
- TABLE 261 Malaysia Application Container Market, 2022 - 2028, USD Million
- TABLE 262 Malaysia Application Container Market by Deployment Model, 2018 - 2021, USD Million
- TABLE 263 Malaysia Application Container Market by Deployment Model, 2022 - 2028, USD Million
- TABLE 264 Malaysia Application Container Market by Organization Size, 2018 - 2021, USD Million
- TABLE 265 Malaysia Application Container Market by Organization Size, 2022 - 2028, USD Million
- TABLE 266 Malaysia Application Container Market by Vertical, 2018 - 2021, USD Million
- TABLE 267 Malaysia Application Container Market by Vertical, 2022 - 2028, USD Million
- TABLE 268 Rest of Asia Pacific Application Container Market, 2018 - 2021, USD Million
- TABLE 269 Rest of Asia Pacific Application Container Market, 2022 - 2028, USD Million
- TABLE 270 Rest of Asia Pacific Application Container Market by Deployment Model, 2018 - 2021, USD Million
- TABLE 271 Rest of Asia Pacific Application Container Market by Deployment Model, 2022 - 2028, USD Million
- TABLE 272 Rest of Asia Pacific Application Container Market by Organization Size, 2018 - 2021, USD Million
- TABLE 273 Rest of Asia Pacific Application Container Market by Organization Size, 2022 - 2028, USD Million
- TABLE 274 Rest of Asia Pacific Application Container Market by Vertical, 2018 - 2021, USD Million
- TABLE 275 Rest of Asia Pacific Application Container Market by Vertical, 2022 - 2028, USD Million
- TABLE 276 LAMEA Application Container Market, 2018 - 2021, USD Million
- TABLE 277 LAMEA Application Container Market, 2022 - 2028, USD Million
- TABLE 278 LAMEA Application Container Market by Deployment Model, 2018 - 2021, USD Million
- TABLE 279 LAMEA Application Container Market by Deployment Model, 2022 - 2028, USD Million
- TABLE 280 LAMEA On-premise Market by Country, 2018 - 2021, USD Million
- TABLE 281 LAMEA On-premise Market by Country, 2022 - 2028, USD Million
- TABLE 282 LAMEA Cloud Market by Country, 2018 - 2021, USD Million
- TABLE 283 LAMEA Cloud Market by Country, 2022 - 2028, USD Million
- TABLE 284 LAMEA Application Container Market by Organization Size, 2018 - 2021, USD Million
- TABLE 285 LAMEA Application Container Market by Organization Size, 2022 - 2028, USD Million
- TABLE 286 LAMEA Large Enterprises Market by Country, 2018 - 2021, USD Million
- TABLE 287 LAMEA Large Enterprises Market by Country, 2022 - 2028, USD Million
- TABLE 288 LAMEA Small- & Medium-sized Enterprises (SMEs) Market by Country, 2018 - 2021, USD Million
- TABLE 289 LAMEA Small- & Medium-sized Enterprises (SMEs) Market by Country, 2022 - 2028, USD Million
- TABLE 290 LAMEA Application Container Market by Vertical, 2018 - 2021, USD Million
- TABLE 291 LAMEA Application Container Market by Vertical, 2022 - 2028, USD Million
- TABLE 292 LAMEA Telecom & IT Market by Country, 2018 - 2021, USD Million
- TABLE 293 LAMEA Telecom & IT Market by Country, 2022 - 2028, USD Million
- TABLE 294 LAMEA Healthcare Market by Country, 2018 - 2021, USD Million
- TABLE 295 LAMEA Healthcare Market by Country, 2022 - 2028, USD Million
- TABLE 296 LAMEA BFSI Market by Country, 2018 - 2021, USD Million
- TABLE 297 LAMEA BFSI Market by Country, 2022 - 2028, USD Million
- TABLE 298 LAMEA Retail Market by Country, 2018 - 2021, USD Million
- TABLE 299 LAMEA Retail Market by Country, 2022 - 2028, USD Million
- TABLE 300 LAMEA Government Market by Country, 2018 - 2021, USD Million
- TABLE 301 LAMEA Government Market by Country, 2022 - 2028, USD Million
- TABLE 302 LAMEA Education Market by Country, 2018 - 2021, USD Million
- TABLE 303 LAMEA Education Market by Country, 2022 - 2028, USD Million
- TABLE 304 LAMEA Others Market by Country, 2018 - 2021, USD Million
- TABLE 305 LAMEA Others Market by Country, 2022 - 2028, USD Million
- TABLE 306 LAMEA Application Container Market by Country, 2018 - 2021, USD Million
- TABLE 307 LAMEA Application Container Market by Country, 2022 - 2028, USD Million
- TABLE 308 Brazil Application Container Market, 2018 - 2021, USD Million
- TABLE 309 Brazil Application Container Market, 2022 - 2028, USD Million
- TABLE 310 Brazil Application Container Market by Deployment Model, 2018 - 2021, USD Million
- TABLE 311 Brazil Application Container Market by Deployment Model, 2022 - 2028, USD Million
- TABLE 312 Brazil Application Container Market by Organization Size, 2018 - 2021, USD Million
- TABLE 313 Brazil Application Container Market by Organization Size, 2022 - 2028, USD Million
- TABLE 314 Brazil Application Container Market by Vertical, 2018 - 2021, USD Million
- TABLE 315 Brazil Application Container Market by Vertical, 2022 - 2028, USD Million
- TABLE 316 Argentina Application Container Market, 2018 - 2021, USD Million
- TABLE 317 Argentina Application Container Market, 2022 - 2028, USD Million
- TABLE 318 Argentina Application Container Market by Deployment Model, 2018 - 2021, USD Million
- TABLE 319 Argentina Application Container Market by Deployment Model, 2022 - 2028, USD Million
- TABLE 320 Argentina Application Container Market by Organization Size, 2018 - 2021, USD Million
- TABLE 321 Argentina Application Container Market by Organization Size, 2022 - 2028, USD Million
- TABLE 322 Argentina Application Container Market by Vertical, 2018 - 2021, USD Million
- TABLE 323 Argentina Application Container Market by Vertical, 2022 - 2028, USD Million
- TABLE 324 UAE Application Container Market, 2018 - 2021, USD Million
- TABLE 325 UAE Application Container Market, 2022 - 2028, USD Million
- TABLE 326 UAE Application Container Market by Deployment Model, 2018 - 2021, USD Million
- TABLE 327 UAE Application Container Market by Deployment Model, 2022 - 2028, USD Million
- TABLE 328 UAE Application Container Market by Organization Size, 2018 - 2021, USD Million
- TABLE 329 UAE Application Container Market by Organization Size, 2022 - 2028, USD Million
- TABLE 330 UAE Application Container Market by Vertical, 2018 - 2021, USD Million
- TABLE 331 UAE Application Container Market by Vertical, 2022 - 2028, USD Million
- TABLE 332 Saudi Arabia Application Container Market, 2018 - 2021, USD Million
- TABLE 333 Saudi Arabia Application Container Market, 2022 - 2028, USD Million
- TABLE 334 Saudi Arabia Application Container Market by Deployment Model, 2018 - 2021, USD Million
- TABLE 335 Saudi Arabia Application Container Market by Deployment Model, 2022 - 2028, USD Million
- TABLE 336 Saudi Arabia Application Container Market by Organization Size, 2018 - 2021, USD Million
- TABLE 337 Saudi Arabia Application Container Market by Organization Size, 2022 - 2028, USD Million
- TABLE 338 Saudi Arabia Application Container Market by Vertical, 2018 - 2021, USD Million
- TABLE 339 Saudi Arabia Application Container Market by Vertical, 2022 - 2028, USD Million
- TABLE 340 South Africa Application Container Market, 2018 - 2021, USD Million
- TABLE 341 South Africa Application Container Market, 2022 - 2028, USD Million
- TABLE 342 South Africa Application Container Market by Deployment Model, 2018 - 2021, USD Million
- TABLE 343 South Africa Application Container Market by Deployment Model, 2022 - 2028, USD Million
- TABLE 344 South Africa Application Container Market by Organization Size, 2018 - 2021, USD Million
- TABLE 345 South Africa Application Container Market by Organization Size, 2022 - 2028, USD Million
- TABLE 346 South Africa Application Container Market by Vertical, 2018 - 2021, USD Million
- TABLE 347 South Africa Application Container Market by Vertical, 2022 - 2028, USD Million
- TABLE 348 Nigeria Application Container Market, 2018 - 2021, USD Million
- TABLE 349 Nigeria Application Container Market, 2022 - 2028, USD Million
- TABLE 350 Nigeria Application Container Market by Deployment Model, 2018 - 2021, USD Million
- TABLE 351 Nigeria Application Container Market by Deployment Model, 2022 - 2028, USD Million
- TABLE 352 Nigeria Application Container Market by Organization Size, 2018 - 2021, USD Million
- TABLE 353 Nigeria Application Container Market by Organization Size, 2022 - 2028, USD Million
- TABLE 354 Nigeria Application Container Market by Vertical, 2018 - 2021, USD Million
- TABLE 355 Nigeria Application Container Market by Vertical, 2022 - 2028, USD Million
- TABLE 356 Rest of LAMEA Application Container Market, 2018 - 2021, USD Million
- TABLE 357 Rest of LAMEA Application Container Market, 2022 - 2028, USD Million
- TABLE 358 Rest of LAMEA Application Container Market by Deployment Model, 2018 - 2021, USD Million
- TABLE 359 Rest of LAMEA Application Container Market by Deployment Model, 2022 - 2028, USD Million
- TABLE 360 Rest of LAMEA Application Container Market by Organization Size, 2018 - 2021, USD Million
- TABLE 361 Rest of LAMEA Application Container Market by Organization Size, 2022 - 2028, USD Million
- TABLE 362 Rest of LAMEA Application Container Market by Vertical, 2018 - 2021, USD Million
- TABLE 363 Rest of LAMEA Application Container Market by Vertical, 2022 - 2028, USD Million
- TABLE 364 Key Information - Amazon Web Services, Inc.
- TABLE 365 Key Information - Google LLC
- TABLE 366 Key information - IBM Corporation
- TABLE 367 Key Information - SAP SE
- TABLE 368 key information - Microsoft Corporation
- TABLE 369 Key Information - Broadcom, Inc.
- TABLE 370 Key Information - Rancher Labs, Inc.
- TABLE 371 Key Information - Joyent, Inc.
- TABLE 372 Key Information - Docker, Inc.
- TABLE 373 Key Information - D2iQ
List of Figures
- FIG 1 Methodology for the research
- FIG 2 KBV Cardinal Matrix
- FIG 3 Key Leading Strategies: Percentage Distribution (2018-2022)
- FIG 4 Key Strategic Move: (Partnerships, Collaborations & Agreements: 2018, Jan - 2022, Aug) Leading Players
- FIG 5 Global Application Container Market Share by Deployment Model, 2021
- FIG 6 Global Application Container Market Share by Deployment Model, 2028
- FIG 7 Global Application Container Market by Deployment Model, 2018 - 2028, USD Million
- FIG 8 Global Application Container Market Share by Organization Size, 2021
- FIG 9 Global Application Container Market Share by Organization Size, 2028
- FIG 10 Global Application Container Market by Organization Size, 2018 - 2028, USD Million
- FIG 11 Global Application Container Market Share by Vertical, 2021
- FIG 12 Global Application Container Market Share by Vertical, 2028
- FIG 13 Global Application Container Market by Vertical, 2018 - 2028, USD Million
- FIG 14 Global Application Container Market Share by Region, 2021
- FIG 15 Global Application Container Market Share by Region, 2028
- FIG 16 Global Application Container Market by Region, 2018 - 2028, USD Million
- FIG 17 SWOT analysis: Amazon.com, Inc.
- FIG 18 Recent strategies and developments: Google LLC
- FIG 19 SWOT Analysis: Alphabet Inc. (Google LLC)
- FIG 20 Recent strategies and developments: IBM Corporation
- FIG 21 Swot analysis: IBM Corporation
- FIG 22 Recent strategies and developments: SAP SE
- FIG 23 SWOT Analysis: SAP SE
- FIG 24 Recent strategies and developments: Microsoft Corporation
- FIG 25 SWOT Analysis: Microsoft Corporation
- FIG 26 SWOT Analysis: Broadcom, Inc.
- FIG 27 Recent strategies and developments: Docker, Inc.
The Global Application Container Market size is expected to reach $12 billion by 2028, rising at a market growth of 33.1% CAGR during the forecast period.
Multiple solutions can be created, upgraded, and deployed on a single OS kernel with the help of an application container platform. The technology enables the automation of several activities, including lifecycle management solution scaling, monitoring, scheduling, and upgrading. Enterprises can improve their core skills, such as security, network connection, customer interactions, and end-to-end services level monitoring, with the use of application container technology.
It enables the end-user companies to reduce operating expenses and maximize the resource usage of their application infrastructure. Due to the expanding usage of hybrid cloud technologies, there has been an increase in interest in the application container market recently. Private and public clouds are used in hybrid cloud computing deployments.
The hybrid cloud computing model offers the cloud environment flexibility. Due to these system installations, businesses can keep their private and confidential data in remote clouds. Enterprises can improve their core skills, such as security, network connection, customer interactions, and end-to-end services level monitoring, with the use of application container technology. It enables the end-user companies to reduce operating expenses and maximize the resource usage of their application infrastructure.
COVID-19 Impact Analysis
IT operations are typically conducted via "working from home" arrangements, so the lockdown hasn't disrupted the application container market. As a result, application containers are still in high demand in the IT sector. In addition, application containers have been shown to improve productivity and application development while working from home. As a result, during the Covid-19 pandemic, all software organizations adopted the application container. Due to the prevalence of working-from-home arrangements in the information technology industry, the lockdown has primarily had little impact on the application container industry.
Market Growth Factors
Application Container Technology Becoming More Popular Than Virtual Machines
Due to the many advantages of application container technology over virtual machines, the industry is anticipated to grow more quickly. For instance, a virtual machine with its full operating system can be several gigabytes in size, whereas an application container is only 10 megabytes. Because of this, virtual machines and containers can both be hosted on the same server. Another significant advantage is that application containers can be started very immediately, as opposed to virtual machines, which may take several minutes to boot up their operating platforms and start running the apps they host.
Business Agility and Speed to Market are Becoming Increasingly Important
Coordination is necessary for businesses to expand and adapt to the escalating competition. Only by implementing cutting-edge technologies and creating and distributing contemporary applications will this be possible. Application containers speed up the development of applications by cutting down on testing time and simplifying testing procedures, resulting in increased agility. Container orchestration also simplifies the deployment of applications in various contexts, such as virtual or physical infrastructures and public, private, or hybrid clouds.
Market Restraining Factors
Application Container Sprawl's Emergence
The practice of running several, uncontrollable instances of a program through containers and the ensuing high resource consumption are referred to as "container sprawl." In several situations, resource usage leaves less available for running practical containers. Additionally, the possibility of misconfiguration and improper handling of uncontrollable containers on a certain host raise those risks. The cost of the public cloud environment may increase due to container sprawl. Large businesses are more susceptible to container sprawls than Small and Medium-sized Businesses (SMEs).
Deployment Model Outlook
On the basis of deployment model, the Application Container Market is fragmented into On-premise and Cloud. The on-premise segment acquired the highest revenue share in the application container market in 2021. Due to ongoing development in on-premises deployment, this displays many cloud-like traits like high levels of virtualization and relative isolation from hardware limitations. On-premises refers to IT network elements, including hardware and software, that are hosted locally. IT assets hosted on a public cloud platform or a distant data centre contrast with this.
Organization Size Outlook
Based on organization size, the Application Container Market is classified into Small- & Medium-sized Enterprises (SMEs) and Large Enterprises. The small- & medium-sized enterprises (SMEs) segment recorded a substantial revenue share in the application container market in 2021. It is because small businesses upgrade their essential competencies, including client relations, security, network connectivity, and end-to-end services level monitoring, due to the application container technology. The application container enables end-user companies to reduce operating costs and maximize the resource usage of their application infrastructure.
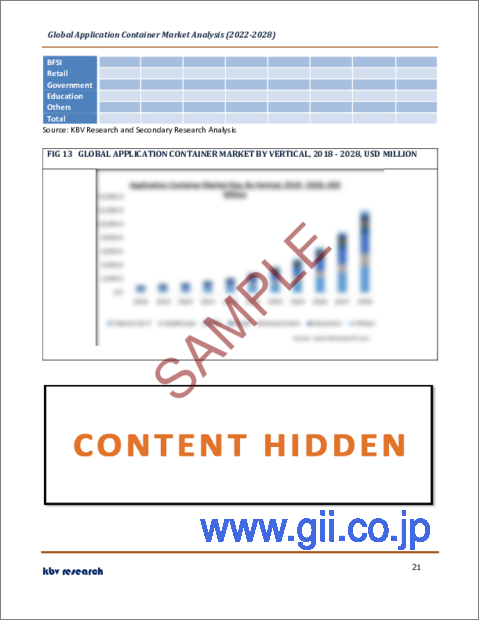
Vertical Outlook
By Vertical, the Application Container Market is segmented into Telecom & IT, Government, Healthcare, BFSI, Retail, education and others. The telecom & IT segment garnered the highest revenue share in the application container market in 2021. Containers have emerged as a highly important enabling technology. As part of the digital transformation projects, numerous organizations are primarily focusing on replacing their traditional, manually-based IT jobs with software that can automate the test, installation, and runtime procedures.
Regional Outlook
Region-wise, the Application Container Market is analysed across North America, Europe, Asia Pacific and LAMEA. The North America region acquired the largest revenue share in the application container market in 2021. Due to factors like the presence of cutting-edge ICT infrastructure in the area, ongoing R&D effort by technology providers, and a vast cloud network built by major cloud service providers. With the ample availability of the supporting infrastructure needed for the deployment of cutting-edge analytics and the existence of top cloud service providers, the market for application containers will maintain its trend of dominance during the projection period.
The major strategies followed by the market participants are Partnership. Based on the Analysis presented in the Cardinal matrix; Google LLC, Microsoft Corporation and Amazon Web Services, Inc. are the forerunners in the Application Container Market. Companies such as Joyent, Inc., IBM Corporation and SAP SE are some of the key innovators in Application Container Market.
The market research report covers the analysis of key stake holders of the market. Key companies profiled in the report include Amazon Web Services, Inc. (Amazon.com, Inc.), Google LLC, IBM Corporation, SAP SE, Microsoft Corporation, Broadcom, Inc. (CA Technologies), Rancher Labs, Inc. (SUSE SE), Joyent, Inc. (Samsung Group), Docker, Inc. (Mirantis), D2iQ
Recent strategies deployed in Application Container Market
Partnerships, Collaborations & Agreements
Aug-2022: AWS partnered with Bridgestone, the world's largest tire and Rubber Company. Following this partnership, the companies aimed to develop a Platform as well as introduce new customer service solutions. Moreover, Bridgestone would also leverage AWS capabilities with the aim to expedite this development and launch procedure.
Aug-2022: AWS teamed up with the tax division of the Department of Justice. With this collaboration, AWS aimed to help the entity in developing an application intending to aid its partner, TechConsulting in building an enterprise-level application utilizing tools within AWS GovCloud.
Jul-2022: D2iQ partnered with Aqua Security, the largest pure-play cloud-native security company. Under this partnership, the companies aimed to jointly develop a solution in order to allow organizations to provide a seamless DevSecOps experience that augments the secure smart cloud-native applications deployment.
Jun-2022: SAP partnered with LeanIX, a Software-as-a-Service (SaaS) company. Through this partnership, the companies aimed to integrate enterprise architecture and process excellence in order to help IT architects, business leaders, and IT asset managers.
May-2022: AWS joined hands with MHP, leading international management, and IT consultancy. Following this collaboration, the company aimed to further support cloud transformation within mobility and manufacturing. Moreover, MHP would also introduce its own software product portfolio over AWS to allow customers to accelerate time to market, reduce operational costs, and minimize implementation complexities.
May-2022: D2iQ entered into a partnership with GitLab, an open-core company. This partnership aimed to bolster the deployment of smart cloud-native applications with the aim to allow customers to operate the GitLab Kubernetes Operator across the D2iQ Kubernetes Platform to offer consistent upgrades, security, and deployment policies for applications and infrastructures.
May-2022: AWS Collaborated with IBM, an American multinational technology. Following this collaboration, the companies aimed to deploy IBM Software-as-a-Service on AWS.
Feb-2022: IBM entered into a partnership with SAP, a German multinational software company. Following this partnership, the companies aimed to aid customers in migrating Workloads from SAP solutions to the IBM Cloud.
Jul-2021: SAP came into a partnership with Google Cloud, a suite of cloud computing services. Through this partnership, the companies aimed to enable customers to make choices without increasing complexities and costs.
Jun-2021: AWS came into a partnership with Axis Bank, an Indian financial and banking services company. With this partnership, the companies aimed to accelerate digital transformation. In addition, AWS would offer on-demand cloud computing services to businesses in order to expedite the transformation of the bank.
Jun-2021: AWS entered into a partnership with Salesforce, an American cloud-based software company. Under this partnership, the companies aimed to streamline the use of the full set of AWS and Salesforce capabilities for users in order to allow them to simply develop and deploy robust new business applications, accelerating digital transformation.
Apr-2021: AWS teamed up with DISH Network, an American television provider. Under this partnership, DISH Network would develop its 5G network on AWS to fulfill the increasing demands of customers.
Dec-2020: AWS came into an agreement with ViacomCBS, an American multinational mass media and entertainment conglomerate. Under this collaboration, AWS would become the preferred cloud provider for the global broadcast media operations of ViacomCBS. Moreover, ViacomCBS would also migrate its entire broadcast footprint to AWS.
Aug-2020: SAP entered into a partnership with HPE, an American multinational information technology company. Following this partnership, the companies aimed to deliver the SAP HANA Enterprise Cloud in integration with HPE GreenLake cloud services to provide SAP HANA Enterprise Cloud's customer edition with an automated and consistent cloud experience.
May-2020: Docker collaborated with Microsoft Azure, the cloud computing service of Microsoft. With this collaboration, the companies aimed to allow developers to use native Docker commands in order to operate applications in Azure Container Instances for an impeccable cloud-native applications developing experience.
Product Launches and Product Expansion
May-2022: Docker launched the Docker Extensions. Through this launch, the company aimed to boost developer productivity by allowing them to discover and leverage complementary development tools over the Docker Desktop.
Mar-2022: Google introduced Google Cloud Contact Center AI Platform into its Contact Center AI offerings. This collaboration aimed to integrate the benefits of cloud scalability, AI, multi-experience capabilities, and customer relationship management platforms with the aim to unify sales, support, and marketing teams across data.
Nov-2021: Microsoft launched Azure Container Apps, a fully managed serverless container service. This launch aimed to complement the existing container infrastructure services of the company.
May-2021: SAP introduced Honeywell Forge Real Estate Operations in collaboration with Honeywell. The new solution aimed to extend Honeywell Forge enterprise performance management software's capabilities. Moreover, the new Cloud-based SaaS portfolio would offer increased visibility to customers over how their buildings are performing.
Apr-2021: IBM rolled out Advanced Storage Solutions. This product launch aimed to streamline data availability as well as accessibility over Hybrid Clouds. Moreover, the company also aimed to ship new container-native software-defined storage solutions to aid businesses in expanding data availability across complex hybrid clouds for enhanced business performance and resilience.
Jan-2021: Microsoft introduced Application Guard, a feature that opens untrusted files in a sandbox. Through this launch, the company aimed to offer enhanced protection to Microsoft Word, PowerPoint, and Excel documents from potential malware and threats.
Oct-2020: Rancher Labs rolled out Rancher 2.5, the latest version of its eponymous software. This launch aimed to offer an improved single cluster management experience expanded cloud distribution support, application deployment at scale expanded, as well as new security, hardened and certified Kubernetes distribution.
Mergers & Acquisition
Mar-2022: Google took over Raxium, an innovator in single-panel MicroLED display technologies. With this acquisition, the company aimed to complement its objective to construct beneficial services and devices to enhance the daily lives of customers.
Feb-2022: IBM acquired Neudesic, a leader in providing cloud services. Through this acquisition, the company aimed to expand its hybrid multi-cloud services offerings along with advancing the AI and hybrid cloud strategy of the company.
Jun-2021: IBM took over Turbonomic, an enterprise software company. Through this acquisition, the company aimed to offer Comprehensive AIOps Capabilities to Hybrid Cloud in order to aid customers in expediting their journey to AI and hybrid cloud.
Apr-2021: Microsoft completed its acquisition of Kinvolk, a software development company. This acquisition aimed to expedite container-optimized innovation by prioritizing the ability to run Kubernetes remotely.
Scope of the Study
Market Segments covered in the Report:
By Deployment Model
- On-premise
- Cloud
By Organization Size
- Large Enterprises
- Small- & Medium-sized Enterprises (SMEs)
By Vertical
- Telecom & IT
- Healthcare
- BFSI
- Retail
- Government
- Education
- Others
By Geography
- North America
- US
- Canada
- Mexico
- Rest of North America
- Europe
- Germany
- UK
- France
- Russia
- Spain
- Italy
- Rest of Europe
- Asia Pacific
- China
- Japan
- India
- South Korea
- Singapore
- Malaysia
- Rest of Asia Pacific
- LAMEA
- Brazil
- Argentina
- UAE
- Saudi Arabia
- South Africa
- Nigeria
- Rest of LAMEA
Companies Profiled
- Amazon Web Services, Inc. (Amazon.com, Inc.)
- Google LLC
- IBM Corporation
- SAP SE
- Microsoft Corporation
- Broadcom, Inc. (CA Technologies)
- Rancher Labs, Inc. (SUSE SE)
- Joyent, Inc. (Samsung Group)
- Docker, Inc. (Mirantis)
- D2iQ
Unique Offerings from KBV Research
- Exhaustive coverage
- Highest number of market tables and figures
- Subscription based model available
- Guaranteed best price
- Assured post sales research support with 10% customization free
Table of Contents
Chapter 1. Market Scope & Methodology
- 1.1 Market Definition
- 1.2 Objectives
- 1.3 Market Scope
- 1.4 Segmentation
- 1.4.1 Global Application Container Market, by Deployment Model
- 1.4.2 Global Application Container Market, by Organization Size
- 1.4.3 Global Application Container Market, by Vertical
- 1.4.4 Global Application Container Market, by Geography
- 1.5 Methodology for the research
Chapter 2. Market Overview
- 2.1 Introduction
- 2.1.1 Overview
- 2.1.1.1 Market Composition and Scenario
- 2.1.1 Overview
- 2.2 Key Factors Impacting the Market
- 2.2.1 Market Drivers
- 2.2.2 Market Restraints
Chapter 3. Competition Analysis - Global
- 3.1 KBV Cardinal Matrix
- 3.2 Recent Industry Wide Strategic Developments
- 3.2.1 Partnerships, Collaborations and Agreements
- 3.2.2 Product Launches and Product Expansions
- 3.2.3 Acquisition and Mergers
- 3.3 Top Winning Strategies
- 3.3.1 Key Leading Strategies: Percentage Distribution (2018-2022)
- 3.3.2 Key Strategic Move: (Partnerships, Collaborations & Agreements: 2018, Jan - 2022, Aug) Leading Players
Chapter 4. Global Application Container Market by Deployment Model
- 4.1 Global On-premise Market by Region
- 4.2 Global Cloud Market by Region
Chapter 5. Global Application Container Market by Organization Size
- 5.1 Global Large Enterprises Market by Region
- 5.2 Global Small- & Medium-sized Enterprises (SMEs) Market by Region
Chapter 6. Global Application Container Market by Vertical
- 6.1 Global Telecom & IT Market by Region
- 6.2 Global Healthcare Market by Region
- 6.3 Global BFSI Market by Region
- 6.4 Global Retail Market by Region
- 6.5 Global Government Market by Region
- 6.6 Global Education Market by Region
- 6.7 Global Others Market by Region
Chapter 7. Global Application Container Market by Region
- 7.1 North America Application Container Market
- 7.1.1 North America Application Container Market by Deployment Model
- 7.1.1.1 North America On-premise Market by Country
- 7.1.1.2 North America Cloud Market by Country
- 7.1.2 North America Application Container Market by Organization Size
- 7.1.2.1 North America Large Enterprises Market by Country
- 7.1.2.2 North America Small- & Medium-sized Enterprises (SMEs) Market by Country
- 7.1.3 North America Application Container Market by Vertical
- 7.1.3.1 North America Telecom & IT Market by Country
- 7.1.3.2 North America Healthcare Market by Country
- 7.1.3.3 North America BFSI Market by Country
- 7.1.3.4 North America Retail Market by Country
- 7.1.3.5 North America Government Market by Country
- 7.1.3.6 North America Education Market by Country
- 7.1.3.7 North America Others Market by Country
- 7.1.4 North America Application Container Market by Country
- 7.1.4.1 US Application Container Market
- 7.1.4.1.1 US Application Container Market by Deployment Model
- 7.1.4.1.2 US Application Container Market by Organization Size
- 7.1.4.1.3 US Application Container Market by Vertical
- 7.1.4.2 Canada Application Container Market
- 7.1.4.2.1 Canada Application Container Market by Deployment Model
- 7.1.4.2.2 Canada Application Container Market by Organization Size
- 7.1.4.2.3 Canada Application Container Market by Vertical
- 7.1.4.3 Mexico Application Container Market
- 7.1.4.3.1 Mexico Application Container Market by Deployment Model
- 7.1.4.3.2 Mexico Application Container Market by Organization Size
- 7.1.4.3.3 Mexico Application Container Market by Vertical
- 7.1.4.4 Rest of North America Application Container Market
- 7.1.4.4.1 Rest of North America Application Container Market by Deployment Model
- 7.1.4.4.2 Rest of North America Application Container Market by Organization Size
- 7.1.4.4.3 Rest of North America Application Container Market by Vertical
- 7.1.4.1 US Application Container Market
- 7.1.1 North America Application Container Market by Deployment Model
- 7.2 Europe Application Container Market
- 7.2.1 Europe Application Container Market by Deployment Model
- 7.2.1.1 Europe On-premise Market by Country
- 7.2.1.2 Europe Cloud Market by Country
- 7.2.2 Europe Application Container Market by Organization Size
- 7.2.2.1 Europe Large Enterprises Market by Country
- 7.2.2.2 Europe Small- & Medium-sized Enterprises (SMEs) Market by Country
- 7.2.3 Europe Application Container Market by Vertical
- 7.2.3.1 Europe Telecom & IT Market by Country
- 7.2.3.2 Europe Healthcare Market by Country
- 7.2.3.3 Europe BFSI Market by Country
- 7.2.3.4 Europe Retail Market by Country
- 7.2.3.5 Europe Government Market by Country
- 7.2.3.6 Europe Education Market by Country
- 7.2.3.7 Europe Others Market by Country
- 7.2.4 Europe Application Container Market by Country
- 7.2.4.1 Germany Application Container Market
- 7.2.4.1.1 Germany Application Container Market by Deployment Model
- 7.2.4.1.2 Germany Application Container Market by Organization Size
- 7.2.4.1.3 Germany Application Container Market by Vertical
- 7.2.4.2 UK Application Container Market
- 7.2.4.2.1 UK Application Container Market by Deployment Model
- 7.2.4.2.2 UK Application Container Market by Organization Size
- 7.2.4.2.3 UK Application Container Market by Vertical
- 7.2.4.3 France Application Container Market
- 7.2.4.3.1 France Application Container Market by Deployment Model
- 7.2.4.3.2 France Application Container Market by Organization Size
- 7.2.4.3.3 France Application Container Market by Vertical
- 7.2.4.4 Russia Application Container Market
- 7.2.4.4.1 Russia Application Container Market by Deployment Model
- 7.2.4.4.2 Russia Application Container Market by Organization Size
- 7.2.4.4.3 Russia Application Container Market by Vertical
- 7.2.4.5 Spain Application Container Market
- 7.2.4.5.1 Spain Application Container Market by Deployment Model
- 7.2.4.5.2 Spain Application Container Market by Organization Size
- 7.2.4.5.3 Spain Application Container Market by Vertical
- 7.2.4.6 Italy Application Container Market
- 7.2.4.6.1 Italy Application Container Market by Deployment Model
- 7.2.4.6.2 Italy Application Container Market by Organization Size
- 7.2.4.6.3 Italy Application Container Market by Vertical
- 7.2.4.7 Rest of Europe Application Container Market
- 7.2.4.7.1 Rest of Europe Application Container Market by Deployment Model
- 7.2.4.7.2 Rest of Europe Application Container Market by Organization Size
- 7.2.4.7.3 Rest of Europe Application Container Market by Vertical
- 7.2.4.1 Germany Application Container Market
- 7.2.1 Europe Application Container Market by Deployment Model
- 7.3 Asia Pacific Application Container Market
- 7.3.1 Asia Pacific Application Container Market by Deployment Model
- 7.3.1.1 Asia Pacific On-premise Market by Country
- 7.3.1.2 Asia Pacific Cloud Market by Country
- 7.3.2 Asia Pacific Application Container Market by Organization Size
- 7.3.2.1 Asia Pacific Large Enterprises Market by Country
- 7.3.2.2 Asia Pacific Small- & Medium-sized Enterprises (SMEs) Market by Country
- 7.3.3 Asia Pacific Application Container Market by Vertical
- 7.3.3.1 Asia Pacific Telecom & IT Market by Country
- 7.3.3.2 Asia Pacific Healthcare Market by Country
- 7.3.3.3 Asia Pacific BFSI Market by Country
- 7.3.3.4 Asia Pacific Retail Market by Country
- 7.3.3.5 Asia Pacific Government Market by Country
- 7.3.3.6 Asia Pacific Education Market by Country
- 7.3.3.7 Asia Pacific Others Market by Country
- 7.3.4 Asia Pacific Application Container Market by Country
- 7.3.4.1 China Application Container Market
- 7.3.4.1.1 China Application Container Market by Deployment Model
- 7.3.4.1.2 China Application Container Market by Organization Size
- 7.3.4.1.3 China Application Container Market by Vertical
- 7.3.4.2 Japan Application Container Market
- 7.3.4.2.1 Japan Application Container Market by Deployment Model
- 7.3.4.2.2 Japan Application Container Market by Organization Size
- 7.3.4.2.3 Japan Application Container Market by Vertical
- 7.3.4.3 India Application Container Market
- 7.3.4.3.1 India Application Container Market by Deployment Model
- 7.3.4.3.2 India Application Container Market by Organization Size
- 7.3.4.3.3 India Application Container Market by Vertical
- 7.3.4.4 South Korea Application Container Market
- 7.3.4.4.1 South Korea Application Container Market by Deployment Model
- 7.3.4.4.2 South Korea Application Container Market by Organization Size
- 7.3.4.4.3 South Korea Application Container Market by Vertical
- 7.3.4.5 Singapore Application Container Market
- 7.3.4.5.1 Singapore Application Container Market by Deployment Model
- 7.3.4.5.2 Singapore Application Container Market by Organization Size
- 7.3.4.5.3 Singapore Application Container Market by Vertical
- 7.3.4.6 Malaysia Application Container Market
- 7.3.4.6.1 Malaysia Application Container Market by Deployment Model
- 7.3.4.6.2 Malaysia Application Container Market by Organization Size
- 7.3.4.6.3 Malaysia Application Container Market by Vertical
- 7.3.4.7 Rest of Asia Pacific Application Container Market
- 7.3.4.7.1 Rest of Asia Pacific Application Container Market by Deployment Model
- 7.3.4.7.2 Rest of Asia Pacific Application Container Market by Organization Size
- 7.3.4.7.3 Rest of Asia Pacific Application Container Market by Vertical
- 7.3.4.1 China Application Container Market
- 7.3.1 Asia Pacific Application Container Market by Deployment Model
- 7.4 LAMEA Application Container Market
- 7.4.1 LAMEA Application Container Market by Deployment Model
- 7.4.1.1 LAMEA On-premise Market by Country
- 7.4.1.2 LAMEA Cloud Market by Country
- 7.4.2 LAMEA Application Container Market by Organization Size
- 7.4.2.1 LAMEA Large Enterprises Market by Country
- 7.4.2.2 LAMEA Small- & Medium-sized Enterprises (SMEs) Market by Country
- 7.4.3 LAMEA Application Container Market by Vertical
- 7.4.3.1 LAMEA Telecom & IT Market by Country
- 7.4.3.2 LAMEA Healthcare Market by Country
- 7.4.3.3 LAMEA BFSI Market by Country
- 7.4.3.4 LAMEA Retail Market by Country
- 7.4.3.5 LAMEA Government Market by Country
- 7.4.3.6 LAMEA Education Market by Country
- 7.4.3.7 LAMEA Others Market by Country
- 7.4.4 LAMEA Application Container Market by Country
- 7.4.4.1 Brazil Application Container Market
- 7.4.4.1.1 Brazil Application Container Market by Deployment Model
- 7.4.4.1.2 Brazil Application Container Market by Organization Size
- 7.4.4.1.3 Brazil Application Container Market by Vertical
- 7.4.4.2 Argentina Application Container Market
- 7.4.4.2.1 Argentina Application Container Market by Deployment Model
- 7.4.4.2.2 Argentina Application Container Market by Organization Size
- 7.4.4.2.3 Argentina Application Container Market by Vertical
- 7.4.4.3 UAE Application Container Market
- 7.4.4.3.1 UAE Application Container Market by Deployment Model
- 7.4.4.3.2 UAE Application Container Market by Organization Size
- 7.4.4.3.3 UAE Application Container Market by Vertical
- 7.4.4.4 Saudi Arabia Application Container Market
- 7.4.4.4.1 Saudi Arabia Application Container Market by Deployment Model
- 7.4.4.4.2 Saudi Arabia Application Container Market by Organization Size
- 7.4.4.4.3 Saudi Arabia Application Container Market by Vertical
- 7.4.4.5 South Africa Application Container Market
- 7.4.4.5.1 South Africa Application Container Market by Deployment Model
- 7.4.4.5.2 South Africa Application Container Market by Organization Size
- 7.4.4.5.3 South Africa Application Container Market by Vertical
- 7.4.4.6 Nigeria Application Container Market
- 7.4.4.6.1 Nigeria Application Container Market by Deployment Model
- 7.4.4.6.2 Nigeria Application Container Market by Organization Size
- 7.4.4.6.3 Nigeria Application Container Market by Vertical
- 7.4.4.7 Rest of LAMEA Application Container Market
- 7.4.4.7.1 Rest of LAMEA Application Container Market by Deployment Model
- 7.4.4.7.2 Rest of LAMEA Application Container Market by Organization Size
- 7.4.4.7.3 Rest of LAMEA Application Container Market by Vertical
- 7.4.4.1 Brazil Application Container Market
- 7.4.1 LAMEA Application Container Market by Deployment Model
Chapter 8. Company Profiles
- 8.1 Amazon Web Services, Inc. (Amazon.com, Inc.)
- 8.1.1 Company Overview
- 8.1.2 Financial Analysis
- 8.1.3 Segmental Analysis
- 8.1.4 Recent strategies and developments:
- 8.1.4.1 Partnerships, Collaborations, and Agreements:
- 8.1.5 SWOT Analysis
- 8.2 Google LLC
- 8.2.1 Company Overview
- 8.2.2 Financial Analysis
- 8.2.3 Segmental and Regional Analysis
- 8.2.4 Research & Development Expense
- 8.2.5 Recent strategies and developments:
- 8.2.5.1 Product Launches and Product Expansions:
- 8.2.5.2 Acquisition and Mergers:
- 8.2.6 SWOT Analysis
- 8.3 IBM Corporation
- 8.3.1 Company Overview
- 8.3.2 Financial Analysis
- 8.3.3 Regional & Segmental Analysis
- 8.3.4 Research & Development Expenses
- 8.3.5 Recent strategies and developments:
- 8.3.5.1 Partnerships, Collaborations, and Agreements:
- 8.3.5.2 Product Launches and Product Expansions:
- 8.3.5.3 Mergers & Acquisition
- 8.3.6 SWOT Analysis
- 8.4 SAP SE
- 8.4.1 Company Overview
- 8.4.2 Financial Analysis
- 8.4.3 Segmental and Regional Analysis
- 8.4.4 Research & Development Expense
- 8.4.5 Recent strategies and developments:
- 8.4.5.1 Partnerships, Collaborations, and Agreements:
- 8.4.5.2 Product Launches and Product Expansion:
- 8.4.6 SWOT Analysis
- 8.5 Microsoft Corporation
- 8.5.1 Company Overview
- 8.5.2 Financial Analysis
- 8.5.3 Segmental and Regional Analysis
- 8.5.4 Research & Development Expenses
- 8.5.5 Recent strategies and developments:
- 8.5.5.1 Mergers & Acquisition:
- 8.5.5.2 Product Launches and Product Expansions:
- 8.5.6 SWOT Analysis
- 8.6 Broadcom, Inc. (CA Technologies, Inc.)
- 8.6.1 Company Overview
- 8.6.2 Financial Analysis
- 8.6.3 Segmental and Regional Analysis
- 8.6.4 Research & Development Expense
- 8.6.5 SWOT Analysis
- 8.7 Rancher Labs, Inc. (SUSE SE)
- 8.7.1 Company Overview
- 8.7.2 Financial Analysis
- 8.7.3 Regional Analysis
- 8.7.4 Research & Development Expenses
- 8.7.5 Recent strategies and developments:
- 8.7.5.1 Product Launches and Product Expansions:
- 8.8 Joyent, Inc. (Samsung Group)
- 8.8.1 Company Overview
- 8.8.2 Financial Analysis
- 8.8.3 Segmental and Regional Analysis
- 8.8.4 Research & Development Expenses
- 8.9 Docker, Inc. (Mirantis)
- 8.9.1 Company Overview
- 8.9.2 Recent strategies and developments:
- 8.9.2.1 Partnerships, Collaborations, and Agreements:
- 8.9.2.2 Product Launches and Product Expansions:
- 8.10. D2iQ
- 8.10.1 Company Overview
- 8.10.2 Recent strategies and developments:
- 8.10.2.1 Partnerships, Collaborations, and Agreements: