|
|
市場調査レポート
商品コード
1247446
アプリケーションコンテナの世界市場-2023-2030Global Application Container Market - 2023-2030 |
||||||
|
|
|||||||
|
● お客様のご希望に応じて、既存データの加工や未掲載情報(例:国別セグメント)の追加などの対応が可能です。 詳細はお問い合わせください。 |
|||||||


| アプリケーションコンテナの世界市場-2023-2030 |
|
出版日: 2023年03月28日
発行: DataM Intelligence
ページ情報: 英文 235 Pages
納期: 約2営業日
|
- 全表示
- 概要
- 目次
市場概要
アプリケーションコンテナの世界市場は、予測期間中(2023年~2030年)に34.5%のCAGRで成長しています。
アプリケーションコンテナは、アプリケーションの移植性の向上、展開と管理の簡素化、開発サイクルの短縮など、開発者に多くのメリットをもたらします。アプリケーションコンテナは、クラウドコンピューティング環境において一般的に使用されており、リソースの効率的な利用やマイクロサービスベースのアーキテクチャの迅速な展開を可能にします。
市場力学
マイクロサービスベースのアーキテクチャに対する需要の高まり
マイクロサービスベースのアーキテクチャは、各サービスを独立して展開・拡張できるため、拡張性が高く、変化するビジネスニーズに迅速に対応することが可能です。アプリケーションコンテナは、マイクロサービスベースのアプリケーションをパッケージ化してデプロイするための理想的な方法です。アプリケーションコンテナは、パブリッククラウドやプライベートクラウドなど、さまざまな環境においてアプリケーションを高度に移植する必要があります。アプリケーションコンテナは、高い移植性を持つように設計されており、マイクロサービスベースのアプリケーションを異なる環境に展開するための理想的な技術となっています。したがって、マイクロサービスベースのアーキテクチャに対する需要は、組織がソフトウェア開発にこのアプローチを採用することが増えているため、アプリケーションコンテナ市場の成長を引き続き促進すると予想されます。
標準化の欠如
標準化が進んでいないため、コンテナがネットワークやストレージなど、ITインフラの他のコンポーネントとシームレスに連携することが難しくなります。このため、コンテナの相互運用性が制限され、複雑なIT環境でコンテナベースのアプリケーションを管理することが難しくなる可能性があります。これは、組織がコンテナベースのアーキテクチャを効果的に採用し、管理することをより困難にする可能性があるため、世界のアプリケーションコンテナ市場の成長を抑制する要因になり得ます。Open Container Initiative(OCI)やCloud Native Computing Foundation(CNCF)などの標準化活動は、コンテナ化技術に関する標準やベストプラクティスを作成することによって、この問題に対処するために取り組んでいます。
COVID-19の影響度分析
COVID-19分析では、COVID前シナリオ、COVIDシナリオ、COVID後シナリオに加え、価格力学(パンデミック時やCOVID前シナリオとの比較による価格変動を含む)、需要-供給スペクトラム(取引制限、封鎖、その後の問題による需要と供給のシフト)、政府の取り組み(政府機関による市場、セクター、産業の活性化に関する取り組み)、メーカーの戦略的取り組み(COVID問題を軽減するためのメーカーの取り組み)についても解説しています。
目次
第1章 調査手法とスコープ
- 調査手法
- 調査目的および調査範囲について
第2章 定義と概要
第3章 エグゼクティブサマリー
- サービス別スニペット
- 開発モード別スニペット
- 組織規模別スニペット
- アプリケーション別スニペット
- エンドユーザー別スニペット(Snippet by End-User
- 地域別スニペット
第4章 ダイナミックス
- インパクトのあるファクター
- 促進要因
- マイクロサービスベースアーキテクチャの需要の高まり
- 抑制要因
- 標準化の欠如
- 機会
- 影響度分析
- 促進要因
第5章 産業分析
- ポーターのファイブフォース分析
- サプライチェーン分析
- 価格アナリシス
- レギュラトリー・アナリシス
第6章 COVID-19の分析
- COVID-19の解析について
- COVID-19シナリオ前
- 現在のCOVID-19シナリオ
- ポストCOVID-19またはフューチャーシナリオ
- COVIDの中での価格ダイナミクス-19
- 需給スペクトル
- パンデミック時の市場に関連する政府の取り組み
- メーカーの戦略的な取り組み
- 結論
第7章 サービス別
- コンサルティング
- コンテナモニタリング
- コンテナセキュリティ
- コンテナのデータ管理
- コンテナ・ネットワーキング
- コンテナオーケストレーション
- サポートとメンテナンス
第8章 デプロイメントモード別
- クラウド
- オンプレミス
第9章 組織規模別
- 中小企業
- 大企業
第10章 アプリケーション別
- プロダクション
- コラボレーション
- モダナイゼーション
- その他
第11章 エンドユーザー別
- BFSI
- ヘルスケアとライフサイエンス
- 通信・IT分野
- リテール&eコマース
- 教育
- メディア・エンターテインメント
- その他
第12章 地域別
- 北米
- 米国
- カナダ
- メキシコ
- 欧州
- ドイツ
- 英国
- フランス
- イタリア
- ロシア
- その他欧州
- 南米
- ブラジル
- アルゼンチン
- その他南米地域
- アジア太平洋地域
- 中国
- インド
- 日本
- オーストラリア
- その他アジア太平洋地域
- 中東・アフリカ地域
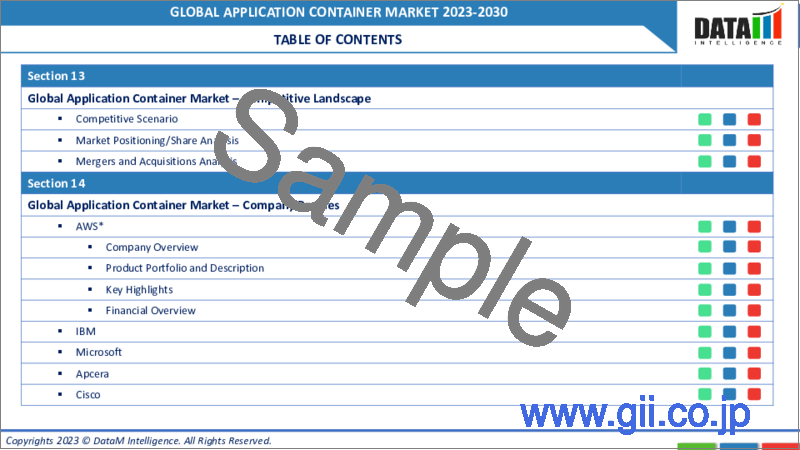
第13章 競合情勢について
- 競合シナリオ
- 市況分析・シェア分析
- M&A分析
第14章 企業プロファイル
- AWS
- 会社概要
- 製品ポートフォリオと説明
- 財務概要
- 主な展開
- IBM
- Microsoft
- Apcera
- Cisco
- Docker
- Red Hat
- VMWare
- Joyent.
第15章 付録
Market Overview
The global application container market reached US$ XX million in 2022 and is projected to witness lucrative growth by reaching up to US$ XX million by 2030. The market is growing at a CAGR of 34.5% during the forecast period (2023-2030).
Application containers provide many benefits for developers, including improved application portability, simplified deployment and management, and faster development cycles. They are commonly used in cloud computing environments, where they enable efficient use of resources and allow for the rapid deployment of microservices-based architectures.
Market Dynamics
The Rising demand for microservices-based architectures
Microservices-based architectures are highly scalable as each service can be deployed and scaled independently, allowing organizations to respond quickly to changing business needs. Application containers provide an ideal way to package and deploy microservices-based applications as they can be easily scaled up or down as needed. It require applications to be highly portable across different environments, including public and private clouds. Application containers are designed to be highly portable, making them an ideal technology for deploying microservices-based applications across different environments. Therefore, the demand for microservices-based architectures is expected to continue to drive the growth of the application container market, as organizations increasingly adopt this approach to software development.
Lack of standardization
The lack of standardization can make it difficult for containers to work seamlessly with other components of the IT infrastructure, such as networking or storage. This can limit the interoperability of containers and make it more difficult to manage container-based applications in complex IT environments. Itis a potential restraining factor for the growth of the global application containers market, as it can make it more difficult for organizations to adopt and manage container-based architectures effectively. Standardization efforts, such as the Open Container Initiative (OCI) and the Cloud Native Computing Foundation (CNCF), are working to address this issue by creating standards and best practices for containerization technology.
COVID-19 Impact Analysis
The COVID-19 Analysis includes Pre-COVID Scenario, COVID Scenario and Post-COVID Scenario along with Pricing Dynamics (Including pricing change during and post-pandemic comparing it with pre-COVID scenarios), Demand-Supply Spectrum (Shift in demand and supply owing to trading restrictions, lockdown and subsequent issues), Government Initiatives (Initiatives to revive market, sector or Industry by Government Bodies) and Manufacturers Strategic Initiatives (What manufacturers did to mitigate the COVID issues will be covered here).
Segment Analysis
The global application container market is segmented based on service, deployment mode, organiation size, application, end-user and region.
The ability to offer better security and reliability, cloud deployment mode segment captures the m ajority of shares in global market
Cloud-based application container platforms are typically more cost-effective than on-premises platforms. This is because cloud-based platforms do not require the same level of hardware and infrastructure investment as on-premises platforms. Cloud-based application container platforms are designed to be highly reliable, with built-in redundancy and failover mechanisms. This ensures that applications are always available, even in the event of hardware or software failures. This platforms typically offer better security than on-premises platforms. This is because cloud-based platforms have multiple layers of security, including physical security, network security, and data encryption.
Therefore, the benefits of cloud deployment mode make it a more attractive option for companies looking to deploy application containers. As a result, cloud deployment mode dominates the global application container market.
Geographical Analysis
The growing start-ups ecosystem in the region generates the higher growth prospect in the region, which further drives the global market
North America has a vibrant start-up ecosystem that has been driving innovation in container technology. Many of the leading container platforms, such as Docker and Kubernetes, were developed by North American start-ups. The region has many large enterprises that have adopted container technology, including banks, healthcare providers, and technology companies. The adoption of container technology by these companies has helped to establish North America as a leader in the application container market. Therefore, the combination of a vibrant start-up ecosystem and large enterprises have helped to establish North America as the dominant region in the global application container market.
Competitive Landscape
The major global players include AWS, IBM, Microsoft, Apcera, Cisco, Docker, Red Hat, Google, VMWare and Joyent.
Why Purchase the Report?
- To visualize the global application container market segmentation based on service, deployment mode, organization size, application, end-user and region, as well as understand key commercial assets and players.
- Identify commercial opportunities by analyzing trends and co-development.
- Excel data sheet with numerous data points of application container market-level with all segments.
- PDF report consists of a comprehensive analysis after exhaustive qualitative interviews and an in-depth study.
- Product mapping available as excel consisting of key products of all the major players.
The global application container market report would provide approximately 77 tables, 84 figures and 235 Pages.
Target Audience 2023
- Manufacturers/ Buyers
- Industry Investors/Investment Bankers
- Research Professionals
- Emerging Companies
Table of Contents
1. Methodology and Scope
- 1.1. Research Methodology
- 1.2. Research Objective and Scope of the Report
2. Definition and Overview
3. Executive Summary
- 3.1. Snippet by Service
- 3.2. Snippet by Development Mode
- 3.3. Snippet by Organization Size
- 3.4. Snippet by Application
- 3.5. Snippet by End-User
- 3.6. Snippet by Region
4. Dynamics
- 4.1. Impacting Factors
- 4.1.1. Drivers
- 4.1.1.1. The Rising demand for micro services-based architectures
- 4.1.1.2. XX
- 4.1.2. Restraints
- 4.1.2.1. Lack of standardization
- 4.1.2.2. XX
- 4.1.3. Opportunity
- 4.1.3.1. XX
- 4.1.4. Impact Analysis
- 4.1.1. Drivers
5. Industry Analysis
- 5.1. Porter's Five Forces Analysis
- 5.2. Supply Chain Analysis
- 5.3. Pricing Analysis
- 5.4. Regulatory Analysis
6. COVID-19 Analysis
- 6.1. Analysis of COVID-19
- 6.1.1. Before COVID-19 Scenario
- 6.1.2. Present COVID-19 Scenario
- 6.1.3. Post COVID-19 or Future Scenario
- 6.2. Pricing Dynamics Amid COVID-19
- 6.3. Demand-Supply Spectrum
- 6.4. Government Initiatives Related to the Market During Pandemic
- 6.5. Manufacturers Strategic Initiatives
- 6.6. Conclusion
7. By Service
- 7.1. Introduction
- 7.1.1. Market Size Analysis and Y-o-Y Growth Analysis (%), By Service
- 7.1.2. Market Attractiveness Index, By Service
- 7.2. Consulting*
- 7.2.1. Introduction
- 7.2.2. Market Size Analysis and Y-o-Y Growth Analysis (%)
- 7.3. Container Monitoring
- 7.4. Container Security
- 7.5. Container Data Management
- 7.6. Container Networking
- 7.7. Container Orchestration
- 7.8. Support and Maintenance
8. By Deployment Mode
- 8.1. Introduction
- 8.1.1. Market Size Analysis and Y-o-Y Growth Analysis (%), By Deployment Mode
- 8.1.2. Market Attractiveness Index, By Deployment Mode
- 8.2. Cloud*
- 8.2.1. Introduction
- 8.2.2. Market Size Analysis and Y-o-Y Growth Analysis (%)
- 8.3. On-Premises
9. By Organization Size
- 9.1. Introduction
- 9.1.1. Market Size Analysis and Y-o-Y Growth Analysis (%), By Organization Size
- 9.1.2. Market Attractiveness Index, By Organization Size
- 9.2. SMEs*
- 9.2.1. Introduction
- 9.2.2. Market Size Analysis and Y-o-Y Growth Analysis (%)
- 9.3. Large Enterprises
10. By Application
- 10.1. Introduction
- 10.1.1. Market Size Analysis and Y-o-Y Growth Analysis (%), By Application
- 10.1.2. Market Attractiveness Index, By Application
- 10.2. Production*
- 10.2.1. Introduction
- 10.2.2. Market Size Analysis and Y-o-Y Growth Analysis (%)
- 10.3. Collaboration
- 10.4. Modernization
- 10.5. Others
11. By End-User
- 11.1. Introduction
- 11.1.1. Market Size Analysis and Y-o-Y Growth Analysis (%), By End-User
- 11.1.2. Market Attractiveness Index, By End-User
- 11.2. BFSI*
- 11.2.1. Introduction
- 11.2.2. Market Size Analysis and Y-o-Y Growth Analysis (%)
- 11.3. Healthcare and Life Science
- 11.4. Telecommunication and IT
- 11.5. Retail & E-Commerce
- 11.6. Education
- 11.7. Media & Entertainment
- 11.8. Others
12. By Region
- 12.1. Introduction
- 12.1.1. Market Size Analysis and Y-o-Y Growth Analysis (%), By Region
- 12.1.2. Market Attractiveness Index, By Region
- 12.2. North America
- 12.2.1. Introduction
- 12.2.2. Key Region-Specific Dynamics
- 12.2.3. Market Size Analysis and Y-o-Y Growth Analysis (%), By Service
- 12.2.4. Market Size Analysis and Y-o-Y Growth Analysis (%), By Deployment Mode
- 12.2.5. Market Size Analysis and Y-o-Y Growth Analysis (%), By Organization Size
- 12.2.6. Market Size Analysis and Y-o-Y Growth Analysis (%), By Application
- 12.2.7. Market Size Analysis and Y-o-Y Growth Analysis (%), By End-User
- 12.2.8. Market Size Analysis and Y-o-Y Growth Analysis (%), By Country
- 12.2.8.1. U.S.
- 12.2.8.2. Canada
- 12.2.8.3. Mexico
- 12.3. Europe
- 12.3.1. Introduction
- 12.3.2. Key Region-Specific Dynamics
- 12.3.3. Market Size Analysis and Y-o-Y Growth Analysis (%), By Service
- 12.3.4. Market Size Analysis and Y-o-Y Growth Analysis (%), By Deployment Mode
- 12.3.5. Market Size Analysis and Y-o-Y Growth Analysis (%), By Organization Size
- 12.3.6. Market Size Analysis and Y-o-Y Growth Analysis (%), By Application
- 12.3.7. Market Size Analysis and Y-o-Y Growth Analysis (%), By End-User
- 12.3.8. Market Size Analysis and Y-o-Y Growth Analysis (%), By Country
- 12.3.8.1. Germany
- 12.3.8.2. UK
- 12.3.8.3. France
- 12.3.8.4. Italy
- 12.3.8.5. Russia
- 12.3.8.6. Rest of Europe
- 12.4. South America
- 12.4.1. Introduction
- 12.4.2. Key Region-Specific Dynamics
- 12.4.3. Market Size Analysis and Y-o-Y Growth Analysis (%), By Service
- 12.4.4. Market Size Analysis and Y-o-Y Growth Analysis (%), By Deployment Mode
- 12.4.5. Market Size Analysis and Y-o-Y Growth Analysis (%), By Organization Size
- 12.4.6. Market Size Analysis and Y-o-Y Growth Analysis (%), By Application
- 12.4.7. Market Size Analysis and Y-o-Y Growth Analysis (%), By End-User
- 12.4.8. Market Size Analysis and Y-o-Y Growth Analysis (%), By Country
- 12.4.8.1. Brazil
- 12.4.8.2. Argentina
- 12.4.8.3. Rest of South America
- 12.5. Asia-Pacific
- 12.5.1. Introduction
- 12.5.2. Key Region-Specific Dynamics
- 12.5.3. Market Size Analysis and Y-o-Y Growth Analysis (%), By Service
- 12.5.4. Market Size Analysis and Y-o-Y Growth Analysis (%), By Deployment Mode
- 12.5.5. Market Size Analysis and Y-o-Y Growth Analysis (%), By Organization Size
- 12.5.6. Market Size Analysis and Y-o-Y Growth Analysis (%), By Application
- 12.5.7. Market Size Analysis and Y-o-Y Growth Analysis (%), By End-User
- 12.5.8. Market Size Analysis and Y-o-Y Growth Analysis (%), By Country
- 12.5.8.1. China
- 12.5.8.2. India
- 12.5.8.3. Japan
- 12.5.8.4. Australia
- 12.5.8.5. Rest of Asia-Pacific
- 12.6. Middle East and Africa
- 12.6.1. Introduction
- 12.6.2. Key Region-Specific Dynamics
- 12.6.3. Market Size Analysis and Y-o-Y Growth Analysis (%), By Service
- 12.6.4. Market Size Analysis and Y-o-Y Growth Analysis (%), By Deployment Mode
- 12.6.5. Market Size Analysis and Y-o-Y Growth Analysis (%), By Organization Size
- 12.6.6. Market Size Analysis and Y-o-Y Growth Analysis (%), By Application
- 12.6.7. Market Size Analysis and Y-o-Y Growth Analysis (%), By End-User
13. Competitive Landscape
- 13.1. Competitive Scenario
- 13.2. Market Positioning/Share Analysis
- 13.3. Mergers and Acquisitions Analysis
14. Company Profiles
- 14.1. AWS*
- 14.1.1. Company Overview
- 14.1.2. Product Portfolio and Description
- 14.1.3. Financial Overview
- 14.1.4. Key Developments
- 14.2. IBM
- 14.3. Microsoft
- 14.4. Apcera
- 14.5. Cisco
- 14.6. Docker
- 14.7. Red Hat
- 14.8. Google
- 14.9. VMWare
- 14.10. Joyent.
LIST NOT EXHAUSTIVE
15. Appendix
- 15.1. About Us and Services
- 15.2. Contact Us