
B2B決済市場:2025-2030年
B2B Payments Market: 2025-2030- 発行日
- ページ情報
- 英文
- 納期
- 即日から翌営業日
- 商品コード
- 1777931
- 翻訳ツール提供対象 PDF対応AI翻訳ツールの無料貸し出しサービスのご利用が可能です
- 通信/IT関連専門 通信/IT関連専門を専門とする市場調査会社です。
概要
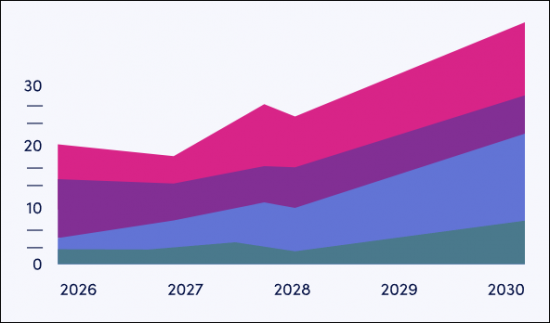
越境取引が活発化しており、関税の影響にもかかわらず、B2B決済の越境取引件数は2030年までに180億件に達する見通し
| 主要統計 | |
|---|---|
| 2025年の総取引額: | 1,870億米ドル |
| 2030年の総取引額: | 2,240億米ドル |
| 2025年から2030年の市場成長率: | 20% |
| 予測期間: | 2025-2030年 |
当調査パッケージは、B2B決済市場を包括的かつ洞察的に分析し、B2B決済プラットフォームプロバイダーから規制当局、銀行まで、ステークホルダーが今後の成長、主要動向、競合環境を理解できるよう支援します。
本調査スイートには、個別に購入できるいくつかのオプションがあります。「市場動向・戦略」には、新たな決済タイプや自動化システムなど、B2B決済における主要な進展分野の洞察に満ちた分析が含まれています。また、Juniper Researchの国別準備状況指数(Country Readiness Index)では、61の異なる地域におけるB2B決済の現状と今後の事業機会を国別に分析しています。
「データ&予測」では、今後5年間のB2B決済市場の普及と今後の成長を、越境取引と国内取引、事業規模別、決済方法別にマッピングしたデータにアクセスできます。
さらに、「競合リーダーボード」では、B2B決済分野のマーケットリーダー19社を幅広く分析し、「Future Leaders Index」では、同市場で重要な位置を占めつつある革新的企業18社を取り上げています。
レポートはすべて英語で記載されています。
サンプルビュー
市場データ&予測レポート
サンプル
市場動向と戦略レポート
市場データ&予測レポート
当調査スイートには、158の表と61,000を超えるデータポイントの予測データ一式へのアクセスが含まれています。調査スイートには以下の指標が含まれます:
- B2B決済の総数
- B2B決済の総額
- 越境決済を行う企業数
これらの指標は、以下の主要市場について提供されています:
- 国内B2B決済
- 越境B2B決済
また、このデータは以下の決済方法別に分類されています:
- 現金
- 小切手
- カード
- バーチャルカード
- 電信送金
- 即時支払い
- その他
また、このデータは中小企業、中堅企業、大企業の取引別に分かれています。
Juniper Researchのインタラクティブ予測 (Excel) には以下の機能があります:
- 統計分析:統計分析:データ期間中のすべての地域と国について表示される特定の指標を検索できます。グラフは簡単に修正でき、クリップボードへのエクスポートも可能です。
- 国別データツール:このツールでは、予測期間中のすべての地域と国の指標を見ることができます。検索バーで表示する指標を絞り込むことができます。
- 国別比較ツール:国を選択して比較することができます。このツールには、グラフをエクスポートする機能が含まれています。
- What-if分析:5つのインタラクティブなシナリオを通じて、ユーザーは予測の前提条件と比較することができます。
競合リーダーボードレポート
競合リーダーボードレポートは、2種類のベンダーポジショニングツールを通じて、大手既存ベンダーと新興の破壊的ベンダーの両方の詳細な評価と市場ポジショニングを提供します。Juniper Researchの競合リーダーボードは、19の主要B2B決済プラットフォームを能力の評価に基づいて、いくつかのグループに位置付けています。
対象ベンダーは以下の19社です:
|
|
|
また、同レポートには「Feature Leaders Index」も掲載されています。これは、B2B決済市場の支配的企業に挑戦する企業の競合上の位置づけを視覚的に表しています。
18社のイノベーターが含まれています:
|
|
|
目次
市場動向・戦略
第1章 重要ポイントと戦略的提言
- 重要ポイント
- 戦略的提言
第2章 市場情勢とセグメンテーション
- 定義と範囲
- 主な動向
- 課題
- 支払者、加盟店、PSPの一般的な課題
- 関税がもたらす課題
- ソリューションと機会
- 組み込み金融とフィンテックの統合
- サプライチェーンファイナンスと運転資本ソリューション
- リアルタイムデータと分析
- デジタルウォレットとアイデンティティ
- 協働エコシステム
- 不正防止と強化されたセキュリティ対策
- Compliance-as-a-service
- 越境B2B決済と国内B2B決済
- 国内B2B決済
- 越境B2B決済
- B2B決済チャネル
- リアルタイム決済/即時決済
- 小切手
- カード
- 即時でない銀行支払い
- ブロックチェーン決済ネットワーク
- 中央銀行デジタル通貨(CBDC)
- ステーブルコイン
- 付加価値サービス
- 請求書ファイナンス
- AP/AR自動化
- 貿易金融
- 付加価値技術
- AI
- 決済の自動化
- 不正行為検出
- FX管理と世界決済
- ブロックチェーン
- CBDC
第3章 国別準備指数
- 国別準備指数:イントロダクション
- 地域分析
- 北米
- 米国
- ラテンアメリカ
- アルゼンチン
- ブラジル
- 西欧
- EU
- 英国
- 中欧・東欧
- ポーランド
- 極東および中国
- 中国
- 日本
- インド亜大陸
- インド
- その他アジア太平洋地域
- オーストラリア
- マレーシア
- アフリカと中東
- ナイジェリア
- サウジアラビア
- 北米
競合リーダーボード
第1章 Juniper Researchの競合のリーダーボード
第2章 競合リーダーボード:企業プロファイル
- ベンダープロファイル
- ACI Worldwide
- American Express
- Banking Circle
- CGI
- Discover
- ECS Fin
- Finastra
- FIS
- Fiserv
- Flutterwave
- IBM
- Mastercard
- Montran Corporation
- Ripple
- Spendesk
- Stripe
- SWIFT
- Visa
- Wise
- Juniper Researchのリーダーボード評価手法
- 制限と解釈
第3章 Juniper ResearchのFuture Leaders Index
第4章 未来のリーダーインデックスベンダープロファイル
- ベンダープロファイル
- 3S Money
- AccessPay
- Airwallex
- Apron
- Airwallex
- Apron
- Balance
- Billie
- Brex
- Hokodo
- Jeeves
- Jeeves
- Mondu
- Billie
- Pliant
- Routable
- Sila
- Spenmo
- Juniper ResearchのFuture Leaders Index:評価手法
- 制限と解釈
- 関連調査
データ・予測
第1章 市場情勢
第2章 予測の概要
- 総量
- 合計金額
- 支払いチャネル
第3章 国内B2B決済予測
- 調査手法と仮定
- 国内予測
- 国内B2B取引件数
- 国内B2B取引額
- カード決済
- 即時支払い
- 国内決済チャネル
第4章 越境B2B決済
- 調査手法と前提
- 国境を越えた予測
- 取引件数
- 取引の価値
- 電信送金
- 越境決済チャネル
目次
'B2B Payment Cross-border Transactions to Hit 18 Billion by 2030, as Cross-border Activity Intensifies Despite Tariffs'
| KEY STATISTICS | |
|---|---|
| Total transaction value in 2025: | $187tn |
| Total transaction value in 2030: | $224tn |
| 2025 to 2030 market growth: | 20% |
| Forecast period: | 2025-2030 |
Overview
Juniper Research's "B2B Payments" research suite provides a comprehensive and insightful analysis of this market; enabling stakeholders from B2B payment platform providers to regulators and banks, to understand future growth, key trends and the competitive environment.
The research suite includes several different options that can be purchased separately. The Market Trends & Strategies element includes an insightful analysis of the key areas of progress within B2B payments, including new payment types and automation systems. Additionally, it features Juniper Research's Country Readiness Index, which provides a country-level analysis of the current and future opportunities for B2B payments in 61 different geographies.
The Data & Forecasting element includes access to data mapping the adoption and future growth of the B2B payments market over the next five years, split by cross-border versus domestic transactions, by business size and by payment method.
Additionally, the Competitor Leaderboard document features two vendor positioning models: the Competitor Leaderboard, revealing an extensive analysis of the 19 market leaders in the B2B payments space, and a Future Leaders Index; covering the 18 leading innovators who are becoming important in the market.
The coverage can also be purchased as a full research suite containing the Market Trends & Strategies, Data & Forecasting, and Competitor Leaderboard & Future Leaders Index, and a substantial discount.
Collectively, these documents provide a critical tool for understanding this important market. They allow B2B payment platform providers and payments companies to shape their future strategy; capitalising on future growth opportunities. This research suite's extensive coverage makes it a valuable tool for navigating this market.
All report content is delivered in the English language.
Key Features
- Key Takeaways & Strategic Recommendations: In-depth analysis of key development opportunities, key findings and key strategic recommendations for B2B payment platforms, cross-border payment specialists, banks, and regulators.
- Market Outlook: A breakdown of the B2B payments market by its component segments, with insight into the relative challenges of domestic and cross-border payments. It also examines, in detail, a range of payment types. Value-added services are analysed; assessing their place in the market and what businesses are looking for from these services. The research examines key emerging technologies in the B2B payments market, how they are used in the market, and how they will affect the market in the future. A Country Readiness Index is also included; assessing growth prospects for B2B payments across 61 key countries.
- Benchmark Industry Forecasts: Extensive forecasts for the number and value of B2B payments, split by domestic and cross-border. This is further split by payment channel (cash, cheque, card, virtual card, wire transfer, instant payment, and other means) and by business size (small, medium, and large).
- Juniper Research Competitor Leaderboard & Future Leaders Index: Key player capability and capacity assessment for 19 B2B payment platforms, via the Juniper Research Competitor Leaderboard. The study also contains a Future Leaders Index; positioning 18 key emerging players shaking up the B2B payments market.
SAMPLE VIEW
Market Data & Forecasting Report
The numbers tell you what's happening, but our written report details why, alongside the methodologies.
SAMPLE VIEW
Market Trends & Strategies Report
A comprehensive analysis of the current market landscape, alongside strategic recommendations.
Market Data & Forecasting Report
The market-leading research suite for the "B2B Payments" market includes access to the full set of forecast data of 158 tables and over 61,000 datapoints. Metrics in the research suite include:
- Total Number of B2B Payments
- Total Value of B2B Payments
- Number of Businesses Making Cross-border Payments
These metrics are provided for the following key market verticals:
- Domestic B2B Payments
- Cross-border B2B Payments
This data is also split by the following payment methods:
- Cash
- Cheque
- Card
- Virtual Card
- Wire Transfer
- Instant Payment
- Other Means
The data is also split by transactions being made by small, medium, and large businesses.
Juniper Research Interactive Forecast Excel contains the following functionality:
- Statistics Analysis: Users benefit from the ability to search for specific metrics, displayed for all regions and countries across the data period. Graphs are easily modified and can be exported to the clipboard.
- Country Data Tool: This tool enables users to look at metrics for all regions and countries in the forecast period. Users can refine the metrics displayed via a search bar.
- Country Comparison Tool: Users can select and compare countries. The ability to export graphs is included in this tool.
- What-if Analysis: Here, users can compare forecast metrics against their own assumptions, via 5 interactive scenarios.
Market Trends & Strategies Report
This report examines the "B2B Payments" market landscape in detail; assessing market trends and factors shaping the evolution of this growing market. The report delivers comprehensive analysis of the strategic opportunities in the B2B payments landscape; assessing key market segments, including real-time payments, A2A payments, credit card and debit cards, virtual cards, and other digital payment methods. It also examines their challenges and opportunities, such as the impact of the Trump Administration's tariffs and other economic policies. The report includes evaluation of key country-level opportunities for B2B payments growth; looking at the unique nature of individual B2B payment markets, from new real-time payment rails to the emergence of stablecoins for cross-border transactions.
Competitor Leaderboard Report
The Competitor Leaderboard report provides a detailed evaluation and market positioning for both the larger, established vendors, as well as for the newer, emerging disruptors: via two different vendor positioning tools. The Juniper Research Competitor Leaderboard offers coverage of 19 leading B2B payment platforms; positioning them as established leaders, leading challengers, or disruptors and challengers, based on capacity and capability assessments.
The 19 vendors included are:
|
|
|
The document also features a Feature Leaders Index. The Juniper Research Future Leaders Index provides a visual representation of the competitive positioning of companies in the B2B payments market which are challenging dominant players.
The 18 innovators included are:
|
|
|
Together, the Competitor Leaderboard and the Future Leaders Index give a comprehensive guide to the competitive landscape within B2B payments; providing an important resource for stakeholders.
Table of Contents
Market Trends & Strategies
1. Key Takeaways & Strategic Recommendations
- 1.1. Key Takeaways
- 1.2. Strategic Recommendations
2. Market Landscape & Segmentation
- 2.1. Introduction
- 2.1.1. The Context
- 2.2. Definition & Scope
- 2.3 Key Trends
- 2.3.1. Electronic Payments Increasingly Replacing Paper Cheques
- 2.3.2. Embedded Finance Drives Efficiency and Growth
- 2.3.3. Shift to Real-time Payments
- 2.3.4. A2A (Account-to-account) Payments
- 2.3.5. Pay by Bank and Instant Payments
- 2.3.6. Rise of Virtual Cards
- 2.3.7. Rising Levels of Automation
- 2.4. Challenges
- 2.4.1. General Challenges for Payers, Merchants and PSPs
- i. Fragmented Payment Workflows & Reconciliation Complexity
- ii. Payment Delays
- iii. Lack of Transparency
- iv. Cybersecurity & Fraud Risk
- v. Regulatory Compliance
- vi. Resistance to Technology Adoption
- 2.4.1. General Challenges for Payers, Merchants and PSPs
- 2.5. Challenges Induced by Tariffs
- Table 2.1: Impact of Tariffs for B2B Payment Stakeholders
- Figure 2.2: Impact of Tariffs for B2B Payment Stakeholders
- i. The Domestic Impact of Tariffs
- ii. Cross-border Impact of Tariffs
- 2.6. Solutions & Opportunities
- 2.6.1. Embedded Finance & Fintech Integration
- 2.6.2. Supply Chain Financing & Working Capital Solutions
- i. Enhanced Cashflow Management
- ii. Flexible Payment Options
- 2.6.3. Real-time Data & Analytics
- i. Services Consolidation
- 2.6.4. Digital Wallets and Identity
- 2.6.5. Collaborative Ecosystems
- 2.6.6. Fraud Prevention & Enhanced Security Measures
- 2.6.7. Compliance-as-a-service
- 2.7. Cross-border Versus Domestic B2B Payments
- 2.7.1. Domestic B2B Payments
- i. Automation
- ii. Data-driven Payment Decisions
- 2.7.2. Cross-border B2B Payments
- i. Seamless Cross-border Transactions
- ii. Interoperability
- 2.7.1. Domestic B2B Payments
- 2.8. B2B Payments Channels
- 2.8.1. Real-time Payments/Instant Payments
- 2.8.2. Cheques
- 2.8.3. Cards
- i. Corporate Cards
- ii. Virtual Cards
- 2.8.4. Non-instant Bank Payments
- 2.8.5. Blockchain Payment Networks
- 2.8.6. Central Bank Digital Currencies (CBDCs)
- 2.8.7. Stablecoins
- 2.9. Value-added Services
- 2.9.1. Invoice Financing
- 2.9.2. AP/AR Automation
- 2.9.3. Trade Financing
- 2.10. Value-added Technologies
- 2.10.1. AI
- 2.10.2. Payment Automation
- 2.10.3. Fraud Detection
- 2.10.4. FX Management and Global Payments
- 2.10.5. Blockchain
- 2.10.6. CBDCs
3. Country Readiness Index
- 3.1. Introduction to the Country Readiness Index
- Figure 3.1: Juniper Research's Country Readiness Index Scoring Criteria: B2B Payments
- Figure 3.2: Juniper Research Country Readiness Index: B2B Payments
- Figure 3.3: B2B Payments Country Readiness Index: Market Segments
- 3.2. Regional Analysis
- 3.2.1. North America
- i. US
- 3.2.2. Latin America
- i. Argentina
- ii. Brazil
- 3.2.3. West Europe
- i. EU
- ii. UK
- 3.2.4. Central & East Europe
- i. Poland
- 3.2.5. Far East & China
- i. China
- ii. Japan
- 3.2.6. Indian Subcontinent
- i. India
- 3.2.7. Rest of Asia Pacific
- i. Australia
- ii. Malaysia
- 3.2.8. Africa & Middle East
- i. Nigeria
- ii. Saudi Arabia
- Figure 3.4: Juniper Research's Country Readiness Index Heatmap: North America
- Figure 3.5: Juniper Research's Country Readiness Index Heatmap: Latin America
- Figure 3.6: Juniper Research's Country Readiness Index Heatmap: West Europe60
- Figure 3.7: Juniper Research's Country Readiness Index Heatmap: Central and East Europe
- Figure 3.8: Juniper Research's Country Readiness Index Heatmap: Far East & China
- Figure 3.9: Juniper Research's Country Readiness Index Heatmap: Indian Subcontinent
- Figure 3.10: Juniper Research's Country Readiness Index Heatmap: Rest of Asia Pacific
- Figure 3.11: Juniper Research's Country Readiness Index Heatmap: Africa and Middle East
- 3.2.1. North America
Competitor Leaderboard
1. Juniper Research Competitor Leaderboard
- 1.1. Why Read This Report
- Table 1.1: Juniper Research's Competitor Leaderboard: B2B Payments Vendors Included & Product Portfolio
- Figure 1.2: Juniper Research's Competitor Leaderboard for B2B Payments
- Table 1.3: Juniper Research B2B Payments Vendors & Positioning
- Table 1.4: Juniper Research's Competitor Leaderboard Heatmap B2B Payments Vendors (Part 1 of 2)
- Table 1.4: Juniper Research's Competitor Leaderboard Heatmap B2B Payments Vendors (Part 2 of 2)
2. Competitor Leaderboard Company Profiles
- 2.1. Vendor Profiles
- 2.1.1. ACI Worldwide
- i. Corporate
- Table 2.1: ACI Worldwide's Financial Snapshot ($m), 2022-2024
- ii. Geographical Spread
- iii. Key Clients & Strategic Partnerships
- iv. High-level View of Offerings
- v. Juniper Research's View: Key Strengths & Strategic Development Opportunities
- i. Corporate
- 2.1.2. American Express
- i. Corporate
- Table 2.2: American Express' Financial Snapshot ($m), 2022-2024
- ii. Geographical Spread
- iii. Key Clients & Strategic Partnerships
- iv. High-level View of Offerings
- v. Juniper Research's View: Key Strengths & Strategic Development Opportunities
- i. Corporate
- 2.1.3. Banking Circle
- i. Corporate
- ii. Geographical Spread
- iii. Key Clients & Strategic Partnerships
- iv. High-level View of Offerings
- v. Juniper Research's View: Key Strengths & Strategic Development Opportunities
- 2.1.4. CGI
- i. Corporate
- Table 2.3: CGI's Financial Snapshot ($m), 2022-2024
- ii. Geographical Spread
- iii. Key Clients & Strategic Partnerships
- iv. High-level View of Offerings
- Figure 2.4: CGI's All Payments Solution
- v. Juniper Research's View: Key Strengths & Strategic Development Opportunities
- i. Corporate
- 2.1.5. Discover
- i. Corporate
- Table 2.5: Discover's Financial Snapshot ($m), 2022-2024
- ii. Geographical Spread
- iii. Key Clients & Strategic Partnerships
- iv. High-level View of Offerings
- v. Juniper Research's View: Key Strengths & Strategic Development Opportunities
- i. Corporate
- 2.1.6. ECS Fin
- i. Corporate
- ii. Geographical Spread
- iii. Key Clients & Strategic Partnerships
- iv. High-level View of Offerings
- v. Juniper Research's View: Key Strengths & Strategic Development Opportunities
- 2.1.7. Finastra
- i. Corporate
- ii. Geographical Spread
- iii. Key Clients & Strategic Partnerships
- iv. High-level View of Offerings
- v. Juniper Research's View: Key Strengths & Strategic Development Opportunities
- 2.1.8. FIS
- i. Corporate
- Figure 2.6: FIS' Financial Snapshot ($m), 2022-2024
- ii. Geographical Spread
- iii. Key Clients & Strategic Partnerships
- iv. High-level View of Offerings
- v. Juniper Research's View: Key Strengths & Strategic Development Opportunities
- i. Corporate
- 2.1.9. Fiserv
- i. Corporate
- Table 2.7: Fiserv's Financial Snapshot ($m), 2022-2024
- ii. Geographical Spread
- iii. Key Clients & Strategic Partnerships
- iv. High-level View of Offerings
- v. Juniper Research's View: Key Strengths & Strategic Development Opportunities
- i. Corporate
- 2.1.10. Flutterwave
- i. Corporate
- Table 2.8: Flutterwave's Rounds of Funding ($m), 2017-2022
- ii. Geographical Spread
- iii. Key Clients & Strategic Partnerships
- iv. High-level View of Offerings
- v. Juniper Research's View: Key Strengths & Strategic Development Opportunities
- i. Corporate
- 2.1.11. IBM
- i. Corporate
- Table 2.9: IBM's Financial Snapshot ($m), 2022-2024
- ii. Geographical Spread
- iii. Key Clients & Strategic Partnerships
- iv. High-level View of Offerings
- v. Juniper Research's View: Key Strengths & Strategic Development Opportunities
- i. Corporate
- 2.1.12. Mastercard
- i. Corporate
- Table 2.10: Mastercard's Financial Snapshot ($m), 2022-2024
- ii. Geographical Spread
- iii. Key Clients & Strategic Partnerships
- iv. High-level View of Offerings
- v. Juniper Research's View: Key Strengths & Strategic Development Opportunities
- i. Corporate
- 2.1.13. Montran Corporation
- i. Corporate
- ii. Geographical Spread
- iii. Key Clients & Strategic Partnerships
- iv. High-level View of Offerings
- v. Juniper Research's View: Key Strengths & Strategic Development Opportunities
- 2.1.14. Ripple
- i. Corporate
- Figure 2.11: Ripple's Funding Rounds ($m), 2015-2019
- ii. Geographical Spread
- iii. Key Clients & Strategic Partnerships
- iv. High-level View of Offerings
- Figure 2.12: How Ripple's Cross-border Payments Work
- v. Juniper Research's View: Key Strengths & Strategic Development Opportunities
- i. Corporate
- 2.1.15. Spendesk
- i. Corporate
- Table 2.13: Spendesk's Funding Rounds ($m), 2017-2022
- ii. Geographical Spread
- iii. Key Clients & Strategic Partnerships
- iv. High-level View of Offerings
- v. Juniper Research's View: Key Strengths & Strategic Development Opportunities
- i. Corporate
- 2.1.16. Stripe
- i. Corporate
- Table 2.14: Stripe's Funding Rounds ($m), 2019-2023
- ii. Geographical Spread
- iii. Key Clients & Strategic Partnerships
- iv. High-level View of Offerings
- v. Juniper Research's View: Key Strengths & Strategic Development Opportunities
- i. Corporate
- 2.1.17. SWIFT
- i. Corporate
- Table 2.15: SWIFT's Financial Snapshot ($m), 2021-2023
- ii. Geographical Spread
- iii. Key Clients & Strategic Partnerships
- iv. High-level View of Offerings
- v. Juniper Research's View: Key Strengths & Strategic Development Opportunities
- i. Corporate
- 2.1.18. Visa
- i. Corporate
- Table 2.16: Visa's Financial Snapshot ($m), 2022-2024
- ii. Geographical Spread
- iii. Key Clients & Strategic Partnerships
- iv. High-level View of Offerings
- Figure 2.17: How Visa B2B Connect Works
- v. Juniper Research's View: Key Strengths & Strategic Development Opportunities
- i. Corporate
- 2.1.19. Wise
- i. Corporate
- Figure 2.18: Wise's Financial Snapshot ($m), 2022-2024
- ii. Geographical Spread
- iii. Key Clients & Strategic Partnerships
- iv. High-level View of Offerings
- v. Juniper Research's View: Key Strengths & Strategic Development Opportunities
- i. Corporate
- 2.1.1. ACI Worldwide
- 2.2. Juniper Research Competitor Leaderboard Assessment Methodology
- 2.2.1. Limitations & Interpretations
- Table 2.19: Juniper Research's Competitor Leaderboard Scoring Criteria - B2B Payments
- 2.2.1. Limitations & Interpretations
3. Juniper Research Future Leaders Index
- Table 3.1: Juniper Research Future Leaders Index - B2B Payments Vendors & Product Portfolio
- Figure 3.2: Juniper Research Future Leaders Index - B2B Payments
- Table 3.3: Juniper Research Future Leaders Index Ranking - B2B Payments
- Table 3.4: Juniper Research Future Leaders Index - B2B Payments Heatmap
4. Future Leaders Index Vendor Profiles
- 4.1. Vendor Profiles
- 4.1.1. 3S Money
- i. Corporate
- ii. Geographical Spread
- iii. Key Clients & Strategic Partnerships
- iv. High-level View of Offerings
- v. Juniper Research's View: Key Strengths & Strategic Development Opportunities
- 4.1.2. AccessPay
- i. Corporate
- ii. Geographical Spread
- iii. Key Clients & Strategic Partnerships
- iv. High-level View of Offerings
- v. Juniper Research's View: Key Strengths & Strategic Development Opportunities
- 4.1.3. Airwallex
- i. Corporate
- Table 4.1: Airwallex's Rounds of Funding ($m), 2018-2025
- ii. Geographical Spread
- iii. Key Clients & Strategic Partnerships
- iv. High level View of Offerings
- v. Juniper Research's View: Key Strengths & Strategic Development Opportunities
- i. Corporate
- 4.1.4. Apron
- i. Corporate
- ii. Geographical Spread
- iii. Key Clients & Strategic Partnerships
- iv. High-level View of Offerings
- v. Juniper Research's View: Key Strengths & Strategic Development Opportunities
- 4.1.5. Aria
- i. Corporate
- ii. Geographical Spread
- iii. Key Clients & Strategic Partnerships
- iv. High-level View of Offerings
- v. Juniper Research's View: Key Strengths & Strategic Development Opportunities
- 4.1.6. Autobooks
- i. Corporate
- ii. Geographical Spread
- iii. Key Clients & Strategic Partnerships
- iv. High-level View of Offerings
- v. Juniper Research's View: Key Strengths & Strategic Development Opportunities
- 4.1.7. Balance
- i. Corporate
- ii. Geographical Spread
- iii. Key Clients & Strategic Partnerships
- iv. High-level View of Offerings
- v. Juniper Research's View: Key Strengths & Strategic Development Opportunities
- 4.1.8. Billie
- i. Corporate
- ii. Geographical Spread
- iii. Key Clients & Strategic Partnerships
- iv. High-level View of Offerings
- v. Juniper Research's View: Key Strengths & Strategic Development Opportunities
- 4.1.9. Brex
- i. Corporate
- Table 4.2: Brex's Funding Rounds ($m), 2018-2022
- ii. Geographical Spread
- iii. Key Clients & Strategic Partnerships
- iv. High-level View of Offerings
- v. Juniper Research's View: Key Strengths & Strategic Development Opportunities
- i. Corporate
- 4.1.10. Hokodo
- i. Corporate
- ii. Geographical Spread
- iii. Key Clients & Strategic Partnerships
- iv. High-level View of Offerings
- v. Juniper Research's View: Key Strengths & Strategic Development Opportunities
- 4.1.11. Jeeves
- i. Corporate
- ii. Geographical Spread
- iii. Key Clients & Strategic Partnerships
- iv. High-level View of Offerings
- v. Juniper Research's View: Key Strengths & Strategic Development Opportunities
- 4.1.12. Modulr
- i. Corporate
- ii. Geographical Spread
- iii. Key Clients & Strategic Partnerships
- iv. High-level View of Offerings
- v. Juniper Research's View: Key Strengths & Strategic Development Opportunities
- 4.1.13. Mondu
- i. Corporate
- ii. Geographical Spread
- iii. Key Clients & Strategic Partnerships
- iv. High-level View of Offerings
- v. Juniper Research's View: Key Strengths & Strategic Development Opportunities
- 4.1.14. Paytron
- i. Corporate
- ii. Geographical Spread
- iii. Key Clients & Strategic Partnerships
- iv. High-level View of Offerings
- v. Juniper Research's View: Key Strengths & Strategic Development Opportunities
- 4.1.15. Pliant
- i. Corporate
- Table 4.3: Pliant's Rounds of Funding ($m), 2021-2025
- ii. Geographical Spread
- iii. Key Clients & Strategic Partnerships
- High-level View of Offerings
- iv. Juniper Research's View: Key Strengths & Strategic Development Opportunities
- i. Corporate
- 4.1.16. Routable
- i. Corporate
- ii. Geographical Spread
- iii. Key Clients & Strategic Partnerships
- iv. High-level View of Offerings
- v. Juniper Research's View: Key Strengths & Strategic Development Opportunities
- 4.1.17. Sila
- i. Corporate
- ii. Geographical Spread
- iii. Key Clients & Strategic Partnerships
- iv. High-level View of Offerings
- v. Juniper Research's View: Key Strengths & Strategic Development Opportunities
- 4.1.18. Spenmo
- i. Corporate
- ii. Geographical Spread
- iii. Key Clients & Strategic Partnerships
- iv. High-level View of Offerings
- v. Juniper Research's View: Key Strengths & Strategic Development Opportunities
- 4.1.1. 3S Money
- 4.2. Juniper Research Future Leaders Index Assessment Methodology
- 4.3. Limitations & Interpretations
- Table 4.5: Juniper Research Future Leaders Index: B2B Payments Criteria
- 4.4. Related Research
Data & Forecasting
1. Market Landscape
- 1.1. Introduction
- 1.2. Definitions
- Figure 1.1: Juniper Research's 8 Key Regions - Definition
2. Forecast Overview
- 2.1. Total Volume
- Figure & Table 2.1: Total Volume of B2B Payments (m), Split by 8 Key Regions, 2025-2030
- 2.2. Total Value
- Figure & Table 2.2: Total Value of B2B Payments ($m), Split by 8 Key Regions, 2025-2030
- 2.3. Payment Channel
- Figure & Table 2.3: Total Value of B2B Payments ($m), Split by Payment Channel, 2025-2030
3. Domestic B2B Payments Forecast
- 3.1. Introduction
- 3.2. Methodology and Assumptions
- Figure 3.1: B2B Domestic Payments Market - Forecast Methodology
- 3.3. Domestic Forecasts
- 3.3.1. Number of Domestic B2B Transactions
- Figure & Table 3.2: Number of Domestic B2B Payments per annum (m), Split by 8 Key Regions, 2025-2030
- 3.3.2. Value of Domestic B2B Transactions
- Figure & Table 3.3: Total Value of B2B Domestic Payments ($m), Split by 8 Key Regions, 2025-2030
- 3.3.3. Card Payments
- Figure & Table 3.4: Total Value of Domestic B2B Payments via Card ($m), Split by 8 Key Regions, 2025-2030
- 3.3.4. Instant Payments
- Figure & Table 3.5: Total Value of Domestic B2B Payments via Instant Payments ($m), Split by 8 Key Regions, 2025-2030
- 3.3.5. Domestic Payment Channels
- Figure & Table 3.6: Total Value of Domestic B2B Payments ($m), Split by Payment Channel, 2025-2030
- 3.3.1. Number of Domestic B2B Transactions
4. Cross-border B2B Payments
- 4.1. Introduction
- 4.2. Methodology & Assumptions
- Figure 4.1: B2B Cross-border B2B Payments - Forecast Methodology
- 4.3. Cross-border Forecasts
- 4.3.1. Number of Transactions
- Figure & Table 4.2: Total Number of Outflow Cross-border B2B Payments per annum (m), Split by 8 Key Regions, 2025-2030
- 4.3.2. Value of Transactions
- Figure & Table 4.3: Total Value of Cross-border Outflow Payments ($m), Split by 8 Key Regions, 2025-2030
- 4.3.3. Wire Transfer
- Figure & Table 4.4: Total Value of Cross-border Payments via Wire Transfer ($m), Split by 8 Key Regions, 2024-2030
- 4.3.4. Cross-border Payments Channels
- Figure & Table 4.5: Total Value of Cross-border B2B Payments ($m), Split by Payments Channel, 2025-2030
- 4.3.1. Number of Transactions
- 発行日
- 発行
- Juniper Research Ltd
- ページ情報
- 英文
- 納期
- 即日から翌営業日