|
|
市場調査レポート
商品コード
1730125
mPOS端末およびソフトPOSの世界市場:2025-2030年Global mPOS Terminals & Soft POS Market: 2025-2030 |
||||||
|
|||||||
| mPOS端末およびソフトPOSの世界市場:2025-2030年 |
|
出版日: 2025年05月27日
発行: Juniper Research Ltd
ページ情報: 英文
納期: 即日から翌営業日
|
全表示
- 概要
- 目次
"ソフトPOSの取引額は2030年にかけて2,150%の成長率で加速:小規模事業者にとってのOn-the-go取引を再定義"
| 主要統計 | |
|---|---|
| 2030年のmPOS端末の総取引額: | 49億米ドル |
| 2030年のソフトPOS端末の総取引額: | 5,400億米ドル |
| 2025年から2030年のソフトPOS市場の成長率: | 2,150% |
| 予測期間: | 2025-2030年 |
概要
当調査スイートは、mPOS端末およびソフトPOSの市場の詳細かつ洞察に満ちた分析を提供し、POSハードウェアメーカー、決済インフラプロバイダー、ソフトウェア開発者、ホスピタリティおよび小売業者などのステークホルダーが、今後の成長、主要動向、競合環境を理解することを可能にします。
当スイートには、POSの今後の成長をマッピングするデータへのアクセス、市場の最新動向と機会を明らかにする直感的な調査、mPOS端末およびソフトPOS分野の27の市場リーダーに関する広範な分析を含む文書などが含まれています。その比類のない網羅性により、当調査スイートは、このような高成長市場の将来を描くための非常に有用なリソースとなっています。
主な特徴
- 市場力学:市場情勢を幅広く洞察し、様々な形態のPOSとその具体的な使用事例を分析しています。また、ソフトPOSがmPOSに与える脅威と、スマートPOSシステムに組み込まれ強化された機能がこの脅威を軽減するのにどのように役立つかを評価しています。本レポートにはセグメント分析が含まれており、6つの異なる業界セグメントにおいてmPOS端末とソフトPOSが直面する機会と課題を分析しています。本レポートは、mPOSおよびソフトPOSベンダーにとって高成長市場と潜在的な地域を特定する国別準備指数で締めくくられています。
- 主な要点と戦略的提言:POS市場における主要な開発機会と主な発見を詳細に分析し、ステークホルダーに向けた主要な戦略的提言も掲載しています。
- ベンチマーク業界予測:POSの導入と使用に関する5カ年の市場予測を掲載し、POSの6つの異なるタイプ (専用POS、非接触POS、mPOS、生体認証POS、スマートPOS、ソフトPOS) のインストールベース、取引数、取引額の内訳が含まれています。予測にはPOSソフトウェアシステムの採用と収益も含まれています。
- Juniper Researchの競合リーダーボード:主要POSベンダー27社の能力を評価しています。
サンプルビュー
市場データ&予測レポート
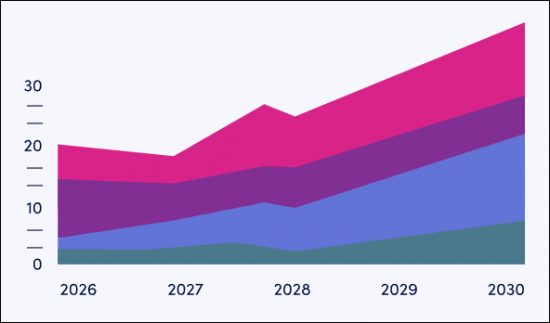
サンプル
市場動向・戦略レポート
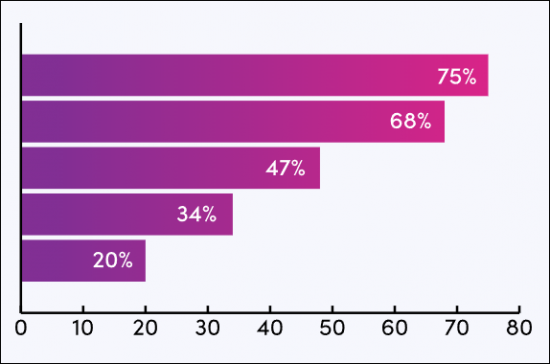
市場データ&予測レポート
POS端末市場の市場をリードする調査スイートには、101の表と46,000を超えるデータポイントの予測データ一式へのアクセスが含まれています。調査スイートには以下の指標が含まれます:
- POS端末の総インストールベース
- POS取引総数
- POS取引総額
これらの指標は、以下の主要市場について提供されています:
- 専用POS
- 非接触POS
- mPOS
- バイオメトリックPOS
- スマートPOS
- ソフトPOS
Juniper Researchのインタラクティブ予測 (Excel) には以下の機能があります:
- 統計分析:データ期間中のすべての地域と国について表示され、特定の指標を検索することができます。グラフは簡単に変更でき、クリップボードにエクスポートできます。
- 国別データツール:このツールでは、予測期間中のすべての地域と国の指標を見ることができます。検索バーで表示される指標を絞り込むことができます。
- 国別比較ツール:国を選択して比較することができます。このツールには、グラフをエクスポートする機能が含まれています。
- What-if分析:5つのインタラクティブなシナリオで、予測指標を独自の前提条件と比較することができます。
市場動向・戦略レポート
当レポートでは、mPOS端末およびソフトPOS市場の動向を詳細に調査し、この急成長市場の進化を形成する市場動向と要因を評価しています。mPOS端末およびソフトPOSベンダーにとっての戦略的機会を包括的に分析し、主要な業種と開発課題、ステークホルダーはこれらをどのように乗り切るべきかを取り上げています。
目次
市場動向と戦略
第1章 重要ポイント・戦略的提言
- 重要ポイント
- 戦略的提言
第2章 市場サマリー
- イントロダクション
- 定義と範囲
- 専用POS
- mPOS
- 非接触POS
- スマートPOS
- 生体認証POS
- 顔スキャン
- 指紋認識
- 手のひら認識
- 新たな生体認証
- 虹彩
- 網膜
- 静脈パターン認識
- 生体認証の課題
- セキュリティとプライバシーに関する懸念
- 実施上の課題
- ユーザーエクスペリエンスの問題
- 運用上および財務上の障壁
- ソフトPOS
- さまざまなPOSのユースケース
- 促進要因と制約
- 代替キャッシュレス社会
- 生体認証POS市場
- 消費者の購買行動の進化
- 強化された機能
- スマートPOS:激化する競合への解決策
- ソフトPOS
- イントロダクション
- 市場情勢
- 専用POSとモバイルPOSへの脅威
- ソフトPOSが直面する課題
- 将来の見通し
第3章 セグメント分析
- セグメント分析の情勢
- ホスピタリティ&ダイニング
- 旅行・輸送
- クイックサービスレストラン
- 燃料・無人
- 中小企業・専門サービス
- イベント・スタジアム
第4章 国別準備指数と地域分析
- 国別準備指数
- 注目市場
- 成長市場
- 新興国市場
- 飽和市場
競合リーダーボード
第1章 Juniper ResearchのPOS端末競合リーダーボード
第2章 mPOS:競合リーダーボード
- mPOSベンダープロファイル
- Epos Now
- Fiserv
- Global Payments
- Lightspeed
- Mswipe
- NEXGO
- Newland NPT
- PAX
- PayPal
- Posiflex
- Square (Block)
- SumUp
- Toast
- Verifone
- Worldline
- 評価手法
- 制限と解釈
第3章 ソフトPOS競合のリーダーボード
- ソフトPOSベンダーのプロファイル
- alcineo
- Apple
- CM.com
- Fiserv
- MagicCube
- Mypinpad
- Paypal
- Payten
- Square
- Stripe
- Tidypay
- Wizzit
- Worldline
- Worldpay
- 調査手法
- 評価手法
- 制限と解釈
- 関連調査
データと予測
第1章 市場予測
第2章 市場サマリー
- POS端末市場
- インストールベース
- 取引数
- 取引額
第3章 非接触POS
- インストールベース
- 取引数
- 取引額
第4章 mPOS
- インストールベース
- 取引額
第5章 ソフトPOS
- インストールベース
- 取引数
- 取引額
'Soft POS Transactions to Accelerate by 2,150% in Value by 2030; Redefining On-the-go Transactions for Small Businesses'
| KEY STATISTICS | |
|---|---|
| Total mPOS terminal transaction value in 2030: | $4.9tn |
| Total soft POS terminal transaction value in 2030: | $540 bn |
| 2025 to 2030 soft POS market growth: | 2150% |
| Forecast period: | 2025-2030 |
Overview
Our "mPOS Terminals & Soft POS" market research suite provides detailed and insightful analysis of this evolving market; enabling stakeholders, from POS hardware manufacturers, payment infrastructure providers, software developers, and hospitality and retail vendors, to understand future growth, key trends and the competitive environment.
The suite includes several different options that can be purchased separately, including access to data mapping the future growth of POS, an intuitive study uncovering the latest trends and opportunities within the market, and a document containing extensive analysis of the 27 market leaders within the mPOS terminals & soft POS space. The coverage can also be purchased as a Full Research Suite, containing all these elements, and including a substantial discount.
Collectively, they provide a critical tool for understanding this rapidly emerging market; allowing POS manufacturers and technology vendors to shape their future strategy. Its unparalleled coverage makes this research suite an incredibly useful resource for charting the future of such a high-growth market.
All report content is delivered in the English language.
Key Features
- Market Dynamics: Extensive insight into the market landscape; analysing the various forms of POS and their specific use cases. This section also assesses the threat that soft POS poses to mPOS, as well as how the enhanced features embedded within smart POS systems can help alleviate this threat. The report includes a segment analysis which looks at the opportunities and challenges faced by mPOS terminals and soft POS across six distinct industry segments. This document concludes with a Country Readiness Index, which identifies high-growth markets and potential regions for mPOS & soft POS vendors.
- Key Takeaways & Strategic Recommendations: In-depth analysis of key development opportunities and key findings within the POS market, accompanied by key strategic recommendations for stakeholders.
- Benchmark Industry Forecasts: 5-year market forecasts for POS adoption and use, including a breakdown of the installed base, transaction volume, and transaction value for the six different types of POS: dedicated POS, contactless POS, mPOS, biometric POS, smart POS and soft POS. The forecast also contains adoption and revenue for POS software systems.
- Juniper Research Competitor Leaderboard: Key player capability and capacity assessment for 27 POS vendors, via two Juniper Research Competitor Leaderboard; separating mPOS and soft POS.
SAMPLE VIEW
Market Data & Forecasting Report

The numbers tell you what's happening, but our written report details why, alongside the methodologies.
Pic.SAMPLE VIEW
Market Trends & Strategies Report

A comprehensive analysis of the current market landscape, alongside strategic recommendations.
Market Data & Forecasting Report
The market-leading research suite for the POS Terminals market includes access to the full set of forecast data of 101 tables and over 46,000 datapoints. Metrics in the research suite include:
- Total POS Terminals Installed Base
- Total POS Transaction Volume
- Total POS Transaction Value
These metrics are provided for the following key market verticals:
- Dedicated POS
- Contactless POS
- mPOS
- Biometric POS
- Smart POS
- Soft POS
Juniper Research Interactive Forecast Excel contains the following functionality:
- Statistics Analysis: Users benefit from the ability to search for specific metrics, displayed for all regions and countries across the data period. Graphs are easily modified and can be exported to the clipboard.
- Country Data Tool: This tool lets users look at metrics for all regions and countries in the forecast period. Users can refine the metrics displayed via a search bar.
- Country Comparison Tool: Users can select countries and compare countries. The ability to export graphs is included in this tool.
- What-if Analysis: Here, users can compare forecast metrics against their own assumptions, featuring 5 interactive scenarios.
Market Trends & Strategies Report
This report examines the "mPOS Terminals & Soft POS" market landscape in detail; assessing market trends and factors shaping the evolution of this rapidly growing market. The report delivers comprehensive analysis of the strategic opportunities for mPOS terminals & soft POS vendors; addressing key verticals and developing challenges, and how stakeholders should navigate these. It also includes evaluation of key country-level opportunities for POS vendors.
Competitor Leaderboard Report
The Competitor Leaderboard report provides a detailed evaluation and market positioning for 27 leading vendors in the "mPOS Terminals & Soft POS" space split into two Competitor Leaderboards, one for traditional and one for soft POS. The vendors are positioned either as an established leader, leading challenger, or disruptor and challenger, based on capacity and capability assessments.
Juniper Research Competitor Leaderboard for mPOS:
|
|
Juniper Research Competitor Leaderboard for soft POS:
|
|
This document is centred around the Juniper Research Competitor Leaderboard; a vendor positioning tool that provides an at-a-glance view of the competitive landscape in a market, backed by a robust methodology.
Table of Contents
Market Trends & Strategies
1. Key Takeaways & Strategic Recommendations
- 1.1. Key Takeaways
- 1.2. Strategic Recommendations
2. Market Summary
- 2.1. Introduction
- 2.1.1. Definitions and Scope
- Figure 2.1: Types of POS
- 2.1.2. Dedicated POS
- 2.1.3. mPOS
- 2.1.4. Contactless POS
- Figure 2.2: Different POS Technologies
- 2.1.5. Smart POS
- Figure 2.3: Smart POS
- 2.1.6. Biometric POS
- Figure 2.4: Biometric POS Scanning Capabilities
- i. Face Scanning
- ii. Fingerprint Recognition
- iii. Palm Recognition
- 2.1.7. Emerging Biometrics
- i. Iris
- ii. Retina
- iii. Vein Pattern Recognition
- 2.1.8. Biometrics Challenges
- i. Security and Privacy Concerns
- ii. Implementation Challenges
- iii. User Experience Issues
- iv. Operational and Financial Barriers
- 2.1.9. Soft POS
- Figure 2.5: How to Use Soft POS
- 2.1.1. Definitions and Scope
- 2.2. Use Cases for Various POS
- 2.2.1. Superstores and Large Retailers
- i. QR Codes
- 2.2.2. Small Sum Fixed Point Transaction Environments
- 2.2.3. Mobile Retail Environments
- 2.2.1. Superstores and Large Retailers
- 2.3. Drivers and Constraints
- 2.3.1. Alternative Cashless Society
- 2.3.2. Biometric POS Markets
- 2.3.3. Evolving Consumer Shopping Behaviour
- 2.3.4. Enhanced Features
- 2.3.5. Smart POS: The Solution to Increasing Competition
- Figure 2.6: Smart POS Business Integrations
- i. Inventory Management
- ii. CRM and Loyalty Programmes
- iii. eCommerce Integration
- iv. Employee Management
- v. Data and Analytics
- vi. Integrated Payment Processing
- 2.4. Soft POS
- i. Introduction
- Figure 2.7: Global Soft POS Transaction Volume ($m), Split by 8 Key Regions, 2025-2030
- 2.4.2. Market Landscape
- 2.4.3. Threat to Dedicated POS and Mobile POS
- 2.4.4. Challenges Facing Soft POS
- 2.4.5. Future Outlook
- i. Introduction
3. Segment Analysis
- 3.1. Segment Analysis Landscape
- Figure 3.1: POS Terminals' Key Leading and High-potential Industry Segments
- 3.1.1. Hospitality & Dining
- i. Opportunities
- ii. Challenges
- 3.1.2. Travel & Transportation
- i. Opportunities
- ii. Challenges
- 3.1.3. Quick-service Restaurants
- i. Opportunities
- ii. Challenges
- 3.1.4. Fuel & Unattended
- i. Opportunities
- ii. Challenges
- 3.1.5. SMEs & Professional Services
- i. Opportunities
- ii. Challenges
- 3.1.6. Events & Stadiums
- i. Opportunities
- ii. Challenges
4. Country Readiness Index & Regional Analysis
- 4.1.1. Country Readiness Index
- Figure 4.1: Juniper Research's 8 Key Regions
- Table 4.2: Juniper Research mPOS Terminals & Soft POS Market Country Readiness Index: Scoring Criteria
- Figure 4.3: Juniper Research mPOS Terminals & Soft POS Market Country Readiness Index
- Figure 4.4: Juniper Research mPOS Terminals & Soft POS Country Readiness Index: Market Segments
- 4.1.2. Focus Markets
- i. eCommerce and Omnichannel Retail Expansion
- ii. Regulatory Support and Fintech Innovation
- Figure 4.5: Total Transaction Value of Soft POS Systems ($m), Focus Markets, 2025-2030
- 4.1.3. Growth Markets
- Figure 4.6: Total mPOS Transactions per annum ($m), Growth Markets, 2025-2030
- i. Contactless Payment Surge
- ii. Government Initiatives
- 4.1.4. Developing Markets
- i. Mobile-first Solutions for Informal Economies
- ii. Cost-efficiency and Flexibility for Merchants
- Figure 4.7: Total mPOS Transactions per annum ($m), Developing Markets, 2025-2030
- 4.1.5. Saturated Markets
- Figure 4.8: Total mPOS Transaction Value per annum ($m), Saturated Markets, 2025-2030
- i. Hardware Dependency
- ii. Security and Certification Hurdles
- Figure 4.9: Juniper Research mPOS Terminals & Soft POS Market Country
- Readiness Index Heatmap: North America
- Figure 4.10: Juniper Research mPOS Terminals & Soft POS Market Country
- Readiness Index Heatmap: Latin America
- Figure 4.11: Juniper Research mPOS Terminals & Soft POS Market Country
- Readiness Index Heatmap: West Europe
- Figure 4.12: Juniper Research mPOS Terminals & Soft POS Market Country
- Readiness Index Heatmap: Central & East Europe
- Figure 4.13: Juniper Research mPOS Terminals & Soft POS Market Country
- Readiness Index Heatmap: Far East & China
- Figure 4.14: Juniper Research mPOS Terminals & Soft POS Market Country
- Readiness Index Heatmap: Indian Subcontinent
- Figure 4.15: Juniper Research mPOS Terminals & Soft POS Market Country
- Readiness Index Heatmap: Rest of Asia Pacific
- Figure 4.16: Juniper Research mPOS Terminals & Soft POS Market Country
- Readiness Index Heatmap: Africa & Middle East
Competitor Leaderboard
1. Juniper Research POS Terminals Competitor Leaderboards
- 1.1. Why Read This Report
- 1.2. Key mPOS & Soft POS Market Takeaways
2. mPOS Competitor Leaderboard
- Figure 2.1: Juniper Research Competitor Leaderboard mPOS Vendors Included & Product Portfolio
- Figure 2.2: Juniper Research Competitor Leaderboard for mPOS Terminals Vendors
- Table 2.3: Juniper Research Competitor Leaderboard: mPOS Terminals Vendors & Positioning
- Table 2.4: Juniper Research Competitor Leaderboard for mPOS Terminals: Heatmap
- 2.1. mPOS Vendor Profiles
- 2.1.1. Epos Now
- i. Corporate
- ii. Geographical Spread
- iii. Key Clients and Strategic Developments
- iv. High-level View of Offerings
- v. Juniper Research's View: Key Strengths & Strategic Development Opportunities
- 2.1.2. Fiserv
- i. Corporate
- Figure 2.5: Fiserv's Financial Snapshot ($m), 2022-2024
- ii. Geographical Spread
- iii. Key Clients & Strategic Partnerships
- iv. High-level View of Offerings
- v. Juniper Research's View: Key Strengths & Strategic Development Opportunities
- i. Corporate
- 2.1.3. Global Payments
- i. Corporate
- Figure 2.6: Global Payments' Financial Snapshot ($m), 2022-2024
- ii. Geographical Spread
- iii. Key Clients & Strategic Partnerships
- iv. High-level View of Offerings
- v. Juniper Research's View: Key Strengths & Strategic Development Opportunities
- i. Corporate
- 2.1.4. Lightspeed
- i. Corporate
- Figure 2.7: Lightspeed Financial Snapshot ($m), 2022-2024
- ii. Geographical Spread
- iii. Key Clients & Strategic Partnerships
- iv. High-level View of Offerings
- v. Juniper Research's View: Key Strengths & Strategic Development Opportunities
- i. Corporate
- 2.1.5. Mswipe
- i. Corporate
- ii. Geographical Reach
- iii. Key Clients & Strategic Partnerships
- iv. High-level View of Offerings
- v. Juniper Research's View: Key Strengths & Strategic Development Opportunities
- 2.1.6. NEXGO
- i. Corporate
- ii. Geographical Reach
- iii. Key Clients & Strategic Partnerships
- iv. High-level View of Offerings
- v. Juniper Research's View: Key Strengths & Strategic Development Opportunities
- 2.1.7. Newland NPT
- i. Corporate
- ii. Geographical Spread
- iii. Key Clients & Strategic Partnerships
- iv. High-level View of Offerings
- v. Juniper Research's View: Key Strengths & Strategic Development Opportunities
- 2.1.8. PAX
- i. Corporate
- Table 2.8: PAX's Financial Snapshot ($m), 2022-2024
- ii. Geographical Reach
- iii. Key Clients & Strategic Partnerships
- iv. High-level View of Offerings
- v. Juniper Research's View: Key Strengths & Strategic Development Opportunities
- i. Corporate
- 2.1.9. PayPal
- i. Corporate
- Table 2.9: Notable PayPal Acquisitions Summary ($m)
- ii. Geographical Spread
- iii. Key Clients & Strategic Partnerships
- iv. High-level View of Offerings
- v. Juniper Research's View: Key Strengths & Strategic Development Opportunities
- i. Corporate
- 2.1.10. Posiflex
- i. Corporate
- Figure 2.10: Posiflex's Financial Snapshot ($m), 2021-2023, Converted from TWD
- ii. Geographical Spread
- iii. Key Clients & Strategic Partnerships
- iv. High-level View of Offerings
- v. Juniper Research's View: Key Strengths & Strategic Development Opportunities
- i. Corporate
- 2.1.11. Square (Block)
- i. Corporate
- ii. Geographical Reach
- iii. Key Clients & Strategic Partnerships
- iv. High-level View of Offerings
- v. Juniper Research's View: Key Strengths & Strategic Development Opportunities
- 2.1.12. SumUp
- i. Corporate
- ii. Geographical Spread
- iii. Key Clients & Strategic Partnerships
- iv. High-level View of Offerings
- v. Juniper Research's View: Key Strengths & Strategic Development Opportunities
- 2.1.13. Toast
- i. Corporate
- Table 2.11: Toast's Investment Rounds ($m), 2015-2020
- ii. Geographical Reach
- iii. Key Clients & Strategic Partnerships
- iv. High-level View of Offerings
- v. Juniper Research's View: Key Strengths & Strategic Development Opportunities
- i. Corporate
- 2.1.14. Verifone
- i. Corporate
- ii. Geographical Spread
- iii. Key Clients & Strategic Partnerships
- iv. High-level View of Offerings
- v. Juniper Research's View: Key Strengths & Strategic Development Opportunities
- 2.1.15. Worldline
- i. Corporate
- ii. Geographical Reach
- iii. Key Clients & Strategic Partnerships
- iv. High-level View of Offerings
- v. Juniper Research's View: Key Strengths and Strategic Development Opportunities
- 2.1.1. Epos Now
- 2.2. Juniper Research Competitor Leaderboard Assessment Methodology
- 2.3. Limitations & Interpretation
- Figure 2.12: Juniper Research mPOS Competitor Leaderboard
3. Soft POS Competitor Leaderboard
- Figure 3.1: Juniper Research Competitor Leaderboard Soft POS Vendors Included & Product Portfolio
- Figure 3.2: Juniper Research Competitor Leaderboard for Soft POS Vendors
- Table 3.3: Juniper Research Competitor Leaderboard: Soft POS Vendors & Positioning
- Table 3.4: Juniper Research Competitor Leaderboard for Soft POS: Heatmap
- 3.1. Soft POS Vendor Profiles
- 3.1.1. alcineo
- i. Corporate
- ii. Geographical Spread
- iii. Key Clients & Strategic Partnerships
- iv. High-level View of Offerings
- Figure 3.5: alcineo Technology Architecture
- v. Juniper Research's View: Key Strengths & Strategic Development Opportunities
- 3.1.2. Apple
- i. Corporate
- Table 3.6: Apple's Financial Snapshot, $m, FY 2022-2024
- ii. Geographical Spread
- iii. Key Clients & Strategic Partnerships
- iv. High-level View of Offerings
- v. Juniper Research's View: Key Strengths & Strategic Development Opportunities
- i. Corporate
- 3.1.3. CM.com
- i. Corporate
- Figure 3.7: CM.com Financial Snapshot ($m), 2022-2024 (Converted from Euro-1 @1.10)
- ii. Geographical Spread
- iii. Key Clients & Strategic Developments
- iv. High-level View of Offering
- v. Juniper Research's View: Key Strengths & Strategic Development
- i. Corporate
- 3.1.4. Fiserv
- i. Corporate
- Figure 3.8: Fiserv Financial Snapshot ($m), 2022-2024
- ii. Geographical Spread
- iii. Key Clients & Strategic Partnerships
- iv. High-Level View of Offerings
- v. Juniper Research's View: Key Strengths & Strategic Development
- i. Corporate
- 3.1.5. MagicCube
- i. Corporate
- Table 3.9: MagicCube Investment Rounds ($m), 2015-2021
- ii. Geographical Reach
- iii. Key Clients & Strategic Developments
- iv. High-level View of Offering
- v. Juniper Research's View: Key Strengths & Strategic Development
- i. Corporate
- 3.1.6. Mypinpad
- i. Corporate
- ii. Geographical Reach
- iii. Key Clients & Strategic Developments
- iv. High-level View of Offering
- v. Juniper Research's View: Key Strengths & Strategic Development
- 3.1.7. Paypal
- i. Corporate
- Table 3.10: Notable PayPal Acquisitions Summary ($m)
- ii. Geographical Spread
- iii. Key Clients & Strategic Partnerships
- iv. High-level View of Offerings
- v. Juniper Research's View: Key Strengths & Strategic Development Opportunities
- i. Corporate
- 3.1.8. Payten
- i. Corporate
- ii. Geographical Reach
- iii. Key Clients & Strategic Developments
- iv. High-level View of Offering
- v. Juniper Research's View: Key Strengths and Strategic Development
- 3.1.9. Square
- i. Corporate
- ii. Geographical Reach
- iii. Key Clients & Strategic Developments
- iv. High-level View of Offering
- v. Juniper Research's View: Key Strengths and Strategic Development
- 3.1.10. Stripe
- i. Corporate
- ii. Geographic Spread
- iii. Key Clients & Strategic Partnerships
- iv. High-level View of Offerings
- v. Juniper Research's View: Key Strengths and Strategic Development
- 3.1.11. Tidypay
- i. Corporate
- ii. Geographical Spread
- iii. Key Clients & Strategic Partnerships
- iv. High-Level View of Offerings
- v. Juniper Research's View: Key Strengths & Strategic Development Opportunities
- Figure 3.11: Viva.com Soft POS Terminal App Overview
- v. Juniper Research's View: Key Strengths & Strategic Development Opportunities
- 3.1.13. Wizzit
- i. Corporate
- ii. Geographical Spread
- iii. Key Clients & Strategic Partnerships
- iv. High-Level View of Offerings
- v. Juniper Research's View: Key Strengths & Strategic Development Opportunities
- 3.1.14. Worldline
- i. Corporate
- ii. Geographical Reach
- iii. Key Clients & Strategic Developments
- iv. High-level View of Offering
- v. Juniper Research's View: Key Strengths & Strategic Development Opportunities
- 3.1.15. Worldpay
- i. Corporate
- ii. Geographical Spread
- iii. Key Clients & Strategic Partnerships
- iv. High-Level View of Offerings
- v. Juniper Research's View: Key Strengths & Strategic Development Opportunities
- 3.1.1. alcineo
- 3.2. Methodology
- Table 3.12: Juniper Research Competitor Leaderboard Soft POS Methodology
- 3.3. Juniper Research Competitor Leaderboard Assessment Methodology
- 3.4. Limitations & Interpretation
- 3.5. Related Research
- Endnotes
Data & Forecasting
1. Market Forecasts
- 1.1. Introduction
- 1.2. Methodology & Assumptions
- Figure 1.1: POS Terminal Market Forecast Methodology
2. Market Summary
- 2.1. POS Terminals Market
- 2.1.1. POS Terminals Installed Base
- Figure & Table 2.1: Global POS Installed Base (m), Split by 8 Key Regions, 2025-2030
- Figure 2.2: North America - Proportion of mPOS in Use That Are Smart POS (%), 2025-2030
- 2.1.2. Total POS Transaction Volume
- Figure & Table 2.3: Global POS Transaction Volume (m), 2025-2030
- 2.1.3. Total POS Transaction Value
- Figure & Table 2.4: Global POS Transaction Value ($m), Split by 8 Key Regions, 2025-2030
- 2.1.1. POS Terminals Installed Base
3. Contactless POS
- 3.1.1. Contactless Terminals Installed Base
- Figure & Table 3.1: Global Contactless POS Installed Base (m), Split by 8 Key Regions, 2025-2030
- Table 3.2: Global Percentage of Dedicated POS That Are Contactless Enabled (%), 2025-2030
- 3.1.2. Contactless POS Transaction Volume
- Figure & Table 3.3: Global Contactless POS Transaction Volume (m), Split by 8 Key Regions, 2025-2030
- 3.1.3. Contactless POS Transaction Value
- Figure & Table 3.4: Global Contactless POS Transaction Value ($m), Split by 8 Key Regions, 2025-2030
4. mPOS
- 4.1.1. mPOS Installed Base
- Figure & Table 4.1: mPOS Installed Base (m), Split by 8 Key Regions, 2025-2030
- 4.1.2. mPOS Transaction Value
- Figure & Table 4.2: Global mPOS Transaction Value ($m), Split by 8 Key Regions, 2025-2030
5. Soft POS
- 5.1.1. Soft POS Installed Base
- Figure & Table 5.1: Number of Smartphones Using Soft POS (m), Split by 8 Key Regions, 2025-2030
- 5.1.2. Soft POS Transaction Volume
- Figure & Table 5.2: Global Soft POS Transaction Volume (m), Split by 8 Key Regions, 2025-2030
- 5.1.3. Soft POS Transaction Value
- Figure & Table 5.3: Global Soft POS Transaction Value ($m), Split by 8 Key Regions, 2025-2030
