
バーチャルカードの世界市場:2025-2029年
Global Virtual Cards Market 2025-2029- 発行日
- ページ情報
- 英文
- 納期
- 即日から翌営業日
- 商品コード
- 1674508
- 翻訳ツール提供対象 PDF対応AI翻訳ツールの無料貸し出しサービスのご利用が可能です
- 通信/IT関連専門 通信/IT関連専門を専門とする市場調査会社です。
概要
”バーチャルカード取引が世界的に急増し、2029年には17兆4,000億米ドルを超える見通し"
| 主要統計 | |
|---|---|
| 2025年のバーチャルカード総収益: | 5兆2,000億米ドル |
| 2029年のバーチャルカード総収益: | 17兆4,000億米ドル |
| 2025年から2029年の市場成長率: | 235% |
| 予測期間: | 2025-2029年 |
概要
当調査シリーズでは、デジタル決済におけるバーチャルカードの役割を包括的かつ詳細に分析し、企業、金融機関、カードネットワーク、フィンテックなどのステークホルダーが今後の成長、主要動向、競合環境を把握できるようにしています。本レポートでは、バーチャルカードの特徴を評価し、主な市場動向をハイライトし、バーチャルカード導入の地域別の進捗状況を調査しています。
また、バーチャルカードの今後の成長をマッピングしたデータ、金融市場の最新動向と機会を明らかにする洞察に満ちた調査、バーチャルカードの提供を促進するマーケットリーダー18社に関する広範な分析を含む資料など、本調査スイートには個別に購入可能なオプションがいくつか含まれています。
主な特徴
- 市場力学:バーチャルカード普及の促進要因・障壁など、バーチャルカード市場の主要動向と市場拡大の課題についての洞察を提供します。キャッシュフロー管理におけるバーチャルカードの役割、eコマースにおけるバーチャルカードの利用、バーチャルカードが様々な業界セグメントにもたらす特徴的なメリットなどを取り上げています。また、8つの主要地域における現在の発展状況や市場成長、今後の見通しについて、各国の準備指数を掲載しています。
- 主な要点・戦略的提言:バーチャルカード市場における主な成長機会と調査結果を詳細に分析し、ステークホルダーへの戦略的提言を掲載しています。
- ベンチマーク業界予測:バーチャルカードデータセットには、バーチャルカードのプロビジョニングと管理によって得られる総収益を含むバーチャルカード市場の総額と、さまざまな市場セグメントの取引量の予測が含まれています。
- Juniper Researchの競合リーダーボード:バーチャルカードプロビジョニング市場の主要企業の市場規模を掲載し、18のバーチャルカードベンダーの能力を評価します。
サンプルビュー
市場データ・予測レポート
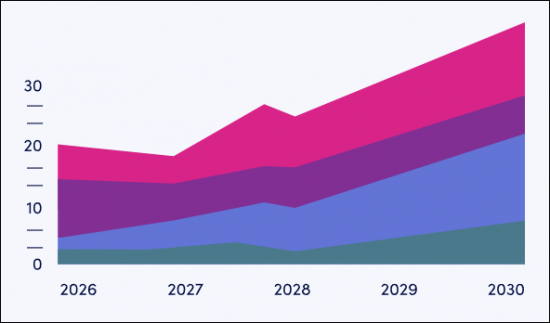
サンプル
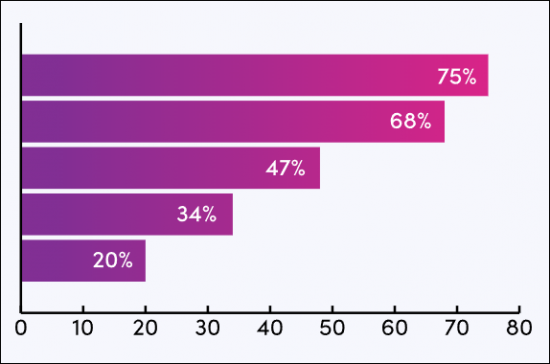
市場動向・戦略レポート
市場データ&予測レポート
当調査スイートには、89の表と34,200のデータポイントの予測データ一式へのアクセスが含まれています。調査対象には以下の指標が含まれます:
- バーチャルカード市場の総取引量、金額、収益
- バーチャルカード市場の総取引量、金額、収益 (以下のセグメント別)
- B2Bペイメント
- B2C POSペイメント
- B2Cリモート決済
Juniper Researchのインタラクティブ予測 (Excel)には以下の機能があります:
- 統計分析:データ期間中のすべての地域と国について、表示される特定の指標を検索できます。グラフは簡単に変更でき、クリップボードへのエクスポートも可能です。
- 国別データツール:予測期間中のすべての地域と国の指標を見ることができます。検索バーで表示される指標を絞り込むことができます。
- 国別比較ツール:特定の国を選択して比較することができます。このツールには、グラフをエクスポートする機能が含まれています。
- What-if分析:5つのインタラクティブシナリオにより、ユーザーは予測の前提条件と比較することができます。
目次
市場動向・戦略
第1章 市場サマリー
- 重要ポイント
- 戦略的推奨事項
第2章 市場サマリー
- バーチャルカードの主な特徴
- バーチャルカードに関わる主要関係者
- トークンサービスのプロビジョニング:デジタルカード
- バーチャルカードと物理カード
- 主な動向
- Apple Cash
- トークン化によりバーチャルカードと物理カードの境界が曖昧に
- 簡単な統合により、バーチャルカードの導入が容易になっている
- 他の決済方法はバーチャルカードにどのように対抗するか?
- A2A決済
- 現金
- モバイルマネー
第3章 セクター分析
- B2Bセクター分析
- 旅費・経費
- サプライチェーン
- フリート
- ヘルスケア
- ギグエコノミー
- 不動産
- 旅行代理店
- 政府
- 給与計算
- 消費者部門
- エネルギー料金と公共料金
- Eコマース
第4章 国別準備指数
- 国別準備指数:イントロダクション
- 焦点市場
- 強力なB2Bセクター
- 米国:重点市場
- 重点市場:インド
- 成長市場
- デジタルおよび物理インフラの開発
- 飽和市場
- 即時決済サービスとの競合の激化
- 成長の兆し
- 新興国市場
- 決済イノベーションへの低い投資
- モバイルマネーの普及
競合リーダーボード
第1章 競合リーダーボード
第2章 企業プロファイル
- バーチャルカードベンダープロファイル
- Adyen
- Airwallex
- American Express
- Conferma
- Discover
- Enfuce
- Flutterwave
- Nexi Group
- Marqeta
- Mastercard
- Payhawk
- Pleo
- Stripe
- Visa
- Wallester
- WEX
- Wise
- 評価手法
- 関連調査
データ・予測
第1章 市場概要
第2章 市場予測
- 世界のバーチャルカード予測
- 取引量
- 取引額
- 総収益
第3章 B2Bバーチャルカードの予測
- 取引量
- 取引額
- 総収益
第4章 B2C POSバーチャルカードの予測
- 取引量
- 取引額
- 総収益
第5章 B2Cリモートバーチャルカード
- 取引量
- 取引額
- 総収益
目次
'Virtual Card Transactions to Soar Globally, Exceeding $17.4 Trillion by 2029'
| KEY STATISTICS | |
|---|---|
| Total virtual cards revenue in 2025: | $5.2tn |
| Total virtual cards revenue in 2029: | $17.4tn |
| 2025 to 2029 market growth: | 235% |
| Forecast period: | 2025-2029 |
Overview
Our "Virtual Cards" research suite provides a comprehensive and in-depth analysis of the role of virtual cards in the digital payments landscape; enabling stakeholders such as businesses, financial institutions, card networks and fintechs to understand future growth, key trends and the competitive environment. The report evaluates the features of virtual cards, highlights key market trends, and examines regional progress in virtual card adoption.
The suite includes several different options that can be purchased separately, including access to data mapping the future growth of virtual cards, an insightful study uncovering the latest trends and opportunities within the financial markets, and a document containing extensive analysis of the 18 market leaders facilitating virtual card provision. The coverage can also be purchased as a Full Research Suite, containing all these elements, at a substantial discount.
This report serves as an essential resource for understanding the rapidly evolving virtual cards market, empowering stakeholders to shape effective future strategies. With its comprehensive insights and extensive coverage, this research suite is an invaluable tool for navigating and planning in a fast-growing landscape.
Key Features
- Market Dynamics: Insights into key trends and market expansion challenges within the virtual cards market, including drivers and barriers for virtual card adoption. The report addresses the role of virtual cards in easing cashflow management, the use of virtual cards in eCommerce, and the distinctive benefits that virtual cards can bring to various industry segments. The research also features a Country Readiness Index on the current development and segment growth of the virtual cards market across eight key regions, as well as providing a future outlook.
- Key Takeaways & Strategic Recommendations: In-depth analysis of key development opportunities and findings within the virtual cards market, accompanied by strategic recommendations for stakeholders.
- Benchmark Industry Forecasts: The virtual cards dataset includes forecasts for the total value of the virtual card market, including the total revenue to be gained through provisioning and managing virtual cards, and the transaction volume of various market segments.
- Juniper Research Competitor Leaderboard: Key market player capability and capacity assessment for 18 virtual card vendors, via the Juniper Research Competitor Leaderboard; featuring market size for major players in the virtual card provisioning market.
SAMPLE VIEW
Market Data & Forecasting Report
The numbers tell you what's happening, but our written report details why, alongside the methodologies.
SAMPLE VIEW
Market Trends & Strategies Report
A comprehensive analysis of the current market landscape, alongside strategic recommendations.
Market Data & Forecasting Report
The market-leading research suite for the Virtual Cards market includes access to the full set of forecast data of 89 tables and 34,200 datapoints. Metrics in the research suite include:
- Total Transaction Volume, Value, and Revenue of the Virtual Cards Market
- Total Transaction Volume, Value and Revenue of the Virtual Cards Market, Split by the Following Market Segments:
- B2B Payments
- B2C POS Payments
- B2C Remote Payments
Juniper Research's Interactive Forecast Excel contains the following functionality:
- Statistics Analysis: Users benefit from the ability to search for specific metrics, displayed for all regions and countries across the data period. Graphs are easily modified and can be exported to the clipboard.
- Country Data Tool: This tool lets users look at metrics for all regions and countries in the forecast period. Users can refine the metrics displayed via a search bar.
- Country Comparison Tool: Users can select and compare specific countries. The ability to export graphs is included in this tool.
- What-if Analysis: Here, users can compare forecast metrics against their own assumptions, via five interactive scenarios.
Market Trends & Strategies Report
This report examines the "Virtual Cards" market landscape in depth; assessing trends and factors shaping the evolution of this rapidly growing market. The report delivers comprehensive analysis of the strategic opportunities for fintechs offering virtual cards; addressing key verticals such as government, healthcare, fleet, and travel. This report also includes evaluation of key country-level opportunities for stakeholders in the virtual cards market.
Competitor Leaderboard Report
The Competitor Leaderboard report provides a detailed evaluation and market positioning for 18 leading vendors in the virtual cards space. The vendors are positioned as established leaders, leading challengers, or disruptors and challengers, based on capacity and capability assessments:
|
|
This document is centred around the Juniper Research Competitor Leaderboard; a vendor positioning tool that provides an at-a-glance view of the competitive landscape in a market, backed by a robust methodology.
Table of Contents
Market Trends & Strategies
1. Market Summary
- 1.1. Key Takeaways
- 1.2. Strategic Recommendations
2. Market Summary
- 2.1.1. Introduction
- 2.1.2. Key Features of Virtual Cards
- Figure 2.1: Key Features of Virtual Cards
- 2.1.3. Key Actors Involved in Virtual Cards
- 2.1.4. Token Service Provisioning: Digital Cards
- 2.1.5. Virtual vs Physical Cards
- Figure 2.2: Virtual vs Physical Card Differences
- 2.2. Key Trends
- 2.2.1. Apple Cash
- Figure 2.3: Apple Cash
- 2.2.2. Tokenisation Blurs the Line Between Virtual and Physical Cards
- 2.2.3. Easy Integration Simplifies Institutional Adoption of Virtual Cards
- 2.2.4. How Will Other Payment Methods Challenge Virtual Cards?
- i. A2A payments
- ii. Cash
- iii. Mobile Money
- 2.2.1. Apple Cash
3. Sector Analysis
- 3.1. B2B Sector Analysis
- Figure 3.1: B2B Use Cases for Virtual Cards
- 3.1.1. Travel & Expense
- 3.1.2. Supply Chain
- 3.1.3. Fleet
- 3.1.4. Healthcare
- 3.1.5. Gig Economy
- 3.1.6. Real Estate
- 3.1.7. Travel Agencies
- 3.1.8. Government
- 3.1.9. Payroll
- 3.1.10. Consumer Sector
- i. Energy Bills & Utilities
- ii. eCommerce
4. Country Readiness Index
- 4.1. Introduction to Country Readiness Index
- Figure 4.1: Virtual Cards Country Readiness Index: Regional Definitions
- Figure 4.2: Juniper Research Country Readiness Scoring Index: Virtual Cards
- Figure 4.3: Juniper Research Country Readiness Index: Virtual Cards
- Figure 4.4: Virtual Cards Country Readiness Index: Market Segments
- 4.2. Focus Market
- i. Strong B2B Sectors
- Figure 4.5: Total Virtual Card Transactions (m), Split by Seven Key Focus Markets, 2025-2029
- ii. The US: Focus Market
- iii. Focus Market: India
- i. Strong B2B Sectors
- 4.3. Growth Markets
- Figure 4.6: Total Virtual Card Transactions (m), Split by Growth Markets, 2025-2029
- i. Development in Digital & Physical Infrastructure
- 4.4. Saturated Markets
- Figure 4.7: Total Virtual Card Transactions (m), Split by Eight Key Saturated Markets, 2025-2029
- i. Entrenched Competition from Instant Payment Services
- ii. Pockets of Growth
- 4.5. Developing Markets
- Figure 4.8: Total Virtual Card Transactions (m), Split by Key Developing Markets, 2025-2029
- i. Low Investment in Payments Innovations
- ii. Prevalence of Mobile Money
- Table 4.9: Juniper Research's Country Readiness Index Heatmap: North America
- Table 4.10: Juniper Research's Country Readiness Index Heatmap: Latin America
- Table 4.11: Juniper Research's Country Readiness Index Heatmap: West Europe
- Table 4.12: Juniper Research's Country Readiness Index Heatmap: Central & Eastern Europe
- Table 4.13: Juniper Research's Country Readiness Index Heatmap: Far East & China
- Figure 4.14: Juniper Research's Country Readiness Index Heatmap: Indian Subcontinent
- Figure 4.15: Juniper Research's Country Readiness Index Heatmap: Rest of Asia Pacific
- Table 4.16: Juniper Research's Country Readiness Index Heatmap: Africa & Middle East
Competitor Leaderboard
1. Competitor Leaderboard
- 1.1. Why Read This Report
- Figure 1.1: Juniper Research Competitor Leaderboard Vendors: Virtual Cards
- Figure 1.2: Juniper Research Competitor Leaderboard: Virtual Cards
- Figure 1.3: Juniper Research Competitor Leaderboard: Virtual Card Vendor Ranking
- Table 1.4: Juniper Research Competitor Leaderboard Virtual Cards - Heatmap
2. Company Profiles
- 2.1. Virtual Card Vendor Profiles
- 2.1.1. Adyen
- i. Corporate
- ii. Geographic Spread
- iii. Key Clients & Strategic Partnerships
- iv. High-level View of Offerings
- v. Juniper Research's View: Key Strengths and Strategic Development Opportunities
- 2.1.2. Airwallex
- i. Corporate
- ii. Geographical Spread
- iii. Key Clients & Partnerships
- iv. High-level View of Offerings
- v. Juniper Research's View: Key Strengths and Strategic Development Opportunities
- 2.1.3. American Express
- i. Corporate
- ii. Geographic Spread
- iii. Key Clients & Partnerships
- iv. High-level View of Offerings
- v. Juniper Research's View: Key Strengths & Strategic Development Opportunities
- 2.1.4. Conferma
- i. Corporate
- ii. Geographic Spread
- iii. Key Clients & Strategic Partnerships
- iv. High-level View of Offerings
- v. Juniper Research's View: Key Strengths & Strategic Development Opportunities
- 2.1.5. Discover
- i. Corporate
- ii. Geographic Spread
- iii. Key Clients & Strategic Partnerships
- iv. High-level View of Offerings
- v. Juniper Research's View: Key Strengths & Strategic Development Opportunities
- 2.1.6. Enfuce
- i. Corporate
- ii. Geographic Spread
- iii. Key Clients & Strategic Partnerships
- iv. High-level View of Offerings
- v. Juniper Research's View: Key Strengths & Strategic Development Opportunities
- 2.1.7. Flutterwave
- i. Corporate
- ii. Geographic Spread
- iii. Key Clients & Strategic Partnerships
- iv. High-level View of Offerings
- v. Juniper Research's View: Key Strengths & Strategic Development Opportunities
- 2.1.8. Nexi Group
- i. Corporate
- Figure 2.1: Nexi Group's Financial Snapshot, (Euro-bn), 2020-2023
- ii. Geographic Spread
- iii. Key Clients & Strategic Partnerships
- iv. High-level View of Offerings
- v. Juniper Research's View: Key Strengths & Strategic Development Opportunities
- i. Corporate
- 2.1.9. Marqeta
- i. Corporate
- ii. Geographic Spread
- iii. Key Clients & Strategic Partnerships
- iv. High-level View of Offerings
- v. Juniper Research's View: Key Strengths & Strategic Development Opportunities
- 2.1.10. Mastercard
- i. Corporate
- ii. Geographic Spread
- iii. Key Clients & Strategic Partnerships
- iv. High-level View of Offerings
- v. Juniper Research's View: Key Strengths & Strategic Development Opportunities
- 2.1.11. Payhawk
- i. Corporate
- ii. Geographic Spread
- iii. Key Clients & Strategic Partnerships
- iv. High-level View of Offerings
- v. Juniper Research's View: Key Strengths & Strategic Development Opportunities
- 2.1.12. Pleo
- i. Corporate
- ii. Geographic Spread
- iii. Key Clients & Strategic Partnerships
- iv. High-level View of Offerings
- Figure 2.2: Pleo's Company Spending Dashboard
- v. Juniper Research's View: Key Strengths & Strategic Development Opportunities
- 2.1.13. Stripe
- i. Corporate
- ii. Geographic Spread
- iii. Key Clients & Strategic Partnerships
- iv. High-level View of Offerings
- v. Juniper Research's View: Key Strengths & Strategic Development Opportunities
- 2.1.14. Visa
- i. Corporate
- ii. Geographic Spread
- iii. Key Clients & Strategic Partnerships
- iv. High-level View of Offerings
- v. Juniper Research's View: Key Strengths & Strategic Development Opportunities
- 2.1.15. Wallester
- i. Corporate
- ii. Geographic Spread
- iii. Key Clients & Strategic Partnerships
- iv. High-level View of Offerings
- v. Juniper Research's View: Key Strengths & Strategic Development Opportunities
- 2.1.16. WEX
- i. Corporate
- ii. Geographic Spread
- iii. Key Clients & Strategic Partnerships
- iv. High-level View of Offerings
- v. Juniper Research's View: Key Strengths & Strategic Development Opportunities
- 2.1.17. Wise
- i. Corporate
- ii. Geographic Spread
- iii. Key Clients & Strategic Partnerships
- iv. High-level View of Offerings
- Figure 2.3: Wise Dashboard Example
- v. Juniper Research's View: Key Strengths & Strategic Development Opportunities
- 2.1.1. Adyen
- 2.2. Juniper Research Leaderboard Assessment Methodology
- 2.2.1. Limitations & Interpretations
- Table 2.4: Juniper Research Leaderboard Assessment Criteria: Virtual Cards
- 2.2.1. Limitations & Interpretations
- 2.3. Related Research
Data & Forecasting
1. Market Overview
- 1.1.1. Introduction
- 1.1.2. Methodology & Assumptions
- Figure 1.1: B2C Virtual Cards Forecast Methodology
- Figure 1.2: B2B Virtual Cards Forecast Methodology
2. Market Forecast
- 2.1. Global Virtual Cards Forecast
- 2.1.1. Virtual Cards Transaction Volume
- Figure and Table 2.1: Virtual Card Transaction Volume (m), 2025-2029, Split by Sector
- 2.1.2. Virtual Cards Transaction Value
- Figure and Table 2.2: Virtual Card Transaction Value ($bn), Split by Sector, ($b), 2025-2029
- 2.1.3. Total Virtual Card Revenue
- Figure and Table 2.3: Total Virtual Card Revenue ($bn), Split by Sector, 2025-2029
- 2.1.1. Virtual Cards Transaction Volume
3. B2B Virtual Cards Forecast
- 3.1. B2B Virtual Cards
- 3.1.1. B2B Transaction Volume
- Figure and Table 3.1: B2B Transaction Volume per annum (m), Split by Region, 2025-2029
- Table 3.2: B2B Virtual Card Transaction Volume per annum (m), Split by Industry Segments, 2025-2029
- 3.1.2. B2B Virtual Card Spend
- Figure and Table 3.3: B2B Virtual Card Spend per annum ($bn), Split by Region, 2025-2029
- Figure 3.4: B2B Value of Virtual Card Transactions per annum ($m), Split by Industry Segments, 2025-2029
- 3.1.3. B2B Virtual Card Revenue
- Figure and Table 3.5: B2B Virtual Card Revenue per annum ($bn), Split by Region, 2025-2029
- Figure 3.6: B2B Virtual Card Revenue per annum ($bn), Split by Sector, 2025-2029
- 3.1.1. B2B Transaction Volume
4. B2C POS Virtual Cards Forecast
- 4.1.1. B2C POS Virtual Card Transaction Volume
- Figure and Table 4.1: B2C POS Virtual Card Transaction Volume (m), Split by Region, 2025-2029
- 4.1.2. B2C POS Virtual Card Transaction Value
- Figure and Table 4.2: Total B2C POS Virtual Card Transaction Value ($m), Split by Region, 2025-2029
- 4.1.3. B2C POS Virtual Card Revenue
- Figure and Table 4.3: Total B2C POS Virtual Card Transaction Revenue per annum ($m), Split by Region, 2025-2029
5. B2C Remote Virtual Cards
- 5.1.1. B2C Remote Virtual Card Volume
- Figure and Table 5.1: Total B2C Remote Virtual Card Transaction Volume per annum (m), Split by Region, 2025-2029
- 5.1.2. B2C Remote Virtual Card Value
- Figure and Table 5.2: Total B2C Remote Virtual Card Value ($m), Split by Regions, 2025-2029
- 5.1.3. B2C Remote Virtual Card Revenue
- Figure and Table 5.3: Total B2C Remote Virtual Card Revenue ($m), Split by Region, 2025-2029
- 発行日
- 発行
- Juniper Research Ltd
- ページ情報
- 英文
- 納期
- 即日から翌営業日


