
モバイルローミングの世界市場:2025-2029年
Global Mobile Roaming Market: 2025-2029- 発行日
- ページ情報
- 英文
- 納期
- 即日から翌営業日
- 商品コード
- 1627227
- 翻訳ツール提供対象 PDF対応AI翻訳ツールの無料貸し出しサービスのご利用が可能です
- 通信/IT関連専門 通信/IT関連専門を専門とする市場調査会社です。
概要
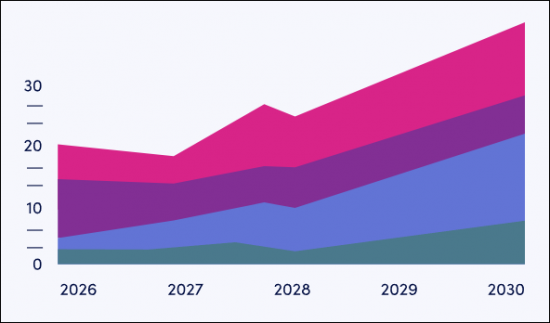
世界のホールセールローミング収益は2028年にかけて倍増する見通し
| 主要統計 | |
|---|---|
| 2025年のリテールローミング総収益: | 134億米ドル |
| 2029年のリテールローミング総収益: | 209億米ドル |
| 2025年から2029年のリテールローミング収益の増加率: | 56% |
| 予測期間: | 2024-2029年 |
当調査スイートは、今後5年間で大きく変化する市場の詳細で洞察に満ちた分析を提供します。モバイルローミングベンダーや移動体通信事業者などのステークホルダーは、ホールセールローミング市場とリテールローミング市場がどのように進化するかをよりよく理解することができ、旅行eSIM、5Gローミング、IoTデバイスのローミングがどの程度市場に影響を与えるかを評価することができます。
モバイルローミング市場スイートには、モバイルローミングのトラフィックと将来的な収益の可能性に関するデータマッピングを含む、個別に購入可能な複数のオプションが含まれています。さらに、市場の主要動向と将来の機会を明らかにする洞察に満ちた調査や、モバイルローミング分野の主要ベンダー23社に関する広範な分析も含まれています。
これらは全体で、変化し続ける市場を理解するための重要なツールとなり、モバイルローミングベンダーや通信事業者は動向を把握し、将来の戦略を立てることができます。本スイートの調査範囲は他に類を見ないものであるため、予測不可能な市場の将来を予測する上で非常に有用な資料となります。
主な特徴
- 市場力学:モバイルローミング市場の変化から生じる主要動向と市場機会に関する洞察を示します。本調査では、5Gローミング、IoTローミング、旅行eSIMの採用など、モバイルローミングベンダーとモバイルオペレーターにとっての主要な成長機会を取り上げています。また、レガシーネットワークの廃止や不正行為によってもたらされる課題についても考察し、これらをどのように乗り切るべきかについて提言しています。さらに、主要60カ国のモバイルローミング市場の現在の発展状況と今後の成長に関する地域別の成長率分析も行い、主要な注目市場を特定しています。
- 主な要点と戦略的提言:モバイルローミング市場における主要な開拓機会と調査結果を詳細に分析し、モバイルローミングベンダーとモバイル事業者に対する主要な戦略的提言を掲載しています。
- ベンチマーク業界予測:ホールセールローミングとリテールローミングの5カ年予測データベースを提供し、各セクターのユーザー、トラフィック、収益予測を提供します。これらの分野は、コンシューマーホールセールローミング、IoTホールセールローミング、4Gスマートフォンローミング、5Gスマートフォンローミング、ローミングデバイス、クルーズローミングが含まれます。
- Juniper Researchの競合リーダーボード:モバイルローミングベンダー23社のの能力を評価し、市場実績、収益、将来の事業見通しなどの基準でベンダーを採点します。
サンプルビュー
市場データ&予測レポート
市場動向&戦略レポート
市場データ&予測レポート
本調査スイートには、106の表と48,300以上のデータポイントからなる包括的な5年間の予測データセットへのアクセスが含まれています。この調査スイートには以下の指標が含まれています:
- ホールセールローミングの総トラフィック
- ホールセールローミングの総収益
- リテールローミングの総トラフィック
- リテールローミングの総収益
これらの指標は、以下の主要市場について提供されています:
- コンシューマーホールセールローミング
- IoTホールセールローミング
- 4Gリテールローミング
- 5Gリテールローミング
- リテールコンシューマーデバイスローミング
- クルーズローミング
目次
市場動向と戦略
第1章 重要ポイントと戦略的推奨事項
第2章 今後の市場の展望:ホールセールローミング
- ホールセールローミング:イントロダクション
- 2Gと3Gの終焉
- 5Gローミング
- ネットワークスライシング
- インフラ共有
- バンドルサービス
- 5G SAフォールバックとしてのVoLTE
- 5Gローミングセキュリティ
- 6Gローミング
- クラウドベースのローミングサービス
- 旅行用eSIM
- BCE (Billing and Charging Evolution) の進化
- APIについて
- IoTローミングデバイス
- 不正なローミング活動
第3章 今後の市場の展望:リテールローミング
- リテールローミング:イントロダクション
- 旅行用SIMと旅行用eSIM
- 規制
- クラウドベースのローミングサービス
- 5Gおよび6Gローミング
- コンシューマーデバイスローミング
- クルーズと機内ローミング
第4章 国別準備指数
- 国別準備指数:イントロダクション
- 重点市場
- 成長市場
- 飽和市場
- 新興国市場
競合リーダーボード
第1章 JJuniper Researchの競合リーダーボード
第2章 ベンダープロファイル
- モバイルローミングベンダープロファイル
- A1 Telekom Austria Group
- Amplitiv
- BICS
- BroadForward
- Cellusys
- Comfone
- CSG
- Deutsche Telekom Global Carrier
- Etisalat
- iBASIS
- Mobileum
- Nextgen Clearing
- Orange Wholesale
- Roamability
- Syniverse
- Tata Communications
- Tele2 International Wholesale
- Telefonica Global Solutions
- Telenor Linx
- Telna
- TNS
- TOMIA
- Vodafone Roaming Services
- 調査手法
- 制限と解釈
データ・予測
第1章 市場予測・重要ポイント
- モバイルローミング予測:イントロダクション
- インバウンドローミング接続数
- インバウンドローミング収益
- アウトバウンドローミング加入者数
- アウトバウンドリテールローミング収益
第2章 ホールセールローミングコンシューマー音声、SMS、データ予測
- ホールセールローミングコンシューマー音声、SMS、データ使用
- データローミング予測手法
- 音声ローミング予測手法
- SMSローミング予測手法
- インバウンドモバイル加入者
- インバウンドローミング加入者:SMS収益
- インバウンドローミング加入者:音声収益
- インバウンドローミング加入者:データ収益
第3章 IoTホールセールローミング
- ホールセールローミング:IoTデバイスとセンサー
- 予測手法・前提
- インバウンドローミングIoT接続数
- IoTホールセールローミング総収益
第4章 リテール音声、SMS、データローミングの予測
- 音声、SMS、データのリテールローミングの予測:イントロダクション
- 予測手法
- アウトバウンドSMSローミング収益
- アウトバウンド音声ローミング収益
- アウトバウンドデータローミング収益
第5章 4Gリテールローミング
- 予測・調査手法
- 予測手法・前提
- アウトバウンド4Gローミング加入者総数
- アウトバウンド4G音声、SMS、データローミング総収益
第6章 5Gリテールローミング
- 予測・調査手法
- 予測手法・前提
- アウトバウンド5Gローミング加入者総数
- アウトバウンド5G音声、SMS、データローミング総収益
第7章 コンシューマーデバイス
- 予測・調査手法
- 予測手法・前提
- ローミング総収益
第8章 クルーズローミング
- 予測・調査手法
- 予測手法・前提
- クルーズローミング総収益
目次
'Global Wholesale Roaming Revenue to Double by 2028'
| KEY STATISTICS | |
|---|---|
| Total retail roaming revenue in 2025: | 13.4bn |
| Total retail roaming revenue in 2029: | 20.9bn |
| 2025 to 2029 retail roaming revenue increase: | 56% |
| Forecast period: | 2024-2029 |
Overview
Our "Mobile Roaming" research suite provides a detailed and insightful analysis of a market set for significant change over the next five years. It enables stakeholders, from mobile roaming vendors and mobile operators, to better understand how both the wholesale and retail roaming markets will evolve, assessing the extent to which travel eSIMs, 5G roaming and Internet of Things (IoT) device roaming will impact the market.
The mobile roaming market suite includes several different options that can be purchased separately, including data mapping of the traffic and future revenue potential of mobile roaming. Additionally, it includes an insightful study uncovering key trends and future opportunities within the market, as well as an extensive analysis of 23 leading vendors in the mobile roaming space. The coverage can also be purchased as a full research suite, which contains all these elements and includes a substantial discount.
Collectively, they provide a critical tool for understanding this ever-changing market, allowing mobile roaming vendors and operators to capitalise on trends and shape their future strategy. This research suite's unparalleled coverage makes it an incredibly useful resource for projecting the future of such an unpredictable market.
Key Features
- Market Dynamics: Insights into key trends and market opportunities resulting from changes within the mobile roaming market. This research addresses key growth opportunities for mobile roaming vendors and mobile operators, including 5G roaming, IoT roaming and travel eSIM adoption. This research then considers challenges posed by legacy network sunsetting and fraudulent activity, providing recommendations for how these must be navigated. Moreover, it includes a regional market growth rate analysis on the current development and future growth of mobile roaming across 60 key countries, identifying key focus markets.
- Key Takeaways & Strategic Recommendations: In-depth analysis of key development opportunities and findings within the mobile roaming market, accompanied by key strategic recommendations for mobile roaming vendors and mobile operators.
- Benchmark Industry Forecasts: Five-year forecast databases are provided for wholesale and retail roaming, providing user, traffic and revenue splits for each sector. These sector splits include consumer wholesale roaming, IoT wholesale roaming, 4G smartphone roaming, 5G smartphone roaming, roaming devices and cruise roaming.
- Juniper Research Competitor Leaderboard: Key player capability and capacity assessment for 23 mobile roaming vendors via the Juniper Research Competitor Leaderboard; scoring these vendors on criteria such as market performance, revenue and future business prospects.
SAMPLE VIEW
Market Data & Forecasting Report
The numbers tell you what's happening, but our written report details why, alongside the methodologies.
Market Trends & Strategies Report
A comprehensive analysis of the current market landscape, alongside strategic recommendations.
Market Data & Forecasting Report
The market-leading research suite for the Mobile Roaming market includes access to a comprehensive five-year forecast dataset comprising 106 tables and over 48,300 datapoints. Metrics in the research suite include:
- Total Wholesale Roaming Traffic
- Total Wholesale Roaming Revenue
- Total Retail Roaming Traffic
- Total Retail Roaming Revenue
These metrics are provided for the following key market verticals:
- Consumer Wholesale Roaming
- IoT Wholesale Roaming
- 4G Retail Roaming
- 5G Retail Roaming
- Retail Consumer Device Roaming
- Cruise Roaming
Juniper Research Interactive Forecast Excel contains the following functionality:
- Statistics Analysis: Users benefit from the ability to search for specific metrics, displayed for all regions and countries across the data period. Graphs are easily modified and can be exported to the clipboard.
- Country Data Tool: This tool lets users look at metrics for all regions and countries in the forecast period. Users can refine the metrics displayed via a search bar.
- Country Comparison Tool: Users can select and compare specific countries. The ability to export graphs is included in this tool.
- What-if Analysis: Here, users can compare forecast metrics against their own assumptions via five interactive scenarios.
Market Trends & Strategies Report
This trends analysis report examines the mobile roaming market landscape in detail; assessing market trends and factors shaping the evolution of this rapidly changing market. The essential strategy report delivers a comprehensive analysis of the strategic opportunities for mobile roaming providers; addressing key verticals, developing market challenges, and how stakeholders must navigate these. It also includes an evaluation of the key country-level opportunities for mobile roaming growth, with the Country Readiness Index.
Competitor Leaderboard Report
The Competitor Leaderboard report provides a detailed evaluation and market positioning for 23 leading vendors in the mobile roaming space. The vendors are positioned as established leaders, leading challengers, or disruptors and challengers, based on capacity and capability assessments:
|
|
This competitive analysis document is centred around the Juniper Research Competitor Leaderboard, a vendor positioning tool that provides an at-a-glance view of the competitive landscape in a market; backed by a robust methodology.
Table of Contents
Market Trends & Strategies
1. Key Takeaways & Strategic Recommendations
- 1.1. Key Takeaways and Strategic Recommendations
2. Future Market Outlook - Wholesale Roaming
- 2.1. Introduction to Wholesale Roaming
- Figure 2.1: Mobile Roaming Structure
- Figure 2.2: Total Wholesale Roaming Revenue ($m), Split by 8 Key Regions, 2024-2029
- 2.2. 2G and 3G Sunsetting
- i. VoLTE Roaming
- 2.3. 5G Roaming
- i. Network Slicing
- ii. Infrastructure Sharing
- iii. Bundled Services
- iv. VoLTE as 5G SA Fallback
- v. 5G Roaming Security
- 2.4. 6G Roaming
- 2.5. Cloud-based Roaming Services
- 2.6. Travel eSIMs
- 2.7. Evolution of Billing and Charging Evolution (BCE)
- Figure 2.3: Data Flow in BCE Process
- Figure 2.4: High-level Reporting Exchange Flow
- 2.8. APIs
- 2.9. IoT Roaming Devices
- Figure 2.5: Total Number of IoT Connections that are Roaming (m), Split by 8 Key Regions, 2024-2029
- Figure 2.6: Total IoT Wholesale Roaming Revenue
- Figure 2.7: IoT Use Cases
- 2.10. Fraudulent Roaming Activity
3. Future Market Outlook - Retail Roaming
- 3.1. Introduction to Retail Roaming
- Figure 3.1: Total Retail Roaming Revenue Split by 8 Key Regions, 2024
- 3.2. Travel SIMs and Travel eSIMs
- Figure 3.2: Total Roaming Spend Lost to Travel SIMs/eSIMs ($m), Split by 8 Key Regions, 2023-2028
- 3.2.1. Travel SIMs
- 3.2.2. Travel eSIMs
- Figure 3.3: Total Number of Smartphones that have eSIMs (m), Split by 8 Key Regions, 2024-2026
- 3.3. Regulatory
- 3.4. Cloud-based Roaming Services
- 3.5. 5G and 6G Roaming
- 3.6. Consumer Device Roaming
- 3.7. Cruise and In-flight Roaming
- 3.7.1. Cruise Roaming
- Figure 3.4: Infographic Showing the Process of Cruise Roaming
- Figure 3.5: Total Cruise Roaming Revenue ($m), Split by 8 Key Regions, 2024-2029
- 3.7.2. In-flight Roaming
- 3.7.1. Cruise Roaming
4. Country Readiness Index
- 4.1. Introduction to Country Readiness Index
- Figure 4.1: Mobile Roaming Country Readiness Index Regional Definitions
- Table 4.2: Juniper Research Country Readiness Index Scoring Criteria: Mobile Roaming
- Figure 4.3: Juniper Research Country Readiness Index: Mobile Roaming
- Table 4.4: Mobile Roaming Country Readiness Index: Market Segments
- 4.2. Focus Markets
- Figure 4.5: Total Retail Roaming Revenue ($m), Split by 20 Focus Markets, 2024
- 4.2.1. RLAH
- Figure 4.6: Total Active Outbound Mobile Roaming Subscribers (m), Split by Focus Markets in West Europe, 2024
- 4.2.2. The GCC
- Figure 4.7: Total Retail Roaming Revenue ($m), Split by Saudi Arabia and United Arab Emirates, 2024-2029
- 4.2.3. The Nordic Roaming Initiative
- Figure 4.8: Total Retail Roaming Revenue ($m), Split by Sweden, Denmark and Norway, 2024-2029
- 4.2.4. North America
- Figure 4.9: Total Outbound Travellers (m), Split by US and Canada, 2024-2029
- 4.2.5. Far East & Asia
- 4.3. Growth Markets
- 4.3.1. India
- Figure 4.10: GDP per Capita ($), 2024-2029, India
- 4.3.2. Belgium
- 4.3.1. India
- 4.4. Saturated Markets
- 4.5. Developing Markets
- Figure 4.11: Total Retail Roaming Revenue ($m), Split by Developing Markets, 2024
- 4.5.1. Roaming Initiatives in Africa
- 4.5.2. Roaming Initiatives in Latin America
- Table 4.12: Juniper Research's Country Readiness Index Heatmap: North America
- Table 4.13: Juniper Research's Country Readiness Index Heatmap: Latin America
- Table 4.14: Juniper Research's Country Readiness Index Heatmap: West Europe
- Table 4.15: Juniper Research's Country Readiness Index Heatmap: Central & East Europe
- Table 4.16: Juniper Research's Country Readiness Index Heatmap: Far East & China
- Table 4.17: Juniper Research's Country Readiness Index Heatmap: Indian Subcontinent
- Table 4.18: Juniper Research's Country Readiness Index Heatmap: Rest of Asia Pacific
- Table 4.19: Juniper Research's Country Readiness Index Heatmap: Africa & Middle East
Competitor Leaderboard
1. Juniper Research Competitor Leaderboard
- 1.1. Why Read This Report
- Mobile Operators Must Embrace Travel eSIMs as a New Revenue Opportunity, Rather Than View as a Threat
- 5G and VoLTE Roaming to Accelerate 2G and 3G Roaming Network Sunsetting
- Table 1.1: Juniper Research Competitor Leaderboard: Vendors & Product Portfolio (1 of 2)
- Table 1.2: Juniper Research Competitor Leaderboard: Vendors & Product Portfolio (2 of 2)
- Figure 1.3: Juniper Research Competitor Leaderboard: Mobile Roaming
- Table 1.4: Juniper Research Competitor Leaderboard: Vendors
- Table 1.5: Juniper Research Competitor Leaderboard Heatmap: Mobile Roaming Vendors (1 of 2)
- Table 1.6: Juniper Research Competitor Leaderboard Heatmap: Mobile Roaming Vendors (2 of 2)
2. Vendor Profiles
- 2.1. Mobile Roaming Vendor Profiles
- 2.1.1. A1 Telekom Austria Group
- i. Corporate Information
- Figure 2.1: A1 Group Select Financial Information, 2021-2023
- ii. Geographical Spread
- iii. Key Clients & Strategic Partnerships
- iv. High-level View of Offerings
- v. Juniper Research's View: Key Strengths & Strategic Opportunities
- i. Corporate Information
- 2.1.2. Amplitiv
- i. Corporate Information
- ii. Geographical Spread
- iii. Key Clients & Strategic Partnerships
- iv. High-level View of Offerings
- v. Juniper Research's View: Key Strengths & Strategic Opportunities
- 2.1.3. BICS
- i. Corporate Information
- Table 2.2: BICS' Select Financial Information (Euro-m), 2022 & 2023
- ii. Geographical Spread
- iii. Key Clients & Strategic Partnerships
- iv. High-level View of Offerings
- v. Juniper Research's View: Key Strengths & Strategic Opportunities
- i. Corporate Information
- 2.1.4. BroadForward
- i. Corporate Information
- ii. Geographical Spread
- iii. Key Clients & Strategic Partnerships
- iv. High-level View of Offerings
- Figure 2.3: BroadForward's SEPP
- v. Juniper Research's View: Key Strengths & Strategic Opportunities
- 2.1.5. Cellusys
- i. Corporate Information
- Figure 2.4: Cellusys Portfolio
- ii. Geographical Spread
- iii. Key Clients & Strategic Partnerships
- iv. High-level View of Offerings
- Figure 2.5: Cellusys Roaming Platform
- v. Juniper Research's View: Key Strengths & Strategic Opportunities
- i. Corporate Information
- 2.1.6. Comfone
- i. Corporate Information
- ii. Geographical Spread
- iii. Key Clients & Strategic Partnerships
- iv. High-level View of Offerings
- Figure 2.6: Comfone's Portfolio
- v. Juniper Research's View: Key Strengths & Strategic Opportunities
- 2.1.7. CSG
- i. Corporate Information
- Table 2.7: CSG's Select Financial Information ($m), 2021-2023
- Table 2.8: CSG's Acquisitions
- ii. Geographical Spread
- iii. Key Clients & Strategic Partnerships
- iv. High-level View of Offerings
- v. Juniper Research's View: Key Strengths & Strategic Opportunities
- i. Corporate Information
- 2.1.8. Deutsche Telekom Global Carrier
- i. Corporate Information
- ii. Geographical Spread
- iii. Key Clients & Strategic Partnerships
- iv. High-level View of Offerings
- v. Juniper Research's View: Key Strengths & Strategic Opportunities
- 2.1.9. Etisalat
- i. Corporate Information
- ii. Geographical Spread
- iii. Key Clients & Strategic Partnerships
- iv. High-level View of Offerings
- v. Juniper Research's View: Key Strengths & Strategic Opportunities
- 2.1.10. iBASIS
- i. Corporate Information
- ii. Geographical Spread
- Figure 2.9: iBASIS' Global Customer Connections
- iii. Key Clients & Strategic Partnerships
- iv. High-level View of Offerings
- v. Juniper Research's View: Key Strengths & Strategic Opportunities
- 2.1.11. Mobileum
- i. Corporate Information
- ii. Geographical Spread
- iii. Key Clients & Strategic Partnerships
- iv. High-level View of Offerings
- Figure 2.10: Mobileum's Roaming Management Suite
- v. Juniper Research's View: Key Strengths & Strategic Opportunities
- 2.1.12. Nextgen Clearing
- i. Corporate Information
- ii. Geographical Spread
- iii. Key Clients & Strategic Partnerships
- iv. High-level View of Offerings
- v. Juniper Research's View: Key Strengths & Strategic Opportunities
- 2.1.13. Orange Wholesale
- i. Corporate Information
- ii. Geographical Spread
- Figure 2.11: Orange Operations Map
- iii. Key Clients & Strategic Partnerships
- iv. High-level View of Offerings
- v. Juniper Research's View: Key Strengths & Strategic Opportunities
- 2.1.14. Roamability
- i. Corporate Information
- ii. Geographical Spread
- iii. Key Clients & Strategic Partnerships
- iv. High-level View of Offerings
- Figure 2.12: Roamability's DMI Solution Snapshot
- v. Juniper Research's View: Key Strengths & Strategic Opportunities
- 2.1.15. Syniverse
- i. Corporate Information
- ii. Geographical Spread
- iii. Key Clients & Strategic Partnerships
- iv. High-level View of Offering
- Figure 2.13: Syniverse's Clearing and Settlement Services
- v. Juniper Research's View: Key Strengths & Strategic Opportunities
- 2.1.16. Tata Communications
- i. Corporate Information
- ii. Geographical Spread
- iii. Key Clients & Strategic Partnerships
- iv. High-level View of Offerings
- v. Juniper Research's View: Key Strengths & Strategic Opportunities
- 2.1.17. Tele2 International Wholesale
- i. Corporate Information
- ii. Geographical Spread
- iii. Key Clients & Strategic Partnerships
- iv. High-level View of Offerings
- v. Juniper Research's View: Key Strengths & Strategic Opportunities
- 2.1.18. Telefonica Global Solutions
- i. Corporate Information
- Figure 2.14: Telefonica's Select Financial Information (Euro-m), 2020-2022
- ii. Geographical Spread
- iii. Key Clients & Strategic Partnerships
- iv. High-level View of Offerings
- Figure 2.15: Telefonica's 5G Roaming Suite
- v. Juniper Research's View: Key Strengths & Strategic Opportunities
- i. Corporate Information
- 2.1.19. Telenor Linx
- i. Corporate Information
- ii. Geographical Spread
- iii. Key Clients & Strategic Partnerships
- iv. High-level View of Offerings
- v. Juniper Research's View: Key Strengths & Strategic Opportunities
- 2.1.20. Telna
- i. Corporate Information
- ii. Geographical Spread
- iii. Key Clients & Strategic Partnerships
- iv. High-level View of Offerings
- v. Juniper Research's View: Key Strengths & Strategic Opportunities
- 2.1.21. TNS
- i. Corporate Information
- ii. Geographical Spread
- iii. Key Clients & Strategic Partnerships
- iv. High-level View of Offerings
- v. Juniper Research's View: Key Strengths & Strategic Opportunities
- 2.1.22. TOMIA
- i. Corporate Information
- ii. Geographical Spread
- iii. Key Clients & Strategic Partnerships
- iv. High-level View of Offerings
- v. Juniper Research's View: Key Strengths & Strategic Opportunities
- 2.1.23. Vodafone Roaming Services
- i. Corporate Information
- ii. Geographical Spread
- iii. Key Clients & Strategic Partnerships
- iv. High-level View of Offerings
- Table 2.16: Vodafone's Global Signalling & IPX Connectivity
- v. Juniper Research's View: Key Strengths & Strategic Opportunities
- 2.1.1. A1 Telekom Austria Group
- 2.2. Juniper Research Leaderboard Methodology
- 2.3. Limitations & Interpretations
- Table 2.17: Juniper Research Competitor Leaderboard Scoring Criteria: Mobile Roaming Vendors
Data & Forecasting
1. Market Forecast & Key Takeaways
- 1.1. Introduction to Mobile Roaming Forecasts
- Figure 1.1: Total Outbound Travellers (m), Split by 8 Key Regions, 2024-2029
- 1.1.1. Total Inbound Roaming Connections
- Figure & Table 1.2: Total Inbound Roaming Connections (m), Split by 8 Key Regions, 2024-2029
- 1.1.2. Total Inbound Roaming Revenue
- Figure & Table 1.3: Total Inbound Roaming Revenue ($m), Split by 8 Key Regions, 2024-2029
- Table 1.4: Total Inbound Roaming Revenue ($m), Split by Consumer and IoT, 2024-2029
- 1.1.3. Total Outbound Roaming Subscribers
- Figure & Table 1.5: Total Outbound Roaming Subscribers (m), Split by 8 Key Regions, 2024-2029
- 1.1.4. Total Outbound Retail Roaming Revenue
- Figure & Table 1.6: Total Outbound Retail Roaming Revenue ($m), Split by 8 Key Regions, 2024-2029
2. Wholesale Roaming Consumer Voice, SMS and Data Forecasts
- 2.1. Wholesale Roaming Consumer Voice, SMS and Data Usage
- Figure 2.1: Total Wholesale Roaming Revenue ($m), Split by SMS, Voice and Data Roaming, 2024
- 2.1.1. Data Roaming Forecast Methodology
- 2.1.2. Voice Roaming Forecast Methodology
- 2.1.3. SMS Roaming Forecast Methodology
- Figure 2.2: Consumer Wholesale Roaming Forecast Methodology
- 2.1.4. Total Inbound Mobile Subscribers
- Figure & Table 2.3: Total Inbound Mobile Subscribers (m), Split by 8 Key Regions, 2024-2029
- 2.1.5. Inbound Roaming Subscribers: SMS Revenue
- Figure & Table 2.4: Total Inbound SMS Roaming Revenue ($m), Split by 8 Key Regions, 2024-2029
- 2.1.6. Inbound Roaming Subscribers: Voice Revenue
- Figure & Table 2.5: Total Inbound Voice Roaming Revenue ($m), Split by 8 Key Regions, 2024-2029
- 2.1.7. Inbound Roaming Subscribers: Data Revenue
- Figure & Table 2.6: Total Inbound Data Roaming Revenue ($m), Split by 8 Key Regions, 2024-2029
3. IoT Wholesale Roaming
- 3.1. Wholesale Roaming - IoT Devices and Sensors
- Figure 3.1: Total Cellular IoT Connections (m), Split by 8 Key Regions, 2024-2029
- 3.1.1. Forecast Methodology & Assumptions
- Figure 3.2: IoT Wholesale Roaming Forecast Methodology
- 3.1.2. Total Inbound Roaming IoT Connections
- Figure & Table 3.3: Total Inbound Roaming Cellular IoT Connections (m), Split 8 Key Regions, 2024-2029
- 3.1.3. Total IoT Wholesale Roaming Revenue
- Figure & Table 3.4: Total Inbound Data Roaming Revenue from Cellular IoT Connections ($m), Split by 8 Key Regions, 2024-2029
4. Retail Voice, SMS and Data Roaming Forecasts
- 4.1. Introduction to Voice, SMS and Data Retail Roaming Forecasts
- Figure 4.1: Total Retail Roaming Revenue ($m), Split by Data, Voice, and SMS, 2024
- 4.1.1. Data Roaming Forecast Methodology
- 4.1.2. Voice Roaming Forecast Methodology
- 4.1.3. SMS Roaming Forecast Methodology
- Figure 4.2: Retail Roaming (Data, SMS, and Voice) Forecast Methodology
- 4.1.4. Outbound SMS Roaming Revenue
- Figure & Table 4.3: Total Outbound SMS Roaming Revenue ($m), Split by 8 Key Regions, 2024-2029
- 4.1.5. Outbound Voice Roaming Revenue
- Figure & Table 4.4: Total Outbound Voice Roaming Revenue ($m), Split by 8 Key Regions, 2024-2029
- 4.1.6. Outbound Data Roaming Revenue
- Figure & Table 4.5: Total Outbound Data Roaming Revenue ($m), Split by 8 Key Regions, 2024-2029
5. 4G Retail Roaming
- 5.1. 4G Roaming Forecast Methodology
- 5.1.1. Forecast Methodology & Assumptions
- Figure 5.1: 4G Retail Roaming Forecast Methodology
- 5.1.2. Total Outbound 4G Roaming Subscribers
- Figure & Table 5.2: Total Outbound 4G Roaming Subscribers (m), Split by 8 Key Regions, 2024-2029
- 5.1.3. Total Outbound 4G Voice, SMS & Data Roaming Revenue
- Figure & Table 5.3: Total Outbound 4G Voice, SMS & Data Roaming Revenue ($m), Split by 8 Key Regions, 2024-2029
- 5.1.1. Forecast Methodology & Assumptions
6. 5G Retail Roaming
- 6.1. 5G Roaming Forecast Methodology
- 6.1.1. Forecast Methodology & Assumptions
- Figure 6.1: 5G Retail Roaming Forecast Methodology
- 6.1.2. Total Outbound 5G Roaming Subscribers
- Figure & Table 6.2: Total Outbound 5G Roaming Subscribers (m), Split by 8 Key Regions, 2024-2029
- 6.1.3. Total Outbound 5G Voice, SMS & Data Roaming Revenue
- Figure & Table 6.3: Total Outbound 5G Voice, SMS & Data Roaming Revenue ($m), Split by 8 Key Regions, 2024-2029
- 6.1.1. Forecast Methodology & Assumptions
7. Consumer Devices
- 7.1. Consumer Device Forecast Methodology
- 7.1.1. Forecast Methodology & Assumptions
- Figure 7.1: Consumer Device Forecast Methodology
- 7.1.2. Total Roaming Revenue from Roaming Devices
- Figure & Table 7.2: Total Roaming Revenue from Roaming Devices ($m), Split by 8 Key Regions, 2024-2029
- 7.1.1. Forecast Methodology & Assumptions
8. Cruise Roaming
- 8.1. Cruise Roaming Forecast & Methodology
- 8.1.1. Forecast Methodology & Assumptions
- Figure 8.1: Cruise Roaming Forecast Methodology
- 8.1.2. Total Cruise Roaming Revenue
- Figure & Table 8.2: Total Cruise Roaming Revenue ($m), Split by 8 Key Regions, 2024-2029
- 8.1.1. Forecast Methodology & Assumptions
- 発行日
- 発行
- Juniper Research Ltd
- ページ情報
- 英文
- 納期
- 即日から翌営業日


