|
|
市場調査レポート
商品コード
1581326
資産追跡の世界市場:2024-2029年Global Asset Tracking Market: 2024-2029 |
||||||
|
|||||||
|
|||||||

| 資産追跡の世界市場:2024-2029年 |
|
出版日: 2024年10月29日
発行: Juniper Research Ltd
ページ情報: 英文
納期: 即日から翌営業日
|

全表示
- 概要
- 目次
| 主要統計 | |
|---|---|
| 2024年に追跡される総資産 | 137億米ドル |
| 2029年に追跡される総資産 | 423億米ドル |
| 市場成長率 (2024~2029年) | 208% |
| 予測期間 | 2024~2029年 |
当調査レポートでは、資産追跡の市場を詳細に分析し、市場開発の主な促進要因に焦点を当て、ベンダーがこの市場成長を最大限に活用できるよう戦略的提言を提供しています。また、資産追跡技術や、企業やより広い市場における資産追跡の利点を評価しています。さらに、医療、輸送、製造、食品など、資産追跡デバイスとソフトウェアを利用する主要産業を探るセグメント分析も含まれています。加えて、本調査では、資産追跡市場の主要企業15社の概要を提供し、Juniper Researchの競合リーダーボードにより、ベンダーの競合上の位置付けを分析しています。
このスイートには、市場規模を測定し、60カ国の主要予測データを提供する資料と、資産追跡市場の主要動向、課題、利害関係者への提言に関する完全な評価を提供する戦略・動向レポートの両方が含まれています。本レポートは、資産追跡ベンダーが今後の戦略を策定する上で、この進化する市場を包括的に理解する上で不可欠なツールとなります。
主な特徴
- 重要ポイント・戦略的提言:資産追跡市場の主要な調査結果を包括的に分析し、資産追跡プラットフォームのステークホルダーに戦略的な提言を提供します。
- 市場動向・促進要因:資産追跡システムのアクセシビリティ、コスト削減、効率の最適化、無駄な人員の削減、重要資産の損失や損傷などの主要課題と主要促進要因を含む、資産追跡市場の主要動向についての洞察を掲載しています。
- ベンチマークとなる業界予測:資産追跡市場の概要には、さまざまな資産チャネルソリューション (ソフトウェアとRFIDハードウェア) の総支出額、資産を追跡する企業数、追跡される資産の総数などの世界の予測が含まれています。
- Juniper Researchの競合リーダーボード:資産管理ソフトウェア、資産ライフサイクル、リアルタイムで位置追跡サービスなどを提供する企業を含む、資産追跡を提供する主要ベンダー15社の製品とポジショニング、能力・キャパシティ評価などを掲載しています。
市場データ・予測
本調査スイートには、46の表と21,000以上のデータポイントを含む予測データ一式へのアクセスが含まれています。
この調査スイートには以下の指標が含まれています:
- 資産追跡ソリューションを利用する企業の総数
- 追跡対象資産の総数
- 資産追跡ソリューションの総支出額
指標は以下の主要チャネルについて提供されています:
- 資産追跡ソフトウェア
- 資産追跡ハードウェア
Juniper Researchのインタラクティブ予測 (Excel) には、次の機能があります:
- 統計分析:データ期間中のすべての地域と国について表示され、ユーザーは特定のメトリクスを検索できます。グラフは簡単に変更でき、クリップボードにエクスポートできます。
- 国別データツール:予測期間中のすべての地域と国の指標を見ることができます。検索バーで表示される指標を絞り込むことができます。
- 国別比較ツール:国を選択して比較することができます。このツールには、グラフをエクスポートする機能が含まれています。
- What-if分析:5つのインタラクティブなシナリオを通じて、ユーザーは予測の前提条件と比較することができます。
サンプルビュー
市場動向・予測PDFレポート:
目次
第1章 重要ポイント・戦略的推奨事項
- 資産追跡の重要ポイント
- 資産追跡プロバイダー向けの戦略的推奨事項
第2章 現状と今後の市場見通し
- 資産追跡:イントロダクション
- 促進要因
- 消費者の信頼
- 時間節約の可能性
- 損失と損害率の削減
- レポートレイアウトを最適化する
- 可視性の向上と利用の改善
- 資産追跡におけるIoTの活用
- IoT資産追跡の仕組み
- 資産追跡に関わる技術
- 資産追跡ハードウェア
- 技術の発展
- GPSデバイス
- RFID
- Bluetooth
- LoRa
- Wi-Fi
- 超広帯域
- セルラートラッキングと5G
- QRコード
- 資産追跡ソフトウェアの技術
- AI
- エッジコンピューティング
- クラウドとオンプレミス
- ブロックチェーン
- 資産追跡の利点
- 業務効率の向上
- 資産損失と運用コストの削減別節約
- 資産の可視性の向上
第3章 セグメント分析
- イントロダクション
- 運輸・物流
- 鉄道輸送・物流
- 道路貨物輸送
- 海上輸送
- 航空
- 医療
- 医療機器の交換費用
- 患者の待ち時間の増加
- 製造
- WIP追跡
- ツール追跡
- 重機
- 廃棄物の削減
- 原材料
- 完成品
- 食品・飲料
- 業務効率
- コスト削減
- 安全性と品質管理
- 規制遵守
- ROIの向上
第4章 Juniper Researchによる資産追跡の競合リーダーボード
- ベンダープロファイル
- Actsoft
- ASAP Systems
- Asset Panda
- AT&T
- CalAmp
- Fleet Complete
- GigaTrak
- IBM
- Mojix
- OnAsset
- Oracle
- Telit
- TomTom
- Topcon
- Verizon Connect
- 評価手法
- 制限と解釈
第5章 市場予測
- 市場予測の概要
- 追跡対象資産の総数
- 資産追跡ソリューションを使用している企業の総数
- 資産追跡ソリューションへの年間総支出
- 資産追跡ソフトウェア
- 資産追跡ソフトウェアへの総支出
- 資産追跡ハードウェア
- 導入されたRFIDタグの総数
- 資産追跡RFIDハードウェアへの総支出
| KEY STATISTICS | |
|---|---|
| Total assets tracked in 2024: | 13.7bn |
| Total assets tracked in 2029: | 42.3bn |
| 2024 to 2029 market growth: | 208% |
| Forecast period: | 2024-2029 |
Overview
Our "Asset Tracking" research suite provides an in-depth analysis of the asset tracking market; addressing the major drivers of this developing market, and offering strategic recommendations so that vendors can best capitalise on this market growth. It assesses asset tracking technology and the benefits of asset tracking for businesses and the wider market. Additionally, a segment analysis exploring the leading industries utilising asset tracking devices and software, including healthcare, transportation, manufacturing, and food, is included. The research provides an overview of 15 major players within the asset tracking market, and positions vendors as Established Leaders, Leading Challengers, or Disruptors & Challenges via the Juniper Research Competitor Leaderboard. It also provides data and forecasts for the total number of businesses using asset tracking solutions, including analysis of market size by region and a split between asset tracking software and RFID (Radio-Frequency Identification) hardware solutions.
The suite includes both a data deliverable, sizing the market and providing key forecast data across 60 countries, and a strategy and trends report, delivering a complete assessment of the key trends, challenges and recommendations for stakeholders within the asset tracking market. Together, they provide an essential tool for a comprehensive understanding of this evolving market; enabling asset tracking vendors to shape their future strategy.
Key Features
- Key Takeaways & Strategic Recommendations: Comprehensive analysis of the key findings for the asset tracking market, accompanied by strategic recommendations for stakeholders from asset tracking platforms.
- Market Dynamics: Insights into key trends within the asset tracking market, including key market drivers featuring the accessibility and cost savings of asset tracking systems, and the necessity to optimise efficiency and reduce wasted manpower, and tackle issues such as loss and damage to critical assets in real time.
- Benchmark Industry Forecasts: The overview of the asset tracking market includes global forecasts for total spend across the different asset channel solutions (software and RFID hardware), as well as the number of businesses tracking assets, and total number of assets being tracked.
- Juniper Research Competitor Leaderboard: Key player product and positioning, and capability and capacity assessment for 15 vendors offering asset tracking, including companies offering asset management software, asset lifecycle and location tracking services in real time, and more. This assessment is conducted via the Juniper Research Competitor Leaderboard:
- Actsoft
- ASAP Systems
- Asset Panda
- AT&T
- CalAmp
- Fleet Complete
- GigaTrak
- IBM
- Mojix
- OnAsset
- Oracle
- Telit
- TomTom
- Topcon
- Verizon Connect
Market Data & Forecasts
The market-leading research suite for the Asset Tracking market includes access to the full set of forecast data, with 46 tables and over 21,000 datapoints.
Metrics in the research suite include:
- Total Number of Businesses Using Asset Tracking Solutions
- Total Number of Assets being Tracked
- Total Spend on Asset Tracking Solutions
Metrics are provided for the following key channels:
- Asset Tracking Software
- Asset Tracking Hardware
Juniper Research Interactive Forecast Excel contains the following functionality:
- Statistics Analysis: Users benefit from the ability to search for specific metrics; displayed for all regions and countries across the data period. Graphs are easily modified and can be exported to the clipboard.
- Country Data Tool: This tool lets users look at metrics for all regions and countries in the forecast period. Users can refine the metrics displayed via a search bar.
- Country Comparison Tool: Users can select and compare countries. The ability to export graphs is included in this tool.
- What-if Analysis: Here, users can compare forecast metrics against their own assumptions, via five interactive scenarios.
SAMPLE VIEW
Market Trends & Forecasts PDF Report:
A comprehensive analysis of the current market landscape, alongside strategic recommendations and a walk-through of the forecasts.
Table of Contents
1. Key Takeaways & Strategic Recommendations
- 1.1. Key Takeaways for Asset Tracking
- 1.2. Strategic Recommendations for Asset Tracking Providers
2. Current Status and Future Market Outlook
- 2.1. Introduction to Asset Tracking
- 2.1.1. Asset Tracking vs Inventory Tracking
- 2.2. Asset Tracking Drivers
- 2.2.1. Consumer Trust
- 2.2.2. Time Saving Potential
- 2.2.3. Reduce Loss and Damage Rates
- 2.2.4. Optimise Layouts for Reporting
- 2.2.5. Improve Visibility, Improve Use
- 2.3. IoT Use in Asset Tracking
- 2.3.1. How IoT Asset Tracking Works
- i. Tagging and Identification
- ii. Data Collection
- iii. Data Transmission
- iv. Analysis and Reporting
- v. Actions Based on Data Insights
- Figure 2.1: IoT Use in Asset Tracking
- 2.3.1. How IoT Asset Tracking Works
- 2.4. Technology Involved in Asset Tracking
- Table 2.2: Types of Technology Involved in Asset Tracking
- 2.4.1. Asset Tracking Hardware
- 2.4.2. Development in Technology
- 2.4.3. GPS Devices
- Figure 2.3: Infographic on GPS Devices Connections in Fleet Tracking Systems
- 2.4.4. RFID
- i. Passive Tag
- ii. Active Tag
- iii. Current RFID Developments
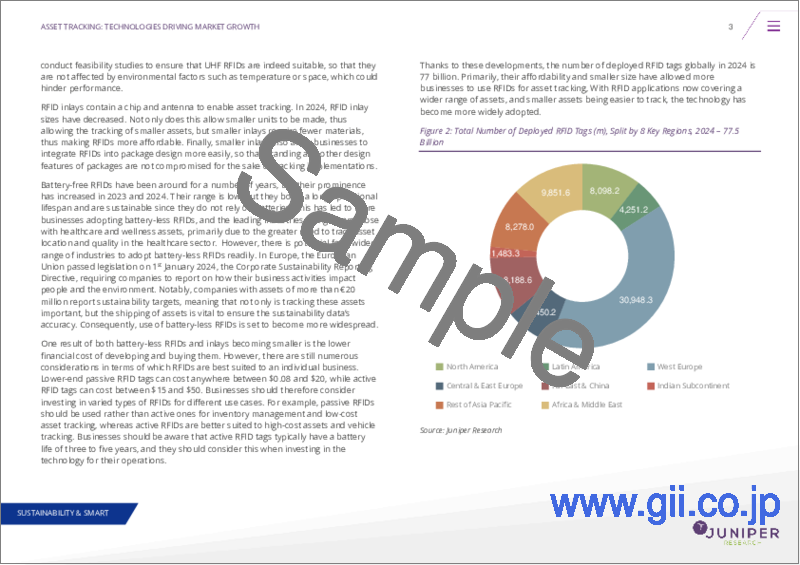
- Figure 2.4: Total Number of Deployed RFID Tags (m), Split by 8 Key Regions, 2024
- 2.4.5. Bluetooth
- 2.4.6. LoRa
- 2.4.7. Wi-Fi
- 2.4.8. Ultra-wideband
- 2.4.9. Cellular Tracking & 5G
- Table 2.5: 5G Technical Capabilities for Tracking
- 2.4.10. QR Codes
- 2.5. Technologies in Asset Tracking Software
- 2.5.1. Artificial Intelligence
- 2.5.2. Edge Computing
- 2.5.3. On-cloud and On-premise
- 2.5.4. Blockchain
- 2.6. Benefits of Asset Tracking
- 2.6.1. Improve Operational Efficiencies
- 2.6.2. Savings from Reduced Asset Loss and Operational Costs
- 2.6.3. Enhanced Visibility of Assets
3. Segment Analysis
- 3.1. Introduction
- 3.2. Transportation and Logistics
- 3.2.1. Railway Transportation and Logistics
- 3.2.2. Road Freight
- 3.2.3. Sea Freight
- 3.3. Aviation
- 3.4. Healthcare
- 3.4.1. Cost of Replacing Medical Equipment
- 3.4.2. Increase in Patient Waiting Time
- 3.5. Manufacturing
- i. WIP Tracking
- ii. Tool Tracking
- iii. Heavy Equipment
- iv. Waste Reduction
- v. Raw Materials
- vi. Finished Goods
- 3.6. Food and Beverages
- i. Operational Efficiency
- ii. Cost Savings
- iii. Safety and Quality Control
- iv. Regulatory Compliance
- v. Enhanced ROI
4. Juniper Research Asset Tracking Competitor Leaderboard
- Table 4.1: Juniper Research Competitor Leaderboard: Asset Tracking Vendors Included & Product Portfolio
- Figure 4.2: Juniper Research Leaderboard: Asset Tracking
- Table 4.3: Juniper Research Leaderboard: Asset Tracking Vendors & Positioning
- Table 4.4: Juniper Research Leaderboard Heatmap: Asset Tracking Vendors
- 4.1. Vendor Profiles
- 4.1.1. Actsoft
- i. Corporate
- ii. Geographical Spread
- iii. Key Clients & Strategic Partnerships
- iv. High-level View of Offerings
- v. Juniper Research's View: Key Strengths & Strategic Opportunities
- 4.1.2. ASAP Systems
- i. Corporate
- ii. Geographical Spread
- iii. Key Clients & Strategic Partnerships
- iv. High-level View of Offerings
- v. Juniper Research's View: Key Strengths & Strategic Opportunities
- 4.1.3. Asset Panda
- i. Corporate
- ii. Geographical Spread
- iii. Key Clients & Strategic Partnerships
- iv. High-level View of Offerings
- v. Juniper Research's View: Key Strengths & Strategic Opportunities
- 4.1.4. AT&T
- i. Corporate
- ii. Geographical Spread
- iii. Key Clients & Strategic Partnerships
- iv. High-level View of Offerings
- v. Juniper Research's View: Key Strengths & Strategic Opportunities
- 4.1.5. CalAmp
- i. Corporate
- Figure 4.5: CalAmp's Financial Snapshot ($ thousands), FY 2022-2023
- ii. Geographical Spread
- iii. Key Clients & Strategic Partnerships
- iv. High-level View of Offerings
- v. Juniper Research's View: Key Strengths & Strategic Opportunities
- i. Corporate
- 4.1.6. Fleet Complete
- i. Corporate
- ii. Geographical Spread
- iii. Key Clients & Strategic Partnerships
- iv. High-level View of Offerings
- v. Juniper Research's View: Key Strengths & Strategic Opportunities
- 4.1.7. GigaTrak
- i. Corporate
- ii. Geographical Spread
- iii. Key Clients & Strategic Partnerships
- iv. High-level View of Offerings
- v. Juniper Research's View: Key Strengths & Strategic Opportunities
- 4.1.8. IBM
- i. Corporate
- ii. Geographical Spread
- iii. Key Clients & Strategic Partnerships
- iv. High-level View of Offerings
- v. Juniper Research's View: Key Strengths & Strategic Opportunities
- 4.1.9. Mojix
- i. Corporate
- ii. Geographical Spread
- iii. Key Clients & Strategic Partnerships
- iv. High-level View of Offerings
- v. Juniper Research's View: Key Strengths & Strategic Opportunities
- 4.1.10. OnAsset
- i. Corporate
- ii. Geographical Spread
- iii. Key Clients & Strategic Partnerships
- iv. High-level View of Offerings
- v. Juniper Research's View: Key Strengths & Strategic Opportunities
- 4.1.11. Oracle
- i. Corporate
- ii. Geographical Spread
- iii. Key Clients & Strategic Partnerships
- iv. High-level View of Offerings
- v. Juniper Research's View: Key Strengths & Strategic Opportunities
- 4.1.12. Telit
- i. Corporate
- ii. Geographical Spread
- iii. Key Clients & Strategic Partnerships
- iv. High-level View of Offerings
- v. Juniper Research's View: Key Strengths & Strategic Opportunities
- 4.1.13. TomTom
- i. Corporate
- ii. Geographical Spread
- iii. Key Clients & Strategic Partnerships
- iv. High-level View of Offerings
- v. Juniper Research's View: Key Strengths & Strategic Opportunities
- 4.1.14. Topcon
- i. Corporate
- ii. Geographical Spread
- iii. Key Clients & Strategic Partnerships
- iv. High-level View of Offerings
- v. Juniper Research's View: Key Strengths & Strategic Opportunities
- 4.1.15. Verizon Connect
- i. Corporate
- ii. Geographical Spread
- iii. Key Clients & Strategic Partnerships
- iv. High-level View of Offerings
- v. Juniper Research's View: Key Strengths & Strategic Opportunities
- 4.1.1. Actsoft
- 4.2. Juniper Research Leaderboard Assessment Methodology
- 4.3. Limitations & Interpretations
- Table 4.6: Juniper Research Competitor Leaderboard Scoring Criteria: Asset Tracking
5. Market Forecasts
- 5.1. Introduction
- 5.1.1. Asset Tracking Forecast Methodology
- Figure 5.1: Asset Tracking Methodology
- 5.1.1. Asset Tracking Forecast Methodology
- 5.2. Market Forecasts Summary
- 5.2.1. Total Number of Assets Tracked
- Figure & Table 5.2: Total Number of Assets Tracked through Asset Tracking Services (m), Split by 8 Key Regions, 2024-2029
- 5.2.2. Total Number of Businesses Using Asset Tracking Solutions
- Figure & Table 5.3: Total Number of Businesses using Asset Tracking Solutions (m), Split by 8 Key Regions, 2024-2029
- Table 5.4: Total Number of Businesses Using Asset Tracking Solutions (m), Split by Business Size, 2024-2029
- 5.2.3. Total Annual Spend on Asset Tracking Solutions
- Figure & Table 5.5: Total Annual Spend on Asset Tracking ($m), Split by 8 Key Regions 2024-2029
- 5.2.1. Total Number of Assets Tracked
- 5.3. Asset Tracking Software
- 5.3.1. Total Spend on Asset Tracking Software
- Figure & Table 5.6: Total Spend on Asset Tracking Software ($m), Split by 8 Key Regions 2024-2029
- 5.3.1. Total Spend on Asset Tracking Software
- 5.4. Asset Tracking Hardware
- 5.4.1. Total Number of Deployed RFID Tags
- Figure & Table 5.7: Total Number of Deployed RFID Tags (m), Split by 8 Key Regions, 2024-2029
- 5.4.2. Total Spend on Asset Tracking RFID Hardware
- Figure 5.8: Total Spend on Asset Tracking RFID Hardware ($m), Split by 8 Key Regions, 2024-2029
- 5.4.1. Total Number of Deployed RFID Tags

